UV vs. DAD Detectors: A Comprehensive Guide for Pharmaceutical and Biomedical Analysis
This article provides a definitive guide for researchers and drug development professionals on choosing between Ultraviolet (UV) and Diode Array Detection (DAD) in liquid chromatography.
UV vs. DAD Detectors: A Comprehensive Guide for Pharmaceutical and Biomedical Analysis
Abstract
This article provides a definitive guide for researchers and drug development professionals on choosing between Ultraviolet (UV) and Diode Array Detection (DAD) in liquid chromatography. We explore the foundational principles, operational mechanisms, and distinct advantages of each detector. The content covers practical methodological applications, troubleshooting for common issues, and a comparative validation against other techniques like LC-MS. By synthesizing core intents from foundational knowledge to advanced application, this guide empowers scientists to optimize their analytical methods for accuracy, reliability, and regulatory compliance in pharmaceutical and clinical research.
Core Principles: How UV and DAD Detectors Work
Ultraviolet-Visible (UV-Vis) spectroscopy is a foundational analytical technique that measures the absorption of light in the ultraviolet and visible regions of the electromagnetic spectrum (typically 190-900 nm) [1] [2]. Its implementation in analytical chemistry has evolved from instruments that measure absorbance at a single wavelength to sophisticated detectors that capture full spectral data in real-time [1]. In the context of drug development and scientific research, understanding the distinction between a traditional UV spectrophotometer and a Diode Array Detector (DAD), also known as a Photodiode Array (PDA), is critical for selecting the appropriate analytical tool [1] [3]. While both operate on the principle of the Beer-Lambert law, which relates the absorption of light to the properties of the material through which the light is passing, their instrumental designs, data output, and applications differ significantly [2]. This guide provides an in-depth technical comparison of these two core technologies, framing them within the broader paradigm shift from targeted single-wavelength analysis to comprehensive full-spectrum characterization.
Core Principles and Instrumentation
The Fundamental Operating Principles
At its core, any UV-Vis detection technique involves passing a beam of light through a sample and measuring the intensity of the light that emerges. The absorbance (A) is calculated as A = logâ‚â‚€(Iâ‚€/I), where Iâ‚€ is the intensity of the incident light, and I is the intensity of the transmitted light [2]. This absorbance is directly proportional to the concentration of the analyte, the path length of the light through the sample, and a substance-specific parameter known as its molar absorptivity, as described by the Beer-Lambert law [2]. The key differentiator between technologies lies in how they generate, select, and detect specific wavelengths of light to probe the sample.
UV Spectrophotometer Optical Design
A traditional UV or UV-Vis spectrophotometer is a single-wavelength or variable-wavelength detector. Its optical system is designed to select a specific wavelength before the light interacts with the sample [3].
- Light Source: Often uses two lamps: a Deuterium (Dâ‚‚) lamp for the UV range (190-380 nm) and a Tungsten (W) lamp for the visible range (380-900 nm) [2] [3].
- Wavelength Selection: A key component is the monochromator, typically a diffraction grating that disperses the broad-spectrum light. The angle of this grating is physically adjusted to allow only a narrow band of desired wavelengths to pass through the exit slit and onto the sample flow cell [2] [3].
- Detection: The selected monochromatic light passes through the flow cell, and a single photoreceptor (such as a photomultiplier tube) measures its intensity after the sample [3]. A reference beam is often used to compensate for source intensity fluctuations [2].
This sequential design means that to collect data at multiple wavelengths, the monochromator must be scanned over time, which is a limitation for capturing rapid spectral changes in a chromatographic peak.
Diode Array Detector (DAD) Optical Design
A Diode Array Detector (DAD) revolutionizes this process by being a multi-wavelength detector that captures the entire spectrum simultaneously [1] [4] [3].
- Light Source: Employs the same or similar broad-spectrum lamps (Dâ‚‚ and W) as the UV spectrophotometer [4].
- Optical Path: The fundamental difference is the order of components. In a DAD, the full-spectrum "white" light is first passed directly through the sample flow cell [3].
- Dispersion and Detection: The transmitted light, which now contains the absorption signature of the sample, is then focused onto a diffraction grating. This grating disperses the light, spreading it across an array of hundreds of photodiodes (e.g., 1024 diodes), each corresponding to a specific, narrow wavelength band [3]. All diodes measure their respective light intensities at the same time, capturing a complete UV-Vis spectrum in a single, rapid measurement (often in milliseconds) [1].
This parallel detection scheme is the source of the DAD's significant advantages for qualitative analysis and peak purity assessment.
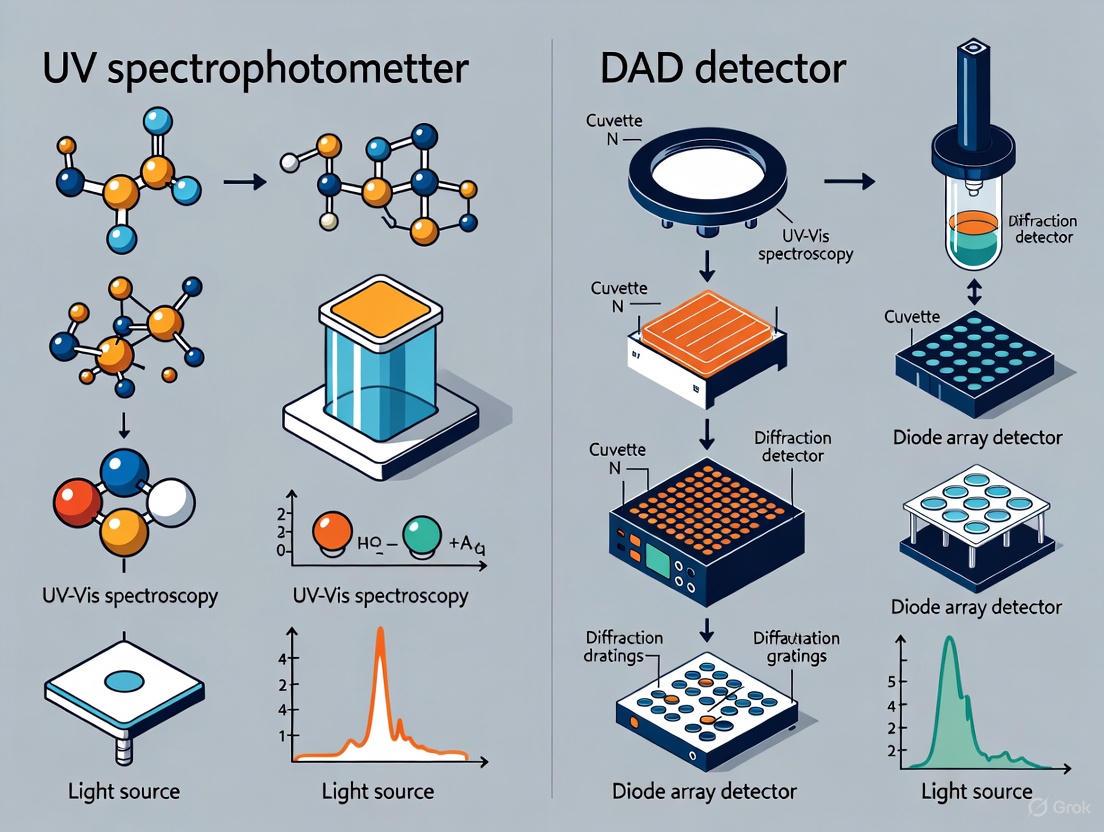
The following diagram illustrates the fundamental difference in the optical paths of these two systems:
Technical Comparison and Data Output
The differing instrumental designs of UV and DAD detectors lead to a direct impact on the nature and richness of the data they produce, which in turn dictates their suitability for various analytical tasks.
Table 1: Technical Comparison of UV Spectrophotometer vs. Diode Array Detector
| Feature | UV Spectrophotometer | Diode Array Detector (DAD) |
|---|---|---|
| Detection Type | Single- or Variable-Wavelength | Simultaneous Multi-Wavelength |
| Wavelength Selection | Before the sample (Pre-dispersion) | After the sample (Post-dispersion) [3] |
| Spectral Acquisition | Sequential; requires scanning over time | Parallel; full spectrum captured instantaneously [1] |
| Primary Data Output | Chromatogram (Absorbance vs. Time at λ) | 3D Data Cube (Absorbance vs. Time vs. Wavelength) [1] |
| Typical Sensitivity | Generally higher for a single wavelength due to greater light throughput | Slightly lower per wavelength due to light dispersion, but modern designs have minimized this gap [3] |
| Peak Purity Assessment | Not possible directly | Yes, by comparing spectra across a peak [1] |
| Spectral Fidelity | Excellent for a single wavelength | High, but can be more susceptible to lamp fluctuations as reference beam is not always used [3] |
The data output is a key differentiator. A UV detector produces a chromatogram—a two-dimensional plot of absorbance (at one or a few pre-selected wavelengths) over time. In contrast, a DAD generates a rich, three-dimensional data set, which can be visualized as a contour plot (wavelength vs. time, with absorbance as contour lines) or as a series of spectra extracted at any point in time [1] [3]. This allows a scientist to retrospectively interrogate the data, examining the spectrum of any peak without having to re-run the sample.
Experimental Protocols and Applications
Protocol 1: Quantification of a Target Analyte using a UV Detector
This protocol is ideal for routine, high-sensitivity quantification of known compounds where spectral confirmation is not required, such as in quality control (QC) labs [5].
Method Development and Calibration:
- Based on prior knowledge or a spectral scan, determine the wavelength of maximum absorption (λ_max) for the target analyte.
- Prepare a series of standard solutions of known concentration.
- Set the detector wavelength to the chosen λ_max.
- Inject the standards to create a calibration curve of peak area versus concentration.
Sample Analysis:
- Maintain the same wavelength and chromatographic conditions.
- Inject the unknown sample.
- Identify the target analyte based on its retention time.
- Quantify the analyte by comparing its peak area to the calibration curve.
Key Advantage for this Application: The UV detector often provides superior signal-to-noise for quantification at a single wavelength, making it highly sensitive and well-suited for regulated QC environments where methods are fixed [5].
Protocol 2: Method Development and Peak Purity Analysis using a DAD
This protocol leverages the full power of DAD for methods where identification and purity are as important as quantification, such as in pharmaceutical impurity profiling or natural product analysis [1].
Data Acquisition:
- The DAD is set to acquire data across a full wavelength range (e.g., 200-400 nm) throughout the chromatographic run.
- No pre-selection of a single wavelength is necessary.
Post-Run Interrogation and Method Optimization:
- Extract the chromatogram at the wavelength that provides the best signal-to-noise and separation for each compound.
- For any peak of interest, extract its UV-Vis absorption spectrum from the apex and compare it to a library spectrum for compound identity confirmation—a second factor in addition to retention time [1].
Peak Purity Assessment:
- This is a critical application for DAD. The software compares spectra from the upslope, apex, and downslope of the chromatographic peak.
- A high degree of spectral similarity indicates a pure peak. Spectral differences suggest a co-eluting impurity [1].
- Advanced software functions, like Shimadzu's i-PDeA, can even deconvolute and quantify the individual components in an unresolved peak using their unique spectral profiles [1].
Key Advantage for this Application: The DAD provides a second dimension of identification (spectral match) and is indispensable for revealing hidden impurities that a single-wavelength detector would miss.
Table 2: Essential Research Reagent Solutions for UV-Vis HPLC Analysis
| Reagent/Material | Function and Critical Specifications |
|---|---|
| HPLC-Grade Solvents | Serve as the mobile phase; low UV absorbance to minimize baseline noise and drift. Must be spectrally pure for the wavelength range used. |
| Deuterium (Dâ‚‚) Lamp | Light source for the UV range (190-380 nm). A consumable item with a finite lifetime that requires periodic replacement [4]. |
| Tungsten (W) Lamp | Light source for the visible range (380-900 nm). Also a consumable item subject to replacement [4]. |
| Quartz Flow Cell | Container for the sample in the detector path. Quartz is essential for UV transparency; standard glass or plastic cuvettes absorb UV light [2]. |
| Standard Reference Materials | High-purity compounds used for instrument calibration, method validation, and creation of spectral libraries for compound identification. |
The following workflow diagram summarizes the decision-making process for selecting and applying these two detection technologies:
Market Trends and Future Outlook
The landscape of UV-Vis detection is dynamic, with several key trends shaping its future, particularly for diode array technology.
- Growth and Drivers: The global UV-Vis spectrometer market is projected for steady growth, driven by R&D investments in life sciences and pharmaceuticals, as well as environmental monitoring needs [6]. The North American DAD market, for instance, is seeing strong growth due to demand for precision and reliability in pharmaceutical and biotechnology applications [7].
- Technological Integration: A major trend is the integration of Artificial Intelligence (AI) and machine learning with DAD systems. AI algorithms are being developed to predict spectral shifts, automate compound identification, and enhance peak deconvolution, thereby reducing the analytical burden on scientists [7].
- Miniaturization and Portability: The development of compact, portable, and even handheld UV-Vis instruments is expanding the technique's application into field analysis, point-of-care testing, and on-site quality control [6].
- Sustainability: Manufacturers are increasingly focusing on developing energy-efficient instruments and promoting workflows that reduce solvent consumption, aligning with broader green chemistry initiatives [7].
- Hybrid and Advanced Detection: There is a growing trend towards hybrid technologies that combine DAD with other detection methods like mass spectrometry or fluorescence, offering multiparametric data from a single analytical run [7].
The choice between a traditional UV spectrophotometer and a Diode Array Detector is not a matter of one being universally superior, but rather of selecting the right tool for the analytical question at hand. The UV detector excels in applications where high-sensitivity quantification of known compounds at a fixed wavelength is the primary goal, offering performance and often a lower cost for these specific tasks. In contrast, the DAD provides unparalleled qualitative power and analytical confidence through its ability to capture full spectral data for every data point in a chromatogram. This makes it indispensable for method development, peak purity analysis, and the identification of unknown compounds. Within the context of modern drug development, where regulatory demands for comprehensive analytical characterization are ever-increasing, the DAD has become a cornerstone technology. The ongoing trends of automation, AI integration, and miniaturization promise to further enhance the capabilities of both technologies, solidifying their critical role in the scientist's toolkit for years to come.
Ultraviolet-visible (UV-Vis) spectroscopy is a fundamental analytical technique that measures the absorption of discrete wavelengths of UV or visible light by a sample in comparison to a reference or blank sample [2]. This property is influenced by the sample composition, providing critical information about the identity and concentration of chromophoric compounds present. The technique operates on the principle that electrons in different bonding environments within a substance require specific amounts of energy to promote to higher energy states, which we detect as absorption at characteristic wavelengths [2]. The diode array detector (DAD), also known as a photodiode array detector (PDA), represents a significant evolution in detection technology, enabling simultaneous monitoring of multiple wavelengths across the UV-Vis spectrum (typically 190-900 nm) and providing three-dimensional data (absorbance, wavelength, and time) that offers distinct advantages for compound identification, peak purity assessment, and method development [4] [1] [8].
Table 1: Fundamental Comparison of UV-Vis Spectrophotometer and DAD Configurations
| Feature | Traditional UV-Vis Spectrophotometer | Diode Array Detector (DAD) |
|---|---|---|
| Optical Path Design | Single-beam or double-beam; pre-sample dispersion | Reversed optics; post-sample dispersion |
| Wavelength Selection | Monochromator with moving grating before sample | Fixed polychromator with diode array after sample |
| Wavelength Range | Typically 190-900 nm (depends on source and detector) | Typically 190-900 nm (depends on source and detector) |
| Data Acquisition | Sequential wavelength measurement | Simultaneous full-spectrum acquisition |
| Spectral Resolution | Controlled by slit width and grating | Determined by diode density and slit width |
| Primary Applications | Single wavelength quantification, kinetic studies | Multi-analyte detection, peak purity, method development |
Core Optical Components and System Architecture
The optical systems of both conventional UV-Vis spectrophotometers and diode array detectors are engineered around several critical components that work in concert to generate reliable spectroscopic data.
UV-Vis instrumentation typically employs two complementary light sources to cover the full spectral range. A deuterium (D₂) lamp provides continuous emission in the ultraviolet region (190–400 nm), while a tungsten-halogen (W) lamp covers the visible to near-infrared region (330–900 nm) [4] [9]. In some systems, a single xenon lamp may be used for both regions, though this approach is associated with higher costs and potential stability issues [2]. The transition between lamps typically occurs between 300-350 nm where their light emission characteristics are similar, ensuring a smooth switchover [2]. The light sources are designed for stability and longevity, as fluctuations in intensity directly impact measurement accuracy.
Wavelength Selection and Dispersion Systems
This represents the most significant architectural difference between conventional UV-Vis and DAD systems:
In a traditional UV-Vis spectrophotometer, a monochromator is placed before the sample. This system consists of an entrance slit, a diffraction grating that can be rotated to select specific wavelengths, and an exit slit [9] [8]. The grating's groove frequency (typically 300-2000 grooves per mm, with 1200 being common) determines the optical resolution, with higher frequencies providing better resolution but narrower usable wavelength ranges [2]. The selected monochromatic light then passes through the sample, and the transmitted intensity is measured by a single detector.
In a diode array detector, a "reversed optics" configuration is employed where polychromatic (full spectrum) light first passes through the sample, and is then dispersed onto a diode array [10] [8]. The dispersion is typically achieved by a fixed holographic grating that spreads the transmitted light across an array of hundreds of individual photodiodes (typically 512 or 1024 elements), each measuring a specific, narrow wavelength band simultaneously [10] [8].
Flow Cells and Sample Compartments
The flow cell is a critical component where light-sample interaction occurs. It is a transparent, flow-through device with quartz windows at each end that define the optical pathlength [8]. Standard HPLC flow cells have volumes of 8-18 μL with a 10 mm pathlength, while UHPLC applications require smaller cells (0.5-1 μL) to maintain chromatographic resolution [8]. Quartz is essential for UV applications as it is transparent to most UV light, unlike glass or plastic which absorb significantly in the UV region [2]. Proper flow cell design minimizes band broadening while maximizing signal intensity through an optimized pathlength.
Detection Systems
Detection systems convert transmitted light intensity into electronic signals for data processing. Photomultiplier tubes (PMTs) are commonly used in conventional spectrophotometers due to their high sensitivity and wide dynamic range; they operate via the photoelectric effect, where photons incident on a photocathode eject electrons that are then amplified through a series of dynodes [2] [9]. Silicon photodiodes are semiconductor devices that generate a photocurrent when photons with energy greater than the bandgap of silicon are absorbed, creating electron-hole pairs that are separated by an internal electric field [9]. In DAD systems, arrays of hundreds of individual photodiodes (512 or 1024 elements are common) enable simultaneous detection across the entire spectral range, with each diode dedicated to a specific narrow wavelength band [10] [8].
Diagram 1: Optical pathway comparison between traditional UV-Vis spectrophotometers and diode array detectors
Data Acquisition Pathways and Signal Processing
The data acquisition pathways differ fundamentally between conventional UV-Vis and DAD systems, leading to their distinct capabilities and applications.
Signal Formation and Processing
In both systems, absorbance (A) is calculated according to the Beer-Lambert law as A = -logâ‚â‚€(I/Iâ‚€) = εlc, where Iâ‚€ is the incident light intensity, I is the transmitted light intensity, ε is the molar absorptivity, l is the path length, and c is the concentration [2] [8]. In conventional UV-Vis systems, this calculation occurs sequentially for each wavelength as the monochromator rotates through its programmed range. In DAD systems, the calculation occurs simultaneously across all wavelengths, with the diode array capturing complete spectral data at each time point during chromatographic separation [4] [1].
Critical Detector Parameters and Their Optimization
Several operational parameters must be optimized to ensure data quality:
- Spectral Bandwidth: The range of wavelengths measured around a target wavelength, typically 1-8 nm. Narrower bandwidths provide better spectral resolution but reduce light throughput and signal-to-noise ratio [9] [10].
- Acquisition Rate: For chromatography applications, the data acquisition rate must be sufficient to capture peak profiles accurately, with a minimum of 20-25 data points across a chromatographic peak for reliable quantification [10].
- Reference Wavelength: Selective use of a reference wavelength (typically 60 nm higher than where analyte absorbance falls to 1 mAU) with a wide bandwidth (typically 100 nm) can compensate for baseline drift caused by refractive index changes during gradient elution [10].
Table 2: Performance Characteristics and Optimization Parameters
| Parameter | Impact on Data Quality | Quantitative Optimization | Qualitative Optimization |
|---|---|---|---|
| Spectral Bandwidth | Narrow: better resolution; Wide: better S/N | 4-8 nm (prioritize signal-to-noise) | 1-4 nm (prioritize spectral features) |
| Slit Width | Controls light throughput to detector | 4-8 nm (better S/N) | 1-4 nm (better resolution) |
| Data Acquisition Rate | Point density across chromatographic peaks | 2-5 Hz (standard HPLC) | ≥10 Hz (fast UHPLC) |
| Response Time | Signal smoothing vs. peak distortion | 1-2 s (reduced noise) | 0.1-0.5 s (preserved peak shape) |
Experimental Protocols for System Characterization
Wavelength Accuracy Verification
Purpose: To validate the accuracy of wavelength selection and detection across the operational range. Materials: Holmium oxide or didymium (neodymium) glass filters, certified reference materials with known absorption maxima. Methodology:
- Place reference filter in sample compartment or flow cell
- Perform full spectrum scan from 190-900 nm with 1 nm bandwidth
- Record observed absorption maxima
- Compare measured peak wavelengths against certified values Acceptance Criteria: Deviation ≤ ±1 nm from certified values across UV-Vis range [9] [8]
Photometric Accuracy and Linearity Assessment
Purpose: To verify absorbance measurement accuracy across the dynamic range. Materials: Neutral density filters or certified potassium dichromate solutions in perchloric acid. Methodology:
- Measure absorbance of certified standards at multiple wavelengths
- Prepare serial dilutions covering absorbance range 0.1-3.0 AU
- Plot measured vs. certified absorbance values
- Calculate correlation coefficient and residual values Acceptance Criteria: Correlation coefficient R² ≥ 0.999, residuals within ±0.01 AU [8]
Stray Light Determination
Purpose: To quantify stray light that affects photometric linearity at high absorbances. Materials: High-purity potassium chloride or sodium iodide solutions. Methodology:
- Prepare 10-12% (w/v) KCl or NaI solution
- Measure absorbance at 198 nm (KCl) or 220 nm (NaI) with water reference
- Calculate percent transmittance: %T = 100 × 10^(-A) Acceptance Criteria: Stray light ≤ 0.1% T at specified wavelength [9]
Spectral Resolution Validation
Purpose: To confirm the instrument's ability to distinguish closely spaced spectral features. Materials: Toluene in hexane (0.02% v/v) or mercury vapor lamp. Methodology:
- Record toluene spectrum in hexane from 250-300 nm
- Measure peak-to-valley ratio between 269 nm and 266 nm
- Calculate resolution factor: R = A₂₆₉ / A₂₆₆ Acceptance Criteria: Resolution factor R ≥ 1.5 [9] [10]
Advanced DAD Applications in Pharmaceutical Analysis
The unique capabilities of diode array detectors enable several advanced applications that are particularly valuable in pharmaceutical research and quality control.
Peak Purity Assessment
Peak purity analysis compares UV spectra at multiple points across a chromatographic peak (up-slope, apex, and down-slope) to detect potential co-elution of impurities [1] [8]. Software algorithms calculate a peak purity index or purity angle by normalizing and comparing these spectra; a purity index close to 1.000 or a small purity angle indicates a homogeneous peak, while significant spectral differences suggest the presence of multiple compounds [1] [8]. This application is particularly valuable for stability-indicating methods and impurity profiling required by ICH guidelines [8] [11].
Spectral Deconvolution of Co-eluting Compounds
Advanced DAD software can mathematically resolve co-eluting compounds based on their spectral differences, even when chromatographic resolution is incomplete [1]. Techniques such as Shimadzu's i-PDeA function utilize the complete spectral information collected during the chromatographic run to deconvolute overlapping peaks, providing quantitative data for individual components without complete physical separation [1]. This capability is particularly useful for analyzing complex mixtures where complete chromatographic separation may be time-consuming or difficult to achieve.
Method Development and Transfer
During method development, the continuous spectral data collected by DAD systems facilitates optimal wavelength selection for quantification by identifying the wavelength of maximum absorbance (λmax) for each compound while minimizing interference from other sample components or mobile phase absorption [10]. This comprehensive data collection also simplifies method transfer between different laboratories or instruments by providing spectral evidence of equivalent separation and detection [12] [11].
Research Reagent Solutions and Essential Materials
Table 3: Essential Research Materials for UV-Vis and DAD Applications
| Material/Component | Function/Application | Technical Specifications |
|---|---|---|
| Deuterium (Dâ‚‚) Lamp | UV light source (190-400 nm) | Continuous spectrum, ~1000 hour lifespan [4] [8] |
| Tungsten-Halogen (W) Lamp | Visible light source (330-900 nm) | Continuous spectrum, ~2000 hour lifespan [4] [8] |
| Quartz Flow Cells | Sample containment for UV detection | 10 mm pathlength, 1-18 μL volume, high-pressure compatible [8] |
| Holmium Oxide Filters | Wavelength accuracy verification | Certified NIST-traceable absorption maxima [9] |
| Potassium Dichromate | Photometric linearity standards | High purity, certified for absorbance accuracy [8] |
| Mobile Phase Solvents | HPLC chromatographic separation | HPLC grade, low UV cutoff (e.g., ACN: 190 nm, MeOH: 205 nm) [10] |
The optical systems of both traditional UV-Vis spectrophotometers and diode array detectors incorporate sophisticated component architectures designed to measure light absorption by chemical compounds. While both technologies share fundamental principles based on the Beer-Lambert law, their optical pathways differ significantly—with conventional instruments employing pre-sample dispersion and sequential wavelength measurement, while DAD systems utilize post-sample dispersion and simultaneous full-spectrum acquisition. This fundamental architectural difference enables the DAD's advanced applications in peak purity assessment, spectral deconvolution, and multi-wavelength method development, making it particularly valuable for pharmaceutical analysis where reliability, peak identification, and impurity detection are paramount. Despite the growing prominence of mass spectrometric detection, UV-Vis and DAD technologies remain firmly established in research and quality control laboratories due to their robustness, precision, and fitness-for-purpose in quantifying chromophoric compounds.
The Beer-Lambert Law (also known as Beer's Law) is a fundamental relationship in absorption spectroscopy that connects the attenuation of light to the properties of a substance through which it passes [13]. This principle serves as the cornerstone for quantitative analysis across numerous scientific disciplines, enabling researchers to determine the concentration of analytes in solution by measuring how much light they absorb at specific wavelengths [14]. In the context of pharmaceutical research and drug development, where precise quantification of compounds is paramount, understanding and applying this law is essential for techniques ranging from simple concentration verification to sophisticated chromatographic analysis.
When electromagnetic radiation passes through a medium containing absorbing molecules, photons of specific energies may be absorbed, promoting electrons to higher energy states [15]. The likelihood of absorption at a given wavelength depends on the molecular structure and electronic configuration of the analyte, creating unique spectral fingerprints that can be exploited for both identification and quantification purposes [16]. The Beer-Lambert Law provides the mathematical framework to translate these absorption measurements into meaningful chemical information, forming the theoretical basis for ultraviolet-visible (UV-Vis) spectroscopy and absorbance detection in high-performance liquid chromatography (HPLC) [15].
Theoretical Foundation
Fundamental Concepts and Mathematical Formulation
The Beer-Lambert Law establishes a linear relationship between the absorbance of light by a substance and three key parameters: the concentration of the absorbing species, the path length the light travels through the material, and the intrinsic ability of the substance to absorb light at a specific wavelength [14]. This relationship is mathematically expressed as:
A = εlc
Where:
- A is the absorbance (a dimensionless quantity) [13] [14]
- ε is the molar absorptivity or molar extinction coefficient (typically in L·molâ»Â¹Â·cmâ»Â¹) [14]
- l is the path length of light through the sample (typically in cm) [14]
- c is the concentration of the absorbing species (typically in mol/L) [14]
Absorbance is derived from experimental measurements of light intensity and has a logarithmic relationship with transmittance [13]:
A = logâ‚â‚€(Iâ‚€/I) = -logâ‚â‚€(T)
Where:
- Iâ‚€ is the intensity of incident light [13] [14]
- I is the intensity of transmitted light [13] [14]
- T is the transmittance (I/Iâ‚€) [13]
This logarithmic relationship means that each unit increase in absorbance corresponds to a tenfold decrease in transmittance [13]. The following table illustrates this fundamental relationship between absorbance and transmittance:
Table 1: Relationship Between Absorbance and Transmittance Values
| Absorbance | Transmittance |
|---|---|
| 0 | 100% |
| 1 | 10% |
| 2 | 1% |
| 3 | 0.1% |
| 4 | 0.01% |
| 5 | 0.001% |
Requirements for Applicability
For the Beer-Lambert Law to apply accurately, several conditions must be met [17]:
- Monochromatic Light: The incident light should consist of a single wavelength [17]
- Homogeneous Solution: The sample must be uniform and non-scattering [17]
- Dilute Solutions: Absorbing particles must not interact with each other [17]
- No Secondary Processes: The measurement should not be affected by fluorescence or photochemical reactions [17]
- Optimal Absorbance Range: For best results, absorbance values should typically fall between 0.2 and 0.8 [17]
Deviations from these conditions can lead to nonlinear relationships between absorbance and concentration, limiting the law's accuracy for quantitative applications [17].
Instrumentation for UV-Vis Absorbance Detection
Fundamental Spectrophotometer Design
UV-Vis spectrophotometers operate on the principle of measuring the difference in light intensity before and after it passes through a sample [16]. All instruments in this category share several core components, regardless of their specific configuration:
- Light Source: Typically deuterium (Dâ‚‚) lamps for UV regions (190-380 nm) and tungsten (W) or halogen lamps for visible regions (380-900 nm) [3] [16]
- Wavelength Selection System: Monochromators (using diffraction gratings) or filters to select specific wavelengths [16]
- Sample Holder: Cuvettes with defined path lengths (typically 1 cm) or flow cells for HPLC [13] [15]
- Detector: Photodiodes, photomultiplier tubes (PMTs), or diode arrays to convert light intensity to electrical signals [16]
The following diagram illustrates the fundamental workflow of a UV-Vis absorbance measurement system:
Single vs. Double Beam Spectrophotometers
UV-Vis spectrophotometers are primarily categorized into single beam and double beam configurations, each with distinct advantages and limitations [18] [19].
Table 2: Comparison of Single Beam and Double Beam Spectrophotometers
| Feature | Single Beam | Double Beam |
|---|---|---|
| Light Path | Single beam passes through sample only [18] | Beam split into reference and sample paths [18] |
| Measurement Approach | Sequential measurement of blank and sample [19] | Simultaneous measurement of sample and reference [18] |
| Accuracy | Moderate, susceptible to source fluctuations [18] | High, compensates for source instability [18] [19] |
| Stability | Prone to drift due to environment and lamp aging [18] | Excellent stability through real-time compensation [18] [19] |
| Measurement Speed | Slower due to manual switching between blank and sample [19] | Faster with real-time reference correction [19] |
| Cost | Lower initial and maintenance costs [18] [19] | Higher due to complex optical design [18] [19] |
| Optimal Applications | Education, routine analyses, cost-sensitive environments [18] [19] | Research, pharmaceutical QC, high-precision applications [18] [19] |
The double beam design provides significantly better stability and accuracy because any fluctuations in the light source equally affect both beams and are therefore canceled out in the absorbance calculation [18]. This ratiometric measurement makes double beam instruments particularly valuable for applications requiring high precision and long-term stability [18] [19].
Detector Technologies in HPLC
UV-Vis Detectors
UV-Vis detectors are among the most common detection systems used in High-Performance Liquid Chromatography (HPLC) [15]. These detectors employ a deuterium lamp as a light source for ultraviolet wavelengths, with some models incorporating an additional tungsten lamp for visible light detection [3]. The operational principle involves shining monochromatic light through the HPLC flow cell onto a photodetector, which converts light intensity into an electrical signal corresponding to absorbance [15].
In a conventional UV-Vis detector, light from the source is directed onto a diffraction grating, which disperses it into different wavelengths [3]. The grating angle is adjusted to select a specific wavelength that then passes through the flow cell containing the separated analytes [3]. A key feature of many modern UV detectors is the ability to monitor reference light divided from the light source before it reaches the flow cell, enabling compensation for lamp intensity fluctuations [3]. This design is particularly suited for targeted analyses where specific compounds are monitored at predetermined wavelengths, such as natural product analyses commonly performed at 220 nm and 274 nm [1].
Photodiode Array (PDA) Detectors
Photodiode Array (PDA) detectors, also known as Diode Array Detectors (DAD), represent a significant advancement in absorbance detection technology [1] [15]. Unlike conventional UV-Vis detectors that monitor one or a few discrete wavelengths, PDA detectors capture the entire spectrum simultaneously [1] [3]. This comprehensive wavelength coverage is achieved through a reversed optical path: light from the source passes directly through the flow cell, and the transmitted light is then dispersed by a diffraction grating onto an array of photodiodes (typically 1024 elements) [15] [3].
This fundamental difference in optical design enables several advanced capabilities:
- Full Spectrum Acquisition: Continuous monitoring of all wavelengths in real-time [1]
- Spectral Confirmation: Compound identification through spectral matching in addition to retention time [1] [15]
- Peak Purity Assessment: Detection of co-eluting compounds by comparing spectra across a chromatographic peak [1]
- Method Development: Selection of optimal wavelengths for routine analysis based on full spectral data [1]
The following diagram illustrates the key differences in optical layout between conventional UV and PDA detectors:
Comparative Analysis: UV vs. PDA Detectors
Table 3: Performance Comparison Between UV and PDA Detectors for HPLC
| Characteristic | UV Detector | PDA Detector |
|---|---|---|
| Wavelength Selection | Before flow cell [15] [3] | After flow cell [15] [3] |
| Spectral Data | Single or few discrete wavelengths [1] | Full UV-Vis spectrum continuously [1] [15] |
| Qualitative Power | Limited to retention time matching [1] | Spectral confirmation plus retention time [1] [15] |
| Peak Purity Assessment | Not possible without additional runs | Built-in capability through spectral comparison [1] |
| Sensitivity | Generally higher light throughput [3] | Potentially higher noise due to light splitting [3] |
| Method Development | Requires prior knowledge of optimal wavelengths | Enables post-run wavelength optimization [1] |
| Data Complexity | Simple chromatograms at fixed wavelengths | Three-dimensional data (time, absorbance, wavelength) [15] |
| Cost Considerations | Lower initial investment | Higher cost due to complex optics and electronics [3] |
For pharmaceutical applications, PDA detectors offer significant advantages in method development and validation through their peak purity assessment capabilities [1]. By comparing UV spectra at different points across a chromatographic peak (up-slope, apex, and down-slope), analysts can detect potential co-elution that might otherwise go unnoticed with single-wavelength detection [1]. This functionality is particularly valuable in regulated environments where demonstrating method specificity is required for compliance [1].
Practical Applications and Experimental Approaches
Quantitative Analysis Using Calibration Curves
The primary application of the Beer-Lambert Law in pharmaceutical research is quantitative analysis through calibration curves [13]. This approach involves measuring absorbance values of standard solutions with known concentrations, then fitting these data points to establish a linear relationship between absorbance and concentration [13] [16].
A typical experimental protocol for creating a calibration curve includes:
- Preparation of Standard Solutions: Create a series of solutions with known concentrations spanning the expected range of the unknown samples [13] [16]
- Blank Measurement: Use the solvent or buffer without analyte as a reference to establish baseline absorbance [16]
- Absorbance Measurement: Record absorbance values for each standard at the optimal wavelength (typically λmax) [16]
- Data Analysis: Plot absorbance versus concentration and perform linear regression to obtain the equation of the calibration curve [13] [16]
- Sample Measurement: Measure unknown samples under identical conditions and calculate concentration using the calibration equation [13]
The following diagram illustrates this quantitative workflow:
Advanced Measurement Techniques
Beyond simple single-wavelength measurements, several advanced applications of the Beer-Lambert Law provide solutions for challenging analytical scenarios:
Dual Wavelength Measurements: Used when interfering substances contribute to absorbance at the primary analytical wavelength. The absorbance is calculated as A = Aλ₠- k×Aλ₂, where k is a correction factor [17]. This approach is commonly employed in environmental analysis, such as total nitrogen determination where A₂₂₀ is corrected using A₂₇₅ to account for dissolved organic matter interference [17]
Multi-Component Analysis: When multiple absorbing species with overlapping spectra are present in a sample, concentrations can be determined by measuring absorbance at multiple wavelengths and solving simultaneous equations based on each component's unique molar absorptivity at these wavelengths [16]
Peak Deconvolution: Advanced PDA software can mathematically resolve co-eluting peaks in chromatography based on their spectral differences, enabling quantification without physical separation [1]. The i-PDeA (intelligent Peak Deconvolution and Analysis) function exemplifies this approach, using both chromatographic and spectral information for virtual separation of unresolved compounds [1]
The Scientist's Toolkit: Essential Research Reagents and Materials
Table 4: Key Research Reagent Solutions for UV-Vis Absorbance Experiments
| Item | Function/Purpose | Application Notes |
|---|---|---|
| Reference Materials | Calibration and verification of instrument performance [20] | NIST standards (mAbs, tryptophan, uracil) for compliance with USP/Ph. Eur. guidelines [20] |
| Optical Cuvettes | Sample containment with defined path length [16] | Quartz for UV work (transparent down to 190 nm); plastic/disposable for visible range only [16] |
| Mobile Phase Solvents | HPLC eluent for compound separation [15] | High purity, UV-transparent solvents (e.g., HPLC-grade acetonitrile, methanol, water) [15] |
| Standard Compounds | Calibration curve establishment [13] [16] | High-purity analytes for generating quantitative reference data [13] |
| Buffer Systems | Maintain consistent pH environment [16] | Phosphate, Tris, or other buffers with minimal UV absorbance in region of interest [16] |
| (6S)-CP-470711 | (6S)-CP-470711, MF:C18H26N6O2, MW:358.4 g/mol | Chemical Reagent |
| VH032-thiol-C6-NH2 | VH032-thiol-C6-NH2, MF:C29H43N5O4S2, MW:589.8 g/mol | Chemical Reagent |
Critical Considerations for Pharmaceutical Applications
Method Validation and Regulatory Compliance
In pharmaceutical development, UV-Vis methods must undergo rigorous validation to ensure reliability, accuracy, and precision [20]. Key validation parameters include:
Linearity and Range: Demonstration that the response is proportional to analyte concentration across the specified range [13] [17]. The Beer-Lambert Law typically holds best in the absorbance range of 0.2-0.8, though modern instruments may extend this dynamic range [17] [20]
Accuracy: The closeness of measured values to the true value, often established using certified reference materials [20]. Instruments like the Lunatic and Stunner systems demonstrate accuracy within 2% of NIST reference values, complying with USP and European Pharmacopoeia guidelines [20]
Precision: The degree of agreement among repeated measurements, expressed as relative standard deviation [20]. High-quality systems can achieve precision within 1% [20]
Specificity: The ability to measure the analyte accurately in the presence of potential interferents [1]. PDA detectors excel in this area through peak purity assessment and spectral confirmation [1]
Microvolume and High-Throughput Applications
Modern drug discovery increasingly requires analytical techniques that conserve precious samples while providing high-throughput capabilities [20]. Advanced UV-Vis systems address these needs through innovative designs:
Fixed Pathlength Microvolume Cells: Systems like the Lunatic and Stunner implement fixed pathlength microcuvettes (0.1 mm and 0.7 mm) in a 96-well plate format, enabling analysis of 2 μL samples with a 10-minute throughput for 96 samples [20]
Extended Dynamic Range: The combination of different pathlengths allows concentration measurement across a wider range without dilution - from 0.02-200 mg/mL for IgG and 1.5-13,750 ng/μL for nucleic acids [20]
Evaporation Prevention: Microfluidic circuits prevent sample evaporation and cross-contamination, critical for accurate quantitative results [20]
The Beer-Lambert Law remains the fundamental principle underpinning UV-Vis absorbance detection, providing the theoretical foundation for quantitative analysis in pharmaceutical research and drug development. While the basic relationship A = εlc has remained unchanged, its implementation through increasingly sophisticated instrumentation continues to evolve. From traditional single beam spectrophotometers to advanced PDA detectors with peak deconvolution capabilities, the application of this law has expanded to address complex analytical challenges.
For researchers and drug development professionals, selecting the appropriate detection technology involves careful consideration of analytical requirements, regulatory needs, and practical constraints. UV detectors offer simplicity and sensitivity for targeted analyses, while PDA systems provide comprehensive spectral data for method development and validation. As pharmaceutical analyses demand higher throughput, minimal sample consumption, and greater reliability, innovations in absorbance detection continue to enhance our ability to apply this fundamental principle to the challenging problems of modern drug development.
In the realm of analytical chemistry, the detection and quantification of compounds fundamentally rely on their ability to interact with light. At the heart of this interaction is the chromophore, a functional group within a molecule responsible for its absorption of ultraviolet (UV) or visible light. Understanding chromophores and the spectral response of compounds is paramount for researchers and drug development professionals who utilize techniques like high-performance liquid chromatography (HPLC) to separate and analyze complex mixtures. The core principle governing this interaction is the Beer-Lambert Law (often simply called Beer's Law), which states that the absorbance (A) of a solution is directly proportional to the concentration (c) of the absorbing species and the pathlength (d) of the light through the solution: A = ε × c × d. The constant of proportionality, ε, is the molar absorptivity (or molar absorption coefficient), a compound-specific value that defines how strongly a chromophore absorbs light at a particular wavelength [21]. A higher molar absorptivity translates to a lower detectable concentration, making it a critical parameter for assay sensitivity.
This technical guide explores the fundamental properties that make a compound detectable by UV spectroscopy, framed within a critical comparison of two predominant detection technologies: the traditional UV-Vis Spectrophotometer (often referred to as a Variable Wavelength Detector or VWD in chromatography) and the more information-rich Diode Array Detector (DAD or PDA). The choice between these detectors represents a significant methodological decision in analytical research, balancing sensitivity, specificity, and the depth of information required for compound identification and purity assessment.
Fundamental Principles of Chromophores and UV-Vis Absorption
What is a Chromophore?
A chromophore is a region in a molecule where the energy difference between molecular orbitals falls within the range of ultraviolet or visible light. When light of a specific energy (wavelength) hits this chromophore, electrons are promoted from a ground state to an excited state, resulting in the absorption of that light. The specific wavelengths absorbed and the intensity of that absorption depend on the chemical structure and the electronic environment of the chromophore. Common chromophores in organic molecules include carbonyl groups (C=O), aromatic rings (e.g., benzene, naphthalene), azo groups (-N=N-), and sequences of conjugated double bonds [21]. The presence of these groups is a primary indicator that a compound will be amenable to UV-Vis detection.
Key Parameters in Spectral Response
The detectability of a compound is not a binary proposition but is instead governed by several key parameters derived from its UV-Vis spectrum:
- λ_max (Maximum Absorbance Wavelength): This is the wavelength at which a compound has its strongest absorption. It is a characteristic property of the chromophore and is often used for selective detection in HPLC to maximize sensitivity for a target analyte [8].
- Molar Absorbance (Molar Absorptivity or ε): This is a measure of how strongly a chromophore absorbs light at a specific wavelength, typically reported in Mâ»Â¹cmâ»Â¹. It is an intrinsic property of the molecule. A higher ε value allows for detection at lower concentrations. For example, the chromophore p-Nitroanilide (pNA) has an ε of ~9,450 Mâ»Â¹cmâ»Â¹ at 405 nm, making it a highly sensitive probe for enzyme activity assays [21].
- Spectral Bandwidth: This refers to the range of wavelengths that pass through the detector's optical system. A narrower bandwidth can provide better selectivity but may reduce light throughput and signal-to-noise ratio [8].
The following table summarizes the spectral properties of several common chromophores used in biochemical and pharmaceutical research.
Table 1: Spectral Properties of Common Chromophores in Research
| Chromophore | Detection Wavelength (λ_max) | Molar Absorption Coefficient (ε) | Primary Applications |
|---|---|---|---|
| p-Nitroanilide (pNA) | 405 - 410 nm | 9,450 Mâ»Â¹cmâ»Â¹ (405 nm) | Assays for serine and cysteine proteases [21] |
| p-Nitrophenyl (ONp) | 347 nm | 5,500 Mâ»Â¹cmâ»Â¹ | Esterase activity measurements (pH-independent) [21] |
| 2,4-Dinitrophenyl (Dnp) | 365 nm | 17,300 Mâ»Â¹cmâ»Â¹ | Peptide cleavage assays after organic extraction [21] |
| 3-(2-Furyl)acryloyl (FA) | 322 - 345 nm | 13,400 - 24,700 Mâ»Â¹cmâ»Â¹ | Continuous assays for proteases (measured by decrease in absorbance) [21] |
| Thiobenzyl Ester (SBzl) | 324 nm / 410 nm | 19,800 / 14,000 Mâ»Â¹cmâ»Â¹ | Enzyme activity via reaction with DTNB (Ellman's reagent) [21] |
A Comparative Analysis: UV Spectrophotometer vs. Diode Array Detector
Operational Principles and Optical Designs
The fundamental difference between a UV Spectrophotometer (VWD) and a Diode Array Detector (DAD) lies in the sequence of optical events: dispersion before detection for VWD versus dispersion after detection for DAD.
A Variable Wavelength Detector (VWD) uses a deuterium (and often a tungsten) lamp to generate polychromatic light. This light passes through a monochromator, typically a movable diffraction grating, which selects a specific, user-defined wavelength. This single wavelength of light then passes through the sample flow cell and onto a single photodiode, which measures its intensity [8] [15]. This design is illustrated in the diagram below.
Diagram 1: UV-VWD Optical Path
In contrast, a Diode Array Detector (DAD/PDA) exposes the sample in the flow cell to the entire spectrum of light from the source. The transmitted light is then focused onto a diffraction grating, which disperses it across an array of hundreds of photodiodes (e.g., 512 or 1024). Each diode simultaneously measures the intensity of a specific, narrow band of wavelengths [8] [15]. This allows for the continuous collection of the full spectrum of every analyte as it elutes from the column.
Diagram 2: DAD Optical Path
Comparative Advantages and Limitations in Practice
The different optical designs of VWD and DAD detectors lead to distinct advantages and limitations, which determine their suitability for various applications in drug development and research.
Table 2: Comparison of UV-VWD and DAD Detectors
| Feature | UV-Visible Detector (VWD) | Diode Array Detector (DAD/PDA) |
|---|---|---|
| Principle | Dispersion before the flow cell; sequential detection [15] | Dispersion after the flow cell; parallel detection [15] |
| Spectral Data | Measures absorbance at one or a few pre-selected wavelengths [1] | Measures the entire UV-Vis spectrum (190-800+ nm) in real-time [15] [1] |
| Sensitivity | Generally higher for a single, optimized wavelength due to greater light throughput [22] [8] | Slightly lower per wavelength but compensates with rich spectral data |
| Peak Identification | Based on retention time only [1] | Based on retention time and spectral matching [15] [1] |
| Peak Purity Assessment | Not possible, as co-eluting peaks go undetected if they absorb at the monitored wavelength | Excellent; software compares spectra across a peak to detect impurities [8] [1] |
| Method Development | Requires prior knowledge of analyte wavelengths | Ideal for unknowns; allows retrospective data analysis at different wavelengths [22] |
| Cost | Lower | Higher |
The following workflow diagram illustrates the decision-making process for selecting a detector based on analytical goals.
Diagram 3: Detector Selection Workflow
Experimental Protocols and Applications in Drug Development
Detailed Methodology: Quantitation of an Active Pharmaceutical Ingredient (API)
The following protocol, adapted from a study on the antifungal drug Posaconazole, exemplifies a standard HPLC-DAD method for API quantification in a suspension dosage form [12].
1. Objective: To develop a sensitive, selective, and validated HPLC-DAD method for the quantitation of Posaconazole in bulk powder and a commercial oral suspension.
2. Materials and Reagents:
- API Standard: Posaconazole bulk powder.
- Internal Standard (IS): Itraconazole (structurally related compound).
- Mobile Phase: HPLC-grade acetonitrile and 15 mM potassium dihydrogen orthophosphate (KHâ‚‚POâ‚„) buffer.
- Solvent: HPLC-grade methanol for sample and standard preparation.
- Equipment: HPLC system equipped with a binary pump, autosampler, thermostatted column compartment, and Diode Array Detector (DAD).
Table 3: Research Reagent Solutions for HPLC-DAD Analysis
| Reagent / Material | Function / Specification | Role in the Analysis |
|---|---|---|
| Zorbax SB-C18 Column | 4.6 x 250 mm, 5 µm particle size [12] | Stationary phase for reverse-phase separation of analytes. |
| Potassium Dihydrogen Orthophosphate | 15 mM aqueous solution, pH-adjusted [12] | Buffer component in mobile phase to control pH and improve peak shape. |
| Acetonitrile (HPLC Grade) | Organic modifier [12] | Mobile phase component to elute analytes from the C18 column. |
| Methanol (HPLC Grade) | Solvent [12] | For preparing stock and working standard solutions. |
| Diode Array Detector (DAD) | Spectral scanning from 190-800 nm [12] [15] | Detection, quantification, and spectral confirmation of Posaconazole. |
3. Chromatographic Conditions:
- Column: Zorbax SB-C18 (4.6 × 250 mm, 5 µm)
- Mobile Phase: Gradient elution from Acetonitrile:Buffer (30:70) to (80:20) over 7 minutes.
- Flow Rate: 1.5 mL/min
- Column Temperature: 25°C
- Injection Volume: 20 µL
- DAD Detection: 262 nm (quantitative wavelength), with continuous spectral acquisition from 200-400 nm for peak purity [12].
4. Sample Preparation:
- Standard Solutions: A 100 µg/mL stock solution of Posaconazole is prepared in methanol. Serial dilutions are made to prepare calibration standards ranging from 5-50 µg/mL.
- Suspension Dosage Form: 0.1 mL of the oral suspension (40 mg/mL) is diluted to 10 mL with methanol. An aliquot is centrifuged, and the supernatant is mixed with the internal standard (Itraconazole) and further diluted with methanol before injection [12].
5. Data Analysis:
- Quantification: A calibration curve of peak area (at 262 nm) versus concentration is constructed. The concentration of Posaconazole in the unknown suspension is calculated using the linear regression equation.
- Peak Purity and Identification: The UV spectrum of the Posaconazole peak in the sample is overlaid and compared with the spectrum from the standard using the DAD software. A high match (or purity index) confirms the identity and homogeneity of the peak, indicating no co-eluting impurities [12] [1].
Advanced Application: Peak Purity and Deconvolution with DAD
A powerful application of DAD is illustrated in the analysis of cannabinoids. Neutral cannabinoids (e.g., THC, CBD) and acidic cannabinoids (e.g., THCA, CBDA) have distinct UV spectral profiles due to their different chromophores. While they can be separated chromatographically, DAD provides a second dimension of confirmation. The DAD can collect the spectrum for each peak, allowing the analyst to distinguish between the neutral and acidic classes based on their characteristic λ_max and spectral shape, even without a perfect chromatographic separation [1].
Furthermore, advanced software functions like i-PDeA (intelligent Peak Deconvolution Analysis) can mathematically resolve co-eluting peaks. Since each compound has a unique UV spectrum, the detector can collect data from an unresolved chromatographic peak and, using the spectral information, deconvolute it to provide quantitative results for each individual component. This is a significant advantage over VWD, where co-elution might go entirely unnoticed or be misinterpreted as a single pure compound [1].
The detectability of a compound in UV-Vis spectroscopy is fundamentally governed by the presence of a chromophore with a sufficiently high molar absorptivity at an accessible wavelength. For researchers and drug development professionals, the choice between a UV spectrophotometer (VWD) and a Diode Array Detector (DAD) is a critical one that directly impacts the quality, reliability, and depth of analytical data. The VWD offers superior sensitivity and is a cost-effective workhorse for routine, targeted analyses where the analytes and their optimal wavelengths are well-characterized. In contrast, the DAD provides comprehensive spectral information that is indispensable for method development, peak purity analysis, and the confident identification of compounds in complex matrices. By understanding the principles of chromophores and the operational capabilities of these detectors, scientists can make informed decisions that enhance the accuracy and efficiency of their analytical methods, ultimately supporting robust drug development and quality control processes.
The evolution of ultraviolet (UV) detection systems for analytical chemistry represents a remarkable journey of technological innovation, transitioning from simple fixed-wavelength instruments to sophisticated diode array detectors capable of full-spectrum analysis. This whitepaper delineates the historical progression of UV detection technologies, examining the underlying principles, performance characteristics, and practical implications of each developmental stage. Framed within the context of distinguishing conventional UV spectrophotometers from modern diode array detectors (DAD), this analysis provides researchers, scientists, and drug development professionals with a comprehensive technical reference. The critical operational distinctions between these detection modalities are explored through detailed experimental protocols, quantitative performance comparisons, and visualizations of optical pathways, offering practitioners a scientific basis for detector selection aligned with analytical requirements in regulated and research environments.
Ultraviolet detection technology has served as a cornerstone of analytical chemistry, particularly in high performance liquid chromatography (HPLC), where it provides reliable, sensitive measurement of chromophoric compounds. The fundamental operating principle of all UV detectors relies on the Beer-Lambert Law, which establishes a linear relationship between analyte concentration and light absorption at specific wavelengths [8] [2]. This relationship enables both quantification and identification of substances based on their characteristic absorption patterns. The success of HPLC as a pervasive analytical technique in scientific discovery and quality control applications is largely attributable to the availability of sensitive and reliable UV detectors [8].
Within pharmaceutical development and quality control laboratories, UV detectors have maintained prominence despite the emergence of more sophisticated detection methods like mass spectrometry. This persistence is attributed to their exceptional reliability, ease of use, and universal response to chromophoric compounds, including most pharmaceuticals [8]. The technique's precision—typically achieving less than 0.2% relative standard deviation—makes it indispensable for regulatory testing where drug potency specifications often require demonstration of 98.0% to 102.0% purity [8]. Understanding the historical progression and technical distinctions between UV detector types is thus essential for optimal analytical method development.
Historical Progression of UV Detector Technologies
First Generation: Fixed Wavelength Detectors
The earliest UV detectors for HPLC emerged in the late 1960s and employed fixed wavelength configurations based on low-pressure mercury lamps with a strong emission line at 254 nm [8]. These pioneering instruments utilized simple cutoff filters to eliminate other high-order wavelengths from the source, providing a cost-effective but spectrally limited detection solution. Alternative wavelengths such as 280 nm or 265 nm could occasionally be accessed by adding phosphor to the source, while zinc lamps provided limited capacity for lower wavelength analyses around 214 nm [8].
The technical limitations of these early systems were significant, with reported noise specifications of approximately ±0.2 mAU—roughly 50 times less sensitive than modern detectors [8]. Despite these constraints, fixed wavelength detectors established UV detection as a viable approach for liquid chromatography and addressed many fundamental analytical needs of the period. Their simplicity and affordability contributed to early adoption of HPLC methodologies, particularly in academic and quality control environments where detection flexibility was secondary to reliability and cost considerations. Today, fixed wavelength UV detectors are found predominantly in low-cost or portable systems where analytical requirements remain specific and constrained [8].
Second Generation: Variable Wavelength Detectors
The 1980s witnessed a significant technological advancement with the introduction of variable wavelength detectors (VWD), also termed UV-visible (UV-vis) absorbance detectors [8]. These instruments represented a substantial improvement over fixed wavelength systems by incorporating a deuterium arc discharge lamp that provided continuous emission across the 190–600 nm UV-vis spectrum [8]. This expanded wavelength range enabled method development flexibility and improved analytical selectivity through wavelength optimization specific to target analytes.
The core innovation of variable wavelength detectors was the incorporation of a monochromator—an optical system consisting of an entrance slit, movable diffraction grating (or prism), and exit slit [8]. This configuration allowed users to select specific analytical wavelengths by rotating the motorized grating to direct desired wavelengths through the exit slit toward the flow cell. The transmitted light then impinged on a single photodiode that transformed light energy into electrical signals proportional to analyte concentration [8]. This design marked a significant advancement in detection flexibility, though it remained constrained to sequential wavelength monitoring rather than simultaneous multi-wavelength detection.
Table 1: Evolution of UV Detector Technologies
| Generation | Time Period | Light Source | Wavelength Selection | Key Advantages | Limitations |
|---|---|---|---|---|---|
| Fixed Wavelength | Late 1960s | Low-pressure mercury lamp (254 nm) | Cutoff filters | Simplicity, low cost, reliability | Limited wavelength options, poor sensitivity (±0.2 mAU noise) |
| Variable Wavelength (VWD) | 1980s | Deuterium lamp (190-600 nm) | Monochromator with movable grating | Wavelength flexibility, improved selectivity | Sequential wavelength measurement only |
| Diode Array (DAD/PDA) | 1990s-present | Deuterium and tungsten lamps | Fixed grating with diode array | Full spectrum acquisition, peak purity assessment | Higher cost, greater complexity |
Third Generation: Diode Array Detectors (DAD)
A paradigm shift in UV detection occurred with the commercialization of photodiode array detectors (PDA), also known as diode array detectors (DAD) [8]. The pioneering instrument in this category, the Hewlett-Packard (HP) 8450A, revolutionized the field in the early 1980s by introducing diode array technology that enabled capture of a complete spectrum in a single measurement [23]. Unlike variable wavelength systems where the grating moves to select wavelengths, diode array detectors employ a fixed diffraction grating that simultaneously disperses the entire light spectrum after it passes through the sample onto a linear array of discrete photodiodes [24].
This fundamental reversal in optical geometry—placing the wavelength dispersion element after rather than before the sample—represents the core innovation of diode array technology [24]. Each photodiode in the array corresponds to a specific nanometer region of the spectrum, typically configured with 512 or 1024 elements, enabling simultaneous monitoring of all wavelengths [8]. This design eliminates moving parts from the optical path and facilitates rapid, full-spectrum acquisition in milliseconds to seconds, depending on instrument design [24]. The technological progression continued with instruments like the HP 8453 and Agilent Cary 8454, which refined the original concept with improved resolution and sensitivity [23].
Technical Comparison: UV Spectrophotometers vs. DAD Detectors
Optical Configurations and Operating Principles
The fundamental distinction between conventional UV spectrophotometers and diode array detectors lies in their optical configurations and sequence of analytical operations. Variable wavelength detectors employ a pre-sample monochromator configuration, where light from the source passes through the monochromator to select a specific wavelength before reaching the flow cell [8]. This design necessitates sequential wavelength measurement and limits data collection to predefined wavelengths of interest.
In contrast, diode array detectors utilize a post-sample dispersion architecture where polychromatic light passes through the sample before being separated into its constituent wavelengths by a fixed grating [24]. The dispersed light then strikes a photodiode array detector, enabling simultaneous measurement of all wavelengths across the UV-vis spectrum [1]. This fundamental difference in optical geometry confers distinct advantages for applications requiring rapid spectral acquisition or retrospective data analysis.
Diagram 1: Optical configurations of VWD and DAD systems
Performance Characteristics and Analytical Capabilities
The operational differences between conventional UV and DAD detectors translate to distinct performance characteristics and analytical capabilities. While both detector types adhere to the fundamental principles of UV absorption spectroscopy, their applications diverge significantly based on their respective technical strengths.
Variable Wavelength Detectors excel in routine quantitative analyses where method parameters are well-established and target analytes are known. Their optimized single-wavelength detection provides excellent signal-to-noise ratio for quantification and can achieve noise specifications below ±1.0 × 10â»âµ AU in advanced systems [8]. This makes them ideally suited for quality control environments where reliability, cost-effectiveness, and simplicity are prioritized over spectral information.
Diode Array Detectors offer expanded analytical capabilities through full-spectrum data acquisition. Key advantages include:
Peak Purity Assessment: By comparing UV spectra across different time points of a chromatographic peak (upslope, apex, and downslope), DAD enables detection of co-eluting compounds through spectral differences [8] [1]. This capability is particularly valuable in pharmaceutical analysis for confirming analyte purity and detecting potential impurities.
Spectral Library Matching: Full UV-vis spectra serve as qualitative fingerprints for compound identification through comparison with reference standards [1]. While not as definitive as mass spectrometric identification, this provides a valuable orthogonal identification mechanism.
Post-analysis Data Interrogation: The collection of complete spectral data throughout the analysis enables retrospective method development and investigation of unexpected peaks without reinjection [1].
Multi-component Analysis: Advanced software capabilities, such as Shimadzu's i-PDeA function, leverage spectral differences to mathematically resolve co-eluting compounds through deconvolution algorithms [1].
Table 2: Analytical Capabilities Comparison Between VWD and DAD
| Analytical Parameter | Variable Wavelength Detector | Diode Array Detector |
|---|---|---|
| Wavelength Range | 190-600 nm (with deuterium lamp) | 190-900 nm (with supplemental tungsten) |
| Spectral Acquisition | Sequential single wavelengths | Simultaneous full spectrum |
| Peak Purity Assessment | Not available | Comprehensive via spectral comparison |
| Spectral Data | Limited to selected wavelengths | Complete UV-vis spectrum for all peaks |
| Method Development Flexibility | Limited; requires predefined wavelengths | Extensive; post-acquisition wavelength optimization |
| Co-elution Detection | Limited to chromatographic resolution | Spectral deconvolution capabilities |
| Quantitative Precision | <0.2% RSD [8] | <0.2% RSD [8] |
Experimental Protocols and Methodologies
Peak Purity Assessment Using Diode Array Detection
Principle: Peak purity assessment validates chromatographic peak homogeneity by comparing UV spectra acquired at different time points across the peak profile. Significant spectral variations suggest potential co-elution of impurities with the target analyte [1].
Materials:
- HPLC system equipped with diode array detector
- Suitable chromatographic column and mobile phase
- Reference standards of target analyte and potential impurities
- Data analysis software with peak purity algorithm
Methodology:
- Establish chromatographic conditions that provide baseline separation of all known related substances from the main peak.
- Configure DAD to acquire full UV spectra (typically 200-400 nm) throughout the chromatographic run with appropriate spectral resolution (1-2 nm).
- Inject sample solutions and acquire three-dimensional data (absorbance, wavelength, time).
- Using the instrument software, select multiple spectra from the target peak: typically at the upslope (10% peak height), apex (100% peak height), and downslope (10% peak height).
- Normalize the acquired spectra and apply the peak purity algorithm to calculate correlation coefficients between spectra.
- Interpret results: purity angle less than purity threshold generally indicates homogeneous peak [1].
Critical Parameters:
- Adequate signal-to-noise ratio (>100) for reliable spectral comparison
- Appropriate spectral normalization to correct for concentration effects
- Sufficient number of data points across the peak (≥20) for meaningful assessment
Wavelength Optimization for Variable Wavelength Detection
Principle: Maximizing analytical sensitivity and selectivity through systematic identification of optimal detection wavelength(s) for target analytes.
Materials:
- UV-vis spectrophotometer with scanning capability
- Standard solutions of target analytes at appropriate concentrations
- Matched quartz cuvettes or suitable solvent-matched reference
Methodology:
- Prepare standard solutions of target analytes in appropriate solvent at concentrations yielding absorbance values between 0.5-1.0 AU.
- Fill reference cell with pure solvent or blank solution.
- Scan samples across relevant UV range (typically 200-350 nm for pharmaceuticals).
- Identify wavelength of maximum absorbance (λmax) for each analyte from the absorption spectrum.
- Evaluate potential interference from matrix components or other analytes at selected wavelengths.
- For multiple analyte detection, identify wavelengths that balance sensitivity and selectivity requirements, potentially employing multiple detection wavelengths for a single run.
Critical Parameters:
- Solvent transparency at selected wavelengths
- Spectral bandwidth appropriate for application (typically 1-2 nm for quantification)
- Verification of Beer-Lambert law linearity at selected wavelength
The Scientist's Toolkit: Essential Research Reagents and Materials
Table 3: Essential Materials for UV Detection Applications
| Item | Function | Application Notes |
|---|---|---|
| Deuterium Lamp | Provides continuous UV spectrum (190-400 nm) | Typical lifetime 1000-2000 hours; replacement required when intensity drops [8] |
| Tungsten/Halogen Lamp | Extends detection to visible range (400-900 nm) | Often used complementarily with deuterium source in DAD systems [2] |
| Quartz Flow Cells | Sample containment for absorbance measurement | Standard pathlength 10 mm; UHPLC cells 0.5-1 µL volume [8] |
| Mobile Phase Filters | Removes particulate matter that causes light scattering | 0.45 µm or 0.22 µm membranes compatible with organic solvents |
| Reference Standards | Method calibration and peak identification | Certified reference materials with documented purity for quantitative work |
| Spectrophotometric Solvents | Sample dissolution and mobile phase preparation | UV-transparent solvents (ACN, MeOH, Hâ‚‚O) with minimal UV cutoff [2] |
| Flow Cell Seals | Maintains fluidic integrity of detection flow cell | Regular replacement prevents leaks and pressure fluctuations |
| Fluoflavine | Fluoflavine, MF:C14H10N4, MW:234.26 g/mol | Chemical Reagent |
| Lipid N2-3L | Lipid N2-3L, MF:C48H93N3O8, MW:840.3 g/mol | Chemical Reagent |
Applications in Pharmaceutical Research and Development
UV detection technologies serve critical roles throughout the pharmaceutical development lifecycle, from early drug discovery through quality control of final dosage forms. Regulatory frameworks, including ICH guidelines, implicitly assume the use of UV detection for stability-indicating HPLC methods of drug substances and products, with sensitivity requirements in the 0.05–0.10% range for impurity detection [8]. Specific pharmaceutical applications include:
Identity Testing: UV spectrophotometry provides confirmation of drug substance identity through comparison of absorption spectra with reference standards, ensuring correct labeling and material identification [25] [5]. The characteristic wavelength of maximum absorption (λmax) serves as a primary identity parameter in many pharmacopeial monographs.
Assay and Potency Determination: Quantification of active pharmaceutical ingredients (APIs) utilizing Beer-Lambert law relationships represents the most prevalent application of UV detection in pharmaceutical analysis [5]. The high precision achievable with modern UV detectors (<0.2% RSD) enables reliable potency determinations against strict specifications (typically 98.0–102.0%) [8].
Impurity Profiling: UV detectors provide sensitive detection and quantification of process-related impurities and degradation products in drug substances and products [5]. The normalized area-under-the-curve (AUC) values obtained with UV detection are often equated with purity percentages by weight in pharmaceutical quality control [8].
Dissolution Testing: UV spectrophotometry serves as the primary analytical technique for evaluating drug release from solid oral dosage forms in dissolution testing [25] [5]. The ability to rapidly quantify API concentration in dissolution media makes UV detection ideally suited for this high-throughput application.
Diagram 2: HPLC system configuration with detector options
The evolution of UV detection systems from fixed wavelength to modern diode array technology represents a continuous trajectory toward greater information density and analytical capability. While mass spectrometry has emerged as a powerful complementary technique, UV detection maintains significant relevance in pharmaceutical analysis due to its exceptional reliability, quantitative precision, and regulatory acceptance [11]. The persistence of LC-UV/DAD methodologies, particularly in quality control environments, underscores the technique's enduring value for applications where established methods and cost-effectiveness are prioritized [11].
Future developments in UV detection technology will likely focus on integration with complementary detection modalities, miniaturization for portable applications, and enhanced data processing capabilities. Advanced algorithms for spectral deconvolution, such as Shimadzu's i-PDeA function that enables virtual separation of chromatographically unresolved peaks, represent the current forefront of DAD innovation [1]. Similarly, modern instruments like the Agilent Cary 3500 combine the rapid spectral acquisition of diode array systems with the high performance of double monochromator designs, eliminating traditional tradeoffs between speed and precision [23].
In conclusion, the historical evolution from fixed wavelength to diode array detection systems has dramatically expanded the information potential of UV detection in analytical chemistry. While conventional UV spectrophotometers remain fit-for-purpose for many routine quantitative applications, diode array detectors provide unparalleled capabilities for method development, peak purity assessment, and retrospective data analysis. The selection between these detection approaches should be guided by specific analytical requirements, with DAD offering clear advantages for unknown screening, impurity detection, and regulatory method validation where comprehensive spectral documentation provides added scientific confidence.
Practical Applications: Selecting the Right Detector for Your Analysis
In the landscape of high-performance liquid chromatography (HPLC), the ultraviolet (UV) detector remains a cornerstone for the analysis of chromophoric compounds, offering an unparalleled combination of reliability, ease of use, and cost-effectiveness [8]. Despite the advancement and increasing prominence of diode array detectors (DAD) and mass spectrometric detection, UV detectors continue to be the undisputed workhorse in many quality control and routine testing laboratories [8]. The core distinction in their operation lies in their optical design: a variable wavelength UV (VWD) detector uses a monochromator to select a specific wavelength of light to pass through the sample flow cell, whereas a DAD passes polychromatic light through the cell and then disperses it onto a photodiode array, capturing the entire spectrum simultaneously [3] [8]. This fundamental difference dictates their respective applications, advantages, and limitations. The objective of this whitepaper is to delineate the specific scenarios in pharmaceutical research and drug development where the simplicity and cost-effectiveness of a UV detector are not just sufficient but are the optimal choice for analytical method development.
Technical Comparison: UV versus Diode Array Detectors
Operational Principles and Data Output
The choice between a UV and a DAD detector begins with an understanding of their core operational mechanics and the type of data they generate.
Variable Wavelength Detector (VWD): This detector employs a deuterium lamp as its light source. The polychromatic light from this lamp is directed into a monochromator, which uses a diffraction grating to select a specific, user-defined wavelength [3] [8]. This monochromatic light then passes through the flow cell, and a single photodiode measures its intensity after passage [26]. The output is a chromatogram at one or a few pre-selected wavelengths, providing excellent sensitivity for quantification but no spectral information for peak identification beyond retention time [1].
Diode Array Detector (DAD/PDA): In a DAD, the optical path is reversed. Light from the source is passed directly through the flow cell, and the transmitted light is then dispersed by a diffraction grating onto an array of typically 512 or 1024 photodiodes [8] [27]. This allows the detector to capture the full UV-Vis spectrum of the eluent every few milliseconds throughout the run [1]. The primary output includes not only chromatograms at any extracted wavelength but also full spectral data for each peak, enabling functions like peak purity assessment and library searching for compound identification [1] [8].
The following table summarizes the critical differences between these two detector types:
Table 1: Technical and Operational Comparison of VWD and DAD Detectors
| Feature | Variable Wavelength Detector (VWD) | Diode Array Detector (DAD/PDA) |
|---|---|---|
| Optical Principle | Monochromator before flow cell [8] | Polychromatic light through flow cell; dispersion after [3] [27] |
| Spectral Data | Single or few programmed wavelengths; no full spectra [26] | Full UV-Vis spectrum collected in real-time for all peaks [1] [8] |
| Primary Applications | Quantitative analysis of known compounds [8] | Method development, peak purity, identification of unknowns [1] [8] |
| Cost | Lower initial investment, lower maintenance [28] | Higher initial cost [28] |
| Sensitivity | High sensitivity due to higher light throughput [27] | Historically higher noise, but modern systems are highly improved [8] [27] |
| Key Advantage | Simplicity, cost-effectiveness, high sensitivity for targeted methods | Spectral information for peak identification and purity analysis [1] |
Visualizing the Operational Workflow
The logical process of selecting a detector based on analytical goals and compound knowledge can be summarized in the following workflow. This decision tree guides the scientist to the most efficient and cost-effective detection solution.
Key Scenarios for Selecting a UV Detector
High-Throughput Quality Control of Pharmaceuticals
In regulated quality control (QC) environments, where methods are rigorously validated and analytes are well-defined, the UV detector excels. The International Council for Harmonisation (ICH) guidelines for drug substance and product testing require high precision, often with a relative standard deviation (RSD) of <0.2% [8]. UV detectors are exceptionally capable of meeting this demand due to their stability and high signal-to-noise ratio. For example, a validated method for flutamide quantification demonstrated an impressive precision of 0.2-1.4% RSD and accuracy within 90-105% using HPLC-UV, fully compliant with ICH guidelines [29]. In such settings, where thousands of samples are tested for potency of a known compound, the additional spectral data from a DAD provides no added value but consumes more resources in terms of data storage and processing.
Quantitative Analysis of Known Compounds with High Sensitivity
When method sensitivity is paramount for detecting low concentrations of a known analyte, the optical design of a VWD can provide a superior signal-to-noise ratio compared to a DAD [27]. This is because in a VWD, a greater intensity of monochromatic light reaches the flow cell. A study quantifying posaconazole successfully used an HPLC-UV method, achieving a limit of quantification (LOQ) of 2.73 μg/mL [12]. This level of sensitivity is sufficient for many pharmaceutical assays, such as dissolution testing, content uniformity, and assay of bulk active ingredients, making the UV detector the ideal tool for these specific, sensitive quantitative tasks.
Budget-Constrained Environments and Routine Testing
The economic argument for UV detectors is compelling. Both the initial capital investment and the long-term cost of ownership for a VWD are significantly lower than for a DAD system [28]. This makes UV detection the rational choice for teaching laboratories, routine testing facilities with high sample volumes, and projects with stringent budget constraints. For applications where the goal is simply to quantify a known compound at a specific wavelength, the advanced capabilities of a DAD are an unnecessary expense. The UV detector delivers the required performance—excellent quantitative data—at a fraction of the cost, ensuring analytical efficiency and financial prudence.
Experimental Protocol: Protein Binding Study of Flutamide Using HPLC-UV
The following detailed methodology, adapted from a published research study, exemplifies a robust application of a UV detector in a complex bioanalytical context [29].
Research Reagent Solutions
Table 2: Essential Materials and Reagents for Flutamide Protein Binding Study
| Reagent/Material | Specification | Function in the Experiment |
|---|---|---|
| Flutamide | Reference Standard | The active pharmaceutical ingredient (API) and analyte of interest [29]. |
| Human Serum Albumin (HSA) | 20% Solution | Model plasma protein for studying drug-protein binding interactions [29]. |
| Acetanilide | Analytical Standard | Serves as the Internal Standard (IS) to correct for procedural variability [29]. |
| Potassium Dihydrogen Phosphate (KHâ‚‚POâ‚„) | Analytical Grade | Used to prepare the buffer for mobile phase and sample solutions (pH 7.4) [29]. |
| Methanol & Acetonitrile | HPLC Grade | Organic modifiers in the mobile phase for chromatographic separation [29]. |
| Diethyl Ether | Analytical Grade | Extraction solvent for pre-concentrating flutamide from the aqueous sample [29]. |
Detailed Methodology
1. Chromatographic Conditions:
- Apparatus: Knauer HPLC system [29].
- Column: Eurosphere C8 column (150 mm × 4.6 mm, 5 µm) with a C8 guard column [29].
- Mobile Phase: A mixture of 29% (v/v) methanol, 38% (v/v) acetonitrile, and 33% (v/v) potassium dihydrogen phosphate buffer (50 mM, pH 3.2) [29].
- Flow Rate: 1.0 mL/min in isocratic mode [29].
- Detection: UV detection at 226.4 nm [29].
- Injection Volume: 25 µL [29].
2. Sample Preparation and Binding Study:
- Stock Solutions: Prepare flutamide stock solution (1600 µg/mL) and acetanilide (IS) stock solution (0.9 mg/mL) in methanol [29].
- Protein Binding Incubation: Mix flutamide (1-16 µg/mL) with HSA (4%) in phosphate buffer (pH 7.4). Incubate the mixtures for 30 minutes in a shaker incubator at 50 rpm, protecting samples from light [29].
- Ultrafiltration: Transfer the incubated mixtures to ultrafiltration devices and centrifuge at 4000 rpm for 10 minutes. The free (unbound) fraction of flutamide is found in the ultrafiltrate [29].
3. Extraction and Analysis:
- To 1 mL of the ultrafiltrate, add 50 µL of the IS working solution [29].
- Perform liquid-liquid micro extraction by adding 400 µL of diethyl ether, vortexing for 30 seconds, and centrifuging at 12,000 rpm for 5 minutes [29].
- Separate the organic layer and evaporate it to dryness. Reconstitute the residue in 100 µL of mobile phase and inject into the HPLC system [29].
4. Method Validation: The described method was validated per ICH guidelines [29]:
- Linearity: 62.5 - 16,000 ng/mL (r² > 0.99) [29].
- LOQ: 62.5 ng/mL [29].
- Precision (RSD): 0.2 - 1.4% (intra-day) [29].
- Accuracy (% Recovery): 90 - 105% [29].
This protocol highlights how a well-designed HPLC-UV method can provide precise, accurate, and sensitive data for complex studies, fulfilling all analytical requirements without the need for a more expensive DAD detector.
The selection of a UV detector over a DAD is a strategic decision grounded in the principles of analytical fitness-for-purpose and economic efficiency. As detailed in this whitepaper, the UV detector is the superior choice for high-throughput quantitative analysis of known compounds, routine quality control in regulated environments, and budget-conscious projects where maximum sensitivity for a targeted analysis is required. Its simplicity, reliability, and lower operational cost make it an indispensable tool in the drug development pipeline. The experimental case study on flutamide protein binding demonstrates that for a vast number of well-defined analytical challenges in pharmaceutical science, the UV detector provides all the necessary data with performance that meets or exceeds rigorous international standards. Ultimately, understanding the specific capabilities of each detector type allows scientists and researchers to deploy their resources most effectively, ensuring that analytical sophistication is matched to genuine need.
Leveraging DAD for Peak Purity Assessment and Method Development
In the realm of high-performance liquid chromatography (HPLC), detection technology is pivotal for accurate compound identification and quantification. The core distinction between a traditional UV spectrophotometer (often referred to as a Variable Wavelength Detector, VWD) and a Diode Array Detector (DAD) lies in their operational principles and data acquisition capabilities [30] [27].
A UV/VWD uses a monochromator to select a single, specific wavelength from the light source before it passes through the flow cell [8] [3]. This setup is ideal for targeted, high-sensitivity detection of known compounds at a fixed wavelength. In contrast, a DAD exposes the sample to the full spectrum of light from the source. After the light passes through the flow cell, it is dispersed by a diffraction grating onto an array of photodiodes, allowing the simultaneous capture of absorbance data across a wide wavelength range (typically 190 to 900 nm) in real-time [1] [31] [3]. This fundamental difference empowers the DAD with superior capabilities for method development, peak identification, and purity assessment, as it provides a complete spectral profile for every data point in the chromatogram.
Theoretical Foundations of Peak Purity Assessment
Peak purity assessment using a DAD is based on the principle of spectral homogeneity [32]. The underlying question is: "Is this chromatographic peak composed of compounds having a single spectroscopic signature?" [32] For a pure peak, the UV spectrum remains constant across the entire peak profile—at the upslope, apex, and downslope—because only one compound is contributing to the absorbance [31]. If an impurity is co-eluting and it possesses a chromophore with a different spectral shape, the spectrum will change as the relative concentrations of the two compounds shift throughout the peak elution [33].
The comparison of spectra is mathematically grounded in vector analysis. Each spectrum is treated as a vector in n-dimensional space, where 'n' is the number of data points (wavelengths) in the spectrum [32]. The similarity between two spectra is quantified by calculating the cosine of the angle (θ) between their vectors or by using a correlation coefficient. A cosine value of 1 (or a correlation coefficient of 1) indicates identical spectral shapes, suggesting a pure peak. A value less than 1 indicates a spectral difference, signaling a potential impurity [32]. This calculation is performed by the software, which compares the spectrum at the peak apex to all other significant spectra across the peak after applying a baseline correction [34].
DAD Instrumentation and Configuration for Optimal Purity Analysis
Configuring the DAD correctly is critical for obtaining reliable peak purity results. Several instrumental parameters directly impact the quality of the spectral data and the subsequent purity calculation [33].
Key Configurable Parameters
Table 1: Key DAD Parameters for Peak Purity Analysis
| Parameter | Description | Impact on Peak Purity Analysis |
|---|---|---|
| Spectral Acquisition Range | The range of wavelengths acquired during the run [34]. | Should be set to encompass the λmax of the analyte and potential impurities. A very wide range can increase noise [33]. |
| Bandwidth | The range of wavelengths averaged for each data point (e.g., 4 nm around 254 nm) [33]. | A wider bandwidth improves signal-to-noise but decreases spectral resolution, potentially masking small spectral differences [33]. |
| Slit Width | The physical width controlling the total amount of light reaching the detector [33]. | A wider slit increases sensitivity but decreases spectral resolution, "smoothing out" fine spectral details crucial for purity assessment [33]. |
| Data Acquisition Rate | The frequency at which full spectra are captured [33]. | Must be fast enough to collect sufficient data points (e.g., 10-20 points) across a narrow peak to accurately model its shape and spectral evolution [33]. |
Essential Pre-Analysis Steps
Before performing the purity calculation, the software performs crucial data pre-processing [33]:
- Background Correction: Spectra from the baseline before and/or after the peak are used to subtract contributions from the mobile phase or matrix, ensuring the comparison is only between analyte spectra [34] [33].
- Spectral Normalization: Spectra are normalized to compensate for the changing concentration of the analyte as it elutes. This allows for a direct comparison of spectral shape independent of concentration [31] [33].
- Absorbance Threshold Setting: A threshold (e.g., 5-10% of peak height) is set to exclude noisy data from the peak edges from the calculation, preventing false fails [33].
Experimental Protocol for Peak Purity Assessment
The following workflow provides a detailed methodology for conducting peak purity analysis using a DAD, as implemented in software platforms like OpenLab CDS [34].
Step-by-Step Workflow
- Method Creation and Peak Identification: Begin by creating a new processing method designed for 3D-UV data analysis. Integrate the chromatogram and identify the peaks of interest by adding them as named compounds in the processing method's compound table [34].
- Configure UV Impurity Check Parameters: Access the "UV Impurity Check" or equivalent tab in the processing method [34].
- Calculate UV Purity: Select the option to calculate purity for "identified peaks only" [34].
- Wavelength Range: Define the lower and upper wavelength limits for the spectral comparison. This range should be based on the solvent UV cutoff (e.g., solvent cutoff + 5 nm) and the characteristic absorption regions of the compounds. Limiting the range to relevant wavelengths reduces noise [34] [31].
- Sensitivity: This is a crucial parameter that acts as a threshold for the purity algorithm. The default is often 50%. A higher sensitivity value makes the purity check more stringent, while a lower value makes it more lenient. The goal is to adjust the sensitivity so that a pure standard passes the purity test [34].
- Process Data and Review Results: Reprocess the data with the new method. Review the results in the injection report, which will typically flag peaks as pure (e.g., green) or impure (e.g., red). Examine the peak details view, which shows the overlaid normalized spectra and a purity curve (similarity curve) across the peak [34] [31].
Interpretation of Results
- Pure Peak: The normalized spectra from the upslope, apex, and downslope overlay closely with each other. The purity curve (plotting spectral similarity vs. time) remains flat and above the set threshold (e.g., 980 or 0.980) [31].
- Impure Peak: The normalized spectra show clear discrepancies at different points across the peak. The purity curve dips significantly below the threshold, indicating a change in spectral identity during elution [34] [31].
Critical Factors Influencing Peak Purity Outcomes
The reliability of a peak purity assessment is not solely dependent on the algorithm; it is heavily influenced by analytical and sample conditions.
Method and Sample Considerations
Table 2: Factors Affecting Peak Purity Results and Mitigation Strategies
| Factor | Impact on Peak Purity | Mitigation Strategy |
|---|---|---|
| Sample Concentration | Absorbance should ideally not exceed 1.0 AU to remain within the linear range of the detector. High absorbance can lead to inaccurate purity calculations [34] [31]. | Adjust sample concentration so the peak of interest has an absorbance below 1.0 AU while still being well above the quantification limit [34]. |
| Mobile Phase & Buffer | High buffer concentrations or certain ion-pair reagents can have high UV cutoffs, increasing baseline noise and absorbance, which interferes with spectral comparison [31]. | Use HPLC-grade solvents and buffers. Set the lower wavelength limit above the UV cutoff of the mobile phase components [31]. |
| Spectral Similarity of Co-eluter | If the impurity has a UV spectrum identical or very similar to the main compound, the DAD cannot distinguish them, leading to a false "pure" result [32] [31] [33]. | This is a fundamental limitation. Orthogonal techniques like MS or a chromatographic method with different selectivity are required [34] [32]. |
| Chromatographic Separation | Poorly resolved peaks are the primary cause of impure results. If the impurity co-elutes completely, it may be inseparable by spectral means alone [33]. | Optimize the chromatographic method to achieve baseline resolution for all known impurities before relying on DAD for purity assessment [33]. |
Advanced Applications and Limitations
Applications in Pharmaceutical Development
The primary application of DAD-based peak purity is in the development of stability-indicating methods for drug substances and products [32]. By analyzing samples subjected to forced degradation (heat, light, acid, base, oxidation), scientists can verify that the method adequately separates the main active ingredient from its degradation products and that the main peak itself is spectrally pure, indicating no hidden co-eluting degradants [32] [31]. This provides critical evidence for regulatory submissions as per ICH guidelines [32].
Inherent Limitations and Complementary Techniques
It is crucial for scientists to understand the boundaries of DAD peak purity [34]:
- No Universal Detection: The impurity must possess a chromophore. Compounds without UV absorption will not be detected [31].
- Similar Spectra: Impurities that are structurally very similar (e.g., isomers) often have nearly identical UV spectra, making them undetectable via spectral comparison [32] [31].
- Concentration Dependency: The impurity must be present at a high enough concentration to alter the spectral profile significantly. Trace-level impurities may not trigger a purity failure [31] [33].
- Conclusion: A passing peak purity result does not definitively prove a single compound is present; it only indicates that no spectrally distinct, UV-active impurities were found above the detection limit of the method [34] [33]. Therefore, for definitive confirmation, orthogonal techniques such as Mass Spectrometry (MS) are often necessary [34] [1] [32].
The Scientist's Toolkit: Essential Reagents and Materials
Successful peak purity analysis requires high-quality materials to minimize external artifacts.
Table 3: Essential Research Reagents and Materials for HPLC-DAD Analysis
| Item | Function | Purity/Grade Recommendation |
|---|---|---|
| HPLC-Grade Solvents | Act as the mobile phase to carry the sample through the system. Poor quality solvents are a major source of UV-absorbing impurities and baseline noise [31]. | Gradient-grade or HPLC-grade. |
| HPLC-Grade Water | Used in aqueous mobile phases and for buffer preparation. Contaminants in water can cause high background noise and ghost peaks [31]. | HPLC-Grade, 18 MΩ-cm resistivity. |
| High-Purity Buffer Salts | Used to control mobile phase pH. Impurities in salts can elevate the UV cutoff, increase baseline noise/absorbance, and deposit in the system [31]. | >99.0% purity, suitable for HPLC. |
| Analytical Standards | Highly purified compounds used to identify peaks and calibrate the system. Essential for establishing the correct retention time and spectral profile of a pure compound [34]. | Certified Reference Material (CRM) or highest available purity. |
| Sample Filtration Vials | To remove particulate matter from samples that could clog the HPLC column or flow cell [33]. | Syringe filters, 0.45 µm or 0.2 µm pore size, compatible with the sample solvent. |
| Masp-2-IN-1 | Masp-2-IN-1, MF:C22H21N7O3S, MW:463.5 g/mol | Chemical Reagent |
| Clavamycin F | Clavamycin F, MF:C15H24N4O7, MW:372.37 g/mol | Chemical Reagent |
Spectral Analysis for Compound Identification and Confirmation
Ultraviolet-visible (UV-Vis) spectrophotometry is a foundational analytical technique that measures the amount of discrete wavelengths of UV or visible light absorbed by or transmitted through a sample in comparison to a reference or blank sample [2]. This property is influenced by the sample composition, providing critical information about the identity and concentration of analytes. The technique operates on the principle that light has a specific amount of energy inversely proportional to its wavelength, with shorter wavelengths carrying more energy and longer wavelengths carrying less energy [2]. A specific amount of energy is needed to promote electrons in a substance to a higher energy state, which we detect as absorption. Electrons in different bonding environments require different specific energy amounts for promotion, which is why absorption occurs at different wavelengths for different substances [2].
Within the context of liquid chromatography (LC), two primary detection systems utilizing UV-Vis principles have emerged: the traditional UV-Vis spectrophotometer (often referred to as a variable wavelength detector or VWD) and the diode-array detector (DAD), also known as a photodiode array detector (PDA) [1] [8]. While both techniques measure the absorption of light in the ultraviolet and visible regions (typically 190-900 nm), they differ significantly in their optical design, operational capabilities, and applications in compound identification and confirmation [1]. The distinction between these systems represents a fundamental evolution in detection technology, with each offering unique advantages for specific analytical scenarios encountered by researchers, scientists, and drug development professionals.
Fundamental Principles and Instrumentation
Core Principles of UV-Vis Spectroscopy
UV-Vis spectroscopy is based on the Beer-Lambert Law, which states that the amount of light absorbed by a sample is directly proportional to the concentration of the absorbing species and the path length of the light through the sample [2] [35]. The absorbance (A) is calculated as A = logâ‚â‚€(Iâ‚€/I), where Iâ‚€ is the intensity of incident light and I is the intensity of light after passing through the sample [2]. This relationship enables the technique to be used for both qualitative identification (based on absorption spectra) and quantitative analysis (based on absorbance intensity) of compounds containing chromophores - structural moieties that absorb UV or visible light [8].
The fundamental process involves several key steps: a light source emits broadband radiation, a wavelength selection device isolates specific wavelengths, the monochromatic light passes through the sample, and a detector measures the intensity of transmitted light [2]. For a molecule to be detectable by UV-Vis spectroscopy, it must contain a chromophore or be tagged with a UV-absorbing group [11]. The characteristic wavelength of maximum absorption (λmax) provides structural information about the chromophore, while the absorbance at that wavelength relates to concentration [8].
UV-Vis Spectrophotometer (Variable Wavelength Detector) Design
The traditional UV-Vis spectrophotometer, when configured as an HPLC detector, employs a sequential wavelength measurement approach [8]. Its optical system (Figure 1) utilizes a deuterium lamp for UV light and often a tungsten or halogen lamp for visible light, with the lamps switching during measurement typically between 300 and 350 nm where light emission is similar from both sources [2]. The polychromatic light from the source is directed into a monochromator, consisting of an entrance slit, a diffraction grating that disperses the light spectrum, and an exit slit [8]. The motorized grating rotates to select a specific wavelength, which passes through the exit slit to the flow cell containing the HPLC eluent [8].
After passing through the sample, the transmitted light impinges on a single photodetector (typically a photomultiplier tube or photodiode) that transforms the light energy into electrical signals [2] [8]. A beam splitter is often placed before the flow cell to direct a portion of the source energy to a reference photodetector for signal compensation [8]. The entire optical system is housed in a sealed cabinet painted black to reduce stray light, which can limit detector linearity [8]. This design necessitates that the instrument measure one wavelength or a limited set of wavelengths at a time, which represents both an advantage for specific applications and a limitation for comprehensive spectral analysis.
Figure 1: Optical pathway of a variable wavelength UV-Vis detector.
Diode-Array Detector (DAD) Design
The diode-array detector employs a fundamentally different optical design that enables simultaneous multi-wavelength detection (Figure 2) [4] [8]. In a DAD, the light source (typically a deuterium lamp for UV and a tungsten lamp for visible light) emits broad-spectrum light that passes through the HPLC flow cell [4] [8]. After passing through the sample, the transmitted light—which now contains spectral information about all absorbing species in the flow cell—is dispersed by a diffraction grating onto an array of photodiodes [8]. Each diode in the array measures a specific, narrow band of wavelengths simultaneously, typically with 512 or 1024 diodes covering the entire UV-Vis range [8].
This reversed optical path—where polychromatic light passes through the sample first, then is dispersed onto multiple detectors—represents the key innovation of the DAD [8]. Each photodiode in the array measures light intensity at its specific wavelength, allowing the instrument to capture the complete absorption spectrum of the eluting analyte in real-time [4]. The detector yields both absorbance and spectral data that can be used for quantitation, identification, and peak purity assessments [8]. This simultaneous full-spectrum acquisition enables applications that are impossible with traditional UV-Vis detectors, including post-run spectral analysis and peak purity verification.
Figure 2: Optical pathway of a diode-array detector (DAD) with reversed optics.
Technical Comparison and Performance Characteristics
Quantitative Comparison of Key Parameters
Table 1: Technical comparison between UV-Vis spectrophotometers and diode-array detectors
| Parameter | UV-Vis Spectrophotometer (VWD) | Diode-Array Detector (DAD) |
|---|---|---|
| Wavelength Range | Typically 190-600 nm (deuterium lamp) or extended to 900 nm with tungsten lamp [2] [8] | Typically 190-900 nm using both Dâ‚‚ and W lamps [4] [8] |
| Wavelength Selection | Single wavelength or limited set of wavelengths selected by monochromator before sample [8] | Full spectrum measurement simultaneously by diode array after sample [4] [8] |
| Spectral Acquisition | Sequential; requires separate runs for full spectrum or time-slicing during peaks [8] | Simultaneous; full spectrum captured continuously throughout chromatographic run [4] [8] |
| Optical Path | Source → Monochromator → Flow Cell → Detector [8] | Source → Flow Cell → Diffraction Grating → Diode Array [8] |
| Typical Detector Element | Single photomultiplier tube or photodiode [2] [8] | Array of 512-1024 photodiodes [8] |
| Spectral Resolution | Determined by monochromator slit width, typically 5-8 nm bandwidth [8] | Software-selectable, typically 1-4 nm per diode depending on array density [8] |
| Data Output | Absorbance at selected wavelength(s) vs. time [1] | Three-dimensional data: absorbance, wavelength, and time [4] [1] |
| Primary Applications | Targeted quantification of known compounds, routine QC analyses [1] [8] | Method development, peak purity analysis, identification of unknowns, complex mixtures [1] [8] |
Performance Characteristics and Limitations
Both detection systems share certain fundamental requirements and limitations. They require that the target analytes possess chromophores or be tagged with UV-absorbing groups [11]. The mobile phase must have optical transparency in the detection wavelength range, and the detector response varies with analyte molar absorptivity [8]. The historical benchmark for detector noise specifications is ±1×10â»âµ AU, which is exceeded by most modern instruments of both types [8].
The fixed wavelength UV detector, a simpler variant, was historically important but is now found mostly in low-cost or portable systems [8]. These early instruments used low-pressure mercury lamps with strong emission at 254 nm, with other wavelengths obtained by adding phosphor to the source or using different lamps [8]. One early fixed wavelength detector introduced in 1968 had a reported noise of ±0.2 mAU, approximately 50 times less sensitive than today's detectors [8].
For quantitative analysis, both systems follow Beer-Lambert law, where absorbance is directly proportional to concentration when the pathlength is constant [2] [35]. Typical flow cell volumes are 8-18 µL for HPLC and 0.5-1 µL for UHPLC applications, with pathlengths typically around 10 mm [8]. The higher precision achievable with UV detection (<0.2% RSD) is particularly important in pharmaceutical testing, where typical potency specifications for drug substances are 98.0 to 102.0% [8].
Experimental Protocols and Methodologies
Protocol for Compound Identification Using DAD
Objective: To identify unknown compounds in a mixture using HPLC-DAD through spectral matching and retention time correlation.
Materials and Reagents:
- HPLC system equipped with diode-array detector
- Appropriate HPLC column (e.g., C18 for reverse-phase)
- Mobile phase solvents (HPLC grade)
- Reference standards of suspected compounds
- Sample solution prepared in compatible solvent
Procedure:
- Mobile Phase Preparation: Prepare degassed mobile phase according to validated method. For gradient methods, prepare both aqueous and organic components.
- System Equilibration: Prime system with mobile phase and equilibrate column until stable baseline is achieved at initial gradient conditions.
- Standard Analysis: Inject individual reference standards and acquire chromatographic data with full spectral collection (190-900 nm).
- Spectral Library Creation: Extract UV-Vis spectra for each standard at peak apex and create spectral library with associated retention times.
- Sample Analysis: Inject sample using identical chromatographic conditions, ensuring DAD collects full spectrum data throughout run (typically 2-4 spectra per second).
- Data Analysis:
- Compare retention times of sample peaks with standards
- Perform spectral matching between sample peaks and library spectra
- Use software tools to calculate match factors or purity indices
- Identify compounds based on retention time correlation and spectral match
Critical Parameters:
- Maintain consistent flow rate and column temperature
- Ensure sufficient spectral resolution (typically 1-4 nm)
- Verify detector wavelength accuracy using certified standards
- Use consistent injection volume for comparative analyses
Protocol for Peak Purity Analysis
Objective: To assess chromatographic peak homogeneity and detect co-eluting impurities using DAD spectral analysis.
Procedure:
- Chromatographic Separation: Perform HPLC separation using optimized method with DAD detection collecting full spectra.
- Spectral Acquisition: Configure DAD to collect multiple spectra across each peak of interest (typically 5-10 spectra per peak from upslope to downslope).
- Spectral Comparison: Using instrument software, normalize and overlay spectra from different regions of the peak.
- Purity Assessment: Calculate correlation between spectra from leading edge, apex, and trailing edge of peak.
- Result Interpretation: High correlation coefficients (>0.999) indicate pure peak, while significant spectral differences suggest co-elution.
Advanced Applications: Modern DAD systems like Shimadzu's i-PDeA function can deconvolute co-eluting peaks by utilizing both time information (chromatogram) and spectral information (UV spectrum) to create virtual separations of chromatographically unresolved compounds [1]. This approach relies on scientific principles rather than estimation based on gaussian modeling [1].
Protocol for Multi-Component Quantification Using UV-Vis Detection
Objective: To simultaneously quantify multiple known compounds using targeted wavelength selection.
Procedure:
- Wavelength Selection: Based on spectral properties of each analyte, select optimal detection wavelengths that maximize sensitivity and minimize interference.
- Method Development: Establish chromatographic conditions that provide baseline separation of target compounds or validated resolution for overlapping peaks.
- Calibration Curve: Prepare and analyze standard solutions at minimum five concentration levels covering expected sample range.
- Sample Analysis: Inject samples under identical conditions, monitoring absorbance at pre-selected wavelengths for each target compound.
- Data Processing: Use peak areas or heights from specific wavelengths to calculate concentrations based on calibration curves.
Application Example: In natural products analysis, it is common to monitor 220 nm and 274 nm simultaneously to determine different classes of analytes of interest [1].
Applications in Pharmaceutical Research and Development
Compound Identification and Confirmation
The three-dimensional data generated by DAD detectors (absorbance, wavelength, and time) provides powerful capabilities for compound identification and confirmation [1]. Unlike single-wavelength UV detection, which relies primarily on retention time for compound identification, DAD adds a second dimension of confirmation through spectral matching [1]. For example, in cannabinoid analysis, DAD can distinguish between neutral cannabinoids (delta-9-THC, CBD) and acidic forms (THCA, CBDA) based on their characteristic spectral profiles, even when they have similar retention times [1]. The acidic cannabinoids have a carboxylic acid functional group that provides lower energy, higher wavenumber absorbance maxima compared to their neutral counterparts [1].
In pharmaceutical development, this capability is particularly valuable for identifying degradation products, metabolites, and synthetic impurities that share structural similarities with the active pharmaceutical ingredient but have distinct UV spectra. The availability of both retention time and spectral information significantly increases confidence in compound identification compared to single-wavelength detection alone.
Peak Purity Assessment
Peak purity analysis represents one of the most significant advantages of DAD technology in regulated pharmaceutical analysis [1] [8]. By comparing UV spectra from multiple points across a chromatographic peak (upslope, apex, and downslope), scientists can detect the presence of co-eluting impurities that might otherwise go unnoticed with single-wavelength detection [1]. Software algorithms calculate a peak purity index or purity angle, which indicates whether multiple compounds may be co-eluting [1] [8].
This application is particularly crucial for stability-indicating methods required by ICH guidelines, which demand demonstration that the analytical method can separate and quantify degradants from the main peak [8]. The ability to perform peak purity assessment without method modification or additional analyses makes DAD particularly valuable for method validation and transfer activities in pharmaceutical quality control.
Method Development and Optimization
During HPLC method development, DAD technology significantly accelerates the process of wavelength selection and method optimization [1]. By collecting full spectral data throughout method development runs, scientists can retrospectively determine the optimal detection wavelengths for each compound without reinjecting samples [1]. This capability is particularly valuable when working with unknown impurities or degradation products whose spectral characteristics are not initially known.
The comprehensive data set also facilitates troubleshooting of separation issues, as spectral analysis can help identify peak shouldering, fronting, or tailing that might indicate secondary interactions or co-elution. The wealth of spectral information enables more robust method development and provides greater understanding of the separation mechanism and compound behavior.
The Scientist's Toolkit: Essential Research Reagents and Materials
Table 2: Key research reagents and materials for UV-Vis and DAD analyses
| Item | Function/Application | Technical Considerations |
|---|---|---|
| HPLC Grade Solvents | Mobile phase preparation | Low UV cutoff, minimal absorbing impurities; essential for low-wavelength detection <220 nm [8] |
| Deuterium (Dâ‚‚) Lamp | UV light source for detection | Typical lifetime 1000-2000 hours; provides continuous emission 190-600 nm [8] |
| Tungsten (W) Lamp | Visible light source | Extends detection range to 900 nm; often used with Dâ‚‚ lamp in combined systems [2] [8] |
| Flow Cells | Sample containment for detection | Typical volumes: 8-18 µL (HPLC), 0.5-1 µL (UHPLC); pathlength typically 10 mm; quartz for UV detection [8] |
| Reference Standards | Compound identification and quantification | Certified purity; used for spectral library creation and calibration curves [11] |
| Quartz Cuvettes | Stand-alone spectrophotometer measurements | Required for UV measurements; plastic cuvettes absorb UV light and are inappropriate [2] |
| Mobile Phase Additives | Modify separation and detection | Must have minimal UV absorbance; volatile buffers preferred for LC-MS compatibility [11] |
| Column Regeneration Solutions | HPLC column maintenance | Strong solvents for removing retained compounds; essential for maintaining separation performance [8] |
| (Z)-4EGI-1 | (Z)-4EGI-1, MF:C18H12Cl2N4O4S, MW:451.3 g/mol | Chemical Reagent |
| Cdk2-IN-36 | Cdk2-IN-36, MF:C18H22N6O3, MW:370.4 g/mol | Chemical Reagent |
Comparative Workflow Analysis
Figure 3: Comparative workflow analysis between UV-Vis and DAD detection pathways.
The selection between UV-Vis spectrophotometry and diode-array detection represents a strategic decision in analytical method design that balances analytical needs with practical considerations. Traditional UV-Vis detectors provide excellent sensitivity, precision, and simplicity for targeted quantitative analyses where the compounds of interest are well-characterized and separation conditions are optimized [8]. Their reliability, ease of use, and high precision (<0.2% RSD) make them ideal for quality control applications in pharmaceutical and chemical industries [8].
In contrast, diode-array detectors offer comprehensive spectral information that enables advanced applications including peak purity analysis, method development acceleration, and compound identification through spectral matching [1] [8]. The ability to collect full UV-Vis spectra throughout the chromatographic run provides a data-rich environment for troubleshooting, method validation, and investigation of unknown compounds [1]. While DAD systems typically involve higher initial investment and generate larger data files, their capabilities align well with research and development environments where method development and compound characterization are primary activities.
Despite predictions that mass spectrometry would largely replace UV-based detection, LC-UV/DAD methodologies persist as robust, cost-effective solutions that are "completely fit for purpose" for many analytical applications [11]. The technique requires that three conditions are met: the molecule must possess a chromophore, there must be reasonable resolution between target analyte and co-eluting impurities, and the target compound and co-elutant must absorb at different wavelengths [11]. When these criteria are fulfilled, UV and DAD detection provide reliable performance that meets regulatory requirements across multiple industries.
The continued evolution of both technologies, including innovations such as virtual peak deconvolution (e.g., Shimadzu's i-PDeA) [1] and improved detector sensitivity, ensures that both UV-Vis and DAD detection will remain essential tools in the analytical scientist's arsenal for compound identification and confirmation in pharmaceutical research and drug development.
In high-performance liquid chromatography (HPLC), complete separation of all sample components is an ideal that is not always achieved in practice. Co-elution, where two or more analytes exit the chromatography column simultaneously, presents a significant challenge for accurate quantification and identification. This issue is particularly prevalent when analyzing compounds from the same chemical family, which often interact similarly with the chromatographic stationary phase [36]. Traditional ultraviolet (UV) detectors, which measure absorbance at one or a few predefined wavelengths, struggle to resolve these overlapping signals, potentially leading to inaccurate purity assessments and quantification errors [1]. The emergence of diode array detection (DAD), also known as photodiode array (PDA) detection, has revolutionized this landscape by capturing full spectral information for each point in the chromatogram, enabling advanced data processing techniques that can mathematically resolve co-eluting peaks. This technical guide explores the sophisticated application of Intelligent Peak Deconvolution Analysis (i-PDeA), a powerful chemometric tool that leverages the full three-dimensional data capacity of DAD systems to deconvolve co-eluting peaks, thereby transforming analytical workflows in pharmaceutical research and development.
Fundamental Differences: UV Spectrophotometer vs. DAD Detector
To appreciate the advanced capabilities of peak deconvolution, one must first understand the fundamental operational differences between traditional UV-Vis detectors and diode array detectors. While both detect analytes based on their ultraviolet or visible light absorption characteristics, their optical designs and data output capabilities differ significantly.
Optical Design and Data Acquisition
A variable wavelength UV detector employs a deuterium lamp as its light source. The light from this lamp is directed through a monochromator, which uses a diffraction grating to select a specific wavelength, which then passes through the sample flow cell before reaching a single photodiode detector [3] [8]. This design allows for sensitive detection at a user-specified wavelength but is limited to monitoring one wavelength at a time per injection.
In contrast, a Diode Array Detector reverses this optical path. Light from the source (often both deuterium and tungsten lamps for UV-Vis range) passes directly through the flow cell. The transmitted light is then dispersed by a diffraction grating onto an array of typically 1024 photodiodes [37] [3]. This design enables the simultaneous detection of all wavelengths across the operational range (e.g., 190-800 nm) for every data point collected during the chromatographic run [8]. This generates a three-dimensional data set: absorbance as a function of time and wavelength.
Data Output and Analytical Capabilities
The divergent optical designs of these detectors directly impact their analytical capabilities, as summarized in the table below.
Table 1: Comparison of Variable Wavelength UV Detector and Diode Array Detector
| Feature | Variable Wavelength UV Detector | Diode Array Detector |
|---|---|---|
| Optical Design | Single wavelength selected before flow cell [3] | Full spectrum captured after flow cell [3] |
| Data Output | Absorbance at specific wavelength(s) over time (2D) | Absorbance across all wavelengths over time (3D) [38] |
| Primary Use | Targeted quantification at known λmax | Quantification, identification, and peak purity assessment [1] |
| Spectral Acquisition | Requires separate injections for full spectrum | Continuous full-spectrum acquisition during a single run [8] |
| Peak Identification | Based primarily on retention time [1] | Based on retention time and spectral matching [1] [3] |
| Peak Purity Assessment | Limited or not possible | High, via spectral comparison across the peak [1] [38] |
The fundamental advantage of the DAD is its ability to capture the entire spectral profile of every analyte as it elutes. This rich dataset forms the foundation for advanced applications like peak purity analysis and spectral deconvolution, which are beyond the reach of traditional UV detectors. With a DAD, analysts are no longer limited to identifying compounds based solely on retention time; they can now use the compound's unique spectral fingerprint as a second confirmation tool [1] [3].
Intelligent Peak Deconvolution Analysis (i-PDeA): Principles and Mechanisms
Intelligent Peak Deconvolution Analysis (i-PDeA) represents a significant leap forward in data processing for chromatography. It is a chemometric technique developed to mathematically resolve, or deconvolve, overlapping chromatographic peaks by exploiting differences in the UV-Vis spectra of the co-eluting compounds [37] [39]. The core principle is that even peaks with nearly identical retention times often have subtle but measurable differences in their absorption spectra. i-PDeA leverages these differences to extract individual component profiles from a single, overlapped chromatographic band.
The Deconvolution Workflow
The i-PDeA algorithm, specifically the enhanced i-PDeA II version, utilizes a Multivariate Curve Resolution-Alternating Least Squares (MCR-ALS) computational approach [38]. This powerful algorithm iteratively resolves the complex, overlapped signal into the pure contributions of each component.
The following diagram illustrates the logical workflow of the i-PDeA deconvolution process:
Key Algorithmic Features
The power of i-PDeA II stems from several key features of its underlying MCR-ALS algorithm:
- Utilization of Full Spectral and Temporal Data: Unlike traditional integration methods that only use the chromatographic dimension (time), MCR-ALS simultaneously fits the data in both the time and spectral dimensions. This dual optimization provides a more robust solution [38].
- Non-Negative Constraints: The algorithm incorporates constraints that ensure all calculated concentrations and spectral absorbances are positive, which aligns with physical reality and leads to more chemically meaningful results [40].
- Iterative Refinement: The ALS process iteratively refines the estimates of the pure component spectra and their concentration profiles until the model converges on an optimal solution that best explains the original data [38].
This process allows i-PDeA to "virtually separate" peaks that are not physically resolved on the chromatographic column, providing both the pure spectrum and the quantitative chromatographic profile for each individual compound in the mixture [39] [41].
Experimental Protocols and Application Examples
The practical application of i-PDeA is best understood through specific experimental protocols and real-world case studies. The following examples, drawn from research and industry applications, demonstrate the protocol for implementing i-PDeA and its efficacy in resolving challenging separations.
General Protocol for i-PDeA Analysis
- Chromatographic Separation: Perform the HPLC or UHPLC analysis using a DAD detector. While complete separation is not required, method development should aim to maximize any slight differences in retention times and spectral characteristics between the target compounds.
- Data Acquisition: Ensure the DAD is set to acquire the full UV-Vis spectrum across a relevant wavelength range (e.g., 200-400 nm) for the entire duration of the chromatographic run. This generates the essential three-dimensional dataset.
- Data Processing: In the control software (e.g., Shimadzu's LabSolutions), select the co-eluting peak or the time range of interest.
- Algorithm Application: Initiate the i-PDeA function. The user is typically required to specify the wavelength and time ranges for deconvolution and may need to indicate the expected number of components [39] [38].
- Results Interpretation: Review the deconvoluted chromatograms and pure spectra for each component. The software provides quantitative data (peak area, height) for each resolved compound and their corresponding spectra for identification via library searching.
Case Study 1: Resolving Positional Isomers
Challenge: Separating positional isomers, which have nearly identical chemical structures and physical properties, is notoriously difficult. For example, 1,2-dimethoxybenzene and 1,3-dimethoxybenzene have almost identical retention times and absorption spectra, with λmax values of 274.2 nm and 273.6 nm, respectively—a difference of only 0.6 nm [37] [39].
Application of i-PDeA: Despite the near-identical spectra and co-elution, i-PDeA was able to leverage the subtle spectral differences to successfully deconvolve the peaks. The algorithm generated individual chromatograms and quantitation results for each isomer, a task that would be extremely time-consuming or impossible through column chemistry alone [39].
Case Study 2: Impurity Quantification in a Main Component Peak
Challenge: Accurate quantification of low-level impurities that elute within the tailing region of a large main component peak is critical in pharmaceutical analysis. Traditional integration methods (e.g., tangent skim) are often subjective and can lead to poor quantification precision [39].
Application of i-PDeA: i-PDeA can detect and quantify an impurity based solely on its spectral difference from the main component, even with no chromatographic resolution. Studies have shown that i-PDeA provides quantitative results with higher precision compared to traditional integration methods, without the need for additional method development to achieve physical separation [39].
Quantitative Performance Specifications
The performance of a DAD system equipped with i-PDeA is underpinned by its hardware specifications, which ensure the quality of the raw data fed into the deconvolution algorithm.
Table 2: Key DAD Performance Specifications for Deconvolution Applications (exemplified by Shimadzu SPD-M40)
| Parameter | Specification | Significance for Deconvolution |
|---|---|---|
| Wavelength Range | 190 - 800 nm [37] | Captures a broad spectrum for detailed spectral comparison. |
| Wavelength Accuracy | ± 1 nm [37] | Ensures reliability of subtle spectral differences used for deconvolution. |
| Photodiode Array | 1024 elements [37] | High diode density provides high spectral resolution. |
| Noise Level | 4.5 × 10â»â¶ AU [37] | Low noise is critical for detecting minor impurities and spectral features. |
| Drift | < 0.4 × 10â»Â³ AU/hour [37] | High signal stability ensures data integrity during long runs. |
| Linearity | Up to 2.5 AU [37] | Allows accurate analysis of both major components and trace impurities. |
The Scientist's Toolkit: Essential Components for i-PDeA
Implementing successful i-PDeA deconvolution requires more than just software. The following table outlines the essential "research reagent solutions" and hardware components that form the complete toolkit for this advanced application.
Table 3: Essential Research Reagent Solutions and Materials for i-PDeA Experiments
| Item | Function & Importance |
|---|---|
| DAD/PDA Detector | The core hardware that captures the 3D absorbance data (time, wavelength, absorbance). Must have low noise and high wavelength accuracy [37] [8]. |
| i-PDeA Software Module | The algorithm (e.g., within Shimadzu's LabSolutions) that performs the multivariate deconvolution. Essential for processing the raw DAD data [39] [38]. |
| UHPLC/HPLC System | Provides the chromatographic separation. High-pressure capability and low-dispersion systems (UHPLC) are preferred for sharper peaks and better resolution [37]. |
| Specialized Flow Cells | Optional flow cells (e.g., semi-micro, preparative, high-pressure) can be selected to optimize pathlength and volume for specific application needs (sensitivity, compatibility with UHPLC) [37]. |
| Chemically Stable Columns | High-efficiency chromatographic columns are critical to maximize any slight differences in compound retention times, providing a better starting point for deconvolution. |
| Reference Spectral Libraries | Databases of pure compound spectra are used to identify the deconvoluted spectra generated by i-PDeA, confirming the identity of each resolved component [38]. |
| RK-701 | RK-701, MF:C26H30N4O3, MW:446.5 g/mol |
| Prmt5-IN-41 | Prmt5-IN-41, MF:C22H16F5N5O2, MW:477.4 g/mol |
Implications for Pharmaceutical Research and Development
The integration of DAD technology with intelligent algorithms like i-PDeA has profound implications for drug development, particularly in enhancing efficiency and ensuring product quality and safety.
Accelerated Method Development and Analysis
A primary benefit is the significant reduction in time spent on chromatographic method development. Scientists can often shorten analysis times by accepting partial or even no chromatographic resolution for certain peaks, relying instead on i-PDeA for virtual separation [39] [41]. This accelerates analytical throughput in stability studies, pharmacokinetic analyses, and quality control testing without compromising data quality. The technology acts as a "complementary role in quantitative analysis," reducing the weeks sometimes required to achieve perfect chromatographic resolution [39].
Enhanced Impurity and Peak Purity Analysis
i-PDeA provides a powerful tool for peak purity assessment that goes beyond traditional spectral comparison. While traditional methods can flag a peak as impure, i-PDeA can actively characterize and quantify the co-eluting impurity [38]. This capability is crucial for adhering to ICH Q3A guidelines, which require the detection and reporting of impurities at levels as low as 0.05-0.10% [8]. The ability to detect a "minor single impurity even when the impurity is co-eluted with an analyte" is a key advantage for ensuring drug safety [39].
The evolution from simple UV detection to sophisticated Diode Array Detection equipped with Intelligent Peak Deconvolution Analysis marks a paradigm shift in liquid chromatography. By fully leveraging the three-dimensional data (time, wavelength, and absorbance) generated by a DAD, i-PDeA provides a powerful software-based solution to the hardware-limited challenge of chromatographic co-elution. This technical guide has detailed the principles, protocols, and applications of i-PDeA, framing it within the essential context of how DAD technology fundamentally differs from its UV detector predecessors. For researchers and drug development professionals, the adoption of these advanced deconvolution techniques translates to faster method development, more robust and informative assays, and ultimately, a stronger scientific foundation for ensuring the purity, safety, and efficacy of pharmaceutical products. As regulatory expectations continue to advance, tools like i-PDeA will become increasingly indispensable in the analytical scientist's arsenal.
The selection of an appropriate detection system is a critical step in high-performance liquid chromatography (HPLC) method development, particularly when analyzing complex matrices. Within the context of a broader thesis comparing ultraviolet (UV) spectrophotometry and diode array detection (DAD), this whitepaper explores their distinct capabilities through a practical case study. While standard UV detectors measure absorption at a single or few predefined wavelengths, DAD detectors simultaneously capture the entire spectrum from 190 to 900 nm, providing a multidimensional data set for each time point in the chromatogram [1] [42]. This fundamental difference means that a single sample injection on an HPLC-DAD system can yield not only chromatographic retention data but also the full UV-Vis spectral signature for every separated component [43]. The DAD's ability to collect spectral data across all wavelengths in real-time enables peak purity assessment and helps distinguish between co-eluting compounds with different spectral profiles, a capability absent in conventional UV detection [44] [1].
This technical guide details the development and validation of an HPLC-DAD method for the simultaneous analysis of B-complex vitamins (B1, B2, B6) in complex matrices, including pharmaceutical gummies and gastrointestinal fluids. The case study demonstrates how DAD detection provides superior analytical confidence in method development and routine analysis compared to single-wavelength UV detection.
Theoretical Foundation: Key Differences Between UV and DAD Detectors
Operational Principles
The operational distinction between a UV and a DAD detector lies in their optical geometry and data acquisition strategy.
Variable Wavelength UV (VWD) Detector: In a variable wavelength detector, light from the source is dispersed by a rotating grating, and a single wavelength is selected to pass through an exit slit [43]. This monochromatic light is then split; one beam passes through the flow cell while the other serves as a reference. This setup allows for highly sensitive measurement at one specific wavelength, which is determined before the sample is exposed [43].
Diode Array Detector (DAD or PDA): A DAD reverses this optical path. Polychromatic light first passes through the flow cell, and the transmitted light is then dispersed by a diffraction grating onto an array of photodiodes (e.g., 1024 diodes) [43] [42]. Each diode measures a narrow band of the spectrum, allowing for the simultaneous acquisition of the full UV-Vis spectrum for every data point in the chromatogram [1].
Table 1: Comparative Overview of UV (VWD) and DAD Detectors
| Feature | UV Detector (VWD) | Diode Array Detector (DAD) |
|---|---|---|
| Optical Path | Light is dispersed → Single wavelength selected → Passes through flow cell | Light passes through flow cell → Dispersed onto diode array |
| Data Output | Absorbance at one or a few pre-set wavelengths over time | Full UV-Vis spectrum (190-900 nm) at every time point |
| Primary Advantage | Higher sensitivity for targeted analysis at optimal wavelength [43] | Rapid spectral data acquisition for peak purity and identification [1] |
| Peak Purity Analysis | Not possible | Yes, by comparing spectra across a peak [44] |
| Method Development | Requires prior knowledge of analyte λ_max; time-consuming wavelength optimization | Rapid identification of optimal wavelengths and detection of co-elutions |
| Suitability | Routine analysis of simple, well-characterized mixtures | Analysis of complex or unknown mixtures, method development, impurity profiling |
Resolving Power in Complex Analyses
The superior resolving power of DAD becomes critical when analyzing complex samples. A single peak in a chromatogram obtained with a UV detector may appear pure. However, the same peak analyzed with a DAD can reveal underlying issues. By extracting spectra from the upslope, apex, and downslope of the peak and comparing them, the DAD's software can calculate a peak purity index [1]. A significant spectral difference indicates a co-eluting impurity that would remain undetected with a single-wavelength UV detector [44]. This capability is indispensable for method development and validation in regulated environments like pharmaceutical quality control.
Case Study: HPLC-DAD Method for Vitamin B Complex Analysis
Experimental Design and Workflow
The following diagram illustrates the comprehensive workflow for developing and validating the HPLC-DAD method for vitamin analysis in complex matrices.
Materials and Reagents
The successful implementation of this HPLC-DAD method relies on a set of specific research reagent solutions and materials, as detailed below.
Table 2: Essential Research Reagent Solutions and Materials
| Reagent/Material | Specification/Function |
|---|---|
| Analytical Standards | Thiamine HCl (B1), Riboflavin (B2), Pyridoxine HCl (B6); for calibration and identification [45]. |
| Internal Standard | Nicotinamide; used in quantitative NMR for comparison, valued for stability and solubility [46]. |
| Chromatography Column | Aqua C18 (250 mm × 4.6 mm, 5 µm); provides reverse-phase separation [45]. |
| Mobile Phase Components | Sodium Dihydrogen Phosphate (NaHâ‚‚POâ‚„), Methanol (HPLC grade); buffered to pH 4.95 for isocratic elution [45]. |
| Derivatization Reagent | Potassium Ferricyanide in Alkaline Medium; oxidizes non-fluorescent Vitamin B1 to fluorescent thiochrome for FLD detection [45]. |
| Extraction Sorbents | C18 Solid Phase Extraction (SPE) Cartridges; for purification and concentration of vitamins from complex gastrointestinal fluids [45]. |
| Solvents | Methanol, Ethanol; for dissolution, extraction, and dilution of samples and standards [45] [46]. |
Detailed Methodological Protocols
Sample Preparation and Extraction
For pharmaceutical gummies, a liquid/solid extraction is employed. A precisely weighed portion of the gummy is dissolved and homogenized in a suitable solvent (e.g., methanol or acidified water) via vortex mixing and sonication. The sample is then centrifuged, and the supernatant is filtered prior to HPLC injection [45]. For complex biological matrices like gastric and intestinal fluids, a solid-phase extraction (SPE) protocol is necessary. The fluid sample is loaded onto a pre-conditioned C18 SPE cartridge. After washing with a mild aqueous solution to remove interfering matrix components, the vitamins are eluted with a mixture of ethanol and water (1:1, v/v). The eluate is evaporated to dryness under a gentle stream of nitrogen and reconstituted in the HPLC mobile phase for analysis [45].
A critical step for the sensitive detection of Vitamin B1 is its pre-column derivatization into a highly fluorescent compound, thiochrome. An aliquot of the prepared sample is mixed with an alkaline solution of potassium ferricyanide. This reaction oxidizes thiamine, converting it to thiochrome, which can then be detected with high sensitivity using a fluorescence detector (FLD). For DAD analysis, this step is omitted as B1 can be detected directly by its UV absorption [45].
Instrumental Conditions and Data Acquisition
The optimized chromatographic separation is achieved using an isocratic elution with a mobile phase consisting of 70% 20 mM NaH₂PO₄ buffer (pH 4.95) and 30% methanol on an Aqua C18 column maintained at 40 °C, with a flow rate of 0.9 mL/min [45]. The DAD is configured to scan from 200 to 400 nm, with the acquisition of the full spectral data for every peak on the chromatogram. Specific wavelengths, such as 260 nm for bakuchiol or 280 nm for B vitamins, are extracted post-run for quantification, but the full spectral data remains available for peak purity analysis [46] [45].
Method Validation and Data Interpretation
Validation Parameters and Results
The developed HPLC-DAD method was rigorously validated according to International Council for Harmonisation (ICH) guidelines. The following table summarizes key validation parameters, demonstrating the method's fitness for purpose.
Table 3: HPLC-DAD Method Validation Parameters for Vitamin Analysis
| Validation Parameter | Result | Acceptance Criteria |
|---|---|---|
| Linearity (R²) | > 0.999 [45] | R² ≥ 0.998 |
| Accuracy (% Mean Recovery) | 100 ± 3% [45] | 97-103% |
| Precision (% RSD) | < 3.23% [45] | ≤ 5% |
| Limit of Detection (LOD) | Vitamin B1: 16.5 ng/mL (HPLC-UV/DAD) [45] | Signal-to-Noise ≥ 3 |
| Limit of Quantification (LOQ) | Based on calibration curve slope (σ) and standard deviation (S) using LOD = 3.3 × σ/S and LOQ = 10 × σ/S [46] | Signal-to-Noise ≥ 10 |
| Specificity | Verified via peak purity index from DAD spectra [1] | No interference from blank |
DAD-Specific Data Analysis Techniques
The power of DAD is fully realized during data interpretation. Peak purity assessment is performed by the software, which compares spectra from different points of the same chromatographic peak (front, apex, tail). A perfect match indicates a pure peak, while spectral differences reveal co-elution [1]. Furthermore, spectral library searching allows for the identification of unknown peaks by matching their acquired spectrum against a user-built or commercial library of reference spectra [42]. Advanced software functions, such as i-PDeA (Intelligent Peak Deconvolution Analysis), can even deconvolute and quantify partially co-eluting peaks based on their distinct spectral profiles, providing a "virtual separation" without the need for re-analysis under modified chromatographic conditions [1].
Comparative Discussion: The DAD Advantage in Vitamin Analysis
The application of DAD in this case study underscores its significant advantages over single-wavelength UV detection for method development and analysis in complex matrices. While UV detection would have provided quantification data, the DAD enabled:
- In-depth Method Scrutiny: During development, the DAD confirmed that the chromatographic peak for each vitamin was pure and free from co-eluting matrix interferences, a claim that cannot be substantiated with UV detection alone [44].
- Post-analysis Flexibility: After a single injection, the analyst can reprocess the data and extract chromatograms at any wavelength within the scanned range. This is invaluable for investigating unexpected impurities or for optimizing the detection wavelength without repeating the analysis [43] [42].
- Enhanced Confidence in Results: The combination of retention time and spectral matching provides a second dimension of identification, increasing confidence in the assignment of each analyte peak, which is crucial for drug development and quality control [1].
In conclusion, this HPLC-DAD method for vitamin analysis provides a robust, reliable, and information-rich analytical procedure. The integration of spectral data captured by the DAD transforms the method from a simple quantitative tool into a powerful technique for peak identification, purity assessment, and troubleshooting, thereby offering a definitive advantage over conventional UV detection in the analysis of complex matrices.
Troubleshooting Guide: Maximizing Performance and Data Quality
In pharmaceutical analysis, the choice of a detection system is a critical determinant of the reliability, sensitivity, and overall success of a method. Within this context, a fundamental understanding of the differences between the traditional UV-Vis Spectrophotometer and the Diode Array Detector (DAD) is essential. A UV-Vis detector, often called a Variable Wavelength Detector (VWD), uses a monochromator to select a single wavelength to pass through the sample flow cell. In contrast, a DAD passes a broad spectrum of light through the sample and disperses the resulting beam onto an array of diodes, allowing for the simultaneous capture of a full spectrum at every point in time [47]. This core technological difference dictates their respective capabilities and vulnerabilities regarding noise, baseline drift, and sensitivity. This guide explores these common challenges by dissecting their origins in detector design and providing targeted protocols for optimization and troubleshooting, framed within the practical needs of drug development professionals.
Detector Fundamentals and Comparative Performance
The intrinsic design of DAD and UV-Vis detectors leads to distinct performance characteristics. A key advantage of the DAD is its ability to collect full spectral data, which aids in peak purity assessment and method development. However, because the light is spread across many diodes, the light energy per diode is lower compared to the single, focused wavelength in a VWD. This can sometimes result in a lower signal-to-noise ratio (S/N) for a DAD under equivalent conditions [47]. Furthermore, the software settings for a DAD, such as bandwidth and data acquisition rate, have a profound impact on the resulting chromatogram's noise and peak appearance.
The table below summarizes a direct comparison of two analytical methods developed for the same drug substance, highlighting how detector and instrument choice influences key performance metrics.
Table 1: Comparative Method Performance: HPLC-DAD vs. UHPLC-UV for Posaconazole Analysis [12]
| Parameter | HPLC-DAD Method | UHPLC-UV Method |
|---|---|---|
| Stationary Phase | Zorbax SB-C18 (4.6 × 250 mm, 5 μm) | Kinetex-C18 (2.1 × 50 mm, 1.3 μm) |
| Mobile Phase | Gradient, Acetonitrile: 15 mM KHâ‚‚POâ‚„ | Isocratic, Acetonitrile: 15 mM KHâ‚‚POâ‚„ (45:55) |
| Flow Rate | 1.5 mL/min | 0.4 mL/min |
| Injection Volume | 20-50 μL | 5 μL |
| Run Time | 11 minutes | 3 minutes |
| Linearity (r²) | > 0.999 | > 0.999 |
| Limit of Detection (LOD) | 0.82 μg/mL | 1.04 μg/mL |
| Limit of Quantitation (LOQ) | 2.73 μg/mL | 3.16 μg/mL |
| Remarks | Longer run time, higher solvent consumption | Faster analysis, superior chromatographic separation, reduced solvent consumption |
Deconstructing Common Challenges: Origins and Solutions
Noise
Noise is the random, high-frequency fluctuation of the baseline signal. Its sources can be electronic, optical, or hydraulic.
- DAD Settings: The data acquisition rate and bandwidth are critical. A higher acquisition rate (e.g., 80 Hz) captures more data points for sharper peak definition but with increased high-frequency noise. A lower rate (e.g., 0.31 Hz) applies more filtering, smoothing the baseline but potentially missing narrow peaks [47]. A narrower bandwidth (e.g., 4 nm) increases selectivity, while a wider bandwidth (e.g., 16 nm) averages a broader range of wavelengths, which can reduce noise but may also decrease the signal for the target analyte [47].
- Instrument Hardware: An aging or failing deuterium lamp is a common source of increased noise, particularly at low UV wavelengths [48]. Pressure pulsations from a malfunctioning pump check valve can also translate into regular baseline noise. As noted in one troubleshooting case, pressure pulsations of 5 bar were considered too high, with typical values being 0.1-1% of the system pressure [48].
- Bubbles and Contamination: Air bubbles in the flow cell cause sharp, spiked noise. Particulate contamination in the solvent lines or a dirty flow cell can also create a noisy baseline [49] [50].
Baseline Drift
Drift is a slow, monotonic change in the baseline signal and is often linked to the mobile phase and environmental conditions.
- Mobile Phase Composition: In gradient elution, a drifting baseline is expected if the mobile phase components have different UV absorbance profiles. For example, a phosphate buffer is relatively transparent at low wavelengths, while a formate or acetate buffer absorbs strongly below 230 nm. If the additive is only in the aqueous solvent, the baseline will drop as the proportion of organic solvent increases [51]. Mobile phase impurities that accumulate on the column and are later eluted can also cause a large, broad drift or "ghost" peak [51].
- Temperature Instability: Changes in laboratory temperature can cause baseline drift, especially in refractive index detectors, but UV detectors are also susceptible [50]. Drafts from air conditioners or lack of column temperature control are frequent culprits [48].
- Insufficient Equilibration: In gradient methods, failing to allow sufficient time for the column and system to re-equilibrate to the initial mobile phase conditions between runs can cause drifting baselines in subsequent injections [50].
Sensitivity Issues
Sensitivity is the detector's ability to distinguish a low-concentration analyte from the baseline noise.
- Wavelength Selection: The primary factor influencing sensitivity is the selection of the detection wavelength. The optimal wavelength is at or near the absorbance maximum of the analyte, where its extinction coefficient is highest [47]. Using a sub-optimal wavelength can drastically reduce the peak response.
- Flow Cell Path Length: According to Beer's Law, absorbance is directly proportional to path length. A cell with a longer path length (e.g., 60 mm vs. 10 mm) will provide a higher signal for the same concentration [52]. Advanced systems even combine signals from two flow cells of different path lengths to achieve a high dynamic range [52].
- Chemical and Sample Factors: The use of low-purity solvents and buffers can introduce UV-absorbing impurities that raise the background, effectively reducing the signal-to-noise ratio [53] [51]. This is especially critical when working at low wavelengths (e.g., < 220 nm). In one documented case, an apparent 10-fold loss in sensitivity was traced back to an incorrect buffer type, highlighting the impact of mobile phase chemistry [53].
Experimental Protocols for Optimization and Troubleshooting
Protocol 1: Optimizing DAD Acquisition Parameters
This protocol is designed to systematically establish the optimal DAD settings for a new method, balancing sensitivity, noise, and peak integrity [47].
- Initial Setup: Set a bandwidth of 4 nm and a data acquisition rate of 10 Hz as a starting point. Do not use a reference wavelength initially.
- Wavelength Selection: Inject a standard of the target analyte and acquire a full spectrum (e.g., 190-400 nm). Determine the wavelength of maximum absorbance (λmax) for the analyte.
- Bandwidth Optimization: Using the λmax, inject the standard again with bandwidth settings of 2, 4, 8, and 16 nm. Compare the signal-to-noise ratios. Select the bandwidth that yields the best S/N. A narrower bandwidth increases selectivity, while a wider one can reduce noise.
- Data Rate Optimization: Inject the standard using data rates of 2, 5, 20, and 80 Hz. Examine the peak shape (ensuring sufficient data points across the peak) and the baseline noise. Choose the lowest data rate that still provides a smooth, well-defined peak (typically ≥ 20 data points per peak).
- Reference Wavelength (If Needed): If a significant baseline shift occurs during a gradient, a reference wavelength can be used for compensation. Use an "Isoabsorbance plot" to identify a wavelength where the analyte has near-zero absorbance but the mobile phase components still absorb. Set this as the reference wavelength with a wide bandwidth (e.g., 100 nm).
Protocol 2: Systematic Troubleshooting of Baseline Drift and Noise
This procedure provides a step-by-step approach to diagnose and correct persistent baseline issues [51] [48] [50].
Isolate the Problem:
- Disconnect the column and replace it with a zero-dead-volume union.
- Run a blank gradient (or isocratic method) while monitoring the baseline.
- If the problem persists, the issue is within the HPLC system or mobile phase. If it disappears, the problem is likely related to the column.
Evaluate the Mobile Phase:
- Prepare a fresh batch of mobile phase using high-purity solvents and water.
- Ensure the mobile phase is thoroughly degassed using an inline degasser or helium sparging.
- For gradient methods, add the same concentration of buffer or additive to both the aqueous and organic reservoirs to minimize baseline shift.
Inspect the Hardware:
- Pump: Check for unusual pressure pulsations. Clean or replace pump check valves if necessary.
- Detector Lamp: Check the lamp hours in the instrument log. For Agilent DADs, a lamp exceeding 1000-2000 hours may be near the end of its life, especially if noise is high at low UV wavelengths [48]. Run a lamp intensity test to verify performance.
- Flow Cell: To remove trapped bubbles, fit a restrictive capillary (e.g., 0.007" i.d.) on the detector outlet to apply backpressure (~5-10 bar). If contamination is suspected, flush the cell reversibly (if the design allows) with a strong solvent like isopropanol, but do not apply high pressure [49].
The logical workflow for this troubleshooting protocol is outlined in the following diagram:
The Scientist's Toolkit: Essential Research Reagents and Materials
The following table details key reagents and materials critical for achieving optimal detector performance and mitigating common issues.
Table 2: Essential Research Reagents and Materials for HPLC-DAD/UV Method Development
| Item | Function/Application | Considerations for Optimal Performance |
|---|---|---|
| HPLC-Grade Solvents | Base components of the mobile phase (e.g., water, acetonitrile, methanol). | Use high-purity grades to minimize UV-absorbing impurities, which cause baseline noise and drift, especially at wavelengths below 220 nm [51] [50]. |
| UV-Transparent Buffers & Additives | Modify mobile phase pH and ionic strength to control retention and selectivity. | Phosphate buffers are highly transparent at low UV wavelengths. Formate/acetate absorb strongly <230 nm. Use high-purity reagents to prevent contamination [53] [51]. |
| Certified Reference Standards | For system qualification, method validation, and calibration. | Used to verify detector sensitivity, linearity, and wavelength accuracy. Essential for diagnosing sensitivity loss [12] [53]. |
| Deuterium Lamp | UV light source for DAD and VWD detectors. | A failing lamp is a primary cause of increased noise and loss of sensitivity. Monitor usage hours and performance via intensity tests [48] [47]. |
| Back-Pressure Regulator | Capillary or fixed restrictor installed after the detector. | Prevents bubble formation in the flow cell by maintaining sufficient pressure, thereby eliminating bubble-related noise spikes [49] [50]. |
| Necroptosis-IN-4 | Necroptosis-IN-4, MF:C26H23F3N6O3, MW:524.5 g/mol | Chemical Reagent |
| Cdk7-IN-29 | Cdk7-IN-29, MF:C21H21N5OS, MW:391.5 g/mol | Chemical Reagent |
Navigating the challenges of noise, drift, and sensitivity in HPLC detection requires a methodical approach grounded in the fundamental principles of detector operation. For the drug development scientist, the choice between a DAD and a UV-Vis detector is not merely one of preference but of strategic application. The DAD provides unparalleled spectral information for peak identification and purity analysis, while a well-optimized VWD can offer superior signal-to-noise for specific, single-wavelength applications. By understanding the root causes of these issues—from the intricacies of DAD acquisition settings to the paramount importance of mobile phase quality and system maintenance—researchers can develop robust, reliable, and sensitive analytical methods. Mastering this aspect of the analytical workflow is indispensable for ensuring the quality and efficacy of pharmaceutical products.
Optimizing Wavelength Selection for Sensitivity and Selectivity
In the realm of pharmaceutical analysis and drug development, the precision of analytical results is fundamentally dependent on the optimal configuration of detection systems. Within the context of distinguishing between traditional UV spectrophotometers and Diode Array Detectors (DAD), wavelength selection emerges as a pivotal parameter directly influencing both sensitivity and selectivity. While both technologies operate on the principles of ultraviolet and visible light absorption, their approaches to wavelength selection, data acquisition, and subsequent information output differ significantly, necessitating distinct optimization strategies.
The fundamental operating principle hinges on the Beer-Lambert Law, which states that the absorbance of light by a sample is directly proportional to the concentration of the absorbing species and the pathlength of the light through the sample [8]. A compound's molar absorptivity (ε), a wavelength-dependent property, determines how strongly it absorbs light. Selecting the wavelength at or near a compound's maximum absorbance wavelength (λmax) typically yields the highest sensitivity [3]. However, in complex mixtures, the quest for maximum sensitivity must be balanced against the need for selectivity—the ability to distinguish the target analyte from interfering substances. This balance forms the core challenge in wavelength optimization.
Fundamental Detector Principles and Their Impact on Wavelength Strategy
Single/Wariable Wavelength UV Detectors
A traditional Variable Wavelength Detector (VWD) functions by first isolating a specific, user-selected wavelength of light before it passes through the sample flow cell [26] [3]. This is achieved through an optical system comprising a deuterium lamp (D2) for the UV range (and often a tungsten lamp for the visible range), a monochromator with a movable diffraction grating, and an exit slit [8]. The grating rotates to select the desired wavelength, which then illuminates the entire flow cell. This design is mechanically elegant but possesses an inherent limitation: it can only collect data at one wavelength (or a limited number of sequentially scanned wavelengths) at a time.
Diode Array Detectors (DAD/PDA)
In contrast, a Diode Array Detector (DAD), also known as a Photodiode Array (PDA), employs a reversed optics design. Here, broad-spectrum light from the source passes through the flow cell first. The transmitted light is then dispersed by a fixed diffraction grating onto an array of hundreds of individual photodiodes (e.g., 1024), each measuring a narrow band of the spectrum simultaneously [3] [8]. This key difference allows the DAD to capture the entire UV-Vis spectrum for every data point in the chromatogram, producing a three-dimensional data set (absorbance, time, and wavelength).
Table 1: Core Operational Differences Between VWD and DAD
| Feature | Variable Wavelength Detector (VWD) | Diode Array Detector (DAD) |
|---|---|---|
| Optical Path | Wavelength selection before the flow cell | Wavelength separation after the flow cell |
| Data Output | Chromatogram at one or a few pre-selected wavelengths | Full spectrum at every time point (3D data: time, wavelength, absorbance) |
| Wavelength Flexibility | Wavelength must be chosen before analysis; changes require re-injection | Wavelength for processing and quantification can be chosen after data acquisition |
| Primary Applications | Routine quantitative analysis where spectral identity is confirmed | Method development, peak purity assessment, identification of unknown compounds |
The following diagram illustrates the core logical workflow for selecting and optimizing a detection strategy based on analytical goals, highlighting the divergent paths for VWD and DAD.
Practical Protocols for Wavelength Optimization
Determining the Maximum Absorbance Wavelength (λmax)
The first step in optimizing sensitivity is to identify the λmax for each analyte of interest.
Protocol:
- Sample Preparation: Prepare standard solutions of the pure analyte at a known concentration in a suitable solvent that is transparent in the spectral region of interest. Use of high-purity, spectrophotometric-grade solvents is critical to avoid interference from impurities [54].
- Spectral Scanning: Using a DAD, acquire a full spectrum of the standard solution across a relevant wavelength range (e.g., 190-400 nm). If using a VWD, this involves running a wavelength scan in a static or flow-through mode.
- Identification of λmax: From the resulting spectrum, identify the wavelength(s) at which the analyte exhibits peak absorbance. This wavelength will provide the highest theoretical sensitivity for quantification due to the highest signal-to-noise ratio at a given concentration [3].
Enhancing Selectivity in Complex Mixtures
In real-world samples containing multiple components, λmax may not be the most selective wavelength.
Protocol:
- Acquire Spectra of All Components: Obtain individual spectra for the target analyte and all known or potential interferents (e.g., excipients, degradation products, other APIs) using the DAD's capability.
- Spectral Overlay and Analysis: Overlay these spectra using the detector's software. Identify a wavelength where the target analyte has significant absorbance, but the interferents have minimal absorbance. This "window of selectivity" can be at a slope of the target's absorption band, trading a marginal loss in sensitivity for a significant gain in selectivity.
- Multi-Wavelength Monitoring: A key advantage of the DAD is the ability to process data at multiple wavelengths from a single injection. Quantification can be performed at the most sensitive wavelength, while confirmatory ratios or purity checks can be used at other wavelengths [47].
Advanced Strategy: Employing Chemometric Models
For complex formulations with severely overlapping spectral profiles, advanced mathematical techniques are required. A recent study on the simultaneous analysis of meloxicam and rizatriptan in a newly approved FDA drug Symbravo exemplifies this approach [55]. The significant spectral overlap was resolved using chemometric models including Principal Component Regression (PCR), Partial Least Squares (PLS) optimized with genetic and firefly algorithms (GA-PLS, FA-PLS), and Multivariate Curve Resolution–Alternating Least Squares (MCR-ALS) [55]. These models utilize the entire spectral data set from the DAD to deconvolute the contribution of each analyte, maximizing both selectivity and sensitivity without physical separation.
Table 2: Key Research Reagents and Materials for Advanced Spectrophotometric Analysis
| Reagent/Material | Function & Importance | Example from Research |
|---|---|---|
| High-Purity Solvents | Minimizes background absorbance and interference; essential for baseline stability and low-noise measurements. | Use of a binary water: ethanol (1:1, v/v) system as a green solvent [55]. |
| Chemometric Software | Enables deconvolution of overlapping spectral signals from multi-component mixtures. | Application of MCR-ALS, GA-PLS, and FA-PLS models [55]. |
| Reference Standards | Certified materials with known absorbance used for instrument validation and wavelength accuracy verification. | Use of holmium oxide filters for wavelength calibration [54]. |
| Quartz Flow Cells/Cuvettes | Provides transparency across the UV-Vis range; essential for measurements below 300 nm. | Matched 1.0 cm quartz cuvettes for high-precision measurements [55]. |
| Optical Filters (e.g., KCl) | Used during calibration to identify and correct for stray light, a key source of deviation from Beer's Law. | Calibration against potassium chloride (KCl) for UV range stray light reduction [54]. |
Quantitative Impact of Instrument Parameters
Beyond wavelength selection, other instrumental parameters can be fine-tuned to optimize the final output.
Bandwidth
The bandwidth is the narrow range of wavelengths on either side of the target wavelength that the detector actually measures and averages. A narrow bandwidth (e.g., 2 nm) increases selectivity by ensuring a unique wavelength for the target analyte. A larger bandwidth (e.g., 10-30 nm) results in lower noise and can sometimes improve the signal-to-noise ratio, but may reduce selectivity by including light absorbed by interferents [47]. The ideal bandwidth is typically the range of wavelength at 50% of the spectral feature used for determination.
Data Acquisition Rate
Expressed in Hertz (Hz), the data acquisition rate determines how many data points are collected per second across the peak. A higher frequency (e.g., 80 Hz) results in more data points, increased peak resolution (sharper peaks), and more accurate quantification of narrow chromatographic peaks, but it also increases baseline noise and data file size. A lower frequency is sufficient for broader peaks and helps reduce noise and file size [47]. The setting must balance the need for peak fidelity with data management.
Table 3: Optimization Guide for Key Detector Parameters
| Parameter | Impact on Sensitivity | Impact on Selectivity | Optimization Guideline |
|---|---|---|---|
| Wavelength | Directly proportional to molar absorptivity (ε) at the chosen λ. | Selecting a unique absorption region for the analyte enhances it. | Choose λmax for max sensitivity; choose a selective wavelength away from interferents' λmax. |
| Bandwidth | Wider bandwidth can lower noise, potentially improving S/N. | Narrower bandwidth increases specificity for the target wavelength. | Use narrower bandwidth for resolution of close spectral features; wider for lower noise. |
| Data Acquisition Rate | Minimal direct impact on peak height. | Higher rate improves temporal resolution of closely eluting peaks. | Use higher rate (≥20 Hz) for fast, narrow peaks; lower rate (≈1-5 Hz) for broad peaks. |
| Pathlength | Directly proportional to absorbance (Beer's Law). | No direct impact. | Increase pathlength (e.g., from 10 mm to 20 mm) for higher sensitivity if flow cell pressure allows. |
Optimizing wavelength selection is a fundamental process that bridges the theoretical principles of spectrophotometry and the practical demands of modern pharmaceutical analysis. The choice between a Variable Wavelength Detector and a Diode Array Detector dictates the strategy: the VWD offers a targeted, often more cost-effective approach for routine analysis, while the DAD provides unparalleled flexibility and comprehensive data for method development, troubleshooting, and ensuring data integrity through peak purity assessment. As demonstrated by cutting-edge research, the combination of DAD technology with advanced chemometric models represents the forefront of analytical science, enabling the precise and simultaneous quantification of complex drug combinations. By systematically applying the protocols and principles outlined in this guide—from identifying λmax and managing spectral interferences to fine-tuning instrumental parameters—researchers and drug development professionals can consistently achieve the optimal balance of sensitivity and selectivity required for robust and reliable analytical results.
Maintenance Best Practices for Lamp Life and Flow Cell Integrity
The maintenance requirements for spectroscopic detectors are fundamentally shaped by their underlying technology and operational principles. Within the context of comparing Ultraviolet (UV) spectrophotometers and Diode Array Detectors (DAD), understanding their distinct optical designs is crucial for developing effective maintenance protocols. A conventional UV detector typically utilizes a monochromatic optical system, where light from a source is passed through a monochromator to select a single wavelength, which then passes through the sample to a single photomultiplier tube [56]. In contrast, a DAD employs a polychromatic optical system, where light from the source passes through the sample, and the resulting transmitted light is then dispersed by a grating onto a diode array, allowing for simultaneous multi-wavelength detection [56]. This core architectural difference influences not only analytical capabilities but also the maintenance focus, particularly concerning the light source and the sample flow cell.
This guide provides an in-depth technical overview of the best practices for maintaining two critical components common to both systems—the lamp and the flow cell—while contextualizing these procedures within the distinct operational frameworks of UV and DAD detectors. A disciplined maintenance regimen is essential for ensuring data integrity, operational consistency, and cost-effective laboratory operations in research and drug development.
Fundamental Differences Between UV and DAD Detectors
While both UV and DAD detectors serve the function of measuring light absorption by a sample, their methodological differences necessitate nuanced maintenance approaches. The table below summarizes their core distinguishing features.
Table 1: Key Technical Differences Between UV and DAD Detectors
| Feature | UV/VIS Spectrophotometer | Diode Array Detector (DAD) |
|---|---|---|
| Optical Path | Single-wavelength, pre-dispersion (Source → Monochromator → Sample) [56] | Multi-wavelength, post-dispersion (Source → Sample → Grating → Diode Array) [56] |
| Detection Element | Single photomultiplier tube (PMT) or photodiode [57] [58] | Linear array of photodiodes (e.g., 512 elements) [56] |
| Data Output | Absorbance at one wavelength at a time | Full spectrum (e.g., 199-618 nm) per data point [56] |
| Suitability for Method Development | Lower; method development can be time-consuming as it requires sequential wavelength measurements. | Higher; rapid spectral acquisition enables peak purity assessment and optimal wavelength selection in a single run [56] [12] |
| Maintenance Focus | Lamp life, monochromator integrity, and flow cell. | Lamp life, flow cell, and diode array performance/stability. |
The polychromatic design of a DAD, often featuring a closed optical system that integrates the light source, optical grating, and diode array, can enhance mechanical stability and reduce external contamination [56]. However, this integrated design can also make component-specific access more complex during servicing. The sensitivity of the detection elements also varies; DADs rely on a fixed silicon diode array, while advanced UV/VIS-NIR systems may use PMTs or other detectors optimized for specific wavelength ranges, such as near-infrared (NIR), which have their own handling and maintenance considerations [57] [58].
Best Practices for Maximizing Lamp Life and Performance
The light source is the cornerstone of any optical detector, and its longevity is a primary determinant of analytical consistency and operational cost.
Lamp Types and Operational Principles
Common lamps include Deuterium Arc Lamps for the UV range and Tungsten-Halogen Lamps for the visible to NIR range. The lifespan of these lamps is finite and heavily influenced by operational patterns. Deuterium lamps have a typical rated life of 1,000 to 2,000 hours, while tungsten-halogen lamps can last 2,000 hours or more. Frequent on/off cycling is the most significant factor that shortens lamp life, as the sudden current surge and thermal stress during ignition degrade the filament and electrodes.
Quantitative Data on Lamp Usage and Lifespan
Adherence to the following operational guidelines is critical for maximizing lamp utility and preventing premature failure.
Table 2: Lamp Life Optimization Guidelines
| Practice | Recommended Action | Quantitative Impact / Benchmark |
|---|---|---|
| On/Off Cycling | Minimize cycling; allow a minimum cool-down period of 30 minutes before re-igniting. | A single cycle causes wear equivalent to several hours of continuous operation. |
| Operational Hours | Track and document cumulative usage. Logs should be maintained with each use. | Plan for replacement upon approaching the manufacturer's rated lifespan (e.g., 1,000-2,000 hours). |
| Ignition Count | Monitor the number of ignitions via instrument software. | High ignition counts significantly reduce total usable hours. |
| Stabilization Time | Allow a 15-30 minute warm-up period after ignition before collecting data. | This ensures stable energy output and photometric accuracy. |
| Optical Inspection | Periodically check for clouding or deposits on the lamp envelope (when cool and powered off). | Contamination indicates imminent failure and can affect baseline noise. |
Experimental Protocol: Monitoring Lamp Performance and Photometric Accuracy
Objective: To regularly verify the health and performance of the detector's light source by assessing its photometric accuracy and spectral energy output over time. Background: A degrading lamp will show reduced energy output, particularly at the extremes of its spectral range (e.g., in the deep UV for a deuterium lamp), and may introduce increased baseline noise, compromising data quality [58].
Materials:
- UV-Vis spectrophotometer or DAD-equipped HPLC system
- Appropriate certified reference materials (e.g., holmium oxide or didymium glass filters for wavelength verification; neutral density filters or potassium dichromate solutions for photometric accuracy) [58]
- Cuvettes or flow cell, as applicable
Methodology:
- Baseline Scan: After the prescribed warm-up period, perform a baseline correction or blank scan over the entire intended operational wavelength range (e.g., 200-800 nm).
- Energy Scan: Acquire a spectrum of the air or solvent background. Note the absolute energy values, particularly at the wavelength extremes. A steady decline in energy at specific wavelengths (e.g., below 230 nm) is a key indicator of lamp aging.
- Photometric Accuracy Test:
- Prepare a standard solution of known concentration and absorbance, such as potassium dichromate in perchloric acid.
- Measure the absorbance of the standard at its peak wavelength(s).
- Compare the measured absorbance values against the certified values. The deviation should be within the instrument's specifications (e.g., <±0.01 AU).
Data Analysis: Plot the energy output and photometric values over multiple sessions. A trend of decreasing energy or a systematic drift in photometric accuracy signals that lamp replacement should be scheduled.
Best Practices for Ensuring Flow Cell Integrity
The flow cell is the interface where the sample interacts with the light path. Its cleanliness and integrity are paramount for maintaining signal-to-noise ratio and chromatographic fidelity.
Flow Cell Construction and Failure Modes
A typical flow cell consists of a liquid cavity with precisely aligned quartz or silica windows. Its primary failure modes include:
- Clogging: Caused by particulate matter or precipitated analytes from the mobile phase or sample.
- Fouling: The adsorption of contaminants onto the internal surfaces or windows, leading to increased background noise and reduced light transmission.
- Physical Damage: Scratching of the optical windows from abrasive particles or damage from excessive pressure.
- Seal Degradation: Leaks from worn-out seals or gaskets, which can lead to cross-contamination and pressure drops.
Experimental Protocol: Flow Cell Clean-in-Place (CIP) and Performance Verification
Objective: To establish a standardized procedure for cleaning and verifying the performance of the detector flow cell without disassembling the system, thus minimizing downtime and the risk of damage. Background: Regular cleaning prevents the accumulation of contaminants that can cause baseline drift, ghost peaks, and reduced sensitivity [12].
Materials:
- HPLC-grade water
- Suitable solvents for washing (e.g., nitric acid solution for inorganic residues, isopropanol for organic residues, 6M guanidine hydrochloride for protein-bound residues)
- Syringe or syringe pump for manual flushing (if applicable)
- A solution of sodium nitrite or acetone for verifying optical path integrity
Methodology:
- Initial Flush: After the analytical run, flush the system with a compatible solvent (e.g., water or a water/methanol mixture at 50/50) for 30-60 minutes at a low flow rate (e.g., 0.5 mL/min) to remove the bulk of the mobile phase and sample residues.
- Directed Cleaning: Based on the nature of the contaminant, select and pump an appropriate cleaning solution through the flow cell for 60 minutes.
- For organic residues: Use 20-30% isopropanol.
- For proteinaceous residues: Use 6M guanidine hydrochloride or a 0.1M sodium hydroxide solution (ensure compatibility with system materials).
- For strong adsorption: A series of washes with water, methanol, and a weak acid like 1% nitric acid may be required.
- Final Rinse: Thoroughly flush the system with HPLC-grade water for at least 30 minutes to remove all traces of the cleaning agent, followed by a final rinse with the starting mobile phase to re-equilibrate the system.
- Performance Verification:
- Pump the starting mobile phase or water through the cell and monitor the baseline.
- A stable baseline with low noise (e.g., <±50 µAU over 30 minutes) indicates successful cleaning.
- For a more rigorous test, inject a standard with a known signal-to-noise ratio and confirm that the performance meets the required system suitability criteria.
Data Analysis: Compare the baseline noise and the signal-to-noise ratio of the standard before and after cleaning. Document any ghost peaks observed in a blank injection post-cleaning.
The Scientist's Toolkit: Essential Research Reagent Solutions
The following table details key reagents and materials referenced in the maintenance protocols, along with their specific functions.
Table 3: Essential Reagents and Materials for Detector Maintenance
| Reagent/Material | Function / Explanation |
|---|---|
| Potassium Dichromate Standard | A certified reference material used for verifying the photometric accuracy of the detector. Its absorbance at specific wavelengths is well-characterized, allowing for calibration and performance checks [12]. |
| Holmium Oxide Filter | A solid-state wavelength standard used for wavelength calibration and verification. Its sharp absorption peaks at defined wavelengths ensure the detector's wavelength scale is accurate [58]. |
| HPLC-Grade Water & Solvents | Used for preparation of solutions, final rinsing of flow paths, and as a weak cleaning agent. Their high purity is critical to avoid introducing contaminants that can foul the flow cell or optics. |
| Isopropanol (20-30%) | An organic solvent used in the Clean-in-Place protocol to remove non-polar organic residues and contaminants from the flow cell and fluidic path. |
| Nitric Acid (1%) | A dilute acid solution used to remove inorganic deposits and residues from the flow cell. It is particularly effective for dissolving metal ions or salts [12]. |
| Guanidine Hydrochloride (6M) | A powerful denaturant used in the Clean-in-Place protocol to remove strongly adsorbed biological molecules, such as proteins, from the flow cell surfaces. |
A proactive and scientifically-grounded maintenance strategy is non-negotiable for the reliable operation of UV and DAD detection systems. While the core components—the lamp and flow cell—are universal, their maintenance is contextualized by the distinct optical designs of these detectors. By understanding these differences and implementing rigorous, documented protocols for lamp performance monitoring and flow cell integrity management, researchers and drug development professionals can ensure the generation of high-quality, reliable data. This disciplined approach directly supports robust analytical results, reduces unexpected downtime, and optimizes the total cost of ownership, thereby contributing significantly to the efficiency and success of scientific research.
Diagrams
Detector Optical Paths Compared
Maintenance Decision Workflow
In the field of high-performance liquid chromatography (HPLC), the choice of detection system is pivotal to the success of qualitative and quantitative analysis. Within the broader research on the differences between UV spectrophotometers and Diode Array Detectors (DAD), understanding their specific limitations and pitfalls is essential for accurate analytical outcomes. Ultraviolet (UV) detectors and Diode Array Detectors (DAD, also known as Photodiode Array or PDA) represent two foundational technologies for detecting chromophoric compounds after chromatographic separation [8]. While both detectors operate on the principle of ultraviolet-visible (UV-Vis) light absorption, their design philosophies and operational capabilities create distinct advantages and limitations [1] [8].
The fundamental difference lies in their optical configuration: conventional UV detectors are single-wavelength devices that use a monochromator to select a specific wavelength before it passes through the sample, while DAD detectors expose the sample to polychromatic light and then disperse the transmitted light across an array of diodes to capture the entire spectrum simultaneously [8] [59]. This technical distinction leads to significant practical implications for method development, specificity, and the critical ability to recognize undetected components and solvent-related artifacts in pharmaceutical and natural product analysis [60] [12]. This guide examines the core limitations inherent to these detection systems, providing researchers with methodologies to identify and mitigate potential analytical pitfalls.
Fundamental Principles and Instrumental Differences
Operating Mechanisms and Light Path Configuration
The operational distinction between UV and DAD detectors fundamentally influences their application potential and limitations. A variable wavelength UV detector employs a pre-dispersive optical arrangement. In this configuration, light from a broad-spectrum source (typically a deuterium or tungsten lamp) passes through a monochromator, which selects a specific wavelength before it reaches the flow cell containing the sample [8] [59]. This design means that the sample is exposed only to monochromatic light, and the output is a simple chromatogram showing signal intensity versus time at a single, user-defined wavelength.
In contrast, a Diode Array Detector (DAD) utilizes a post-dispersive design. Here, polychromatic light from the source passes first through the sample flow cell, and the transmitted beam is then dispersed by a diffraction grating onto an array of photodiodes (typically 512 or 1024 elements) [8]. This allows for the simultaneous capture of the entire UV-Vis spectrum (typically 190–600 nm or broader) for each data point collected during the chromatographic run [1]. The result is a three-dimensional data set: absorbance as a function of both time and wavelength.
The following diagram illustrates the critical difference in the light path of these two systems:
Comparative Strengths and Limitations in Design
The core instrumental difference leads directly to distinct performance characteristics. The DAD provides comprehensive spectral information for each peak, enabling peak purity analysis and library searching for compound identification [1] [8]. Because it captures all wavelengths simultaneously, it is ideal for method development and for analyzing samples with unknown constituents. However, this post-dispersive design typically results in a lower signal-to-noise ratio compared to a UV detector set to a single wavelength, as the light intensity is divided among many diodes [59]. Furthermore, the exposure of the sample to full-spectrum, high-intensity light can cause photodegradation of sensitive analytes during measurement [59].
The Variable Wavelength UV Detector, by focusing its energy on a single wavelength, generally offers superior sensitivity and lower noise for quantitative applications when the target analyte's optimal wavelength is known in advance [8] [59]. Its simpler optical path and lack of a complex diode array also often make it a more economical and robust choice for dedicated, high-precision quantitative methods in quality control environments where spectral confirmation is not required [61]. Its primary weakness is the lack of spectral data, making it impossible to retrospectively check for co-eluting peaks or confirm a peak's identity based on its spectrum without reinjecting the sample [1].
Table 1: Fundamental Operational Comparison of UV and DAD Detectors
| Characteristic | Variable Wavelength UV Detector | Diode Array Detector (DAD) |
|---|---|---|
| Optical Design | Pre-dispersive (monochromator before sample) | Post-dispersive (polychromatic light through sample first) |
| Spectral Data | Single wavelength per run; no spectral information | Full UV-Vis spectrum for every data point |
| Primary Strength | Higher sensitivity for quantitation at a known λ | Peak purity assessment, compound identification, method development |
| Key Limitation | Inability to detect co-eluting peaks without spectral data | Lower signal-to-noise ratio; potential for sample photodegradation |
Core Limitations and Associated Pitfalls
Recognizing Undetected and Co-eluting Components
The inability to reliably recognize co-eluting substances represents the most significant pitfall in HPLC analysis and is an area where UV and DAD detectors differ profoundly.
Pitfall with UV Detectors: A single-wavelength UV detector provides a one-dimensional chromatogram. A peak that appears symmetrical and pure may, in fact, be a combination of two or more compounds with similar retention times. Without spectral information, there is no built-in mechanism to challenge this assumption. This can lead to significant quantitative errors, where the concentration of the target analyte is overestimated, and the presence of an impurity or degradant is completely missed [8]. This limitation is particularly dangerous in stability-indicating methods or in the analysis of complex natural product extracts, where the likelihood of co-elution is high [60].
Advantage and Limitation of DAD: The DAD provides a powerful tool to mitigate this risk through peak purity assessment. By comparing the UV spectra taken from the upslope, apex, and downslope of a chromatographic peak, the software can calculate a purity index or angle [1] [8]. A significant difference in spectra across the peak indicates a potential co-eluting compound. However, a critical limitation remains: DAD cannot distinguish between co-eluting compounds with nearly identical UV spectra [1]. For example, neutral cannabinoids (e.g., THC and CBD) have very similar spectral profiles, and co-elution of these would be difficult to detect by spectral comparison alone [1]. Furthermore, the sensitivity of peak purity analysis is limited by the relative concentrations and absorptivities of the co-eluting compounds; a minor impurity may not significantly alter the composite spectrum.
Advanced DAD software features, such as peak deconvolution (e.g., Shimadzu's i-PDeA), can mathematically resolve some co-eluting peaks based on their differing spectral profiles, provided the spectra are sufficiently distinct [1]. This represents a significant improvement but is still not as definitive as full chromatographic separation.
Solvent Cutoff and Mobile Phase Transparency
The selection of HPLC solvents is constrained by their UV transparency, which directly impacts the choice of detection wavelengths and the baseline noise of the analysis.
The Solvent Cutoff Pitfall: The UV cutoff is defined as the wavelength at which the absorbance of a pure solvent in a standard 1 cm pathlength cell reaches an absorbance of 1.0 AU [62]. Operating the detector at or near this cutoff wavelength results in high baseline noise and poor detection sensitivity because the mobile phase itself becomes a significant absorber of light, leaving little energy for the detector to measure the analyte [8] [62]. A common pitfall is developing a method at a wavelength that is feasible with a particular solvent blend but becomes unusable if the solvent brand or quality changes slightly, affecting its UV purity.
Practical Implications for Method Development: This limitation necessitates careful planning. For example, if a method requires detection at 220 nm, the use of acetone (cutoff 330 nm) or THF (cutoff 230 nm) would be disastrous, resulting in a noisy, unstable baseline. Acetonitrile (cutoff 190 nm) or methanol (cutoff 205 nm) would be appropriate choices [62]. This constraint is identical for both UV and DAD detectors, but the DAD's ability to scan lower wavelengths can be advantageous for scouting the optimal wavelength for analysis while respecting the solvent cutoff.
Table 2: UV Cutoff Wavelengths for Common HPLC Solvents [62]
| Solvent | λ Cutoff (nm) |
|---|---|
| Acetonitrile (ACN) | 190 |
| Water | 190 |
| Methanol (MeOH) | 205 |
| Isopropanol (IPA) | 205 |
| Ethanol | 210 |
| n-Propanol | 210 |
| Isopropyl Ether | 220 |
| Tetrahydrofuran (THF) | 230 |
| Diethylamine | 275 |
| Acetone | 330 |
Dependence on Chromophores and Variable Response
A fundamental limitation of both UV and DAD detection is their dependence on the presence of a chromophore—a structural moiety in a molecule that absorbs UV or visible light.
The Problem of "UV-Invisible" Compounds: Compounds lacking a suitable chromophore, such as alkanes, sugars, or many lipids, will yield little to no detector response [8]. This can lead to a "false negative" where a component is present in the sample but remains undetected in the chromatogram. This is a critical pitfall in impurity profiling or when analyzing complex mixtures of unknown composition.
Variable Response and Quantitation Errors: The detector response (absorbance) for a compound is governed by the Beer-Lambert Law (A = ε * b * c), where ε is the molar absorptivity [2]. Different compounds have vastly different absorptivities at the same wavelength. Therefore, a UV or DAD detector is not a universal "mass" detector. A small peak in the chromatogram could belong to a major component with a weak chromophore, while a large peak could represent a minor but highly UV-absorbing impurity [8]. This can severely mislead the interpretation of chromatographic data, particularly for natural product extracts where the composition is not fully known [60].
For analytes with low or no UV absorptivity, alternative detection techniques such as Evaporative Light Scattering (ELSD), Charged Aerosol (CAD), or Refractive Index (RID) detection are necessary [8]. Mass spectrometry (MS) is the most powerful alternative, offering superior sensitivity and universal detection capabilities, though at a significantly higher cost and operational complexity [63].
Methodologies for Identification and System Suitability
Protocol for Peak Purity Assessment Using DAD
Peak purity analysis is a critical procedure to ensure the specificity of an HPLC method and to uncover undetected co-eluting peaks.
Principle: The fundamental principle is that a pure chromatographic peak should have an invariant UV spectrum throughout its elution. Any change in the spectrum across the peak (from the upslope to the apex to the downslope) suggests the presence of multiple, co-eluting compounds [1] [8].
Experimental Workflow:
- Chromatographic Separation: Perform the HPLC or UHPLC separation using the developed method with DAD detection set to acquire the full UV spectrum range (e.g., 190–400 nm) for the entire run [12].
- Data Acquisition and Peak Selection: After the run, process the data and select the chromatographic peak of interest for purity analysis.
- Spectral Comparison: The DAD software automatically extracts and normalizes the UV spectra from multiple points across the selected peak (typically the upslope, apex, and downslope).
- Purity Calculation: The software compares these spectra algorithmically and calculates a purity index or purity angle. The purity angle should be less than the purity threshold for the peak to be considered pure.
- Interpretation: A low purity index (or a purity angle greater than the threshold) indicates a spectral mismatch, signaling a potential co-eluting impurity. The analyst should then investigate method modifications to improve chromatographic resolution.
The following flowchart outlines this decision-making process:
Limitations of the Protocol: It is crucial to remember that this technique can only detect co-eluting compounds that have different UV spectra. It cannot identify impurities with spectra identical to the main analyte, and its sensitivity is reduced for impurities that are very low in concentration or have very similar retention times and spectra [1].
Protocol for Wavelength Selection and Solvent Verification
Selecting an optimal detection wavelength and verifying mobile phase compatibility are fundamental to robust method development.
Experimental Workflow:
- Preliminary Spectral Scan: If a DAD is available, inject a standard of the target analyte and acquire its full UV spectrum. Identify the wavelength of maximum absorbance (λmax) [2]. If only a UV detector is available, consult literature or run the standard at several different wavelengths to empirically determine the best one.
- Assess Solvent Compatibility: Cross-reference the chosen λmax with the UV cutoff table of the mobile phase solvents (see Table 2). Ensure the selected wavelength is at least 20-40 nm above the solvent cutoff to maintain a stable baseline with low noise [62]. For example, if using methanol (cutoff 205 nm), a λmax of 230 nm is acceptable, but 210 nm may be problematic.
- Confirm Specificity: For a multi-component assay, check the spectra of all analytes to find a wavelength that provides adequate response for all, or consider using multiple wavelengths or a wavelength program during the run.
- Baseline Noise Test: Before sample analysis, run a blank injection (mobile phase) and observe the baseline at the selected wavelength. High baseline drift or noise indicates a potential solvent mismatch, contamination, or that the wavelength is too close to the solvent cutoff.
The Scientist's Toolkit: Essential Research Reagents and Materials
The following table details key materials and their functions critical for developing and troubleshooting HPLC methods with UV or DAD detection.
Table 3: Essential Research Reagent Solutions for HPLC-UV/DAD Analysis
| Reagent/Material | Function & Application Notes |
|---|---|
| HPLC-Grade Solvents (Acetonitrile, Methanol, Water) | Used as mobile phase components. Low UV absorbance is critical, especially for acetonitrile (cutoff 190 nm) and methanol (cutoff 205 nm), to enable low-wavelength detection and minimize baseline noise [62] [12]. |
| Buffer Salts (e.g., Potassium Dihydrogen Phosphate, Ammonium Acetate) | Used to control mobile phase pH and ionic strength. Must be HPLC-grade and volatile if coupling to MS. UV transparency is essential [12]. |
| Analytical Reference Standards | Highly purified compounds used for peak identification, method development, and calibration. Essential for confirming retention times and spectral profiles [12]. |
| Quartz Flow Cells | The sample holder in the detector. Quartz is required for UV transparency below 350 nm; plastic or glass cuvettes are unsuitable for UV detection [2]. |
| Certified HPLC Columns (e.g., C18, C8) | The stationary phase for chromatographic separation. Selection (e.g., Zorbax SB-C18, Kinetex-C18) impacts resolution, peak shape, and analysis time, directly influencing the ability to separate target analytes from potential interferents [12]. |
| Photodiode Array Detector (DAD) | A detection system capable of capturing full UV-Vis spectra simultaneously. It is the tool of choice for peak purity analysis, identification of unknowns via spectral libraries, and method development [1] [8]. |
| Tuning and Validation Kits | Manufacturer-provided solutions containing specified compounds (e.g., caffeine, uracil) for performance verification of the HPLC system, including detector wavelength accuracy, baseline noise, and flow rate accuracy. |
Navigating the limitations of UV and DAD detection systems is a critical competency for researchers in drug development and natural product analysis. The single-wavelength UV detector, while highly sensitive and robust for specific quantitative tasks, carries the inherent risk of missing co-eluting components due to its lack of spectral information. The DAD detector directly addresses this pitfall with its peak purity assessment capability but introduces trade-offs in sensitivity, cost, and potential for photodegradation. Both techniques are fundamentally constrained by solvent cutoff wavelengths and their inherent blindness to compounds lacking suitable chromophores.
A thorough understanding of these principles, combined with the systematic application of the described experimental protocols for peak purity assessment and wavelength selection, empowers scientists to recognize and mitigate these pitfalls. Ultimately, this knowledge ensures the generation of reliable, high-quality chromatographic data, forming a solid foundation for scientific research and regulatory compliance in pharmaceutical analysis. When the limitations of UV/DAD detection are insurmountable for a given application, the researcher is better equipped to justify the transition to more advanced detection techniques such as mass spectrometry.
In the landscape of analytical chemistry, Liquid Chromatography with Ultraviolet or Diode Array Detection (LC-UV/DAD) has demonstrated remarkable persistence, even as Liquid Chromatography-Mass Spectrometry (LC-MS) has been heralded as the superior technology. LC-MS offers unparalleled sensitivity and compound identification capabilities, leading to predictions that it would largely replace LC-UV/DAD in analytical laboratories [64] [11]. However, LC-UV/DAD remains a cornerstone technique, particularly in regulatory-driven environments like pharmaceutical quality control, due to its exceptional reliability, quantitative precision, and immunity to certain matrix effects that plague MS detection [11].
A primary technical challenge driving the continued use of LC-UV/DAD is the phenomenon of ion suppression in LC-MS, which can severely compromise quantitative accuracy [65] [11]. This technical review examines the scientific basis for the persistence of LC-UV/DAD, detailing the fundamental principles, directly comparing the techniques, and providing methodologies to evaluate and address the critical issue of ion suppression in mass spectrometry.
Fundamental Principles: UV/DAD versus MS Detection
LC-UV/DAD Operation and Capabilities
Liquid Chromatography (LC) separates the components of a mixture, which are then detected as they elute from the column. In UV and DAD detectors, analysis is based on a well-understood physical property: the absorption of ultraviolet light.
- Operating Principle: These detectors measure the attenuation of light as it passes through the flow cell. Absorbance (A) follows the Beer-Lambert law, being proportional to the analyte's molar absorptivity (ε), the pathlength (b), and its concentration (c) [8].
- Detection Process: A lamp (typically deuterium) provides a light source. In a variable wavelength detector (VWD), a monochromator selects a specific wavelength to pass through the flow cell and onto a single photodiode. A DAD, conversely, passes polychromatic light through the flow cell, then disperses it onto an array of hundreds of photodiodes, capturing the entire spectrum simultaneously [8].
- Information Output: The primary data is a chromatogram (signal vs. time) at one or more wavelengths. With a DAD, a full UV-Vis spectrum (absorbance vs. wavelength) is obtained for each data point, providing a second dimension of information for peak identification and purity assessment [1].
LC-MS Operation and the Ion Suppression Challenge
In LC-MS, the LC eluent is not directed into the detector itself. Instead, it passes through an interface where the following occurs:
- Ionization: The analyte molecules are converted into gas-phase ions at atmospheric pressure, most commonly using Electrospray Ionization (ESI) or Atmospheric Pressure Chemical Ionization (APCI) [66].
- Mass Analysis: These ions are drawn into the high vacuum of the mass spectrometer and separated based on their mass-to-charge ratio (m/z) [66].
- The Ion Suppression Problem: This is a matrix effect that occurs in the ionization source. Co-eluting substances from the sample matrix can alter the efficiency of droplet formation and desolvation, or compete for charge, thereby suppressing (or enhancing) the ionization of the target analyte [65]. Crucially, this happens even if the interfering compound is not visible in the final mass spectrum [65]. The consequence is that the MS signal no longer accurately reflects the analyte concentration, leading to potential errors in quantification, reduced precision, and poorer detection limits [65] [11].
Comparative Analysis: LC-UV/DAD vs. LC-MS
The choice between LC-UV/DAD and LC-MS involves a careful trade-off between robustness and informational power. The table below summarizes the key technical differences.
Table 1: Technical Comparison of LC-UV/DAD and LC-MS
| Feature | LC-UV/DAD | LC-MS |
|---|---|---|
| Detection Principle | Light absorption by chromophores | Mass-to-charge ratio of ions |
| Quantitative Precision | High (<0.2% RSD achievable) [8] | Can be compromised by ion suppression [65] |
| Structural Information | UV-Vis spectrum (functional groups) | Mass spectrum (molecular mass, fragments) |
| Selectivity | Based on retention time & UV spectrum | Based on retention time & m/z value |
| Susceptibility to Matrix Effects | Generally low, if chromophores differ | High (ion suppression/enhancement) [11] |
| Sample Preparation Needs | Often straightforward | Can be critical to mitigate matrix effects [65] |
| Operational & Maintenance Complexity | Low; robust and easy to maintain [11] | High; requires expertise, prone to source contamination [11] |
| Cost of Ownership | Relatively low | High (purchase, maintenance, operation) [11] |
The Crucial Role of Detection in Pharmaceutical Analysis
The high quantitative precision and reliability of LC-UV/DAD make it exceptionally fit-for-purpose in pharmaceutical quality control. Regulatory guidelines (ICH Q3A) implicitly assume the use of UV detection for the determination of impurities, with requirements for sensitivity in the 0.05–0.10% range [8]. The ability to precisely measure potency, which typically has a specification of 98.0–102.0%, is a key reason for the technology's persistence in this field [8].
Evaluating and Mitigating LC-MS Ion Suppression
Experimental Protocols for Detection and Evaluation
Before a quantitative LC-MS method can be validated, it is essential to assess its susceptibility to ion suppression. The following are established experimental techniques.
Table 2: Experimental Methods for Evaluating Matrix Effects in LC-MS
| Method | Protocol | Interpretation |
|---|---|---|
| Post-extraction Addition [65] | 1. Prepare a blank sample matrix (e.g., plasma, urine).2. Process the blank through the sample preparation procedure.3. Spike a known concentration of the analyte into the cleaned-up blank extract.4. Compare the response of the spiked extract to a neat standard solution at the same concentration. | A lower response in the spiked extract indicates ion suppression. A higher response indicates ion enhancement. |
| Post-column Infusion [65] | 1. Continuously infuse a solution of the analyte into the MS detector via a T-connector post-column.2. Inject a blank, processed sample matrix into the LC system.3. Monitor the analyte signal throughout the chromatographic run. | A dip in the steady baseline signal indicates when matrix components that cause ion suppression are eluting from the column. |
| Matrix Factor (MF) Calculation [65] | 1. Prepare multiple lots of blank matrix from different sources.2. Process each and spike with analyte post-extraction.3. For each lot, calculate MF = (Peak area of analyte in spiked matrix extract) / (Peak area of analyte in neat solution).4. Assess the variability of MF across different matrix lots. | An MF of 1 indicates no matrix effect. <1 indicates suppression; >1 indicates enhancement. High variability (%RSD) between lots is a critical risk. |
The following diagram illustrates the logical workflow for troubleshooting and addressing ion suppression in an LC-MS method.
Strategies for Removing or Reducing Ion Suppression
Once ion suppression is identified, several strategies can be employed to mitigate it.
- Improved Sample Clean-up: Utilizing selective extraction techniques (e.g., Solid-Phase Extraction) can remove interfering matrix components before LC-MS analysis [65].
- Chromatographic Re-optimization: Improving the chromatographic separation to resolve the analyte from interfering matrix components is one of the most effective approaches. This can involve changing the column chemistry, mobile phase pH, or using a more gradual gradient [65].
- Effective Internal Standardization: Using a stable isotope-labeled internal standard (SIL-IS) is highly recommended. The IS experiences ion suppression to the same degree as the analyte, correcting for the signal loss and improving quantitative accuracy [65].
- Metal-Free Hardware: For certain analytes, such as phosphorous-containing compounds (e.g., glyphosate) or nucleoside triphosphates, interaction with metal surfaces (stainless steel 316) in the LC system can cause adsorption and the formation of metal salts that lead to severe ion suppression. Switching to metal-free columns and components can dramatically recover signal [67].
Table 3: Research Reagent Solutions for Mitigating Matrix Effects
| Reagent / Solution | Function | Application Note |
|---|---|---|
| Stable Isotope-Labeled Internal Standard (SIL-IS) | Corrects for analyte loss during sample prep and signal suppression/enhancement during ionization. | Gold standard for quantitative LC-MS/MS; ensures accuracy and precision [65]. |
| Solid-Phase Extraction (SPE) Cartridges | Selectively retains target analytes or removes interfering matrix components from the sample. | Critical for cleaning up complex matrices like plasma, urine, or food extracts [65]. |
| Metal-Free (PEEK-lined) HPLC Columns | Prevents adsorption and metal salt formation for chelating compounds, recovering suppressed MS signal. | Essential for analyzing organophosphorus compounds, nucleotides, etc. [67]. |
| Ammonium Formate/Acetate Buffers | Volatile LC mobile phase additives that are compatible with MS detection. | Replace non-volatile buffers (e.g., phosphate) which cause severe ion suppression [65]. |
The persistence of LC-UV/DAD is not a matter of technological inertia but a rational choice grounded in its dependability, precision, and simplicity. While LC-MS is an indispensable tool for identification and trace analysis, its vulnerability to ion suppression presents a significant challenge for robust quantification. LC-UV/DAD remains a fundamentally robust and compliant-ready technology that is often "completely fit for purpose," especially in environments where quantitative accuracy and operational reliability are paramount [11]. A sophisticated analytical laboratory does not view LC-UV/DAD and LC-MS as mutually exclusive but as complementary techniques, with the choice of instrument being dictated by the specific analytical question at hand.
Validation and Comparison: DAD/UV vs. Other Detection Technologies
In the realm of high-performance liquid chromatography (HPLC), the detector serves as the critical eye, transforming separated analytes into actionable data. For researchers, scientists, and drug development professionals, the choice of detector can profoundly impact the quality, reliability, and depth of analytical results. Absorbance-based detectors, particularly Ultraviolet (UV) and Photo-Diode Array (PDA or DAD) detectors, remain the undisputed workhorses in this domain due to their reliability, ease of use, and universal response for chromophoric compounds [8].
While often discussed collectively, UV and DAD detectors represent distinct technologies with unique capabilities and limitations. This whitepaper provides a direct, in-depth technical comparison of these two prevalent detection systems. Framed within a broader thesis on detector selection for research and regulated environments, this guide delves into their operational principles, performance specifications, and practical applications, equipping you with the knowledge to make an informed choice for your analytical challenges.
Fundamental Principles and Optical Designs
The primary distinction between a traditional UV detector and a DAD lies in their fundamental optical design and the sequence in which light is processed.
Ultraviolet Detector (UV/VWD)
A Variable Wavelength Detector (VWD), commonly referred to as a UV detector, operates on a pre-dispersion principle. Light from a broad-spectrum source (typically a Deuterium (D2) lamp for the UV range, often supplemented with a Tungsten (W) lamp for UV-Vis models) is first passed through a monochromator [15] [3]. This optical assembly, which includes a diffraction grating and an exit slit, selects a specific, user-defined wavelength of light. This monochromatic light is then directed through the flow cell where the sample is located, and the transmitted light intensity is measured by a single photodetector [15] [8]. A beam splitter often directs a portion of the source light to a reference photodiode to compensate for lamp fluctuations [8]. This design allows for high sensitivity at the chosen wavelength but is inherently limited to measuring one or a few sequentially switched wavelengths at a time [26].
Diode Array Detector (DAD/PDA)
In contrast, a Diode Array Detector (DAD) employs a post-dispersion design. Here, polychromatic light from the source (D2 and W lamps) passes directly through the flow cell, illuminating the sample with the entire spectrum of light [15] [3]. The transmitted light, which now carries the absorption signature of the sample, is then focused onto a diffraction grating. This grating disperses the light, spreading it across an array of hundreds of photodiodes (e.g., 512 or 1024), each corresponding to a specific, narrow wavelength band [15] [8]. This enables the simultaneous detection of all wavelengths across the UV-Vis spectrum (typically 190 to 900 nm) for every data point in the chromatogram [1] [4].
The following diagram illustrates the core difference in the light path between these two designs:
Comparative Technical Specifications
The divergence in optical design translates directly into differences in performance, data output, and application suitability. The table below summarizes a direct, head-to-head comparison of the core capabilities of UV and DAD detectors.
Table 1: Technical Capabilities Comparison of UV and DAD Detectors
| Feature | UV Detector (VWD) | Diode Array Detector (DAD/PDA) |
|---|---|---|
| Wavelength Operation | Single wavelength or a few sequential wavelengths [26] | Full spectrum simultaneously (190-900 nm) [1] [4] |
| Primary Data Output | 2D Chromatogram (Time vs. Absorbance) [15] | 3D Data (Time vs. Absorbance vs. Wavelength) [15] |
| Qualitative Power | Limited; based on retention time only [1] [15] | High; based on retention time + spectral matching [15] [8] |
| Peak Purity Analysis | Not possible | Yes; compares spectra across a peak [1] [8] |
| Spectral Bandwidth | Defined by monochromator slit (e.g., 5-8 nm) [8] | Software-defined, can be a single nm [8] |
| Deconvolution of Co-eluting Peaks | Not possible | Possible with advanced software (e.g., i-PDeA) [1] |
| Typical Cost & Complexity | Lower cost, simpler system | Higher cost, more complex data handling |
Experimental Protocols and Applications
The choice between a UV and DAD detector is ultimately dictated by the analytical goals. The following experimental workflows and protocols highlight their respective strengths.
Protocol for Method Development and Peak Purity Using DAD
A key application of DAD in pharmaceutical analysis is method development and validating the purity of a chromatographic peak.
Objective: To develop a stability-indicating HPLC method for a drug substance and confirm that the target analyte peak is pure and free from co-eluting impurities.
Materials:
- HPLC System: Agilent 1200 series with quaternary pump and diode array detector (G1315C/D) [12].
- Column: Zorbax SB-C18 (4.6 × 250 mm, 5 μm) [12].
- Mobile Phase: Acetonitrile and 15 mM potassium dihydrogen orthophosphate, run under gradient elution [12].
- Standards: Target drug substance and potential degradants.
Methodology:
- Separation: Inject the sample and elute the compounds using the developed gradient method.
- Data Acquisition: The DAD collects the full UV-Vis spectrum (e.g., 200-400 nm) for every data point during the entire run [4].
- Multi-wavelength Analysis: Process the data by extracting chromatograms at the maximum absorbance wavelength (λmax) of the target compound and at other wavelengths characteristic of known impurities.
- Peak Purity Assessment: Using the instrument software, the UV spectra from the upslope, apex, and downslope of the target peak are automatically compared. The software calculates a purity index or purity angle; a match confirms peak homogeneity, while spectral differences indicate a potential co-eluting impurity [1] [8].
Protocol for Quantitative Analysis of a Drug using UV Detection
For routine, high-precision quantitative analysis where the identity of the analyte is confirmed, a UV detector is highly effective and often the preferred, more economical choice.
Objective: To accurately quantify the concentration of Posaconazole in a suspension dosage form.
Materials:
- UHPLC System: Agilent 1290 Infinity Binary Pump combined with a UV detector [12].
- Column: Kinetex-C18 (2.1 × 50 mm, 1.3 μm) [12].
- Mobile Phase: Acetonitrile: 15 mM potassium dihydrogen orthophosphate (45:55), pumped isocratically [12].
- Detection Wavelength: 262 nm [12].
Methodology:
- Calibration: Prepare and inject a series of standard solutions of known concentration. Construct a calibration curve by plotting the peak area against concentration.
- Sample Analysis: Inject the prepared sample solution. The UV detector is set to monitor the eluent at the fixed wavelength of 262 nm, the λmax for Posaconazole [12].
- Quantification: The retention time of the peak in the sample is compared to the standard for identification. The concentration is then calculated based on the peak area using the pre-established calibration curve, relying on the high precision and linear response of the UV detector [8].
This workflow is summarized in the following diagram:
The Scientist's Toolkit: Essential Research Reagents and Materials
The following table details key consumables and materials essential for operating and maintaining UV and DAD systems, based on the protocols and technical descriptions reviewed.
Table 2: Essential Research Reagents and Consumables
| Item | Function / Application |
|---|---|
| Deuterium (Dâ‚‚) Lamp [4] [8] | Standard ultraviolet light source for both UV and DAD detectors. Provides continuous emission in the 190-380 nm range. |
| Tungsten (W) Lamp [4] [3] | Supplemental light source for visible light detection (~380-900 nm), used in UV-Vis and DAD detectors. |
| HPLC/UHPLC Flow Cell [4] [8] | A small, transparent container where the sample interacts with light. Pathlength and volume are critical for sensitivity and dispersion. |
| Reverse-Phase Columns (e.g., C18) [12] | The most common stationary phase for separating a wide range of organic analytes. |
| HPLC-Grade Solvents (e.g., Acetonitrile, Methanol) [12] | Used in mobile phase preparation and sample dilution. High purity is required to minimize background noise and baseline drift. |
| Buffer Salts (e.g., Potassium Dihydrogen Phosphate) [12] | Used to prepare aqueous mobile phase buffers to control pH and improve chromatographic separation. |
The choice between a UV and a DAD detector is not a matter of one being universally superior, but rather of selecting the right tool for the analytical task at hand.
The UV detector (VWD) excels in applications demanding high-sensitivity, high-precision quantification of known compounds where identity is confirmed by retention time matching. Its robustness, lower cost, and simpler data output make it the workhorse for routine quality control in pharmaceutical and chemical industries, where methods are well-established and the primary requirement is accurate quantification [8].
The DAD detector provides a powerful advantage in method development, research, and any situation requiring a higher degree of analytical confidence. Its ability to capture full spectral data enables critical applications such as peak purity assessment, spectral confirmation of analyte identity, and deconvolution of unresolved peaks [1] [15] [8]. For laboratories dealing with complex mixtures, unknown impurities, or operating under strict regulatory guidelines that require demonstrating peak homogeneity, the DAD is an indispensable tool.
In summary, the UV detector is the specialist, offering optimized performance for targeted quantification, while the DAD is the generalist investigator, providing a comprehensive dataset for identification, qualification, and quantification in a single run.
In the realm of high-performance liquid chromatography (HPLC), the detector serves as the critical component that translates the physical separation of compounds into quantifiable analytical data. For researchers, scientists, and drug development professionals, the choice between a Ultraviolet (UV) spectrophotometer and a Diode Array Detector (DAD), also known as a Photodiode Array (PDA), fundamentally shapes the capabilities, reliability, and regulatory acceptance of an analytical method. Ultraviolet detectors are characterized by their measurement of absorbance at a single or a limited number of predefined wavelengths [1] [68]. In contrast, diode array detectors simultaneously capture absorbance data across the entire ultraviolet and visible spectrum for each data point in the chromatogram [1] [8] [69]. This core technological difference creates a cascade of implications for precision, linearity, and suitability within regulated environments, which form the bedrock of robust analytical method development.
This technical guide delves into the comparative advantages of these detectors, framed within a broader thesis that understanding their fundamental operational principles is paramount for selecting the optimal tool for a given application. The assessment is structured around key performance metrics critical to the pharmaceutical industry and scientific research.
Fundamental Operational Principles and Data Output
The divergence in capabilities between UV and DAD systems originates from their distinct optical designs, which directly dictates the nature and richness of the data they produce.
Optical Configurations
A Variable Wavelength Detector (VWD), the most common type of UV detector, employs a deuterium (or tungsten) lamp and a monochromator [8]. This monochromator, typically comprising a movable diffraction grating, is used to select a specific wavelength of light, which is then passed through the sample flow cell onto a single photodiode [8]. This design means that the wavelength must be pre-selected before analysis, and obtaining spectral information requires reinjecting the sample and running the analysis again at different wavelengths.
A Diode Array Detector (DAD/PDA) fundamentally reverses this optical path. Here, polychromatic light from the source passes through the flow cell, and the transmitted light is then dispersed across an array of hundreds of diodes (e.g., 512 or 1024) [8]. Each diode measures a specific, narrow band of wavelengths simultaneously [8]. This allows for the continuous collection of the full UV-Vis spectrum (190-900 nm, depending on the instrument) throughout the entire chromatographic run [1] [8].
Data Dimensionality
This difference in optical design leads to a fundamental difference in data output:
- UV Detector: Provides two-dimensional data: signal intensity (absorbance) versus time [68].
- DAD Detector: Provides three-dimensional data: signal intensity (absorbance) versus time versus wavelength [68]. This enables the creation of contour plots and the extraction of absorbance spectra at any point in the chromatogram.
Comparative Analysis of Key Performance Metrics
Precision and Sensitivity
Precision, expressed as the reproducibility of measurement results, is a cornerstone of analytical chemistry, particularly in quality control (QC) laboratories where a typical potency specification for drug substances is 98.0–102.0% [8].
- Noise and Detection Limits: A historical and often-cited advantage of single-wavelength UV detectors has been their lower noise levels, which can translate to lower detection limits (LOD) [70]. This is because the VWD's optical system focuses all energy of a specific wavelength onto a single diode. One forum post notes that "UV detectors on a single wavelength give at least 7 times less noise (many times more even) then PDA" [70]. This can be a critical factor in trace analysis.
- Modern DAD Performance: However, technological advancements have significantly narrowed this gap. Modern diode array detectors are "much quieter than their predecessors," and their sensitivity advantage has been "reduced significantly in recent years" [70]. Furthermore, the higher precision achievable with UV detection (often <0.2% RSD) is pivotal for regulatory testing, though well-calibrated DADs are also capable of meeting the stringent requirements for pharmaceutical testing [8].
Table 1: Comparison of Precision and Sensitivity Factors
| Metric | UV/VWD Detector | DAD/PDA Detector |
|---|---|---|
| Typical Noise Level | Historically lower (e.g., <±1.0 × 10â»âµ AU benchmark) [8] | Higher than VWD, but significantly improved in modern systems [70] |
| Impact on Detection Limits | Generally favorable for trace analysis at a single wavelength [70] | Potentially higher LODs, but sufficient for most quantitative applications |
| Measurement Precision (RSD) | <0.2% RSD, required for pharmaceutical potency tests [8] | Capable of high precision, though VWD may retain a slight advantage |
| Primary Influence on Precision | Lower electronic noise, simpler optical path | Increased data complexity and potential for higher baseline noise |
Linearity and Dynamic Range
Linearity defines the detector's ability to produce a response that is directly proportional to the concentration of the analyte over a specified range, commonly described by the Beer-Lambert Law [8].
- Beer-Lambert Law Compliance: Both UV and DAD detectors operate on the principle of absorbance and are governed by the Beer-Lambert Law (Absorbance = ε * b * c), where ε is molar absorptivity, b is pathlength, and c is concentration [8]. As such, both are capable of excellent linearity over a broad dynamic range, often exceeding four orders of magnitude.
- Comparative Performance: The linearity of a detector is more dependent on its flow cell design (pathlength and volume) and electronic stability than on whether it is a VWD or DAD. One source indicates that Variable Wavelength Detectors are known for delivering "great linearity" [71]. DADs, with their more complex optics, must be carefully designed to minimize stray light, which is a key factor limiting the upper end of linearity [8]. For most routine and research applications, both detectors demonstrate linearity that meets methodological requirements.
Table 2: Comparison of Linearity and Quantitative Capabilities
| Metric | UV/VWD Detector | DAD/PDA Detector |
|---|---|---|
| Governing Principle | Beer-Lambert Law [8] | Beer-Lambert Law [8] |
| Typical Dynamic Range | Broad, often >10â´ | Broad, often >10â´ |
| Key Strength for Quantitation | Excellent linearity and robustness for routine QC [71] | Near-uniform response across wavelengths; suitable for multi-analyte methods |
| Factor Limiting Linearity | Stray light, flow cell design | Stray light, flow cell design, and detector array saturation |
Regulatory Suitability
The regulated environments of pharmaceuticals and food safety demand not only precise and accurate quantification but also verified method specificity and analyte identification.
- UV Detector in Regulated Environments: UV detectors are the "undisputed workhorse" in quality control laboratories [8]. They are perfectly suitable for stability-indicating HPLC methods where the target analyte is well-known, and its identity is confirmed primarily by retention time [1] [8]. The ICH Q3A guidelines implicitly assume the use of UV detection for related substance tests [8].
- DAD for Enhanced Specificity and Identification: The DAD provides a significant advantage in regulated methods by adding a second dimension of identification: the UV spectrum [1]. This is crucial for:
- Peak Purity Analysis: The absorbance spectra are compared at multiple points across the chromatographic peak (e.g., upslope, apex, downslope) to check for co-eluting impurities. Software generates a peak purity index, which may indicate whether multiple compounds are co-eluting [1] [8].
- Identification of Unknowns: Spectral libraries of target compounds can be built, and unknown peaks can be tentatively identified by spectral matching [1] [69].
- Method Development and Validation: The ability to retrospectively extract chromatograms at any wavelength simplifies method development and provides robust evidence of method specificity during validation.
Experimental Protocols for Detector Characterization
To objectively compare the performance of UV and DAD systems, the following experimental protocols can be employed. These methodologies are cited from the literature and can be adapted for internal instrument qualification.
Protocol for Assessing Precision and Noise
This procedure is based on standard practices for qualifying UV spectrometer performance [72].
- Objective: To determine the absorbance precision (noise) of the detector.
- Materials:
- HPLC system with isocratic pump and detector under test.
- Mobile phase: HPLC-grade water.
- Data acquisition system.
- Method:
- Set the detector wavelength to 254 nm and allow sufficient time for the lamp to stabilize and the baseline to equilibrate.
- With the mobile phase flowing, record the baseline signal for 30 minutes.
- Calculate the peak-to-peak noise over a 10-minute period within the stable baseline.
- Data Analysis: The historical benchmark for noise specification is ±1 × 10â»âµ AU, which is exceeded by most modern UV detectors [8]. Precision can also be determined by the standard deviation of six replicate measurements of a reference material, which should not exceed 0.5% [72].
Protocol for Verifying Linearity
- Objective: To verify the linear dynamic range of the detector response.
- Materials:
- A certified reference material (CRM) with known molar absorptivity, such as caffeine or an official pharmacopeial standard [72].
- Volumetric flasks for serial dilution.
- Method:
- Prepare a stock solution of the CRM at a concentration known to produce an absorbance near the upper limit of the expected linear range (e.g., ~1.5 AU).
- Perform a series of serial dilutions to create at least 5 concentration levels across the desired range (e.g., from 0.001 to 100% of the stock concentration).
- Inject each solution in triplicate and record the peak area.
- Data Analysis: Plot the mean peak area versus the concentration. Perform linear regression analysis. A correlation coefficient (R²) of >0.999 is typically expected for a linear response.
Detector Selection Workflow and Advanced DAD Applications
The choice between a UV and a DAD detector is not a matter of one being universally superior, but rather of selecting the right tool for the analytical question. The following workflow diagram outlines the decision-making process.
Diagram 1: Detector Selection Workflow
Advanced DAD Data Exploitation
For methods utilizing a DAD, the collected three-dimensional data enables powerful post-acquisition analysis that is impossible with a VWD.
- Peak Purity Assessment: This is a standard procedure in pharmaceutical analysis. The software compares the UV spectra from the upslope, apex, and downslope of a chromatographic peak. A high degree of spectral similarity indicates a pure peak, while significant differences suggest a co-eluting impurity [1] [8]. The software typically provides a numerical "purity index" or "purity angle" for objective assessment.
- Spectral Deconvolution: Advanced software functions, such as Shimadzu's i-PDeA, leverage the spectral information to deconvolute co-eluting peaks. Since each compound has a unique UV spectrum, the algorithm can mathematically resolve the overlapping signals and provide quantitative data for each component without requiring baseline chromatographic separation [1]. This "virtual separation" relies on scientific principles rather than estimation based on gaussian modeling [1].
The Scientist's Toolkit: Essential Reagents and Materials
The development and validation of a robust HPLC method, whether using UV or DAD detection, requires a set of essential high-quality materials. The following table details key items based on the experimental protocols and applications cited.
Table 3: Essential Research Reagents and Materials for HPLC Method Development
| Item | Function/Application | Example from Literature |
|---|---|---|
| Certified Reference Materials (CRMs) | Used for verifying detector linearity, accuracy, and for system suitability tests. Provides traceability and reliability [72]. | Caffeine, acesulfame potassium, benzoic acid [73] [72]. |
| HPLC-Grade Solvents | Serve as the mobile phase. Low UV absorbance and high purity are critical to minimize baseline noise and ghost peaks. | Methanol, acetonitrile, water [73]. |
| Buffer Salts | Modify the mobile phase pH to control ionization and improve separation of ionizable analytes. | Potassium dihydrogen phosphate, dipotassium hydrogen phosphate [73]. |
| Stationary Phase Columns | The heart of the separation. Reverse-phase C18 columns are the most common for analyzing small molecules. | Shim-Pac GIST C18 (150 mm, 4.6 mm, 5 μm) [73]. |
| Syringe Filters | Clarify sample solutions prior to injection to prevent column and system clogging. | 0.45 μm or 0.22 μm nylon or PTFE filters [73]. |
The choice between a UV spectrophotometer and a Diode Array Detector for HPLC is a strategic decision with significant implications for data quality, informational content, and regulatory compliance. The UV detector remains a powerful, precise, and cost-effective tool for dedicated, high-throughput quantitative analysis where the target analytes are well-characterized, and maximum sensitivity is required. Its robustness and simplicity make it the workhorse of many quality control laboratories.
Conversely, the DAD detector offers unparalleled flexibility and a higher order of analytical confidence. Its ability to capture full spectral data for every peak in a chromatogram makes it the superior choice for method development, peak purity assessment, and the identification of unknown compounds. While modern DADs have closed the sensitivity gap with UV detectors, their primary advantage lies in qualitative analysis and ensuring method specificity, which is increasingly critical in modern regulatory frameworks. Ultimately, the selection hinges on a clear definition of the analytical goal: for routine quantification of known substances, a UV detector may be optimal; for any application requiring verification of what is being quantified, the DAD is an indispensable tool.
In pharmaceutical analysis, the high-performance liquid chromatography (HPLC) system is an indispensable tool for separation, identification, and quantification of compounds in complex mixtures. A critical component of any HPLC system is the detector, which transforms chemical data into measurable analytical signals [74]. The choice of detector directly impacts the sensitivity, selectivity, and regulatory compliance of analytical methods [74]. Ultraviolet (UV) and photodiode array (PDA or DAD) detectors are the most prevalent in pharmaceutical laboratories due to their reliability, ease of use, and high precision [8] [75]. These detectors operate on the principle of measuring the absorption of ultraviolet or visible light by compounds as they elute from the chromatographic column [74]. The amount of absorbed light correlates directly with analyte concentration, allowing for accurate quantification [74].
However, this detection mechanism presents a fundamental limitation: it requires analytes to contain chromophores—structural moieties that absorb UV or visible light [8] [76]. For pharmaceutical compounds lacking these chromophores, such as many carbohydrates, alcohols, polymers, and inorganic ions, UV detection provides inadequate or no response [76] [77] [74]. This analytical challenge is frequently encountered in drug development and quality control, particularly when analyzing excipients, counterions, and certain drug metabolites [78].
Refractive Index (RI) detection serves as a powerful alternative technique for analyzing non-chromophoric compounds [77] [74]. Unlike UV detection, RI detectors measure the change in refractive index between the mobile phase and the eluting compound [75]. They are considered "universal" detectors because they respond to almost any compound that alters the refractive index of the mobile phase [77] [75]. This makes them particularly valuable for detecting compounds that lack chromophores, including sugars, alcohols, surfactants, polymers, and many inorganic ions [77] [74] [79].
Fundamental Principles: How RI Detection Works
Operational Mechanism of RI Detectors
The refractive index (RI) detector operates on the principle of measuring the change in the refractive index of the column effluent as analytes pass through the flow cell. This physical property measurement makes it fundamentally different from spectroscopic techniques like UV detection. The operational principle is based on Snell's Law of light refraction, which describes how light changes direction when passing between media of different densities [77].
When a compound elutes from the HPLC column, it temporarily changes the composition and density of the mobile phase in the detector flow cell. This alteration affects how light bends (refracts) as it passes through the fluid, and the RI detector precisely measures this change [75]. The detector typically splits a light beam into two paths: one passing through the sample cell containing the column effluent, and another passing through a reference cell containing only the mobile phase [77]. The difference in the light path between these two beams is measured and converted into an electrical signal that appears as a peak on the chromatogram [75].
Key Technical Considerations for RI Detection
Several critical factors influence the performance and stability of RI detection systems. Understanding these parameters is essential for obtaining reliable analytical results:
Temperature Sensitivity: RI measurements are highly sensitive to temperature fluctuations, with changes as small as 0.001°C capable of causing significant baseline drift [77]. Modern RI detectors incorporate precise temperature control systems to mitigate this effect, but maintaining a stable thermal environment remains crucial [77].
Mobile Phase Compatibility: RI detectors require isocratic elution conditions, as gradient elution with changing mobile phase composition causes dramatic shifts in baseline due to the varying refractive index of the solvent mixture [77] [74] [80]. This limitation significantly restricts method development flexibility compared to UV detection.
Pressure and Flow Sensitivity: Variations in system pressure and flow rate can introduce noise and baseline instability in RI detection [77]. Ensuring a pulse-free flow from the HPLC pump and maintaining consistent operating conditions throughout the analysis is essential for optimal performance.
Comparative Analysis: RI Detection Versus Alternative Techniques
RI vs. UV Detection: Application-Based Selection
The choice between RI and UV detection is primarily determined by the chemical properties of the analytes of interest. The table below provides a systematic comparison of these detection techniques:
Table 1: Comparative Analysis of Detection Techniques for Non-Chromophoric Compounds
| Detection Method | Detection Principle | Sensitivity | Chromophore Required? | Gradient Elution Compatibility | Primary Applications |
|---|---|---|---|---|---|
| Refractive Index (RI) | Change in refractive index | Low (~10â»â· g/mL) [77] | No [77] [74] | No [77] [74] | Sugars, alcohols, polymers, inorganic ions [77] [74] |
| UV/Vis Absorption | Light absorption by chromophores | High (~10â»â¹ g/mL) [77] | Yes [8] [76] | Yes [77] | Pharmaceuticals with aromatic rings, conjugated systems [8] [74] |
| Evaporative Light Scattering (ELSD) | Light scattering by nebulized particles | Moderate [78] | No [80] [78] | Yes [80] [78] | Lipids, carbohydrates, non-volatile compounds [74] [78] |
| Charged Aerosol (CAD) | Particle charging after nebulization | High [80] | No [80] | Yes [80] | Non-chromophoric pharmaceuticals, lipids [76] [80] |
| Mass Spectrometry (MS) | Mass-to-charge ratio of ions | Very High [74] | No [76] | Yes [76] | Structural elucidation, metabolite profiling [76] [74] |
Strategic Detector Selection for Pharmaceutical Applications
Selecting the appropriate detection method requires careful consideration of the analytical goals and compound characteristics. The decision workflow below outlines a systematic approach to detector selection:
Practical Applications and Experimental Protocols
Pharmaceutical Case Study: Mavacamten Impurity Analysis
A recent investigation of mavacamten, a drug for hypertrophic cardiomyopathy, illustrates the critical need for alternative detection methods for non-chromophoric compounds [76]. During degradation studies, researchers identified two drug-related impurities: 1-isopropylpyrimidine-2,4,6(1H,3H,5H)-trione (Imp 1) and 1-phenylethanamine (Imp 2) [76]. While mavacamten itself exhibited maximum absorbance at 268 nm, Imp 2 contained a weakly absorbing chromophore and was detected only at 210 nm wavelength by HPLC with poor sensitivity due to significant baseline drift at this low wavelength [76].
This analytical challenge necessitated the implementation of orthogonal techniques to achieve mass balance, as required by ICH guidelines [76]. The research team developed and validated a quantitative NMR (qNMR) method for simultaneous determination of mavacamten and its degradation products, demonstrating the importance of alternative detection strategies when facing the limitations of UV detection for non-chromophoric compounds [76].
Protocol: HPLC-RI Analysis of Sodium and Phosphate in Pharmaceutical Formulations
The following detailed protocol for simultaneous determination of sodium and phosphate ions in aripiprazole extended-release injectable suspensions demonstrates a practical application of RI detection for inorganic ions in pharmaceuticals [78]:
Table 2: Research Reagent Solutions for HPLC-RI Analysis of Inorganic Ions
| Reagent/Material | Specifications | Function in Analysis |
|---|---|---|
| Trimodal Column | Amaze TH (250 × 4.6 mm, 5 μm) [78] | Simultaneous separation of cations and anions via mixed-mode mechanisms |
| Ammonium Formate | >99% purity, 20 mM in aqueous phase [78] | Mobile phase buffer for controlling ionization and retention |
| Formic Acid | ≥99% purity [78] | Mobile phase pH adjustment (pH 3.2) |
| Acetonitrile | HPLC gradient grade [78] | Organic mobile phase component (30% v/v) |
| Sodium Nitrate Standard | 1000 μg/mL in water [78] | Preparation of sodium calibration standards |
| Potassium Phosphate Standard | 1000 μg/mL in water [78] | Preparation of phosphate calibration standards |
Sample Preparation Protocol
- Placebo Solution: Weigh approximately 120 mg of placebo powder (containing all formulation components except sodium and phosphate sources) and transfer to a 15 mL Falcon tube [78].
- Extraction: Add 5 mL of purified water and sonicate for 5 minutes [78].
- Clarification: Centrifuge the solution at 20,000 rcf for 15 minutes [78].
- Filtration: Filter the supernatant through a 0.45 μm PTFE syringe filter prior to HPLC-RI analysis [78].
Instrumental Parameters and Chromatographic Conditions
- Column: Amaze TH mixed-mode column (250 × 4.6 mm, 5 μm) offering reversed-phase, cation-exchange, and anion-exchange mechanisms [78]
- Mobile Phase: 20 mM ammonium formate (pH adjusted to 3.2 with formic acid)/acetonitrile (70:30 v/v) [78]
- Flow Rate: 1.0 mL/min [78]
- Column Temperature: 40°C [78]
- Injection Volume: 20 μL [78]
- RI Detector Parameters: Drift tube temperature: 70°C; Nebulizing gas (N₂) pressure: 3.2 bar [78]
Method Validation and Performance Characteristics
The developed HPLC-RI method was validated according to ICH guidelines, demonstrating acceptable linearity (R² > 0.99) across concentration ranges of 25-75 μg/mL for phosphate and 50-150 μg/mL for sodium ions [78]. The method showed satisfactory precision (RSD < 10%) and accuracy (recoveries between 95-105%), with detection limits suitable for routine quality control of pharmaceutical formulations [78].
Advanced Applications and Emerging Trends
Analysis of Surfactants Without Chromophores
The challenge of analyzing non-chromophoric compounds extends to various industrial applications, including the analysis of surfactants in cleaning products [79]. Alcohol ethoxylates and sodium lauryl sulfate represent common surfactant classes that lack chromophores, making them difficult to detect with conventional UV detectors [79]. While derivatization with chromophoric tags (such as methylene blue) represents a potential solution, this approach adds complexity to sample preparation and may introduce additional analytical variables [79].
Refractive Index detection has long been the "standard" for detecting non-chromophoric surfactants, with evaporative detectors (ELSD, CAD) representing valuable alternatives [79]. One proposed experimental approach for anionic surfactants involves forming a stable ion pair between the surfactant and methylene blue under acidic conditions, followed by reversed-phase separation with visible light detection (~650 nm) [79]. However, this technique requires careful method development and does not address the detection of nonionic surfactants [79].
Detector Combinations for Comprehensive Analysis
In many pharmaceutical applications, combining multiple detection technologies provides the most comprehensive analytical solution [74]. For formulations containing both chromophoric and non-chromophoric compounds, connecting UV and RI detectors in series enables simultaneous detection of all components [74]. Similarly, the combination of PDA with mass spectrometry (MS) offers both spectral profiling and molecular weight identification, providing powerful capabilities for impurity profiling and structural elucidation [74].
These hybrid approaches are particularly valuable in formulation analysis, forced degradation studies, and impurity profiling, where a complete understanding of the sample composition is essential for regulatory compliance and product quality assessment [74].
The analysis of non-chromophoric compounds presents a significant challenge in pharmaceutical analysis and other chemical industries. While UV and PDA detectors remain the workhorses for chromophore-containing compounds, their limitations for non-UV-absorbing analytes necessitate alternative detection strategies. Refractive Index detection provides a universal detection approach that effectively complements UV-based methods for compounds such as sugars, alcohols, polymers, and inorganic ions.
The strategic implementation of RI detection, either alone or in combination with other detection technologies, enables comprehensive analysis of complex pharmaceutical formulations. While RI detection has specific limitations regarding sensitivity and gradient compatibility, its robustness, cost-effectiveness, and universal response make it an invaluable tool in the analytical chemist's arsenal. As pharmaceutical compounds continue to increase in structural diversity, the thoughtful application of RI detection and other complementary techniques will remain essential for achieving complete analytical characterization and maintaining the highest standards of product quality.
In the contemporary analytical laboratory, liquid chromatography-mass spectrometry (LC-MS) and liquid chromatography-diode array detection (LC-DAD) represent two pillars of separation science. While the superior sensitivity and selectivity of LC-MS are undisputed, LC-DAD maintains a crucial role in quantitative analysis and method development. This whitepaper provides a technical evaluation of both detection platforms, examining their fundamental operating principles, performance characteristics, and complementary roles in modern analytical workflows. Within the context of UV spectrophotometer research, we demonstrate that DAD detection offers unique advantages for method development and quality control applications, establishing its enduring value alongside mass spectrometric detection.
Liquid chromatography (LC) coupled with various detection technologies forms the backbone of modern analytical chemistry, particularly in pharmaceutical and environmental research. The evolution from fixed-wavelength ultraviolet (UV) detectors to photodiode array detectors (DAD or PDA) and further to mass spectrometers (MS) represents a trajectory toward increasingly powerful identification capabilities. A DAD is fundamentally a type of UV detector that monitors the entire UV-vis spectrum simultaneously, typically using an array of 512 or 1024 photodiodes [8]. This differs from a variable wavelength detector (VWD), which uses a monochromator to select a single wavelength for measurement [22]. The core distinction in contemporary research lies between the spectroscopic identification provided by DAD and the mass-based identification provided by MS.
Despite the proliferation of LC-MS systems, UV detection—particularly via DAD—remains the undisputed workhorse in quality control laboratories due to its reliability, ease of use, and high precision [8]. This technical evaluation examines the operational boundaries and synergistic applications of both platforms, providing researchers with a framework for detector selection based on analytical requirements rather than technological hierarchy.
Fundamental Operating Principles
LC-Diode Array Detection (DAD) Technology
The diode array detector represents a significant advancement in UV detection technology. Unlike variable wavelength detectors that select a specific wavelength before it passes through the flow cell, a DAD exposes the sample to the entire spectrum of light from the source. After the light passes through the flow cell, a diffraction grating disperses the polychromatic light onto a photodiode array, allowing simultaneous measurement of all wavelengths [8] [22]. This fundamental difference in optical design enables several key capabilities:
- Full spectral collection: Acquisition of complete UV-Vis spectra (190-800 nm) for every data point during chromatographic separation
- Post-run analysis: Retrospective wavelength optimization without reinjection
- Peak purity assessment: Spectral comparison across a chromatographic peak to detect co-elution
- Spectral matching: Library searches for preliminary compound identification
The typical flow cell volume for HPLC-DAD systems ranges from 8-18 µL with a pathlength of 10 mm, while UHPLC systems utilize smaller cells of 0.5-1 µL to maintain separation efficiency [8].
LC-Mass Spectrometry (MS) Technology
Mass spectrometers coupled with liquid chromatography systems identify compounds based on mass-to-charge ratio (m/z) rather than light absorption characteristics. MS detection involves three fundamental processes: ionization, mass analysis, and detection. The ion source converts analyte molecules into gas-phase ions, with electrospray ionization (ESI) being particularly common for LC-MS applications. These ions are then separated in the mass analyzer based on their m/z ratios—with quadrupole, time-of-flight (TOF), and ion trap being common configurations—before being detected and converted into an electrical signal [22].
Tandem mass spectrometry (MS/MS) provides enhanced specificity through additional fragmentation and analysis stages. In the first stage, precursor ions are isolated based on m/z; these selected ions are then fragmented, typically through collision-induced dissociation with an inert gas; finally, the resulting product ions are analyzed to generate characteristic fragmentation patterns [22]. This process provides structural information that exceeds the identification capabilities of spectral matching alone.
Comparative Operational Workflows
The fundamental differences in detection principles between DAD and MS result in distinct analytical workflows. The following diagram illustrates the key decision points and processes for each technology:
Performance Comparison: Quantitative Data
Direct comparison studies between LC-DAD and LC-MS methodologies provide valuable insights into their relative performance characteristics across different application scenarios. The following tables summarize key performance metrics from recent comparative studies.
Table 1: Method performance comparison for carbonyl compound analysis in workplace environments [81] [82]
| Performance Parameter | LC-DAD | LC-MS/MS |
|---|---|---|
| Linearity (R²) | 0.996 < R² < 0.999 | 0.996 < R² < 0.999 |
| Intra-day repeatability (RSD%) | 0.7 < RSD% < 10 | 0.7 < RSD% < 10 |
| Inter-day repeatability (RSD%) | 5 < RSD% < 16 | 5 < RSD% < 16 |
| Sample quantification rate | 32% | 98% |
| Agreement for formaldehyde/acetaldehyde | 0.1 < % deviation < 30 | Reference method |
| Sensitivity | Lower | Highest |
Table 2: Performance comparison for tetracycline analysis in medicated feed [83]
| Performance Parameter | HPLC-DAD | LC-MS |
|---|---|---|
| Average recoveries | 72.2 to 101.8% | 45.6 to 87.0% |
| Limit of detection (LOD) | 4.2 to 10.7 mg kgâ»Â¹ | 5.6 to 10.8 mg kgâ»Â¹ |
| Linear range | 0.01-0.3 mg mLâ»Â¹ | 100-fold dilution of HPLC range |
| Notable characteristics | Better recovery using same extraction protocol | Lower recovery, potential matrix effects |
Table 3: General detector characteristics and typical applications [8] [22]
| Characteristic | DAD | MS |
|---|---|---|
| Detection principle | Light absorption | Mass-to-charge ratio |
| Information provided | Retention time, UV spectrum | Retention time, mass spectrum, structural fragments |
| Detection limits | Nanograms | Picograms |
| Identification power | Moderate (spectral libraries) | High (exact mass, fragmentation) |
| Quantitative precision | High (<0.2% RSD) | Moderate to high |
| Matrix effects | Low to moderate | Significant |
| Operational costs | Low | High |
| Method development | Straightforward | Complex |
| Regulatory acceptance | High (e.g., ICH guidelines) | Case-dependent |
Experimental Protocols for Comparative Studies
Protocol 1: Determination of Carbonyl Compounds in Workplace Environments
This methodology was adapted from a study comparing LC-DAD and LC-MS/MS for monitoring occupational exposure to airborne carbonyl compounds [81] [82].
Materials and Reagents
- Standard solutions: 12 Carbonyl-DNPH derivatives including formaldehyde, acetaldehyde, and butyraldehyde
- Sampling cartridges: Dual-bed cartridges coated with DNPH and BPE for derivatization and ozone interference removal
- Solvents: LC-MS grade water, acetonitrile, acetic acid, ammonium formate
- Sampling equipment: SKC AirChek TOUCH sampling pumps calibrated with DryCal DC-lite flowmeter
- Chromatography: Acclaim Carbonyl C18 RSLC column (150 × 3 mm, 3 µm)
Sample Collection and Preparation
- Air sampling: Collect workplace air using portable pumps at 0.14 L minâ»Â¹ for 51-406 minutes
- Derivatization: Carbonyl compounds are derivatized directly during sampling using DNPH-coated cartridges
- Storage: Store sampled cartridges at +4°C until analysis
- Extraction: Elute analytes from cartridges using acetonitrile
- Cleanup: Filter extracts through PTFE syringe filters (0.22 µm)
Instrumental Analysis Conditions
Table 4: LC-DAD analysis conditions [82]
| Parameter | Setting |
|---|---|
| System | Agilent 1260 Infinity II |
| Detector | DAD FS (360 nm) |
| Measuring cell | 1 µL volume, 1 mm pathlength |
| Column | Acclaim Carbonyl C18 RSLC (150 × 3 mm, 3 µm) |
Table 5: LC-MS/MS analysis conditions [82]
| Parameter | Setting |
|---|---|
| System | QTRAP 5500 with ESI source |
| Ionization mode | Negative |
| Acquisition mode | Multiple reaction monitoring (MRM) |
| Column | Acclaim Carbonyl C18 RSLC (150 × 3 mm, 3 µm) |
Data Analysis
- Quantification: External calibration with carbonyl-DNPH standard solutions
- Quality control: Monitor DNPH consumption (<30% of coated material)
- Statistical analysis: Principal component analysis (PCA) for workplace differentiation
Protocol 2: Analysis of Piperazine Designer Drugs
This protocol summarizes methods for detecting abused piperazine designer drugs in clinical and forensic samples [84].
Materials and Reagents
- Analytes: Benzylpiperazines (BZP, MDBP) and phenylpiperazines (TFMPP, mCPP)
- Standards: Certified reference materials for target compounds
- Solvents: HPLC-grade methanol, acetonitrile, and water
- Buffers: Ammonium formate or acetate for LC-MS compatibility
Sample Preparation
- Liquid-liquid extraction: Basify biological samples followed by organic solvent extraction
- Solid-phase extraction: Use mixed-mode cation exchange cartridges for improved selectivity
- Concentration: Evaporate extracts under nitrogen and reconstitute in mobile phase
- Cleanup: Filter through 0.45 µm membrane filters
Instrumental Analysis
Table 6: Comparative instrumental conditions for piperazine analysis [84]
| Parameter | LC-DAD | LC-MS |
|---|---|---|
| Column | C18 (150 × 4.6 mm, 5 µm) | C18 (150 × 2.1 mm, 3.5 µm) |
| Mobile phase | Acetonitrile-phosphate buffer | Acetonitrile-ammonium formate |
| Flow rate | 1.0 mL/min | 0.3 mL/min |
| Detection | 210 nm | ESI+, MRM transitions |
| Run time | 20-30 minutes | 10-15 minutes |
Method Validation
- Selectivity: Assess interference from matrix components
- Linearity: Evaluate over concentration ranges relevant to intoxication
- Recovery: Determine extraction efficiency at multiple concentrations
- Stability: Test analyte stability during storage and processing
The Scientist's Toolkit: Essential Research Reagents and Materials
Successful implementation of either LC-DAD or LC-MS methods requires careful selection of reagents and materials. The following table summarizes key components used in the studies referenced throughout this whitepaper.
Table 7: Essential research reagents and materials for LC-DAD and LC-MS analyses
| Item | Function/Purpose | Example Applications |
|---|---|---|
| DNPH-coated cartridges | Derivatization and sampling of carbonyl compounds | Workplace air monitoring [82] |
| Dual-bed sampling cartridges | Ozone scrubbing (BPE) and derivatization (DNPH) | Carbonyl compound collection [82] |
| C18 chromatographic columns | Reverse-phase separation of non-polar to moderate polar compounds | Universal application across studies |
| LC-MS grade solvents | High purity mobile phases to minimize background noise | All LC-MS applications [82] [83] |
| Carbonyl-DNPH derivative standards | Quantification of formaldehyde, acetaldehyde, and other carbonyls | Environmental monitoring [82] |
| Tetracycline reference standards | Method calibration for antibiotic analysis | Medicated feed analysis [83] |
| Piperazine certified standards | Identification and quantification of designer drugs | Clinical toxicology [84] |
| PTFE syringe filters | Sample cleanup and particulate removal | Various sample preparations [82] |
| Buffer additives (formate, acetate) | Mobile phase modifiers for improved ionization | LC-MS applications [82] [84] |
Advanced Applications and Synergistic Workflows
Complementary Techniques for Comprehensive Analysis
The most sophisticated analytical workflows often leverage the complementary strengths of both DAD and MS detection. The following diagram illustrates an integrated approach to sample analysis that maximizes information recovery:
Peak Purity Analysis and Spectral Deconvolution
A distinctive advantage of DAD detection is its ability to assess peak purity through spectral analysis across chromatographic peaks. Advanced software algorithms compare spectra from the upslope, apex, and downslope of a peak to generate a purity index or purity angle [8]. When co-elution is suspected, mathematical deconvolution techniques can sometimes resolve overlapping peaks without physical separation.
The i-PDeA (intelligent Peak Deconvolution and Analysis) function represents an advanced application of DAD data, utilizing both temporal and spectral information to mathematically resolve co-eluting compounds [1]. This capability is particularly valuable for impurity profiling in pharmaceutical analysis and for samples where complete chromatographic resolution is challenging to achieve.
Matrix Effect Assessment and Compensation
A critical challenge in LC-MS analysis, particularly for complex biological and environmental samples, is the phenomenon of matrix effects—where co-eluting compounds alter ionization efficiency, leading to signal suppression or enhancement. LC-DAD is largely unaffected by such ionization interferences, making it valuable for:
- Method development: Initial optimization without matrix effect complications
- Reference method establishment: Providing benchmark quantification for MS method validation
- Troubleshooting: Differentiating between chromatographic and ionization issues
In the analysis of tetracyclines in medicated feed, different recovery rates were observed between DAD and MS detection using the same extraction protocol (72.2-101.8% for DAD vs. 45.6-87.0% for MS), highlighting the significant impact of matrix effects on MS quantification [83].
In the contemporary analytical laboratory, LC-MS and LC-DAD represent complementary rather than competing technologies. LC-MS provides unparalleled sensitivity and definitive identification capabilities essential for trace analysis, structural elucidation, and complex matrices. Conversely, LC-DAD maintains distinct advantages for high-precision quantification, method development, and routine quality control applications where robustness, cost-effectiveness, and regulatory acceptance are paramount.
The evolving role of UV detection in the MS era is not one of obsolescence but rather of specialization and integration. Advanced DAD capabilities such as peak purity analysis, spectral deconvolution, and real-time full spectrum acquisition enable applications where MS detection offers no distinct advantage or may introduce unnecessary complexity. The most effective analytical workflows strategically employ both technologies in a complementary manner—leveraging the screening power and quantitative precision of DAD alongside the identification power and sensitivity of MS.
For researchers and method developers, detector selection should be driven by analytical requirements rather than technological capability alone. Factors including detection limits, identification confidence, matrix complexity, throughput requirements, and operational constraints should inform this decision. Within the context of UV spectrophotometer research, DAD technology continues to evolve, offering enhanced sensitivity, reduced dispersion volumes, and advanced software capabilities that ensure its continued relevance in modern analytical science.
In the pharmaceutical industry, ensuring the reliability and accuracy of analytical methods is paramount for guaranteeing drug safety and efficacy. High-performance liquid chromatography (HPLC) serves as a cornerstone technique for the separation, identification, and quantification of drug substances and their impurities. The choice of detection system, particularly between Ultraviolet (UV) spectrophotometers and Diode Array Detectors (DAD), fundamentally influences the type and quality of data generated, which in turn impacts regulatory compliance. The International Council for Harmonisation (ICH) provides the critical framework for analytical method validation, with guidelines such as ICH Q2(R2) outlining the requirements for validation characteristics, including specificity, which is intrinsically linked to peak purity assessment [85].
A UV detector, often referred to as a Variable Wavelength Detector (VWD), is a fundamental tool that measures analyte absorbance at a single, user-configurable wavelength at any given time [8] [26]. It operates by directing light from a deuterium lamp through a monochromator, which selects a specific wavelength to pass through the flow cell and onto a single photodiode [8]. This provides a single chromatographic trace for quantification. In contrast, a Diode Array Detector (DAD), also known as a Photodiode Array Detector (PDA), represents a more advanced optical system. It employs a polychromatic light source that passes through the flow cell, after which the transmitted light is dispersed onto an array of hundreds of photodiodes [1] [8]. This allows for the simultaneous measurement of the entire ultraviolet-visible spectrum (typically 190–900 nm) for each data point collected during the chromatographic run [1] [8]. The core distinction lies in the dimensionality of the data: UV detectors provide chromatographic data (signal vs. time), whereas DAD detectors provide three-dimensional data (signal vs. time vs. wavelength), enabling powerful applications in peak identification and purity assessment.
Fundamental Differences Between UV and DAD Detectors
Optical Design and Data Output
The operational divergence between UV and DAD detectors stems from their fundamental optical designs, which dictate their capabilities and applications. The following table summarizes the key technical differences.
Table 1: Technical Comparison of UV/VWD and DAD/PDA Detectors
| Feature | UV/Variable Wavelength Detector (VWD) | Diode Array Detector (DAD/PDA) |
|---|---|---|
| Optical Principle | Monochromator before the flow cell [8] | Polychromatic light through flow cell; diffraction grating after the flow cell [8] |
| Wavelength Measurement | Single or sequentially switched wavelengths [26] | Entire spectrum measured simultaneously [1] [26] |
| Primary Data Output | Chromatogram(s) (Absorbance vs. Time) | Chromatogram(s) and Spectra (Absorbance vs. Time vs. Wavelength) |
| Spectral Collection | Must re-inject sample to obtain a spectrum | Full spectrum collected for every data point in real-time [1] |
| Peak Purity Assessment | Limited or indirect assessment | Direct assessment via spectral comparison across the peak [1] [32] |
| Typical Applications | Routine quantitative analysis where analytes are well-characterized | Method development, impurity profiling, and identity confirmation [1] [32] |
The sequence of optical components is a critical differentiator. In a VWD, the monochromator is positioned before the flow cell, meaning that only monochromatic light interacts with the sample. In a DAD, the light beam passes through the flow cell first, and is then dispersed into its constituent wavelengths, which are projected onto the diode array [8]. This "reverse optics" design is what enables the simultaneous capture of the full spectrum. The ability of the DAD to collect complete spectral data for every point in the chromatogram provides a rich dataset that is invaluable for confirming analyte identity and detecting potential co-eluting peaks that a single-wavelength UV detector would miss [1].
The Scientist's Toolkit: Essential Detector Components
Understanding the key components of these detection systems is crucial for their effective application in a regulated environment.
Table 2: Key Components and Reagents in HPLC-UV/DAD Analysis
| Item | Function/Description | Role in Peak Purity & Compliance |
|---|---|---|
| Deuterium Lamp | Source of high-intensity UV light (190–600 nm) [8] | Provides stable, continuous energy for accurate absorbance measurements; impacts signal-to-noise ratio. |
| Flow Cell | A micro-scale cuvette where detection occurs; defined by pathlength (e.g., 10 mm) and volume (e.g., 1-18 µL) [8] | Pathlength directly influences sensitivity (Beer's Law). Proper design minimizes extra-column band broadening. |
| Diffraction Grating | Optical component that disperses light into its constituent wavelengths [8] | Critical for wavelength selection in VWD and for spectral dispersion in DAD; ensures wavelength accuracy. |
| Photodiode Array | A linear array of hundreds of individual light sensors (diodes) [8] | Enables simultaneous full-spectrum acquisition in DAD, which is the foundation for peak purity algorithms. |
| High-Purity Mobile Phase Solvents | HPLC-grade solvents (e.g., acetonitrile, methanol) and volatile buffers | Minimize baseline noise and UV background absorption, especially at low wavelengths, crucial for obtaining clean spectra for purity analysis [86]. |
| Reference Standard | Authentic, high-purity compound of the analyte [32] | Serves as the benchmark for retention time and, critically, for spectral matching in DAD-based peak purity and identity tests. |
Peak Purity Indices: Concepts and Calculation Methodologies
The Principles of Spectral Peak Purity Assessment
In liquid chromatography, peak purity assessment is the process of determining whether a chromatographic peak corresponds to a single chemical compound or contains co-eluting impurities. For DAD data, this is fundamentally a question of spectral peak purity—does the chromatographic peak consist of compounds having a single spectroscopic signature? [32] It is crucial to note that these tools answer the question of spectral homogeneity, not absolute chemical homogeneity, as impurities with nearly identical UV spectra may not be distinguished [32] [86].
The theoretical basis for most commercial peak purity software is the treatment of a UV spectrum as a vector in n-dimensional space, where 'n' is the number of data points (wavelengths) in the spectrum [32]. To visualize this, consider a simplified spectrum measured at only three wavelengths. This spectrum can be plotted as a vector in three-dimensional space, where the vector's endpoint has coordinates corresponding to the absorbance values at those three wavelengths. When assessing peak purity, the spectra collected from the upslope, apex, and downslope of a chromatographic peak are all represented as vectors. The purity algorithm then quantifies the similarity between these vectors, typically by calculating the angle (θ) between them. A small angle indicates high spectral similarity, suggesting a pure peak, while a larger angle suggests spectral dissimilarity and potential co-elution [32].
Mathematical Algorithms and Experimental Protocols
The two primary mathematical approaches for quantifying spectral similarity are the Cosine Angle (also known as the Dot Product) and the Correlation Coefficient.
1. Cosine Angle (Spectral Contrast Angle): This method calculates the cosine of the angle between two spectral vectors. The formula is: [ \cos(\theta) = \frac{\mathbf{a} \cdot \mathbf{b}}{\|\mathbf{a}\|\|\mathbf{b}\|} ] where a and b are the vector representations of two spectra being compared (e.g., a spectrum from the peak slope and the spectrum at the peak apex) [32]. If the angle θ is zero, the cosine is 1, meaning the spectral shapes are identical. As the angle increases, the cosine value decreases, indicating a greater difference in spectral shape.
2. Correlation Coefficient: An alternative approach uses the correlation coefficient (r) between two spectra. The formula is: [ r = \frac{\sum{(ai - \bar{a})(bi - \bar{b})}{\sqrt{\sum(ai - \bar{a})^2 \sum(bi - \bar{b})^2}} ] where (ai) and (b_i) are the absorbance values at the i-th wavelength, and (\bar{a}) and (\bar{b}) are the mean absorbance values for each spectrum [32]. If the vectors are mean-centered before applying the cosine calculation, the correlation coefficient and the cosine of the angle are equivalent [32].
In practice, software packages like Empower implement this by calculating two key indices for the entire peak [86]:
- Purity Angle (P): The average value of the angle between each spectrum in the peak and the spectrum at the peak apex. This represents the overall spectral variance within the peak.
- Purity Threshold (T): An index value that estimates the effect of spectral noise on the purity angle, evaluated based on the signal-to-noise ratio of the peak.
The purity decision is then made by a direct comparison:
- If Purity Angle < Purity Threshold, there is no spectral difference greater than what can be attributed to noise, and the peak is considered "pure" [86].
- If Purity Angle > Purity Threshold, there is a spectral difference exceeding noise effects, indicating a high likelihood of co-elution [86].
Figure 1: Logical workflow for spectral peak purity assessment using DAD data.
Best Practices and Methodological Considerations
To obtain reliable peak purity results, a rigorous experimental protocol must be followed:
- Sample and Standard Preparation: Use high-purity reference standards. For the analyte, ensure the concentration is within the linear range of the detector, typically so that the absorbance at the maximum absorption wavelength does not exceed 1.0 AU to avoid spectral distortion [86].
- Chromatographic Separation: Optimize the method to achieve the highest possible resolution from known impurities before relying on peak purity assessment. Peak purity is a tool to detect unsuspected co-elution, not a substitute for good chromatography.
- DAD Data Acquisition Parameters:
- Set an appropriate spectral acquisition rate (e.g., 5-20 spectra per second) to ensure enough data points across the peak.
- Define a wavelength range that covers the main absorbance regions of the analyte, typically 200-400 nm for many pharmaceuticals.
- Data Processing for Purity Analysis:
- Baseline Correction: Properly define the start and end points of the peak to establish a correct baseline for spectral comparison [32].
- Noise Minimization: The purity threshold is heavily influenced by the S/N ratio. For low-concentration peaks, noise can significantly increase the purity angle, potentially leading to false impure conclusions [86].
- Wavelength Range Selection: Avoid spectral regions where the mobile phase has high background absorption (e.g., very low UV for some buffers), as this can distort the spectrum and impair the purity calculation. The purity analysis can be performed on a restricted, more informative wavelength range [86].
ICH Guidelines and the Role of Peak Purity in Method Validation
ICH Q2(R2) and the Centrality of Specificity
The ICH Q2(R2) guideline, "Validation of Analytical Procedures," provides a framework for establishing that an analytical method is suitable for its intended purpose [85]. While it does not explicitly mandate the use of DAD or prescribe specific algorithms, it places critical importance on the validation characteristic of Specificity.
Specificity is defined as the ability to assess unequivocally the analyte in the presence of components that may be expected to be present, such as impurities, degradation products, and matrix components [85]. Within this context, peak purity assessment using DAD serves as a primary, though not sole, line of evidence to demonstrate that the analytical method can accurately quantify the analyte without interference from co-eluting species. This is especially vital for stability-indicating methods, which must monitor the purity of the drug substance over its shelf life and detect the formation of degradation products [32].
A Practical Protocol for Validation with DAD
The following workflow integrates DAD-based peak purity into a method validation protocol compliant with ICH Q2(R2):
- Forced Degradation Studies: Stress the drug substance and product under conditions of acid, base, oxidation, heat, and light [32]. Analyze these stressed samples using the developed HPLC-DAD method.
- Spectral Homogeneity Check: For the main analyte peak in the chromatogram of each stressed sample, perform a peak purity test. The goal is to demonstrate that the peak is spectrally pure (Purity Angle < Purity Threshold), providing evidence that it is free from interference from degradation products generated under these stress conditions [32].
- Resolution and Peak Purity Correlation: Confirm that all known degradation products and impurities are chromatographically resolved from the main peak. For any peak that is not fully resolved, peak purity analysis of the main peak in that region is essential to prove the lack of co-elution.
- Method Reporting: The validation report should include the purity angle and threshold values for the main peak across all stress conditions, alongside chromatograms and spectra, to document the demonstration of specificity.
Table 3: Interpreting Purity Angle and Threshold in a Regulatory Context
| Scenario | Purity Angle vs. Threshold | Interpretation | Regulatory Action |
|---|---|---|---|
| 1 | Purity Angle << Threshold (e.g., P < 0.2) [86] | High confidence of spectral purity. The peak consists of components with nearly identical spectra. | Acceptable for demonstrating specificity. |
| 2 | Purity Angle < Threshold (but P > 0.2) | No spectral difference exceeding noise is detected. The peak is considered pure within the method's detection limits. | Generally acceptable, but ensure S/N ratio is sufficient. |
| 3 | Purity Angle > Threshold | Spectral differences exceed noise, suggesting co-elution of a component with a different spectrum. | Investigate. Method specificity may be compromised. Improve chromatography or employ orthogonal detection (e.g., MS). |
| 4 | Purity Angle >> Threshold (e.g., P=9.5, T=10.0) [86] | The difference is small but detectable. The software may not flag it as impure, but co-elution of spectrally similar components is possible. | Use caution. Visually inspect spectra and consider the method's purpose. May require further investigation. |
Limitations and Advanced Applications
Inherent Limitations of UV-Spectral Purity
Despite its utility, DAD-based peak purity assessment has significant limitations that scientists must acknowledge:
- Similar Spectra: The technique cannot detect co-eluting impurities that have nearly identical UV spectra to the main analyte. This is common for structurally related compounds like isomers or homologues, whose "UV/Vis spectrum is determined by the basic skeleton of the chemical structure, and it does not change due to the terminal alkyl group" [86].
- Uniform Co-elution: If an impurity co-elutes with the main component at a constant ratio from the beginning to the end of the peak, the spectral shape will remain constant, and the peak purity algorithm will fail to detect the impurity [86].
- Low Concentration Impurities: The sensitivity of peak purity detection is limited. A small amount of an impurity, even with a different spectrum, may not produce a significant enough spectral change to be detected, especially if the main peak has a low signal-to-noise ratio [86].
- Spectral Noise: Noisy spectra, particularly from low-concentration analytes, can inflate the purity angle and lead to false "impure" conclusions or mask real impurities [86].
Advanced Applications and Future Directions
Beyond basic purity checks, the full-spectrum data from a DAD enables more advanced applications:
- Peak Deconvolution: Advanced software functions, such as Shimadzu's i-PDeA, can deconvolute co-eluting peaks into their individual components by utilizing differences in their spectral profiles, providing quantitative results for unresolved analytes without requiring physical chromatographic separation [1].
- Library Searching: The spectrum at the peak apex can be searched against a user-built spectral library to confirm the identity of an unknown or to verify the peak identity against a reference standard [86].
- Coupling with Mass Spectrometry (MS): For definitive peak purity and identity confirmation, LC-DAD-MS is considered the gold standard. While DAD provides UV spectral confirmation, MS provides molecular weight and structural information, offering an orthogonal and highly specific identification mechanism [32] [87]. This hybrid approach is increasingly common in pharmaceutical research and development.
The selection between a UV spectrophotometer and a DAD detector is more than a technical specification; it is a strategic decision that impacts the robustness and regulatory acceptance of an analytical method. The UV detector remains a reliable and cost-effective tool for simple, routine quantitative analysis. However, in the context of ICH-driven drug development, the DAD detector is indispensable. Its ability to perform peak purity analysis provides critical, direct evidence for method specificity, a cornerstone of validation. By understanding the principles of peak purity indices, adhering to rigorous experimental protocols, and acknowledging the technique's limitations, scientists and drug development professionals can effectively leverage DAD technology to ensure the quality, safety, and efficacy of pharmaceutical products, thereby achieving and maintaining regulatory compliance.
Conclusion
The choice between a UV and a DAD detector is not a matter of one being universally superior, but of selecting the right tool for the analytical question and regulatory context. UV detectors offer unparalleled reliability, ease of use, and high quantitative precision for routine analysis of known chromophoric compounds, making them a workhorse for quality control. In contrast, DAD detectors provide a powerful, information-rich technique for method development, unknown screening, and peak purity assessment, which is indispensable for research and complex matrix analysis. Despite the rise of LC-MS, the simplicity, cost-effectiveness, and robust quantitative performance of UV and DAD ensure their persistent critical role in pharmaceutical and biomedical laboratories. Future directions will likely see these detectors further integrated into multi-detector systems and leveraged with advanced chemometric software, solidifying their place in the comprehensive characterization of chemical and biological entities.
References
- 1. UV vs Diode-Array (PDA) Detectors for (U)HPLC [https://www.ssi.shimadzu.com/service-support/faq/liquid-chromatography/knowledge-base/uv-vs-pda-detectors/index.html]
- 2. UV-Vis Spectroscopy: Principle, Strengths and Limitations ... [https://www.technologynetworks.com/analysis/articles/uv-vis-spectroscopy-principle-strengths-and-limitations-and-applications-349865]
- 3. 7. Principle and Feature of Various Detection Methods (1) [https://www.hitachi-hightech.com/global/en/knowledge/analytical-systems/hplc/hplc-basics/course7.html]
- 4. Diode Array Detector HPLC | DAD [https://scioninstruments.com/us/blog/diode-array-detector-hplc/]
- 5. UV-Vis Spectrophotometer Applications [https://www.thermofisher.com/us/en/home/industrial/spectroscopy-elemental-isotope-analysis/molecular-spectroscopy/uv-vis-spectrophotometry/applications.html]
- 6. UV-Vis Spectrometer 2025 Trends and Forecasts 2033 [https://www.archivemarketresearch.com/reports/uv-vis-spectrometer-801189]
- 7. North America Diode Array Detectors Market Watch 2025 [https://www.linkedin.com/pulse/north-america-diode-array-detectors-market-watch-2025-bj8ke/]
- 8. Ultraviolet Detectors: Perspectives, Principles, and Practices [https://www.chromatographyonline.com/view/ultraviolet-detectors-perspectives-principles-and-practices]
- 9. Instrumentation of a UV-Visible Spectrophotometer - JASCO [https://jascoinc.com/learning-center/theory/spectroscopy/uv-vis-spectroscopy/instrumentation/]
- 10. The LCGC Blog: Diode Array Detector Settings [https://www.chromatographyonline.com/view/lcgc-blog-diode-array-detector-settings-five-minutes-change-your-chromatography-forever]
- 11. In defence of dependability and reliability: LC–UV/DAD [https://pmc.ncbi.nlm.nih.gov/articles/PMC3658073/]
- 12. A Comparative Study of Newly Developed HPLC-DAD and ... [https://pmc.ncbi.nlm.nih.gov/articles/PMC4167226/]
- 13. Beer-Lambert Law | Transmittance & Absorbance [https://www.edinst.com/resource/the-beer-lambert-law/]
- 14. The Beer-Lambert Law [https://chem.libretexts.org/Bookshelves/Physical_and_Theoretical_Chemistry_Textbook_Maps/Supplemental_Modules_(Physical_and_Theoretical_Chemistry)/Spectroscopy/Electronic_Spectroscopy/Electronic_Spectroscopy_Basics/The_Beer-Lambert_Law]
- 15. Absorbance Detection: Ultraviolet Detectors & Photo Diode ... [https://www.shimadzu.com/an/service-support/technical-support/analysis-basics/basic/absorbance_detector.html]
- 16. UV-VIS和分光光度计有什么区别 [https://m.sousepad.com/h-nd-3566.html]
- 17. æµ…æžæœ—伯比尔定律- 应用案例 [https://lab.jgvogel.cn/c/2023-01-06/1247176.shtml]
- 18. single and double-beam UV-Visible spectrophotometers. ... [https://www.drawellanalytical.com/the-difference-between-single-and-double-beam-uv-visible-spectrophotometers/]
- 19. Single vs Double Beam Spectrophotometers: Key Differences [https://aelabgroup.com/single-vs-double-beam-spectrophotometers-key-differences/]
- 20. 紫外/å¯è§å¸æ”¶å…‰è°± - Unchained Labs [https://unchained-labs.cn/uv-vis-spectroscopy/]
- 21. Chromophores, Fluorophores: properties and characteristics [https://www.bachem.com/knowledge-center/technical-notes/chromophores-fluorophores-spectral-properties-and-characteristics/]
- 22. How HPLC Detectors Work [https://www.thermofisher.com/us/en/home/industrial/chromatography/chromatography-learning-center/liquid-chromatography-information/hplc-system-components/how-hplc-detectors-work.html]
- 23. Evolution of Agilent UV-Vis Spectroscopy: From Cary 8454 ... [https://community.agilent.com/technical/molecular-spec/b/blog/posts/evolution-of-agilent-uv-vis-spectroscopy-from-cary-8454-to-cary-3500]
- 24. What is a diode array spectrophotometer? [https://www.ssi.shimadzu.com/service-support/faq/uv-vis/instrument-design/18/index.html]
- 25. UV Spectrophotometry as a Pharmaceutical Testing Solution [https://www.hunterlab.com/blog/uv-spectrophotometry-as-a-pharmaceutical-testing-solution/]
- 26. Types of UV detectors [https://elsci.io/docs/peaksel/types-of-uv-detectors.html]
- 27. 3 mins to understand DAD & UV detector [https://www.linkedin.com/pulse/3-mins-understand-dad-uv-detector-gilbert-cheung]
- 28. Column Chromatography Detection Options: UV, ELSD, MS [https://eureka.patsnap.com/report-column-chromatography-detection-options-uv-elsd-ms-when-to-use-which-and-setup-notes]
- 29. A Simple, Fast, Low Cost, HPLC/UV Validated Method for ... [https://pmc.ncbi.nlm.nih.gov/articles/PMC4961984/]
- 30. How HPLC Detectors Work [https://www.thermofisher.com/br/en/home/industrial/chromatography/chromatography-learning-center/liquid-chromatography-information/hplc-system-components/how-hplc-detectors-work.html]
- 31. How To Perform HPLC Peak Purity Using PDA Detector [https://pharmaknowledgeforum.com/peak-purity/]
- 32. Peak Purity in Liquid Chromatography, Part I [https://www.chromatographyonline.com/view/peak-purity-liquid-chromatography-part-i-basic-concepts-commercial-software-and-limitations]
- 33. Peak Purity Analysis [https://www.elementlabsolutions.com/uk/chromatography-blog/post/peak-purity-analysis]
- 34. DAD Peak Purity Analysis in OpenLab CDS - Articles [https://community.agilent.com/knowledge/lc-portal/kmp/lc-articles/kp1181.dad-peak-purity-analysis-in-openlab-cds]
- 35. What is a UV-Vis Spectrophotometer? [https://www.denovix.com/what-is-a-uv-vis-spectrophotometer/]
- 36. Peak deconvolution in one-dimensional chromatography ... [https://www.sciencedirect.com/science/article/abs/pii/S0021967302004090]
- 37. Photodiode Array Detector [https://spincotech.com/product/photodiode-array-detector/]
- 38. Peak Purity / Deconvolution [https://www.ssi.shimadzu.com/industries/pharma-biopharma/peak-purity-deconvolution/index.html]
- 39. Intelligent Peak Deconvolution Analysis (i-PDeA II) [https://www.ssi.shimadzu.com/products/liquid-chromatography/hplc-software/intelligent-peak-deconvolution-analysis-i-pdea-ii/index.html]
- 40. NMF-Based Spectral Deconvolution with a Web Platform ... [https://pmc.ncbi.nlm.nih.gov/articles/PMC7860082/]
- 41. Shimadzu differentiates co-eluting UHPLC peaks using i- ... [https://manufacturingchemist.com/shimadzu-differentiates-co-eluting-uhplc-peaks-using-i-pdea-160356]
- 42. 7. å„ç§æ£€æµ‹æ–¹æ³•ä¼˜ç‚¹ï¼ˆ1) : 日立高新技术在ä¸å›½ [https://www.hitachi-hightech.com/cn/zhcn/knowledge/analytical-systems/hplc/hplc-basics/course7.html]
- 43. HPLC æ£€æµ‹å™¨çš„å·¥ä½œåŽŸç† - 赛默飞 [https://www.thermofisher.cn/cn/zh/home/industrial/chromatography/chromatography-learning-center/liquid-chromatography-information/hplc-system-components/how-hplc-detectors-work.html]
- 44. "DAD vs. UV in HPLC: Why Results Differ" [https://www.linkedin.com/posts/sahar-sehati-604b42237_hplc-analyticalchemistry-pharmaceuticalanalysis-activity-7339641579034329088-b42K]
- 45. Development and Validation of HPLC-DAD/FLD Methods for ... [https://pmc.ncbi.nlm.nih.gov/articles/PMC12525618/]
- 46. Comparison of Quantification Using UV-Vis, NMR, and ... [https://www.mdpi.com/1422-0067/26/14/6638]
- 47. Optimizing DAD Acquisition Method Settings - Articles [https://community.agilent.com/knowledge/lc-portal/kmp/lc-articles/kp116.optimizing-dad-acquisition-method-settings]
- 48. Noise and Drift [http://www.chromforum.org/viewtopic.php?t=101984]
- 49. UV Detector Problems [https://www.chromatographyonline.com/view/uv-detector-problems]
- 50. Why Your HPLC Baseline Drifts—And How to Stop It [https://www.sepscience.com/why-your-hplc-baseline-drifts-and-how-to-stop-it-11018]
- 51. Essentials of LC Troubleshooting, Part IV: What Is Going ... [https://www.chromatographyonline.com/view/essentials-of-lc-troubleshooting-part-iv-what-is-going-on-with-the-baseline-]
- 52. 1290 Infinity III High Dynamic Range-DAD System [https://www.agilent.com/en/product/liquid-chromatography/hplc-components-accessories/hplc-detectors/1290-high-dynamic-range-dad-system?srsltid=AfmBOorxc-4Npq9EfKwf2RKung-MjNo3BDo4Mos5OeV5BNHC1lMiL_JK]
- 53. DAD detector brand influence on sensitivity [http://www.chromforum.org/viewtopic.php?t=12836]
- 54. Improve UV Visible Spectrophotometer Measurement ... [https://www.metashcorp.com/How-to-Improve-the-Measurement-Accuracy-of-UV-Visible-Spectrophotometer.html]
- 55. Sustainable UV–spectrophotometric analysis of meloxicam ... [https://www.sciencedirect.com/science/article/abs/pii/S0026265X25033892]
- 56. CN1372140A - å…¨å°é—二æžç®¡é˜µåˆ—检测器åŠå…¶æŽ§åˆ¶æ–¹æ³• [https://patents.google.com/patent/CN1372140A/zh]
- 57. 选型指å—| 光电å€å¢žç®¡(PMT) [https://www.hamamatsu.com.cn/cn/zh-cn/product/optical-sensors/pmt/selectionguide.html]
- 58. UV-Vis-NIR 仪器| 安æ·ä¼¦ [https://www.agilent.com/zh-cn/product/molecular-spectroscopy/uv-vis-uv-vis-nir-spectroscopy/uv-vis-uv-vis-nir-systems?srsltid=AfmBOor8A5QP-mkjwZWJ7wh5K7DrLeaG1oUpLkJbY2d0K01hsFS0UJ9O]
- 59. Should I choose a Diode Array, CCD or Scanning ... [https://olisclarity.com/should-i-choose-a-diode-array-ccd-or-scanning-spectrophotometer]
- 60. Advances in Natural Product Extraction Techniques ... [https://pmc.ncbi.nlm.nih.gov/articles/PMC10343563/]
- 61. Spectroscopy Market Profile: Photodiode Array UV-Vis ... [https://www.spectroscopyonline.com/view/spectroscopy-market-profile-photodiode-array-uv-vis-spectrophotometers]
- 62. Wavelength cutoffs for common solvents - Waters Help Center [https://help.waters.com/help/en/product-support/alliance-is-system-support/715008450/6BCFA49.html]
- 63. Comparison of the reliability of the identification with diode ... [https://www.sciencedirect.com/science/article/abs/pii/S0021967306022874]
- 64. Recent Advances in Liquid Chromatography–Mass ... [https://pmc.ncbi.nlm.nih.gov/articles/PMC12204688/]
- 65. Ion suppression; A critical review on causes, evaluation ... [https://www.sciencedirect.com/science/article/abs/pii/S0039914013001975]
- 66. What Is LC-MS, LC-MS Analysis and LC-MS/MS [https://www.technologynetworks.com/analysis/articles/lc-ms-what-is-lc-ms-lc-ms-analysis-and-lc-msms-348238]
- 67. An Uncommon Fix for LC–MS Ion Suppression [https://www.chromatographyonline.com/view/an-uncommon-fix-for-lc-ms-ion-suppression]
- 68. LC UV-Vis/DAD [https://ekotechlab.pl/en/lc-uv-vis-dad-en/]
- 69. Types of HPLC Detectors [https://www.phenomenex.com/knowledge-center/hplc-knowledge-center/hplc-detectors?srsltid=AfmBOoqm3Yo3qqPFpb3smXDzLeT3USGi1pBZhWAQQ3Uz6_WN2pI0LRWR]
- 70. U-HPLC, UV/VIS or DAD (PDA) detector [http://www.chromforum.org/viewtopic.php?t=10457]
- 71. Detector Technologies for (U)HPLC [https://www.thermofisher.com/blog/analyteguru/detector-technologies-for-u-hplc/]
- 72. Specifying accuracy and precision criteria for ultraviolet ... [https://www.spectroscopyeurope.com/quality/specifying-accuracy-and-precision-criteria-ultraviolet-spectrometers]
- 73. Development and Validation of HPLC-DAD Method for ... [https://pmc.ncbi.nlm.nih.gov/articles/PMC7466259/]
- 74. The Eyes of HPLC: Strategic Use of Detectors [https://www.qbdgroup.com/en/blog/hplc-detectors-drug-development-quality-control]
- 75. Chromatography Detectors Explained: UV, RI, MS, and More [https://www.pharmanow.live/pharma-manufacturing/chromatography-detector-types]
- 76. Analytical challenges in the mavacamten impurity analysis [https://www.sciencedirect.com/science/article/abs/pii/S0019452225005175]
- 77. Comparing HPLC Detectors: UV vs Refractive Index [https://eureka.patsnap.com/report-comparing-hplc-detectors-uv-vs-refractive-index]
- 78. Efficient HPLC-ELSD analysis of sodium and phosphate in ... [https://pubs.rsc.org/en/content/articlehtml/2025/ra/d5ra07182h]
- 79. The detection of surfactants without any chromophoric group [http://www.chromforum.org/viewtopic.php?t=13386]
- 80. Comparison of ultraviolet detection, evaporative light ... [https://www.sciencedirect.com/science/article/abs/pii/S0731708509006554]
- 81. Comparison between LC-UV/DAD and LC-MS/ ... [https://pubmed.ncbi.nlm.nih.gov/36231348/]
- 82. Determination of Carbonyl Compounds in Different Work... [https://www.mdpi.com/1660-4601/19/19/12052]
- 83. Comparison of HPLC–DAD and LC–MS Techniques for the ... [https://link.springer.com/article/10.1007/s10337-021-04058-3]
- 84. Comparison of LC-MS and LC-DAD Methods of Detecting ... [https://www.mdpi.com/2077-0383/11/7/1758]
- 85. ICH Q2(R2) Validation of analytical procedures [https://www.ema.europa.eu/en/ich-q2r2-validation-analytical-procedures-scientific-guideline]
- 86. Empower 3 PDA: What is Purity 1 Angle, Purity 1 Threshold ... [https://support.waters.com/KB_Inf/Empower_Breeze/WKB85832_Empower_3_PDA_What_is_Purity_1_Angle_Purity_1_Threshold_How_is_the_peak_purity_determined]
- 87. UV-Vis absorption spectrophotometry and LC-DAD-MS-ESI ... [https://www.sciencedirect.com/science/article/pii/S0003267023007845]