UV-Vis vs. UFLC-DAD: A Strategic Guide for Selecting the Right Analytical Technique in Drug Development
This guide provides a comprehensive framework for researchers, scientists, and drug development professionals to strategically select between UV-Vis spectroscopy and UFLC-DAD for their analytical needs.
UV-Vis vs. UFLC-DAD: A Strategic Guide for Selecting the Right Analytical Technique in Drug Development
Abstract
This guide provides a comprehensive framework for researchers, scientists, and drug development professionals to strategically select between UV-Vis spectroscopy and UFLC-DAD for their analytical needs. It covers the fundamental principles of each technique, explores their specific applications in method development and analysis of pharmaceuticals and natural products, and addresses common troubleshooting scenarios. A detailed comparison of validation parameters, cost, speed, and environmental impact is presented to empower informed, method-specific decision-making that ensures data quality, regulatory compliance, and efficiency from preclinical research to quality control.
Understanding the Core Principles: How UV-Vis and UFLC-DAD Work
Ultraviolet-Visible (UV-Vis) spectroscopy is a cornerstone analytical technique that measures the absorption of light in the ultraviolet and visible regions of the electromagnetic spectrum [1] [2]. This technique operates on the principle that when molecules are exposed to light of specific wavelengths, they undergo electronic transitions, absorbing energy to promote electrons from ground states to higher energy states [2]. The UV region typically spans wavelengths from 190 to 400 nm, while the visible region covers 400 to 800 nm [2]. Shorter wavelengths in the UV region possess higher energy and frequency, while longer wavelengths in the visible region have lower energy and frequency [2].
UV-Vis spectroscopy serves as a cost-effective, simple, versatile, and non-destructive technique that allows samples to be reused for further analysis [2]. Its properties depend directly on sample composition and concentration, enabling researchers to identify components, assess purity, and perform quantitative analysis [2]. The technique finds application across diverse sample types including monolithic solids, liquids, glasses, powders, and thin films [2], making it indispensable in modern analytical laboratories, particularly in pharmaceutical research and drug development contexts.
Fundamental Principles of the Beer-Lambert Law
Theoretical Foundation
The Beer-Lambert Law (also referred to as Beer's Law) establishes a fundamental relationship between the attenuation of light passing through a substance and the properties of that substance [3] [4]. This law provides the theoretical foundation for quantitative analysis in UV-Vis spectroscopy, enabling researchers to determine concentrations of analytes in solution [3]. The law states that the absorbance of light by a solution is directly proportional to the concentration of the absorbing species and the path length through which the light travels [4].
The mathematical formulation of the Beer-Lambert Law is expressed as:
A = εlc
Where:
- A represents absorbance (a dimensionless quantity) [4]
- ε is the molar absorptivity or molar absorption coefficient (with units of L·molâ»Â¹Â·cmâ»Â¹) [4]
- l is the optical path length through the sample (typically in cm) [4]
- c is the concentration of the solution (in mol·Lâ»Â¹) [4]
The molar absorption coefficient (ε) is a substance-specific property that measures how strongly a chemical species absorbs light at a particular wavelength [3]. This value is constant for a given substance under specific conditions and represents the probability of electronic transitions occurring when light interacts with the molecules [4].
Transmittance and Absorbance Relationship
The Beer-Lambert Law establishes a logarithmic relationship between transmittance and absorbance [3]. Transmittance (T) is defined as the ratio of the transmitted light intensity (I) to the incident light intensity (Iâ‚€) [3]:
T = I/Iâ‚€
Absorbance (A) relates to transmittance through the following equations [3] [4]:
A = -logâ‚â‚€(T) = -logâ‚â‚€(I/Iâ‚€) = logâ‚â‚€(Iâ‚€/I)
This relationship means that absorbance increases logarithmically as transmittance decreases. The following table illustrates this inverse logarithmic relationship with common absorbance and transmittance pairings:
Table 1: Absorbance and Transmittance Values
| Absorbance (A) | Transmittance (T) |
|---|---|
| 0 | 100% |
| 1 | 10% |
| 2 | 1% |
| 3 | 0.1% |
| 4 | 0.01% |
| 5 | 0.001% |
An absorbance value of 0 corresponds to 100% transmittance (no absorption), while an absorbance of 1 indicates 10% transmittance (90% absorption) [3]. This relationship becomes particularly important when considering the dynamic range of UV-Vis instruments, as most spectrophotometers provide reliable quantitation at absorbance values below 1, where sufficient light reaches the detector for accurate measurement [1].
Instrumentation and Components
UV-Vis spectrophotometers consist of several key components that work in concert to measure light absorption by samples. Understanding these components is essential for proper method development and instrument selection in analytical research.
Core Instrument Components
Table 2: Main Components of a UV-Vis Spectrophotometer
| Component | Function | Common Types |
|---|---|---|
| Light Source | Emits light across a wide range of wavelengths | Deuterium lamp (UV), Tungsten/Halogen lamp (Visible), Xenon lamp (both UV-Vis) [1] [2] |
| Wavelength Selector | Selects specific wavelengths for sample examination | Monochromators (using diffraction gratings), Absorption filters, Interference filters, Bandpass filters [1] |
| Sample Container | Holds the sample during analysis | Cuvettes (typically with 1 cm path length); quartz for UV, glass or plastic for visible range [1] [2] |
| Detector | Converts light into an electronic signal | Photomultiplier tubes (PMT), Photodiodes, Charge-coupled devices (CCD) [1] |
The configuration of these components varies between different instrument designs. Single-beam instruments pass all radiation through the sample in one beam and determine color by comparing light source intensities before and after sample insertion [2]. Double-beam instruments split the radiation into two beams: one passing through the sample and another through a reference, allowing for more accurate measurements by compensating for lamp brightness fluctuations [1] [2]. Array-based systems utilize diode array detectors that can simultaneously capture entire spectra, enabling rapid data acquisition [1].
Figure 1: UV-Vis Spectrometer Workflow
Instrument Selection Considerations
When selecting UV-Vis instrumentation for research applications, several factors must be considered. Benchtop spectrophotometers dominate the market (55.67% share in 2024) due to their superior photometric accuracy and robust qualification kits, making them ideal for regulated environments like pharmaceutical quality control [5]. However, portable/hand-held devices are experiencing rapid growth (7.46% CAGR) driven by point-of-care diagnostics and on-site testing needs [5].
Technologically, dual-beam optics held 41.45% revenue share in 2024, valued for baseline stability during long analytical runs, while diode-array configurations are growing at 7.76% CAGR due to their ability to capture entire spectra in milliseconds, supporting peak-purity checks and forced-degradation profiling [5]. The choice between these technologies should be guided by application requirements, with dual-beam systems offering stability for prolonged studies and diode-array systems providing speed for dynamic reaction monitoring.
Practical Applications in Pharmaceutical Research
UV-Vis spectroscopy serves critical functions throughout drug development pipelines, from initial discovery through quality control of final products.
Quantitative Analysis and Calibration
The primary application of UV-Vis spectroscopy in pharmaceutical research involves quantitative analysis through calibration curves [3] [6]. This process involves measuring the absorbance of a series of standard solutions with known concentrations and plotting absorbance versus concentration to create a linear calibration curve [3] [6]. The concentration of unknown samples can then be determined by measuring their absorbance and referring to the calibration curve [3].
For accurate quantification, the following experimental protocol is recommended:
Preparation of Standard Solutions: Create at least three, but ideally five, standard solutions with concentrations spanning the expected range of the unknown samples [6]. Solutions should be prepared using digital pipettes and volumetric flasks rather than graduated cylinders and beakers to ensure accuracy [6].
Blank Measurement: Use a blank reference containing only the solvent to zero the instrument at the beginning of analysis [1] [6].
Absorbance Measurement: Measure absorbance at the wavelength of maximum absorption (λmax) for each standard solution [3] [6].
Calibration Curve: Plot absorbance versus concentration and determine the line of best fit [3] [6]. The correlation coefficient (R²) should be 0.9 or better for acceptable calibration [6].
Sample Analysis: Measure absorbance of unknown samples and determine concentration using the calibration curve equation [3].
This methodology enables precise quantification of active pharmaceutical ingredients, impurities, and degradation products throughout the drug development process.
Specific Pharmaceutical Applications
Table 3: Pharmaceutical Applications of UV-Vis Spectroscopy
| Application Area | Specific Use | Methodological Considerations |
|---|---|---|
| Drug Discovery | Chemical identification and quantification of novel compounds [2] | Overlapping absorbance peaks can be resolved using mathematical derivatives [2] |
| Quality Control | Quantification of impurities in drug ingredients [2] | Requires validation per regulatory guidelines (ICH, USP) [5] |
| Dissolution Testing | Monitoring drug release from solid oral dosage forms [2] | Often employs flow-through cells with continuous monitoring |
| Biologics Characterization | Protein concentration analysis (e.g., antibodies up to 300 mg/mL) [5] | Variable-pathlength instruments enable direct measurement without dilution [5] |
| Nucleic Acid Analysis | Purity assessment of DNA/RNA samples [2] | 260/280 nm ratio (1.8 for pure DNA, 2.0 for pure RNA) indicates protein contamination [2] |
The pharmaceutical and biotechnology industry constitutes the largest end-user segment of the UV-Vis spectroscopy market, accounting for 48.54% of market share in 2024 [5]. This dominance reflects the technique's indispensable role in modern drug development and quality assurance.
Advanced Methodologies and Complementary Techniques
Experimental Protocol for Method Validation
For regulatory compliance in pharmaceutical applications, UV-Vis methods require rigorous validation. The following protocol outlines key steps:
Linearity and Range: Establish linear relationship between absorbance and concentration across the working range using a minimum of five concentration levels [6]. The correlation coefficient should be ≥0.99 [6].
Accuracy: Determine recovery by spiking placebo with known amounts of analyte (80%, 100%, 120% of target concentration) and calculate percentage recovery [5].
Precision:
- Repeatability: Analyze six sample preparations at 100% concentration and calculate %RSD
- Intermediate precision: Perform analysis on different days, with different analysts, or different instruments [5]
Detection Limit (LOD) and Quantitation Limit (LOQ):
- LOD = 3.3σ/S (where σ is standard deviation of response, S is slope of calibration curve)
- LOQ = 10σ/S [5]
Robustness: Deliberately vary method parameters (wavelength ±2 nm, different instrument manufacturers) and evaluate impact on results [5].
Complementary Technique Integration
UV-Vis spectroscopy is frequently combined with other analytical techniques to provide comprehensive sample characterization:
UV-Vis with NMR: Simultaneous UV-Vis and Nuclear Magnetic Resonance spectroscopy provides insight into both electronic properties and hydrogen geometry of reaction products, particularly useful for studying acid-base chemistry of hydrogen-bonded complexes [7].
UV-Vis with ATR: Combining UV-Vis with Attenuated Total Reflection infrared spectroscopy enables monitoring of oxidation reactions at catalytic interfaces, with ATR identifying dissolved reaction products and UV-Vis tracking catalyst changes [7].
UV-Vis with Raman Spectroscopy: This combination allows researchers to simultaneously track reaction species formation/extinction (UV-Vis) while monitoring atomic-scale structural changes (Raman), providing comprehensive insight into complex reactions [7].
The Scientist's Toolkit: Essential Research Reagents and Materials
Table 4: Essential Research Reagents and Materials for UV-Vis Spectroscopy
| Item | Function | Application Notes |
|---|---|---|
| Quartz Cuvettes | Sample holder with high UV transparency | Essential for UV measurements below 300 nm; compatible with organic solvents [1] |
| Reference Standards | Certified reference materials for method validation | Required for instrument qualification (wavelength, photometric accuracy, stray-light verification) [5] |
| HPLC-Grade Solvents | High-purity solvents for sample preparation | Minimize UV absorption background; common choices include water, methanol, acetonitrile [6] |
| Buffer Salts | Maintain pH-dependent chromophore stability | Phosphate, acetate, and borate buffers at appropriate concentrations [6] |
| Protein Assay Dyes | Specific binding dyes for biomolecule quantification | Bradford, BCA, or Lowry reagents for protein concentration determination [5] |
| Nucleic Acid Standards | Calibration standards for DNA/RNA quantification | Calf thymus DNA or synthetic oligonucleotides for nucleic acid quantification [2] |
| Pterokaurane R | Pterokaurane R, MF:C20H34O3, MW:322.5 g/mol | Chemical Reagent |
| Tenacissimoside J | Tenacissimoside J, MF:C37H58O13, MW:710.8 g/mol | Chemical Reagent |
Limitations and Practical Considerations
Methodological Limitations
Despite its widespread utility, UV-Vis spectroscopy presents several important limitations that researchers must consider when selecting analytical techniques:
Concentration and Path Length Constraints: For accurate quantification using the Beer-Lambert Law, absorbance values should ideally be maintained below 1, as higher values result in insufficient light reaching the detector, compromising measurement reliability [1]. This limitation can be addressed by either diluting the sample or using cuvettes with shorter path lengths [1].
Sample Compatibility: UV-Vis spectroscopy works optimally with liquids and solutions [6]. Suspensions of solid particles in liquid can scatter light more than absorb it, resulting in skewed data [6]. While some instruments can analyze solid samples using diffraction apparatus, this is not common [6].
Spectral Overlap: Mixtures of chromophores with overlapping absorption bands can complicate quantification without mathematical processing or separation techniques [2].
Chemical and Optical Deviations: The Beer-Lambert Law represents an approximation that does not always account for electromagnetic effects arising from the wave nature of light [8]. These effects can cause band shifts and intensity changes based on optical conditions rather than chemical interactions [8].
Comparison with UFLC-DAD
When deciding between UV-Vis spectroscopy and Ultra-Fast Liquid Chromatography with Diode Array Detection (UFLC-DAD) for research applications, consider that UFLC-DAD incorporates UV-Vis detection but adds separation capabilities that address several limitations of stand-alone UV-Vis:
Separation Power: UFLC-DAD separates mixture components before detection, resolving spectral overlap issues encountered in direct UV-Vis analysis [2].
Analysis Time: While UFLC-DAD provides superior separation, it requires longer analysis times compared to direct UV-Vis measurements [5].
Equipment Complexity and Cost: Stand-alone UV-Vis instruments are generally more cost-effective, simpler to operate, and require less maintenance than UFLC-DAD systems [5].
The selection between these techniques should be guided by specific application requirements, with UV-Vis offering rapid, cost-effective analysis for pure compounds or simple mixtures, and UFLC-DAD providing comprehensive characterization for complex mixtures.
UV-Vis spectroscopy, grounded in the fundamental principles of the Beer-Lambert Law, remains an indispensable analytical technique in pharmaceutical research and drug development. Its simplicity, cost-effectiveness, and versatility make it particularly valuable for quantitative analysis, purity assessment, and reaction monitoring throughout the drug development pipeline. While the technique has limitations regarding sample compatibility and spectral overlap, its integration with complementary methodologies and proper method validation establishes it as a reliable workhorse in analytical laboratories. When selecting between UV-Vis and more sophisticated techniques like UFLC-DAD, researchers must balance analysis requirements, time constraints, and resource availability to optimize their analytical approach for specific research objectives.
Ultra-Fast Liquid Chromatography with Diode Array Detection (UFLC-DAD) represents a significant advancement in analytical separation science, combining high-resolution chromatographic separation with full-spectrum ultraviolet-visible detection. This powerful technique has become indispensable in modern laboratories for the analysis of complex mixtures, particularly in pharmaceutical development, food safety, and environmental monitoring. UFLC systems operate at significantly higher pressures than conventional HPLC, utilizing columns packed with smaller particles (typically below 2.2 µm) to achieve superior separation efficiency, reduced analysis time, and lower solvent consumption [9]. When coupled with a Diode Array Detector (DAD), this technique provides not only quantitative data but also spectral information for each separated component, enabling compound identification and purity assessment [10].
The fundamental advantage of UFLC-DAD lies in its ability to provide comprehensive chemical fingerprinting of samples through simultaneous acquisition of chromatographic and spectral data. Unlike conventional UV detectors that measure at a single wavelength, the DAD measures the entire UV-Vis spectrum (typically 190-900 nm) in real-time as compounds elute from the chromatography column [11] [12]. This dual capability makes UFLC-DAD particularly valuable for method development and for analyzing complex samples where compounds may co-elute or where unknown impurities must be identified. The technology has proven essential in environments requiring rapid, reliable, and information-rich analysis, from quality control laboratories to research institutions developing new therapeutic agents [13].
Fundamental Principles of Separation
Core Chromatographic Mechanisms
The separation power of UFLC stems from the differential interaction of sample components with two distinct phases: the stationary phase (contained within the column) and the mobile phase (pumped through the system under high pressure). Separation occurs as analytes are carried by the mobile phase over the stationary phase, with components that have stronger attraction to the stationary phase eluting slower than those with less attraction [11]. The efficiency of UFLC separation significantly surpasses conventional HPLC due to the use of columns packed with smaller particles (often sub-2µm), which provide greater surface area for interactions and enhanced theoretical plate counts [9]. This fundamental improvement allows for faster flow rates and dramatically reduced analysis times while maintaining or even improving resolution.
Two primary separation modes dominate UFLC applications: reverse-phase and normal-phase chromatography. Reverse-phase chromatography, which employs a non-polar stationary phase and a polar mobile phase, is the most common configuration and is particularly effective for separating analytes with moderate to low polarity [11]. The interaction mechanisms vary based on the chemistry employed, with reverse-phase separations exploiting hydrophobicity differences, while ion-exchange chromatography separates compounds based on charge characteristics, making it particularly useful for analyzing protein content or charged molecules [11]. The choice of separation mechanism depends entirely on the chemical properties of the target analytes and the matrix complexity.
Optimization Parameters
Several critical parameters must be optimized to achieve effective separation in UFLC. The mobile phase composition represents perhaps the most significant variable, with careful adjustment of organic solvent ratios (typically acetonitrile or methanol) and buffer conditions dramatically impacting retention times and selectivity [9]. Temperature control column chemistry selection (C8, C18, phenyl, etc.), and flow rate precision all contribute to the final separation efficiency. The enhanced pressure capabilities of UFLC systems (often exceeding 1000 bar) enable the use of smaller particle columns that would be impractical in conventional HPLC systems, directly contributing to the "ultra-fast" performance characteristic of this technology [9].
Table 1: Key Separation Parameters in UFLC Systems
| Parameter | Typical Range | Impact on Separation | Optimization Consideration |
|---|---|---|---|
| Particle Size | 1.7-2.2 µm | Smaller particles increase efficiency but require higher pressure | Balance between resolution and system capabilities |
| Column Temperature | 20-60°C | Higher temperatures reduce viscosity and may improve resolution | Temperature stability is critical for reproducibility |
| Flow Rate | 0.2-1.0 mL/min | Higher flows reduce analysis time but may compromise resolution | Optimize for speed versus resolution requirements |
| Mobile Phase pH | 2.0-8.0 | Affects ionization state of analytes and thus retention | Stability of analytes and column must be considered |
| Gradient Profile | Varies | Determines elution strength over time | Optimize for peak capacity and separation of critical pairs |
Diode Array Detection Fundamentals
Optical Design and Operating Principles
The Diode Array Detector represents a sophisticated evolution in UV-Vis detection for liquid chromatography. Unlike variable wavelength detectors that use a monochromator to select a specific wavelength before the flow cell, DAD employs a fundamentally different approach: polychromatic light passes through the flow cell, and after transmission, the light is dispersed onto an array of photodiodes [12]. This reversed optical design allows simultaneous measurement across the entire wavelength range, typically 190-900 nm, capturing the complete spectrum of each eluting compound every few milliseconds [12]. The heart of the DAD system consists of a deuterium lamp for UV light generation, often augmented with a tungsten lamp for visible range detection, a flow cell with precisely defined pathlength (typically 10 mm), and a diode array comprising hundreds of individual detection elements (typically 512 or 1024 diodes) [12].
The detection process follows the Beer-Lambert law, which states that absorbance (A) is proportional to the product of molar absorptivity (ε), pathlength (b), and analyte concentration (c): A = εbc [12]. This fundamental relationship enables both qualitative identification through spectral matching and quantitative analysis through peak area integration at specific wavelengths. Modern DAD systems maintain exceptionally low noise levels (typically <±1 × 10â»âµ AU), enabling highly sensitive detection while providing linear response across a wide concentration range, which is essential for accurate quantification in pharmaceutical applications where precision requirements are stringent [12].
Comparative Advantage Over Conventional UV Detection
The DAD provides several critical advantages over single wavelength UV detectors. While conventional UV detectors measure at only one or a few predefined wavelengths, DAD simultaneously captures the entire spectral signature of each eluting peak [10]. This capability enables post-run data analysis at any wavelength, facilitating method development and optimization without reinjection of samples. More importantly, the continuous spectral data allows for peak purity assessment by comparing spectra across different regions of a chromatographic peak, identifying potential co-elution that would remain undetected with single-wavelength monitoring [10] [12]. This purity assessment capability is particularly valuable in pharmaceutical analysis where regulatory requirements demand demonstration of method specificity [12].
Another significant advantage is the ability to select the optimal wavelength for quantification after data acquisition, which is particularly beneficial when analyzing complex samples with unknown components. The spectral data also aids in compound identification through library matching, as the UV-Vis spectrum provides characteristic information about chromophores present in the molecule [10]. For natural product analysis, such as distinguishing between different cannabinoids, DAD has proven invaluable in differentiating compounds with similar retention times but distinct spectral profiles, such as neutral cannabinoids (THC, CBD) versus their acidic forms (THCA, CBDA) [10].
Table 2: Comparison of Detection Technologies for Liquid Chromatography
| Detector Type | Key Principle | Advantages | Limitations | Ideal Applications |
|---|---|---|---|---|
| Diode Array (DAD) | Simultaneous multi-wavelength detection | Spectral information, peak purity assessment, post-acquisition wavelength selection | Higher cost than single wavelength UV | Method development, impurity profiling, natural products |
| Variable Wavelength UV | Single wavelength detection via monochromator | Cost-effective, robust, excellent linearity | Limited spectral information | Routine QC of known compounds |
| Fluorescence | Measures light emission from excited molecules | Extremely high sensitivity and selectivity | Limited to native or derivatized fluorescent compounds | Trace analysis, environmental monitoring |
| Mass Spectrometry | Mass-to-charge ratio measurement | Structural identification, high sensitivity | High cost, complexity | Metabolomics, unknown identification |
| Charged Aerosol | Universal detection via charged particle measurement | Uniform response, no chromophore needed | Less sensitive for volatile compounds | Sugars, lipids, polymers |
System Components and Configuration
Essential Hardware Components
A complete UFLC-DAD system comprises several integrated components that must operate in precise coordination to achieve optimal performance. The pumping system represents a critical component, capable of delivering highly stable, pulse-free mobile phase flows at pressures up to 1200 bar or higher, with sophisticated gradient formation capabilities for precise mixing of multiple solvents [9]. The autosampler provides accurate and reproducible sample introduction while minimizing carryover between injections. The column oven maintains stable temperature conditions crucial for retention time reproducibility, especially important in pharmaceutical applications where method robustness is rigorously validated [12].
The chromatography column itself serves as the heart of the separation system, with UFLC-specific columns featuring reduced internal diameters (often 2.1 mm) and stationary phases with particle sizes typically between 1.7-2.2 µm [9]. These columns provide enhanced efficiency but require specialized hardware to handle the resulting high backpressures. The DAD module represents the detection component, with modern systems featuring low-dispersion flow cells (typically 0.5-1 µL for UHPLC systems) to preserve the separation efficiency achieved on column [12]. Advanced DAD systems may incorporate innovative technologies such as LightPipe flow cells that enhance sensitivity through extended pathlength, or novel software functions like i-PDeA (intelligent Peak Deconvolution and Analysis) that mathematically resolve co-eluting peaks based on their spectral differences [10] [13].
Research Reagent Solutions
Successful implementation of UFLC-DAD methodology requires careful selection of consumables and reagents that meet the specific requirements of ultra-fast separations.
Table 3: Essential Research Reagents and Materials for UFLC-DAD
| Item | Function | Technical Specifications | Application Notes |
|---|---|---|---|
| UFLC Column | Stationary phase for compound separation | Sub-2µm particles, 2.1 mm ID, pressure-rated to >1000 bar | Select chemistry (C18, HILIC, etc.) based on analyte polarity |
| Mobile Phase Solvents | Carrier for analytes through the system | HPLC-grade with low UV cutoff, filtered and degassed | Acetonitrile preferred for low UV background, methanol as alternative |
| Buffer Salts | Mobile phase modifiers for pH control | High purity (>99.9%), volatile buffers preferred for MS compatibility | Ammonium formate/acetate for MS; phosphate for UV detection |
| Reference Standards | Compound identification and quantification | Certified reference materials with documented purity | Essential for method validation and accurate quantification |
| Sample Filters | Removal of particulate matter | 0.2 µm PTFE or nylon membrane, low analyte binding | Critical for protecting UFLC columns from particulates |
Advanced Detection Capabilities
Spectral Analysis and Peak Purity Assessment
The multi-wavelength detection capability of DAD enables sophisticated data analysis that extends far beyond simple quantification. Peak purity assessment represents one of the most valuable applications of DAD data, particularly in pharmaceutical analysis where regulatory requirements demand demonstration of method specificity [12]. This assessment involves comparing UV spectra acquired at different points across a chromatographic peak (typically upslope, apex, and downslope) to detect potential co-elution. Software algorithms calculate a purity index or purity angle based on spectral similarity, with significant differences indicating the presence of multiple compounds [12]. This capability is crucial for stability-indicating methods where the active pharmaceutical ingredient must be resolved from degradation products, and in natural product analysis where complex mixtures often contain structurally similar compounds.
Advanced spectral analysis also enables optimal wavelength selection for quantification, as analysts can review full spectra to identify wavelengths that maximize sensitivity for target analytes while minimizing interference from other sample components [10]. The ability to extract chromatograms at multiple wavelengths from a single injection provides additional method development flexibility and can help resolve partially separated peaks when their absorbance maxima differ sufficiently. In research applications, this spectral information can provide preliminary structural insights, particularly when analyzing compounds with characteristic chromophores, such as distinguishing between different classes of flavonoids or identifying compounds with specific substituent patterns based on their spectral characteristics [14].
Peak Deconvolution of Co-eluting Compounds
Perhaps the most advanced application of DAD data is mathematical deconvolution of co-eluting peaks, a capability that addresses one of the most common challenges in chromatographic analysis. Advanced algorithms, such as the i-PDeA function described in Shimadzu systems, utilize both chromatographic profile and spectral differences to virtually separate overlapping peaks [10]. This approach relies on the fundamental principle that each compound has a unique UV-Vis spectrum, which serves as a chemical signature. When peaks partially co-elute, their combined signal contains both temporal information (retention behavior) and spectral information (absorbance characteristics), which sophisticated software can disentangle through multivariate analysis techniques [10].
This deconvolution capability proves particularly valuable when complete chromatographic resolution is difficult to achieve due to structural similarity of compounds or when analysis time constraints prevent method optimization for baseline separation. The technology has demonstrated practical utility in analyzing natural products, such as distinguishing between structurally similar cannabinoids that exhibit distinct spectral profiles despite similar retention times [10]. Unlike traditional integration methods that estimate partially resolved peaks through Gaussian fitting, spectral deconvolution relies on scientifically sound principles of spectral uniqueness, providing more accurate quantification of individual components in complex mixtures without requiring additional separation cycles [10].
Experimental Design and Methodologies
Method Development Protocol
Developing a robust UFLC-DAD method requires systematic optimization of multiple parameters to achieve the desired separation while maintaining compatibility with detection requirements. The process typically begins with column selection based on analyte properties, with C18 columns serving as the default choice for most reverse-phase applications. Mobile phase composition represents the next critical parameter, with initial scouting gradients employed to determine the appropriate solvent strength and selectivity [9]. The use of experimental design (Design of Experiments, DoE) approaches has demonstrated significant advantages over traditional one-factor-at-a-time optimization, enabling more efficient identification of optimal conditions and understanding of factor interactions [9].
A representative method development protocol for pharmaceutical analysis might include these systematic steps: (1) column screening using a generic gradient; (2) optimization of organic modifier percentage using a central composite design; (3) evaluation of buffer pH and concentration; (4) temperature optimization; and (5) final gradient fine-tuning. Throughout this process, DAD detection provides valuable feedback through spectral analysis, helping identify optimal monitoring wavelengths and flag potential co-elution issues [9]. The dramatically reduced analysis times of UFLC compared to conventional HPLC facilitate more rapid method optimization iterations, with run times often reduced 3-5 fold while maintaining or improving resolution [9].
Representative Experimental Applications
UFLC-DAD has been successfully applied across diverse research areas, with several studies demonstrating its capabilities in challenging analytical scenarios. In pharmaceutical development, a validated UFLC-DAD method was developed for simultaneous quantification of anticancer guanylhydrazones (LQM10, LQM14, LQM17) [9]. The method employed a methanol-water (60:40 v/v) mobile phase adjusted to pH 3.5 with acetic acid at ambient temperature, with detection at 290 nm. The UFLC approach demonstrated significant advantages over conventional HPLC, with four times less solvent consumption and 20 times smaller injection volume while maintaining excellent precision (intra-day RSD <2%) and accuracy (98.7-101.5%) [9].
In natural product research, UFLC-DAD-TOF/MS was employed to identify β-amyloid fibrillation inhibitors from Scutellaria baicalensis, demonstrating the technique's power in bioactivity-guided fractionation [15] [16]. The method identified thirteen major chemical components, with significant reduction in peak areas for baicalein and baicalin after incubation with Aβ (1-42) peptide, indicating binding and potential inhibitory activity [16]. This application highlights how DAD spectral data combined with mass detection enables rapid identification of bioactive compounds in complex matrices, significantly accelerating natural product drug discovery.
Another advanced application involves anthocyanin analysis in food matrices, where UFLC-DAD provides superior resolution of structurally similar pigments compared to conventional HPLC [14]. The enhanced speed and resolution of UFLC enables rapid profiling of these unstable compounds, while DAD detection facilitates preliminary identification based on characteristic UV-Vis spectra and monitoring of degradation processes. These diverse applications demonstrate the versatility of UFLC-DAD across different compound classes and analytical challenges.
Table 4: Validation Parameters for a Representative UFLC-DAD Method (Guanylhydrazones Analysis)
| Validation Parameter | LQM10 | LQM14 | LQM17 | Acceptance Criteria |
|---|---|---|---|---|
| Linearity (r²) | 0.9994 | 0.9997 | 0.9997 | r² ≥ 0.999 |
| Accuracy (% Recovery) | 99.3-101.6% | 98.7-101.5% | 99.5-100.5% | 98-102% |
| Precision Intra-day (RSD%) | 0.53% | 0.84% | 1.27% | ≤2% |
| Precision Inter-day (RSD%) | 1.12% | 1.05% | 1.89% | ≤3% |
| Specificity (Similarity Index) | 999 | 999 | 1000 | ≥950 |
| Robustness (Flow Variation RSD%) | 2.07% | 2.34% | 2.54% | ≤3% |
Operational Workflow and Data Analysis
Systematic Analytical Procedure
A standardized operational workflow ensures consistent and reliable UFLC-DAD performance. The process begins with mobile phase preparation using high-purity solvents and buffers, followed by thorough degassing to prevent bubble formation in the high-pressure system and DAD flow cell [12]. System equilibration follows, typically requiring 10-15 column volumes until stable baseline is achieved, with monitoring of backpressure and baseline noise as key indicators of system readiness. Sample preparation must be appropriate for UFLC sensitivity, typically involving dissolution in mobile phase or weaker solvent, filtration through 0.2 µm membranes, and consideration of injection volume (typically 1-5 µL for UFLC) to maintain separation efficiency [9].
The analytical sequence should include appropriate system suitability tests as defined by regulatory guidelines, typically evaluating parameters such as plate count, tailing factor, resolution between critical pairs, and repeatability of retention time and peak area [12]. During data acquisition, DAD parameters must be optimized including spectral acquisition range (typically 200-400 nm for most small molecules), spectral bandwidth (typically 1-4 nm for balance of sensitivity and specificity), and acquisition rate (typically 10-40 Hz depending on peak widths) [12]. Post-acquisition, data processing includes integration parameter optimization, wavelength selection for quantification, and spectral analysis for peak purity assessment or compound identification.
Data Interpretation and Troubleshooting
Effective interpretation of UFLC-DAD data extends beyond simple peak integration to comprehensive assessment of chromatographic and spectral information. Retention time stability provides insights into system performance, with shifts potentially indicating column degradation, mobile phase composition errors, or temperature fluctuations. Peak shape evaluation (tailing, fronting, broadening) can reveal secondary interactions, column overload, or extra-column volume issues. The DAD spectral data enables additional troubleshooting capabilities; for example, changing spectral profiles across a peak may indicate co-elution, while unexpected spectral features might suggest degradation during analysis or contamination [10] [12].
Advanced data analysis includes multi-wavelength processing to maximize sensitivity for trace components, three-dimensional plotting (time-wavelength-absorbance) for comprehensive sample visualization, and spectral library searching for compound identification. For complex separations, the peak deconvolution algorithms available in modern DAD software can mathematically resolve overlapping peaks, provided their spectral features differ sufficiently [10]. When method issues arise, systematic troubleshooting should address both the chromatographic separation (retention, resolution, peak shape) and detection aspects (sensitivity, baseline noise, spectral anomalies), recognizing that these elements are interconnected in a properly optimized UFLC-DAD method.
Application in Broader Analytical Context
UFLC-DAD occupies a strategic position in the hierarchy of analytical techniques, particularly in the context of pharmaceutical analysis and quality control. The technology bridges the gap between conventional HPLC and more sophisticated LC-MS systems, providing more information than single-wavelength UV detection without the complexity and cost of mass spectrometry [13]. This positioning makes UFLC-DAD ideal for routine analysis where reliability, precision, and information content must be balanced against operational costs and technical requirements. In regulated environments, the peak purity assessment capability of DAD provides critical data for method validation specifically addressing specificity requirements [12].
The role of UFLC-DAD continues to evolve with technological advancements. As computational power increases, more sophisticated data analysis algorithms enable extraction of additional information from DAD spectral data, including preliminary structural predictions and enhanced peak deconvolution capabilities [10]. The combination of UFLC-DAD with other detection techniques, particularly mass spectrometry, creates powerful hyphenated systems that leverage the strengths of each technology [15] [16]. In such configurations, UFLC provides high-resolution separation, DAD offers universal detection with spectral information, and MS delivers molecular weight and structural information. This comprehensive approach has proven particularly valuable in complex sample analysis, such as natural product characterization or impurity profiling in pharmaceuticals, where complete chemical understanding requires multiple information dimensions [14] [16].
For researchers selecting analytical techniques, UFLC-DAD represents the optimal choice when dealing with known chromophoric compounds requiring precise quantification with additional confidence in peak identity and purity. For completely unknown identification or compounds without chromophores, mass spectrometry or universal detectors represent better alternatives [13]. However, for the vast majority of pharmaceutical and natural product applications, UFLC-DAD provides an unparalleled balance of performance, information content, and practical utility, establishing it as a cornerstone technology in modern analytical laboratories.
Comparative Strengths and Inherent Limitations of Each Technique
Ultraviolet-Visible (UV-Vis) spectroscopy and Ultra-Fast Liquid Chromatography with Diode Array Detection (UFLC-DAD) represent two cornerstone analytical techniques in modern laboratories. While both methods leverage the principle of light absorption by molecules, they offer distinct capabilities and are suited to different analytical challenges. UV-Vis spectroscopy provides a rapid, straightforward means of quantifying analytes in solution, whereas UFLC-DAD combines high-resolution separation with comprehensive spectral characterization. Within the context of pharmaceutical research, food science, environmental monitoring, and cosmetic quality control, understanding the comparative strengths and limitations of these techniques is paramount for selecting the appropriate method for specific analytical needs. This guide provides an in-depth technical comparison to inform researchers, scientists, and drug development professionals in their methodological decision-making [12] [1] [17].
Fundamental Principles and Instrumentation
UV-Vis Spectroscopy: Core Principles
UV-Vis spectroscopy is an analytical technique that measures the amount of discrete wavelengths of ultraviolet or visible light absorbed by a sample in comparison to a reference or blank. The fundamental principle is based on the excitation of electrons to higher energy states when molecules absorb light with energy corresponding to the energy difference between molecular orbitals. The absorbance (A) of light is quantitatively described by the Beer-Lambert law: A = ε * c * L, where ε is the molar absorptivity (a compound-specific constant), c is the concentration, and L is the path length of light through the sample. The resulting absorption spectrum, a plot of absorbance versus wavelength, provides a characteristic fingerprint for many compounds, with the wavelength of maximum absorption (λmax) being particularly useful for identification and quantification [1].
The instrumentation for UV-Vis spectroscopy typically consists of several key components as visualized in Figure 1:
Figure 1. Schematic of a UV-Vis Spectrophotometer. The light source emits broad-spectrum light, which is filtered to specific wavelengths. This monochromatic light passes through the sample, and the detector measures the intensity before and after the sample to calculate absorbance.
A light source (often a deuterium lamp for UV and a tungsten/halogen lamp for visible regions) emits broad-spectrum light. A wavelength selection system, such as a monochromator (containing a diffraction grating with 300-2000 grooves per mm) or filters, isolates specific wavelengths. The sample is contained in a cuvette (typically quartz for UV, with a standard pathlength of 1 cm), and a detector (e.g., photomultiplier tube, photodiode, or CCD) converts the transmitted light intensity into an electrical signal for data processing. The key measurement is the ratio of the intensity of light after passing through the sample (I) to the initial intensity (Iâ‚€), known as transmittance, from which absorbance is calculated as A = -log(I/Iâ‚€) [1].
UFLC-DAD: Core Principles
UFLC-DAD is a hybrid technique that couples the high-resolution separation power of liquid chromatography with the spectroscopic capabilities of a diode array detector. The chromatography component separates a complex mixture into its individual constituents based on their differential partitioning between a stationary phase (column packing material) and a mobile phase (liquid solvent pumped at high pressure). UFLC, a derivative of HPLC, utilizes columns packed with smaller particles (<2 μm) and operates at higher pressures, resulting in enhanced speed, resolution, and sensitivity compared to conventional HPLC [18] [19].
The role of the DAD is critical. Unlike a single-wavelength UV detector, the DAD captures the complete UV-Vis spectrum (e.g., 190-600 nm) of each analyte as it elutes from the chromatography column. This is achieved by passing the light through the flow cell (with volumes of 0.5–1 µL for UHPLC) and then dispersing it onto an array of hundreds of photodiodes (e.g., 512 or 1024). This allows for simultaneous multi-wavelength detection and the collection of full spectral data for each point in the chromatogram [12] [10].
A schematic of the UFLC-DAD system is shown in Figure 2:
Figure 2. Schematic of a UFLC-DAD System. A high-pressure pump delivers the mobile phase, which mixes the solvents and carries the injected sample through the separation column. The separated components then pass through the DAD flow cell, where full UV-Vis spectra are continuously acquired.
Comparative Strengths and Limitations
The choice between UV-Vis spectroscopy and UFLC-DAD is dictated by the analytical problem, sample complexity, and required information. Their core strengths and inherent limitations are compared in Table 1 and detailed in the following sections.
Table 1: Comparative Analysis of UV-Vis Spectroscopy and UFLC-DAD
| Feature | UV-Vis Spectroscopy | UFLC-DAD |
|---|---|---|
| Principle | Measures light absorption by a solution [1] | Combines chromatographic separation with full-spectrum UV-Vis detection [12] [10] |
| Analytical Information | Total analyte content, concentration, reaction monitoring [1] | Individual quantification, identification, and purity assessment of multiple components [12] [10] |
| Sample Complexity | Low to moderate (solutions with few absorbing species) [1] | High (complex mixtures like plant extracts, pharmaceuticals, biofluids) [18] [19] |
| Speed of Analysis | Very fast (seconds to minutes) [17] | Moderate to fast (minutes to tens of minutes) [18] |
| Sensitivity | Good (e.g., LOD for Bakuchiol: ~µg/mL range via calibration) [17] | Excellent (e.g., LOD for posaconazole: ~1 µg/mL; phenolic compounds: ng range) [18] [19] |
| Selectivity | Low, unless analytes have distinct, non-overlapping spectra [1] | Very High, via two orthogonal dimensions: retention time and spectrum [12] [10] |
| Peak Purity/Purity Assessment | Not possible | Yes, via spectral comparison across a peak [10] |
| Quantitation without Standard | Possible via Beer-Lambert law with known ε [1] | Requires standards for identification and calibration [12] |
| Method Development & Cost | Simple, fast, and low cost [1] [13] | Complex, time-consuming, and higher cost (instrumentation & solvents) [13] |
Strengths of UV-Vis Spectroscopy
- Simplicity and Ease of Use: UV-Vis spectrophotometers are straightforward to operate, requiring minimal training. Method development is typically rapid, involving primarily the selection of an appropriate wavelength and solvent [1] [13].
- Speed and High Throughput: Analysis time is very short, often taking only seconds to minutes per sample, making it ideal for kinetic studies and high-throughput quantitative analysis [17].
- Cost-Effectiveness: Both the initial capital investment and operational costs are low compared to chromatographic systems. It requires no expensive consumables like chromatography columns [13] [20].
- Non-Destructive Nature: The sample is generally recoverable after analysis, as the technique typically does not alter or consume the analyte [1].
- Quantitative Accuracy: For a single, well-defined analyte in a clean solution, UV-Vis provides highly precise and accurate quantification with a wide linear dynamic range, crucial for applications like pharmaceutical quality control where precision of <0.2% RSD is required [12].
Limitations of UV-Vis Spectroscopy
- Lack of Selectivity: The primary limitation is its inability to resolve mixtures. The measured absorbance is the sum of contributions from all light-absorbing species in the solution, leading to potential inaccuracies in complex matrices [1].
- Requirement for Chromophores: The analyte must contain a chromophore (a functional group that absorbs UV or visible light). Compounds like sugars, alcohols, and many polymers cannot be detected directly [13] [20].
- Matrix Interference: The technique is highly susceptible to interference from colored or turbid samples, which can scatter light and cause significant measurement errors. This often necessitates extensive sample preparation [1] [17].
Strengths of UFLC-DAD
- High Selectivity and Resolution: The combination of chromatographic separation and spectral identification provides two orthogonal dimensions of selectivity. Co-eluting compounds can often be resolved and quantified if their spectra are distinct, using advanced software features like peak deconvolution (e.g., Shimadzu's i-PDeA) [10] [19].
- Comprehensive Information: DAD provides both quantitative data (peak area) and qualitative information (retention time and UV-Vis spectrum) for each separated component in a single run. This is invaluable for identifying unknown peaks and confirming the identity of target analytes [12] [10].
- Peak Purity Assessment: By comparing spectra from the upslope, apex, and downslope of a chromatographic peak, DAD can assess peak homogeneity. This is a critical tool in pharmaceutical analysis for detecting co-eluting impurities [12] [10].
- Enhanced Sensitivity: UFLC systems, with their smaller particle sizes, produce sharper peaks, leading to lower limits of detection. For example, an LOD of 0.82 µg/mL was reported for posaconazole using HPLC-DAD [18].
- Universal Data Collection: The DAD collects data across all wavelengths simultaneously, allowing the user to retrospectively reprocess data and quantify compounds at different wavelengths without reinjecting the sample [12].
Limitations of UFLC-DAD
- Complexity and Cost: The instrumentation is significantly more complex and expensive to purchase, operate, and maintain. It also requires a continuous supply of high-purity solvents and columns [13].
- Longer Analysis Times: A typical chromatographic run takes several minutes to over an hour, which limits sample throughput compared to UV-Vis [18].
- Requirement for Method Development: Developing a robust chromatographic method that adequately separates all components of interest can be a time-consuming process requiring expert knowledge [13].
- Indirect Quantification: Unlike UV-Vis, quantification in chromatography is almost always relative, depending on comparison to a calibrated standard. It cannot directly use the Beer-Lambert law for absolute quantitation without a standard [12].
Experimental Protocols and Applications
Protocol: Quantification of an Active Ingredient in Cosmetics by UV-Vis
A study quantifying bakuchiol in cosmetic serums demonstrates a typical UV-Vis protocol [17].
- Objective: To determine the concentration of bakuchiol in commercial cosmetic serums.
- Sample Preparation: For oil-based serums, a weighed amount of the product was dissolved directly in ethanol. For oil-in-water emulsions, complete dissolution was not always achievable, leading to potential quantification issues [17].
- Instrumentation: UV-Vis spectrophotometer with quartz cuvettes (1 cm pathlength).
- Methodology:
- A standard solution of pure bakuchiol was prepared in ethanol.
- The UV-Vis spectrum (e.g., 200-400 nm) of the standard was acquired, identifying λmax at 262 nm.
- A calibration curve was constructed by measuring the absorbance at 262 nm for a series of standard solutions of known concentration.
- The sample solutions were measured at the same wavelength, and the concentration was determined by interpolating the absorbance value against the calibration curve.
- Key Reagents and Materials:
- Ethanol (HPLC grade): Serves as the solvent for dissolving standards and samples.
- Bakuchiol standard: High-purity reference material for creating the calibration curve.
- Quartz cuvettes: Required for accurate UV transmission, as plastic and glass absorb UV light.
Protocol: Analysis of Phenolic Compounds in Apple Juice by UFLC-DAD
A study comparing UHPLC-UV and UHPLC-MS/MS for phenolic compounds in apple juice provides a robust UFLC-DAD protocol [19].
- Objective: To separate, identify, and quantify multiple phenolic compounds in a complex apple juice matrix.
- Sample Preparation: Raw apple juice was mixed with an equal volume of methanol containing 1% acetic acid to improve compound stability during analysis and precipitate proteins. The mixture was then centrifuged and filtered before injection [19].
- Chromatographic Conditions:
- Column: Kinetex-C18 (2.1 x 50 mm, 1.3 µm).
- Mobile Phase: A gradient elution composed of acetonitrile and an aqueous buffer (e.g., 15 mM potassium dihydrogen orthophosphate).
- Flow Rate: 0.4 mL/min.
- Column Temperature: 40 °C.
- Injection Volume: 5 µL.
- DAD Conditions: Full spectra were collected from 190-400 nm. For quantification of specific phenolics like catechin, chlorogenic acid, and phloridzin, their respective λmax values were used.
- Key Reagents and Materials:
- UHPLC column with sub-2µm particles: Essential for high-resolution separation under high pressure.
- MS-grade acetonitrile and water: High-purity solvents to prevent baseline noise and column damage.
- Acetic acid: Added to the mobile phase or sample to suppress ionization of acidic analytes and improve peak shape.
- Phenolic compound standards: A suite of standards is necessary for identifying peaks and constructing calibration curves.
Application Case Studies
- Pharmaceutical Quality Control: A study developed and validated both HPLC-DAD and UHPLC-UV methods for quantitating the antifungal drug posaconazole in a suspension. The UHPLC-UV method offered superior speed (3 min vs. 11 min run time) and reduced solvent consumption, demonstrating the advantage of UFLC for routine quality control where high throughput is desired. Both methods showed excellent linearity (r² > 0.999) and precision (CV% < 3%), meeting ICH guidelines [18].
- Food and Beverage Analysis: UV-Vis and synchronous fluorescence spectroscopy were compared with HPLC-DAD for predicting the age of sweet wines. While spectroscopic methods coupled with chemometrics offered a faster, cheaper alternative, HPLC-DAD was critical for identifying and quantifying specific phenolic compounds (e.g., catechin, gallic acid, caftaric acid) whose changing concentrations correlated with wine aging. This highlights the role of UFLC-DAD in providing definitive compound-specific data to validate simpler, high-throughput methods [21].
- Analysis of Complex Plant Matrices: The comparison of UHPLC-UV and UHPLC-MS/MS for phenolic compounds in apple juice revealed that UV detection is highly effective for major compounds. However, challenges like co-elution can lead to overestimation of certain compounds, a limitation that can be mitigated by the superior resolution of UFLC and the peak purity assessment capability of the DAD [19].
Technique Selection Guide
The decision-making process for selecting between UV-Vis and UFLC-DAD is summarized in Figure 3.
Figure 3. Technique Selection Workflow. This diagram guides the user through key questions to determine the most appropriate analytical technique based on their sample and information requirements.
When to Choose UV-Vis Spectroscopy
- For routine quantitation of a known analyte in a relatively clean matrix, such as checking the concentration of an active pharmaceutical ingredient (API) in a standard solution [12] [17].
- When speed and cost are primary drivers, and the necessary selectivity can be achieved through simple sample preparation.
- For kinetic studies or monitoring reactions in real-time, where rapid, continuous measurements are required [1].
- When the analyte lacks a chromophore, consider that neither technique is suitable. Alternative detectors like Refractive Index (RI) or Charged Aerosol Detection (CAD) would be necessary [13] [20].
When to Choose UFLC-DAD
- For analyzing complex mixtures containing multiple, potentially unknown, components that require separation, such as plant extracts, environmental samples, or formulated products [18] [19].
- When confirmatory analysis is critical, and information beyond retention time (i.e., a UV spectrum) is needed to confidently identify a compound [10].
- For impurity profiling or peak purity assessment in pharmaceutical development to meet regulatory requirements [12] [10].
- During method development, where the ability to retrospectively reprocess data at different wavelengths can save significant time and resources.
UV-Vis spectroscopy and UFLC-DAD are powerful yet distinct tools in the analytical chemist's arsenal. UV-Vis stands out for its simplicity, speed, and cost-effectiveness for targeted quantitative analysis of pure substances or simple mixtures. In contrast, UFLC-DAD excels in resolving, identifying, and quantifying individual components within complex matrices, providing a depth of information that is unattainable with standalone spectroscopy. The choice between them is not a matter of one being universally superior but hinges on the specific analytical question, the nature of the sample, and the required level of certainty. By understanding their complementary strengths and inherent limitations, researchers and drug development professionals can make informed decisions, ensuring the selection of the most efficient and effective technique for their specific application.
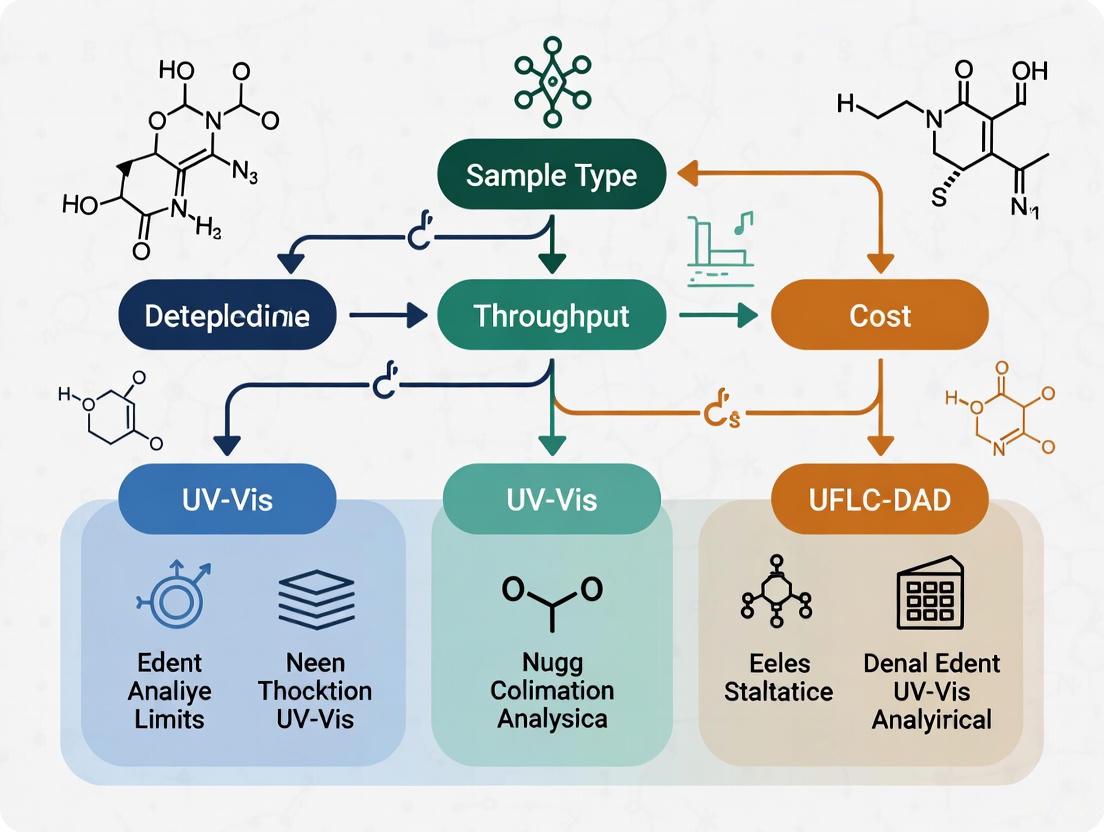
Selecting a Technique Based on Analytical Target Profile (ATP)
In modern pharmaceutical research and quality control, the selection of an appropriate analytical technique is a critical decision that directly impacts the reliability, efficiency, and regulatory compliance of analytical data. This decision-making process must be guided by a structured Analytical Target Profile (ATP), which defines the required performance characteristics of an analytical procedure based on its intended purpose. An ATP explicitly outlines the quality attributes to be measured, the required accuracy and precision, and the appropriate measurement conditions. Within this framework, scientists must frequently choose between established techniques like Ultraviolet-Visible spectroscopy (UV-Vis) and more advanced separation-based methods like Ultra-Fast Liquid Chromatography with Diode Array Detection (UFLC-DAD).
This technical guide provides a structured approach for researchers, scientists, and drug development professionals to select between UV-Vis and UFLC-DAD based on a predefined ATP. We present core principles, direct performance comparisons, detailed experimental protocols, and decision-making workflows to guide this selection process, ensuring that the chosen technique aligns with both analytical requirements and operational constraints.
Core Principles and Instrumentation of UV-Vis and UFLC-DAD
UV-Visible Spectroscopy (UV-Vis)
UV-Vis spectroscopy is a classical analytical technique that measures the absorption of ultraviolet or visible light by a sample. The fundamental principle is governed by the Beer-Lambert Law, which states that absorbance is directly proportional to the concentration of the absorbing species, the path length of the measurement cell, and the compound-specific molar absorptivity [12]. A UV-Vis detector in a liquid system typically uses a deuterium (D2) lamp for the UV range (190–380 nm) and may be supplemented with a tungsten lamp for the visible range (380–950 nm) [22]. In a variable wavelength detector (VWD), light of a specific wavelength is selected using a monochromator before it passes through the flow cell [12].
Ultra-Fast Liquid Chromatography with Diode Array Detection (UFLC-DAD)
UFLC-DAD combines high-speed chromatographic separation with full-spectrum ultraviolet detection. UFLC utilizes columns packed with smaller particles (<2 µm) and operates at higher pressures compared to conventional HPLC, resulting in enhanced speed, resolution, and sensitivity [18]. The Diode Array Detector (DAD), also known as a Photodiode Array (PDA), represents a significant advancement over single-wavelength UV detection. Its optical system differs in that light from the source passes directly through the flow cell, and the transmitted light is then dispersed by a diffraction grating onto an array of photodiodes (e.g., 512 or 1024 elements). This allows for the simultaneous capture of the entire UV-Vis spectrum for each data point in the chromatogram [12] [22]. This capability for spectral confirmation is pivotal for peak identity verification and purity assessment [23].
Comparative Analysis: UV-Vis vs. UFLC-DAD
The choice between UV-Vis and UFLC-DAD is fundamentally dictated by the complexity of the sample and the specificity of information required by the ATP. The table below summarizes the core differentiating factors.
Table 1: Key Characteristics of UV-Vis and UFLC-DAD
| Characteristic | UV-Vis Spectroscopy | UFLC-DAD |
|---|---|---|
| Analytical Principle | Measures absorption of light by a sample without separation | Combines chromatographic separation with spectral detection |
| Information Output | Total absorbance at specified wavelength(s); concentration | Retention time, quantitative concentration, and full UV-Vis spectrum |
| Specificity | Low for mixtures; requires selective wavelength or sample purity | High; based on retention time and spectral match |
| Peak Purity Assessment | Not possible | Yes, by comparing spectra across a peak |
| Analysis Speed | Very fast (minutes) | Fast, but longer than UV-Vis (run time-dependent) |
| Sample Complexity | Suitable for pure solutions or simple mixtures | Ideal for complex mixtures (e.g., formulations, biological matrices) |
| Impurity Profiling | Limited; cannot resolve co-absorbing impurities | Excellent; can detect and identify co-eluting impurities [23] |
| Data Acquisition Rate | N/A (continuous measurement) | Adjustable (e.g., 0.31 to 80 Hz); higher rates improve peak definition [24] |
Quantitative Performance and Validation
The ATP must define required performance metrics such as linearity, accuracy, and limits of detection/quantitation (LOD/LOQ). A direct comparison study of Levofloxacin quantification demonstrates how technique selection impacts these parameters.
Table 2: Quantitative Performance Comparison for Levofloxacin Analysis [25]
| Parameter | HPLC-UV (Similar to UFLC-DAD) | UV-Vis |
|---|---|---|
| Linear Range | 0.05 – 300 µg/mL | 0.05 – 300 µg/mL |
| Regression Equation | y = 0.033x + 0.010 | y = 0.065x + 0.017 |
| Coefficient (R²) | 0.9991 | 0.9999 |
| Recovery (Low Conc.) | 96.37 ± 0.50% | 96.00 ± 2.00% |
| Recovery (Medium Conc.) | 110.96 ± 0.23% | 99.50 ± 0.00% |
| Recovery (High Conc.) | 104.79 ± 0.06% | 98.67 ± 0.06% |
While both methods showed a wide linear range and excellent R² values, the HPLC-UV method exhibited variable and less accurate recovery rates at medium and high concentrations in a complex scaffold matrix, whereas UV-Vis recovery was consistently close to 100%. This counter-intuitive result highlights that in specific contexts where the analyte is free from interference, UV-Vis can provide superior accuracy, while chromatographic methods may be affected by matrix interactions [25]. However, for impurity analysis in pharmaceuticals, the ICH Q3A guidelines implicitly assume UV detection for stability-indicating methods, requiring high precision (<0.2% RSD) and sensitivity for quantitation down to 0.05–0.10% [12].
Experimental Protocols and Workflows
Detailed Protocol for UFLC-DAD Analysis of a Pharmaceutical Formulation
The following protocol, adapted from the analysis of Posaconazole suspension, outlines a typical UFLC-DAD method for quantifying an Active Pharmaceutical Ingredient (API) in a formulation [18].
- Instrumentation: Agilent 1290 Infinity Binary Pump LC system coupled with a DAD and an autosampler. Data collection and analysis are performed using ChemStation software.
- Chromatographic Conditions:
- Column: Kinetex-C18 (2.1 × 50 mm, 1.3 µm).
- Mobile Phase: Acetonitrile and 15 mM potassium dihydrogen orthophosphate (45:55, v/v).
- Flow Rate: 0.4 mL/min.
- Injection Volume: 5 µL.
- Column Temperature: 40 °C.
- Run Time: 3 minutes.
- DAD Acquisition Settings:
- Detection Wavelength: 262 nm (for quantification).
- Spectral Acquisition: Full spectrum from 190–400 nm for peak identity and purity.
- Bandwidth: 4 nm (range of wavelengths averaged for the primary signal).
- Data Acquisition Rate: 20 Hz (to ensure sufficient data points across narrow UHPLC peaks).
- Sample Preparation:
- Accurately weigh an amount of the pharmaceutical suspension equivalent to about 4 mg of Posaconazole.
- Dilute to 10 mL with methanol and vortex mix (Solution S1).
- Further dilute 0.1 mL of S1 to 1 mL with methanol containing the internal standard (Itraconazole, 10 µg/mL).
- Centrifuge if necessary, and transfer the supernatant to an LC vial for analysis.
- Validation Parameters:
- Linearity: Prepare and analyze standard solutions across the concentration range of 5–50 µg/mL.
- Precision and Accuracy: Analyze replicate samples (n=3) at low, medium, and high concentrations within the linear range on the same day (intra-day) and on three different days (inter-day).
Detailed Protocol for UV-Vis Analysis of a Cosmetic Ingredient
This protocol, derived from the quantification of Bakuchiol in cosmetic serums, describes a direct UV-Vis method for a pure analyte in solution [17].
- Instrumentation: UV-Vis spectrophotometer (e.g., Shimadzu UV-2600) with 1 cm pathlength quartz cuvettes.
- Method Development and Conditions:
- Wavelength Selection: Dissolve the pure Bakuchiol standard in ethanol and scan from 200–400 nm to identify the maximum absorbance (λmax), found to be 262 nm.
- Bandwidth: Set to 1–2 nm for high spectral resolution.
- Sample Preparation:
- For oil-based serums (samples 1-4): Accurately weigh a small amount of the product and dissolve it directly in ethanol to a nominal concentration within the linear range.
- For water-containing emulsions (samples 5-6): Liquid-liquid extraction may be required. The sample is shaken with ethanol, and the organic layer is separated and diluted for analysis. Note: incomplete extraction can lead to quantification errors [17].
- Vortex mix and centrifuge if the solution is not clear.
- Calibration and Quantification:
- Prepare a stock solution of authentic Bakuchiol standard in ethanol.
- Create a series of standard solutions by serial dilution to cover a concentration range of, for example, 1–50 µg/mL.
- Measure the absorbance of each standard and the sample at 262 nm.
- Construct a calibration curve (Absorbance vs. Concentration) and determine the sample concentration using the linear regression equation.
The Scientist's Toolkit: Essential Research Reagent Solutions
Table 3: Key Reagents and Materials for UV-Vis and UFLC-DAD Analysis
| Item | Function / Description | Example Use Case |
|---|---|---|
| Deuterium (D₂) Lamp | Provides stable, continuous light source in the UV range (190–400 nm). | Standard light source in both VWD and DAD detectors [12]. |
| Photodiode Array | Semiconductor device consisting of hundreds of individual diodes that simultaneously detect a range of wavelengths. | Enables full-spectrum acquisition in DAD for peak purity and identification [22]. |
| UHPLC Column | Column packed with sub-2µm particles for high-efficiency separations. | Kinetex-C18 (1.3 µm) for fast separation of Posaconazole [18]. |
| HPLC-Grade Solvents | High-purity solvents (ACN, MeOH, water) with low UV absorbance background. | Mobile phase preparation to minimize baseline noise and ghost peaks. |
| Buffer Salts | Provides controlled pH and ionic strength in the mobile phase. | 15 mM Potassium dihydrogen orthophosphate for Posaconazole analysis [18]. |
| Standard Reference Material | High-purity analyte of known identity and concentration. | Used for calibration curve construction and method validation [17]. |
| Codaphniphylline | Codaphniphylline, MF:C30H47NO3, MW:469.7 g/mol | Chemical Reagent |
| Hericenone J | Hericenone J, MF:C19H24O4, MW:316.4 g/mol | Chemical Reagent |
A Structured Workflow for Technique Selection Based on ATP
The following diagram illustrates a logical decision-making process for selecting between UV-Vis and UFLC-DAD, grounded in the specific requirements of the ATP.
Technique Selection Workflow
The selection between UV-Vis and UFLC-DAD is not a matter of one technique being universally superior to the other. Instead, it is a strategic decision that must be anchored in a well-defined Analytical Target Profile. UV-Vis spectroscopy offers a robust, rapid, and cost-effective solution for the quantitative analysis of pure substances or simple mixtures in routine quality control. In contrast, UFLC-DAD provides a powerful orthogonal approach that delivers high specificity, making it indispensable for method development, analysis of complex matrices, and whenever definitive peak identification or purity assessment is mandated.
By applying the structured comparison, detailed protocols, and the decision workflow outlined in this guide, scientists and drug development professionals can make informed, defensible choices that ensure analytical methods are fit-for-purpose, efficient, and compliant with regulatory standards.
Techniques in Action: Method Development and Real-World Applications
In the landscape of pharmaceutical analysis, the selection of an appropriate analytical technique is paramount for ensuring drug quality, stability, and efficacy. This guide is situated within a broader research thesis comparing Ultraviolet-Visible (UV-Vis) spectroscopy and Ultra-Fast Liquid Chromatography with Diode Array Detection (UFLC-DAD). While UFLC-DAD offers high separation power and specificity for complex mixtures, UV-Vis spectroscopy remains a vital, rapid, and economical tool for the quantitative analysis of active pharmaceutical ingredients (APIs) in bulk and formulated products, especially when dealing with pure compounds or simple matrices [26] [27]. Its utility extends to critical applications such as assay development, drug stability testing, and determining key parameters like the drug-to-antibody ratio (DAR) in antibody-drug conjugates [27] [28]. The robustness of a UV-Vis method, however, is fundamentally anchored in two core development stages: the judicious selection of a suitable solvent and the precise optimization of the analytical wavelength. This technical guide provides an in-depth examination of these critical steps, complete with detailed protocols and data presentation frameworks.
Core Principles of UV-Vis Spectroscopy
UV-Vis spectroscopy operates on the principle of measuring the absorption of ultraviolet or visible light by a molecule. When a molecule absorbs light of a specific energy, it undergoes an electronic transition from a ground state to an excited state. The wavelength at which maximum absorption occurs (λmax) is characteristic of the molecule's chemical structure, particularly the presence of chromophores, which are functional groups capable of absorbing light (e.g., C=C, C=O, aromatic rings). The intensity of the absorption at λmax, governed by the Beer-Lambert Law (A = ε * b * c), provides the basis for quantitative analysis, where A is the absorbance, ε is the molar absorptivity, b is the path length, and c is the concentration.
A key advantage of UV-Vis in a pharmaceutical context is its role in drug stability testing. Stressors like light, temperature, and pH can cause chemical degradation, altering the API's absorption profile. UV-Vis serves as a fast and reliable method to monitor these changes, providing critical data on potency and the formation of impurities early in the drug development process, thereby informing decisions about a drug's commercial viability [28].
Solvent Selection: A Critical First Step
The choice of solvent is a critical determinant in the success of a UV-Vis method, as it can significantly influence the absorption spectrum of the analyte.
Key Selection Criteria
- Solvent Transparency: The solvent must not absorb significantly in the spectral region where the analyte absorbs. This ensures that the measured absorbance is primarily from the analyte of interest. Standard solvents have specific "UV cut-off" wavelengths below which they exhibit strong absorption.
- Solubility and Stability: The solvent must completely dissolve the analyte without causing chemical degradation or interaction during the analysis. The analyte should be stable in the chosen solvent for the duration of the measurement and method development process.
- Polarity and Hydrogen Bonding: The solvent's polarity can cause shifts in the analyte's λmax. More polar solvents can stabilize excited states, often leading to a redshift (bathochromic shift) compared to spectra obtained in non-polar solvents. The potential for hydrogen bonding can also affect the absorption profile.
Common Solvents and Their Properties
The table below summarizes the key characteristics of solvents commonly used in UV-Vis method development.
Table 1: Properties of Common Solvents for UV-Vis Spectroscopy
| Solvent | UV Cut-off (nm) | Polarity | Common Applications & Notes |
|---|---|---|---|
| Water | ~190 nm | High | Ideal for water-soluble, ionizable compounds; compatible with biological APIs [26]. |
| Methanol | ~205 nm | High | Good for a wide range of polar organic compounds. |
| Ethanol | ~210 nm | High | Similar to methanol; often preferred for its lower toxicity. |
| n-Hexane | ~210 nm | Low | Suitable for non-polar analytes; minimal solvent shift. |
| Acetonitrile | ~190 nm | Medium-High | Excellent transparency; often used in HPLC and compatible with UV-Vis. |
| Chloroform | ~245 nm | Low | Used for non-polar compounds; higher cut-off limits useful range. |
| 1,4-Dioxane | ~215 nm | Low | Useful for a variety of organic compounds. |
Wavelength Optimization and Method Validation
Once a suitable solvent is selected, the next critical step is to identify the optimal analytical wavelength and rigorously validate the method to ensure it is fit for its intended purpose.
Experimental Workflow for Wavelength Optimization
The following diagram outlines the logical workflow for developing and optimizing a UV-Vis method, from solvent selection to final validation.
Detailed Experimental Protocol
The workflow can be executed using the following detailed procedures, which are aligned with ICH guidelines for method validation [26].
- Preparation of Standard Stock Solution: Accurately weigh approximately 10 mg of the API (e.g., terbinafine hydrochloride). Transfer this to a 100 mL volumetric flask. Dissolve in about 20 mL of the selected solvent (e.g., water), shaking manually for 10 minutes. Dilute to the mark with the same solvent to achieve a final concentration of 100 µg/mL [26].
- Wavelength Scanning and λmax Determination: Pipette an appropriate aliquot (e.g., 0.5 mL) of the standard stock solution into a 10 mL volumetric flask. Dilute to volume with the solvent to obtain a working concentration (e.g., 5 µg/mL). Scan this solution against a solvent blank in the UV range of 200–400 nm. The wavelength of maximum absorption (λmax) is identified from the resulting spectrum. For instance, terbinafine hydrochloride in water exhibits a λmax at 283 nm [26].
- Establishing Linearity and Calibration Curve: Prepare a series of standard solutions by transferring different aliquots (e.g., 0.5, 1.0, 1.5, 2.0, 2.5, 3.0 mL) of the stock solution into a series of 10 mL volumetric flasks. Dilute each to the mark with solvent to create a concentration range (e.g., 5–30 µg/mL). Measure the absorbance of each solution at the determined λmax. Construct a calibration curve by plotting absorbance versus concentration. The method demonstrates linearity if the correlation coefficient (r²) is ≥ 0.999 [26].
A successfully developed method must be validated. The table below summarizes key validation parameters and typical acceptance criteria based on a published method for terbinafine hydrochloride [26].
Table 2: Key UV-Vis Method Validation Parameters and Results
| Validation Parameter | Experimental Procedure | Acceptance Criteria / Typical Result |
|---|---|---|
| Linearity Range | Analyze standard solutions across a defined range (e.g., 5–30 µg/mL). | Correlation coefficient (r²) ≥ 0.999 [26]. |
| Accuracy (Recovery) | Spike pre-analyzed sample with standard at 80%, 100%, 120% levels. | % Recovery should be close to 100% (e.g., 98.54% - 99.98%) [26]. |
| Precision | Intra-day: Analyze 3 concentrations in triplicate on the same day.Inter-day: Analyze 3 concentrations over 3 days. | % Relative Standard Deviation (RSD) < 2% for both [26]. |
| LOD / LOQ | LOD = 3.3 × σ/S; LOQ = 10 × σ/S (σ = standard deviation, S = slope of calibration curve). | LOD and LOQ are compound-specific (e.g., 0.42 µg and 1.30 µg for a cited method) [26]. |
| Ruggedness | Analyze the same sample by different analysts or on different instruments. | % RSD < 2% indicates the method is rugged [26]. |
The Scientist's Toolkit: Essential Research Reagents and Materials
The following table lists key materials and reagents required for the development and validation of a UV-Vis spectroscopic method.
Table 3: Essential Research Reagent Solutions and Materials
| Item | Function / Purpose |
|---|---|
| High-Purity API Reference Standard | Serves as the primary benchmark for identity, potency, and for constructing the calibration curve. |
| UV-Grade Solvents | (e.g., Water, Methanol, Acetonitrile). Serve as the dissolution and dilution medium; must have high transparency in the UV range. |
| Volumetric Flasks | (e.g., Class A 10 mL, 100 mL). Used for accurate preparation and dilution of standard and sample solutions. |
| Analytical Balance | Provides accurate weighing of the API standard, a critical step for preparing precise stock solutions. |
| UV-Vis Spectrophotometer | The core instrument that measures the absorption of light by the analyte solution. |
| Quartz Cuvettes | Hold the sample and solvent blank for analysis; quartz is required for UV range measurements. |
| Ampelopsin F | Ampelopsin F, MF:C28H22O6, MW:454.5 g/mol |
| Acetylsventenic acid | Acetylsventenic acid, MF:C22H32O4, MW:360.5 g/mol |
UV-Vis versus UFLC-DAD: Positioning the Technique
Within a broader thesis on analytical technique selection, understanding the complementary roles of UV-Vis and UFLC-DAD is crucial. The following diagram aids in this technique selection process.
UV-Vis Spectroscopy is the technique of choice for high-throughput, economical analysis of pure substances or simple formulations, such as determining the assay of an API in a bulk drug or a single-component tablet [26] [27]. It excels in applications like drug stability testing, where changes in absorbance at a specific wavelength can quickly indicate degradation [28]. Its simplicity, speed, and low cost make it ideal for routine quality control.
In contrast, UFLC-DAD is superior when the analytical challenge involves a complex mixture, such as quantifying multiple components, resolving degradation products from the API, or performing impurity profiling. The DAD detector provides spectral confirmation of peak identity and purity, adding a layer of specificity that UV-Vis alone cannot offer. The choice between these techniques is not mutually exclusive; they often serve complementary roles in a comprehensive analytical strategy.
The development of a robust and reliable UV-Vis spectroscopic method hinges on a systematic approach to solvent selection and wavelength optimization. By adhering to the principles and detailed protocols outlined in this guide—from choosing a UV-transparent solvent that ensures analyte stability to meticulously identifying the λmax and validating the method as per ICH guidelines—researchers can establish methods that are accurate, precise, and fit-for-purpose. When positioned within a broader analytical framework, UV-Vis remains an indispensable, cost-effective tool for specific pharmaceutical applications, particularly the quantitative analysis of pure compounds, while techniques like UFLC-DAD address the needs of more complex separations. Mastery of UV-Vis method development thus empowers scientists to efficiently generate high-quality data that supports drug development and ensures product quality.
Ultra-Fast Liquid Chromatography (UFLC) coupled with Diode Array Detection (DAD) represents a significant advancement in analytical separation sciences, offering enhanced resolution and reduced analysis time compared to conventional HPLC systems. The core principle of UFLC involves the use of stationary phases with smaller particle sizes (typically sub-2μm) and systems capable of operating at significantly higher pressures, which directly translates to improved efficiency and faster separations [29]. When combined with DAD detection, which provides full spectral information for each eluting peak, this technique becomes a powerful tool for method development in pharmaceutical analysis, food chemistry, and environmental monitoring.
The selectivity of DAD detection, which allows for continuous monitoring across a broad wavelength range (typically 190-500 nm), provides a distinct advantage over single-wavelength UV detection in method development [29]. This capability is particularly valuable for identifying co-eluting peaks and verifying peak purity, essential requirements in regulated environments such as pharmaceutical quality control. Within the broader context of analytical technique selection, UFLC-DAD occupies a strategic position between conventional UV-Vis spectroscopy and more sophisticated LC-MS systems, offering an optimal balance of accessibility, information content, and performance for many analytical scenarios.
Column Chemistry Selection Strategies
Stationary Phase Fundamentals
The selection of an appropriate stationary phase is the most critical parameter in UFLC-DAD method development, as it directly determines the fundamental separation mechanism and selectivity. The chemical properties of your analytes, including polarity, ionization potential, and specific functional groups, should guide this selection. Reversed-phase chromatography utilizing C18-bonded silica remains the most widely employed stationary phase for small molecule separations due to its versatility and well-characterized behavior [29].
Recent innovations in column technology have focused on improving efficiency, pH stability, and providing alternative selectivity. Superficially porous particles (also called fused-core) and fully porous sub-2μm particles represent the current standard for UFLC applications, both offering high efficiency separations. The Halo 90 Å PCS Phenyl-Hexyl column, for instance, exemplifies advanced stationary phase technology, featuring a phenyl-hexyl functional group that provides enhanced peak shape for basic compounds and alternative selectivity to C18 phases through π-π interactions [30]. Similarly, the Halo 120 Å Elevate C18 column offers exceptional pH stability (pH 2-12) and thermal robustness, making it particularly suitable for method development under aggressive conditions [30].
Specialized Stationary Phases for Challenging Separations
For analytes with specific chemical properties, specialized stationary phases can provide superior separation compared to conventional C18 columns. The Aurashell Biphenyl column utilizes a combination of separation mechanisms including hydrophobic, π-π, dipole, and steric interactions, making it particularly well-suited for metabolomics, polar/non-polar compound analysis, and isomer separations [30]. This column demonstrates enhanced polar selectivity, is 100% aqueous compatible, and offers superior retention of hydrophilic aromatics.
For analytes prone to metal interaction, such as phosphorylated compounds or those containing chelating groups, inert or biocompatible columns with passivated hardware significantly improve analyte recovery and peak shape. The Halo Inert column creates a metal-free barrier between the sample and stainless-steel components, preventing adsorption to metal surfaces [30]. Similarly, the Evosphere Max columns utilize inert hardware to enhance peptide recovery and sensitivity, while Restek Inert HPLC Columns are specifically suited for analyzing chelating PFAS and pesticide compounds [30].
Table 1: Modern Stationary Phases for UFLC-DAD Method Development
| Stationary Phase Type | Key Characteristics | Optimal Application Areas | Representative Examples |
|---|---|---|---|
| C18 with advanced bonding | High pH stability (pH 2-12), high temperature resistance | General purpose, basic compounds, method development | Halo 120 Ã… Elevate C18 [30] |
| Phenyl-Hexyl | Enhanced peak shape for basic compounds, π-π interactions | Compounds with aromatic rings, alternative selectivity to C18 | Halo 90 Å PCS Phenyl-Hexyl [30] |
| Biphenyl | Multiple interaction mechanisms (hydrophobic, π-π, dipole, steric) | Isomer separations, metabolomics, polar compounds | Aurashell Biphenyl [30] |
| Fused-Core C8 | Faster analysis times with C18-like selectivity | High-throughput applications, quality control | Raptor C8 [30] |
| Inert/Biocompatible | Metal-free hardware, reduced analyte adsorption | Phosphorylated compounds, metal-sensitive analytes, peptides | Halo Inert, Evosphere Max [30] |
Column Selection Workflow
Mobile Phase Optimization Approaches
Solvent Selection and Composition Optimization
Mobile phase optimization begins with selecting appropriate solvents based on analyte solubility, detection requirements, and elution strength. For reversed-phase UFLC-DAD, acetonitrile and methanol represent the most common organic modifiers, each offering distinct advantages. Methanol provides stronger eluting power for many compound classes and is often preferred for ecological and economic reasons, though it generates higher backpressure [31]. Acetonitrile offers lower viscosity and UV transparency down to shorter wavelengths, making it preferable for low-wavelength DAD detection.
The linear solvent strength (LSS) theory provides a mathematical framework for modeling the relationship between retention factor (k) and mobile phase composition: log k = log kw - Sφ, where kw is the retention factor in pure water, S is a constant for a given solute and organic modifier, and φ is the volume fraction of the organic modifier [32]. This relationship allows for systematic optimization of organic modifier concentration to achieve target retention factors (typically 1
Buffer selection and pH optimization critically impact selectivity, particularly for ionizable compounds. Phosphate buffers remain widely used due to their excellent UV transparency and buffering capacity in the pH 2-3 and 6-8 ranges. In UFLC-DAD method development for vitamin analysis, a phosphate buffer at pH 4.95 provided optimal separation of B1, B2, and B6 vitamins, with the pH significantly affecting the retention and peak shape of vitamin B1 [31]. The optimal buffer concentration typically ranges from 10-50 mM, balancing adequate buffering capacity with compatibility with MS detection if needed in future method transfers.
Advanced Mobile Phase Optimization Strategies
For complex separations, computer-assisted method development using quantitative structure-retention relationships (QSRR) and linear solvation energy relationships (LSER) can significantly reduce experimental workload. These in-silico approaches predict retention behavior based on molecular descriptors obtained from molecular structure, allowing for virtual screening of mobile phase conditions before laboratory verification [32].
Green analytical chemistry principles increasingly influence mobile phase selection, favoring less hazardous chemicals and minimizing waste generation. Methods should be developed with consideration for environmental impact, operator safety, and sustainability [33]. This includes substituting acetonitrile with methanol where feasible, minimizing solvent consumption through optimized gradient programs, and considering solvent recycling options for preparative applications.
Table 2: Mobile Phase Optimization Strategies for UFLC-DAD
| Optimization Parameter | Key Considerations | Experimental Approach | Typical Optimal Range |
|---|---|---|---|
| Organic Modifier Type | Elution strength, UV cutoff, backpressure, cost | Compare acetonitrile vs. methanol | Methanol for stronger elution, ACN for low UV detection |
| Organic Modifier Percentage | Retention factor (k), resolution (Rs), analysis time | Scouting gradients 5-95% organic | 1 < k < 10 for balanced separation |
| Buffer Type | Buffering capacity, UV transparency, MS compatibility | Phosphate, acetate, formate, ammonium salts | 10-50 mM concentration |
| pH | Ionization state, selectivity, peak shape | pH screening across pKa ± 1.5 units | 2 units away from analyte pKa for ionization control |
| Temperature | Retention, efficiency, backpressure | 25-60°C screening | 30-45°C for most applications |
| Additives | Peak shape, secondary interactions | 0.1% formic acid, TFA, ammonium hydroxide | 0.05-0.1% for ionization control |
Integrated Method Development Workflow
Detection Optimization and Method Validation
DAD Parameter Optimization
Diode Array Detection provides the unique advantage of acquiring full UV-Vis spectra throughout the chromatographic run, enabling post-run data analysis at multiple wavelengths. Optimal DAD parameter configuration begins with wavelength selection based on the spectra of target analytes. The optimal detection wavelength should provide a balance of sensitivity for all compounds of interest, typically selecting λ~max~ for the least sensitive analyte or a compromise wavelength that provides adequate response for all targets [29] [31].
Spectral acquisition parameters significantly impact data quality and file size. Setting appropriate bandwidth (typically 4-8 nm), spectral acquisition rate (1-5 Hz for UFLC peaks), and resolution (1-2 nm) ensures sufficient data points across narrow UFLC peaks while maintaining manageable file sizes. For method development, collecting full spectra from 200-400 nm (or wider if visible absorption is expected) provides maximum flexibility for post-acquisition processing, including peak purity assessment and library searching.
Comprehensive Method Validation
UFLC-DAD method validation should follow established guidelines such as ICH Q2(R2), demonstrating specificity, linearity, accuracy, precision, detection and quantification limits, and robustness [31]. Specificity is confirmed through peak purity assessment using DAD spectral comparison, ensuring chromatographic resolution from potential impurities and matrix components [34].
The accuracy profile approach, based on β-expectation tolerance intervals and total error concept, provides a rigorous statistical methodology for assessing method accuracy and precision simultaneously across the validated range [34]. This approach calculates the method's total error, encompassing both bias and standard deviation, providing a decision-making tool with defined risk levels [34].
Research Reagent Solutions
Table 3: Essential Reagents and Materials for UFLC-DAD Method Development
| Reagent/Material | Function/Purpose | Selection Criteria |
|---|---|---|
| Aqua Evosphere Fortis Column [31] | Stationary phase for reversed-phase separation | 250 × 4.6 mm, 5 μm; provides excellent peak shape for diverse analytes |
| Halo Inert Column [30] | Metal-free stationary phase | For metal-sensitive analytes; prevents adsorption and peak tailing |
| Phosphate buffer salts (NaHâ‚‚POâ‚„/KHâ‚‚POâ‚„) | Aqueous mobile phase component | Buffering at pH 2-3 and 6-8; high UV transparency |
| HPLC-grade methanol & acetonitrile | Organic mobile phase modifiers | Methanol for stronger elution; ACN for low UV detection and lower viscosity |
| Formic acid/Acetic acid | Mobile phase additives for ionization control | 0.1% for positive ionization in acidic conditions; improves peak shape |
| Ammonium hydroxide | Mobile phase additive for basic conditions | For negative ionization control; typically 0.1% concentration |
| Supported Liquid Extraction (SLE) cartridges [34] | Sample preparation and clean-up | Synthetic inert porous adsorbent for efficient matrix removal |
| Chem Elut S cartridges [34] | Sample preparation | Regular particle size for consistent flow and minimal variability |
| Analytical standards | Method development and calibration | Certified reference materials for quantitative method development |
Quantifying Active Ingredients in Pharmaceutical Formulations
The accurate quantification of active pharmaceutical ingredients (APIs) is a cornerstone of drug development, manufacturing, and quality control. It ensures that medicinal products deliver their intended therapeutic effect while maintaining safety profiles. This technical guide provides an in-depth examination of two prominent analytical techniques—UV-Vis spectrophotometry and Ultra-Fast Liquid Chromatography with Diode Array Detection (UFLC-DAD)—framed within a structured approach for selecting the appropriate methodology based on specific research and development objectives.
The process of proving that an analytical method is suitable for its intended purpose, known as method validation, is fundamental to obtaining reliable results in routine analysis [35]. This guide synthesizes current research and validation protocols to support scientists in making informed, technically sound decisions for pharmaceutical analysis.
Comparative Analysis of UV-Vis and UFLC-DAD Techniques
Fundamental Principles and Instrumentation
UV-Vis Spectrophotometry operates on the principle of measuring the absorption of ultraviolet or visible light by a compound in solution. When an API contains a chromophore, it absorbs light at characteristic wavelengths, with the absorbance value (at λ~max~) being proportional to its concentration, as described by the Beer-Lambert law. This technique is popular due to its procedural simplicity, widespread instrument availability, precision, speed, and accuracy [35].
UFLC-DAD (Ultra-Fast Liquid Chromatography with Diode Array Detection) combines high-efficiency chromatographic separation with full-spectrum UV-Vis detection. UFLC utilizes specialized hardware to achieve significantly higher operating pressures than conventional HPLC, resulting in shorter analysis times, increased peak capacity, and lower consumption of samples and solvents [35]. The DAD detector simultaneously captures absorbance data across a range of wavelengths, providing spectral information for each separated component.
Direct Technical Comparison and Application Scenarios
The choice between these techniques involves careful consideration of their respective advantages and limitations, which are summarized in the table below.
Table 1: Technical Comparison of UV-Vis Spectrophotometry and UFLC-DAD
| Parameter | UV-Vis Spectrophotometry | UFLC-DAD |
|---|---|---|
| Principle | Measures absorbance of light by chromophores at a specific λ~max~ [35] | Separates components via chromatography followed by DAD detection [35] |
| Selectivity/Specificity | Lower; susceptible to interference from excipients or other absorbing compounds [35] | High; can resolve and individually quantify multiple analytes in a mixture [35] |
| Sensitivity | Moderate; limited by the molar absorptivity of the analyte | High; enhanced due to separation and preconcentration on the column |
| Analysis Time | Fast (minutes per sample) [35] | Longer but faster than HPLC; UFLC offers shorter run times [35] |
| Sample Throughput | High for simple matrices | Moderate to High |
| Sample Volume | Requires larger amounts for analysis [35] | Minimal consumption; lower use of samples and solvents [35] |
| Operational Cost | Low (economical instrumentation and operation) [35] | High (sophisticated equipment, costly solvents and columns) [35] |
| Environmental Impact | Generally lower solvent consumption | Higher solvent consumption, though UFLC reduces this compared to HPLC [35] |
| Ideal Use Case | Rapid quantification of a single API in simple, well-defined formulations without interfering compounds [35] | Analysis of complex mixtures, low-dose APIs, stability-indicating methods, and formulations with multiple active/interfering components [35] |
Detailed Experimental Methodologies
Method Development and Validation Protocols
Robust analytical methods require systematic development and validation to ensure accuracy, precision, and reliability. The following parameters, as demonstrated in studies quantifying Metoprolol Tartrate (MET) and vitamins, are typically assessed [35] [36].
Table 2: Key Validation Parameters and Acceptance Criteria for Quantitative API Analysis
| Validation Parameter | Description | Typical Acceptance Criteria |
|---|---|---|
| Specificity/Selectivity | Ability to accurately measure the analyte in the presence of potential interferents (excipients, degradation products) [35]. | For UFLC-DAD: Baseline resolution of analyte peak (Resolution >1.5). For UV-Vis: No significant interference at λ~max~. |
| Linearity & Range | The ability to obtain test results directly proportional to analyte concentration within a given range [35]. | R² > 0.999 [36]. |
| Accuracy | Closeness of the measured value to the true value. | Mean Recovery of 100 ± 3% [36]. |
| Precision | Degree of agreement among individual test results. | %RSD < 3.23% [36]. |
| Limit of Detection (LOD) | The lowest concentration of analyte that can be detected. | Signal-to-Noise ratio ~3:1. |
| Limit of Quantification (LOQ) | The lowest concentration of analyte that can be quantified with acceptable accuracy and precision. | Signal-to-Noise ratio ~10:1. |
| Robustness | A measure of the method's capacity to remain unaffected by small, deliberate variations in method parameters. | Consistent system suitability parameters. |
Sample Preparation Workflows
The sample preparation strategy is critical and depends on the formulation matrix and the chosen analytical technique.
For Solid Dosage Forms (e.g., Tablets, Gummies): A liquid/solid extraction is commonly employed. For example, in the analysis of vitamin gummies, an accurate weight of the homogenized sample is dissolved and diluted in a suitable solvent (e.g., methanol, buffer). The solution is then subjected to sonication to facilitate API extraction, followed by centrifugation and filtration (e.g., 0.45 µm or 0.22 µm membrane filter) before analysis [36].
For Complex Biological or Food Matrices (e.g., GI Fluids, Milk): A more rigorous clean-up is often necessary. Solid Phase Extraction (SPE) is a widely used technique to isolate and concentrate the analytes while removing interfering matrix components. SPE methods are optimized based on the chemical properties of the API, with recovery rates of 100 ± 5% being achievable [36].
Analytical Procedures
UV-Vis Spectrophotometry Protocol (e.g., for Bakuchiol):
- Standard Solution Preparation: Dissolve a certified reference standard of the API in an appropriate solvent (e.g., ethanol) to prepare a stock solution. Prepare a series of working standard solutions by dilution to bracket the expected concentration range of the sample.
- Sample Solution Preparation: Extract and dilute the sample as described in Section 3.2.
- Spectrum Recording: Scan the standard and sample solutions against a blank solvent to identify the wavelength of maximum absorption (λ~max~). For bakuchiol, this is 262 nm [17].
- Calibration and Quantification: Measure the absorbance of the standard solutions at λ~max~ and construct a calibration curve. Determine the concentration of the API in the unknown sample using the regression equation of the calibration curve [17].
UFLC-DAD Protocol (e.g., for B-Vitamins or MET):
- Chromatographic Conditions:
- Column: Reversed-phase C18 column (e.g., 250 mm × 4.6 mm, 5 µm).
- Mobile Phase: Isocratic or gradient elution. Example: 70% NaH~2~PO~4~ buffer (pH 4.95) and 30% methanol [36] or acetonitrile with 1% formic acid [17].
- Flow Rate: 0.9 mL/min [36] or as optimized.
- Column Temperature: 40°C [36].
- Injection Volume: Typically 5-20 µL.
- DAD Detection: Set at the specific λ~max~ of the analyte(s) (e.g., 223 nm for MET [35]) and acquire full spectra for peak purity assessment.
- System Suitability Test: Prior to analysis, inject a standard solution to verify parameters like theoretical plate count, tailing factor, and reproducibility meet predefined criteria.
- Analysis: Sequentially inject the standard and sample solutions. Identify the analyte peak by comparing its retention time and UV spectrum with the standard. Quantify using a calibration curve of peak area versus concentration [35] [36].
The Scientist's Toolkit: Essential Research Reagents and Materials
Successful quantification relies on high-quality materials and reagents. The following table details key items used in the featured experiments.
Table 3: Essential Materials and Reagents for API Quantification
| Item | Function / Description | Example from Research |
|---|---|---|
| Certified Reference Standard | High-purity analyte used for calibration; essential for accurate quantification. | Metoprolol tartrate (≥98%, Sigma-Aldrich) [35]; Bakuchiol standard [17]. |
| HPLC-Grade Solvents | High-purity solvents for mobile phase and sample preparation to minimize background interference. | Methanol, Acetonitrile, Water (Ultra-Pure) [35] [36]. |
| Buffer Salts | Used to adjust pH and ionic strength of the mobile phase to control retention and selectivity. | Sodium Dihydrogen Phosphate (NaHâ‚‚POâ‚„) [36]. |
| Chromatographic Column | The heart of the UFLC system where separation occurs. | Reversed-phase C18 column (e.g., 250 mm x 4.6 mm, 5 µm) [36]. |
| Syringe Filters | For removing particulate matter from sample solutions prior to injection into the UFLC system. | 0.45 µm or 0.22 µm pore size membrane filters [36]. |
| Derivatization Reagents | Chemicals used to convert a non-detectable analyte into a detectable derivative. | Reagents for pre-column oxidation of Vitamin B1 to fluorescent thiochrome [36]. |
| Internal Standard (for NMR/qNMR) | A compound added in a constant amount to all samples and standards for quantification in NMR. | Nicotinamide (solubility similar to bakuchiol, non-reactive) [17]. |
| Odonicin | Odonicin, MF:C24H30O7, MW:430.5 g/mol | Chemical Reagent |
| Isodonal | Isodonal, MF:C22H28O7, MW:404.5 g/mol | Chemical Reagent |
Analytical Workflow and Technique Selection
The decision to use UV-Vis or UFLC-DAD is not merely a technical choice but a strategic one that impacts data quality, resource allocation, and project timelines. The following diagram outlines a logical workflow to guide this selection.
The quantification of active ingredients is a dynamic field that balances analytical performance with practical considerations. UV-Vis spectrophotometry remains a powerful tool for rapid, cost-effective analysis of simple formulations, while UFLC-DAD provides the necessary selectivity, sensitivity, and robustness for complex matrices and method-intensive applications like stability studies.
The definitive choice between these techniques must be grounded in a clear understanding of the analytical problem, defined by the formulation's complexity, the required specificity, and available resources. By applying the structured comparison, validation protocols, and decision workflow outlined in this guide, scientists and drug development professionals can make informed, defensible decisions to ensure the quality, safety, and efficacy of pharmaceutical products.
Analyzing Phenolic Compounds and Botanicals in Complex Matrices
The analysis of phenolic compounds in complex botanical matrices is a cornerstone of phytochemical research, playing a critical role in drug discovery, quality control of herbal medicines, and nutritional science. Phenolic compounds, comprising over 8000 known structures, are secondary metabolites ubiquitously distributed throughout the plant kingdom and represent the second most prevalent class of organic molecules behind cellulose [37]. These compounds exhibit a wide range of biological activities, including antioxidant, anti-inflammatory, and cardioprotective effects, making them valuable targets for analytical characterization [37] [38]. However, the complex nature of botanical extracts, containing myriad interfering compounds, presents significant analytical challenges that require sophisticated methodological approaches.
This technical guide provides an in-depth examination of two fundamental analytical techniques for phenolic compound analysis: UV-Visible spectroscopy (UV-Vis) and Ultra-Fast Liquid Chromatography with Diode Array Detection (UFLC-DAD). Within the context of a broader thesis on technique selection, we explore the theoretical foundations, practical implementations, and comparative advantages of each method, supported by current research data and detailed experimental protocols. The selection between these techniques involves careful consideration of factors including analytical objectives, required sensitivity and specificity, sample throughput needs, and available resources.
Technical Foundations of UV-Vis and UFLC-DAD
UV-Visible Spectroscopy Fundamentals
UV-Visible spectroscopy operates on the principle of electronic transitions, where molecules absorb light in the ultraviolet (190-400 nm) and visible (400-800 nm) regions, promoting electrons from ground state to excited state. Phenolic compounds typically exhibit strong absorption in the UV region due to transitions within their aromatic π-system. The conjugated nature of phenolic acids and flavonoids results in characteristic absorption maxima that can provide preliminary structural information [39] [21].
The major advantage of UV-Vis spectroscopy lies in its rapid, non-destructive nature and minimal sample preparation requirements. Modern implementations include diffuse reflectance spectroscopy (DRS) for direct analysis of solid formulations, eliminating the need for solvent extraction [40]. When combined with chemometric techniques such as Principal Component Analysis (PCA) and Partial Least Squares (PLS) regression, UV-Vis can discriminate between botanical origins and even predict sample age with remarkable accuracy [39] [21].
UFLC-DAD Fundamentals
UFLC-DAD combines the superior separation power of ultra-fast liquid chromatography with the multi-wavelength detection capabilities of diode array detection. This technique separates complex mixtures based on differential partitioning between mobile and stationary phases, followed by detection across multiple wavelengths (typically 190-800 nm). The DAD component simultaneously captures full UV-Vis spectra for each eluting peak, enabling both quantification and preliminary identification [37] [38].
The hyphenated nature of UFLC-DAD provides exceptional specificity by combining retention time with spectral matching. The chromatographic separation effectively reduces matrix effects by physically separating analytes from interfering compounds, while the spectral information allows for peak purity assessment and method specificity verification [37].
Table 1: Comparison of Fundamental Technical Characteristics
| Parameter | UV-Vis Spectroscopy | UFLC-DAD |
|---|---|---|
| Analysis Principle | Electronic transitions | Separation + spectroscopic detection |
| Analysis Time | Minutes | 15-60 minutes |
| Sample Preparation | Minimal (often just dilution) | Extensive (extraction, filtration) |
| Specificity | Low (spectral overlapping) | High (retention time + spectrum) |
| Sensitivity | Moderate (µg/mL range) | High (ng/mL range) |
| Multi-analyte Capacity | Limited (deconvolution required) | Excellent (native capability) |
| Destructive Nature | Non-destructive | Destructive |
| Quantitation Approach | Multivariate calibration | External/Internal standards |
Experimental Design and Methodologies
UV-Vis Spectroscopic Methods
Direct Absorbance Measurements
For liquid samples such as wines or liquid botanical extracts, direct UV-Vis analysis requires minimal preparation. Typically, samples are diluted with appropriate solvents (water, methanol, or ethanol) to bring analyte concentrations within the linear range of the Beer-Lambert law (approximately 0.1-1.0 absorbance units). For sweet wine analysis, both undiluted and diluted samples have been analyzed, with dilution often improving model performance by reducing matrix effects [21].
Synchronous fluorescence (SF) spectroscopy represents a specialized implementation where excitation and emission wavelengths are scanned simultaneously with a constant offset (Δλ). This technique provides sharper spectral bands, reduced scattering interference, and improved selectivity compared to conventional fluorescence [21].
Diffuse Reflectance Spectroscopy for Solids
UV-Vis DRS enables direct analysis of solid formulations without solvent extraction. For pharmaceutical quality control, samples are typically ground to uniform particle size and packed into appropriate sample holders. The geometric dilution method ensures homogeneous distribution of active pharmaceutical ingredients (APIs) throughout excipient matrices [40].
The Net Analyte Signal (NAS) method, combined with standard additions, creates a pseudo-univariate calibration model that corrects for matrix effects. Four standard additions (e.g., 0%, 5%, 10%, and 15% w/w) are typically prepared by mixing sample blanks with pure analyte, followed by multivariate data processing [40].
Chemometric Data Processing
Multivariate analysis is essential for extracting meaningful information from UV-Vis spectral data. Principal Component Analysis (PCA) reduces data dimensionality while preserving variance, enabling sample classification and outlier detection. For quantitative applications, Partial Least Squares (PLS) regression correlates spectral features with reference values, with model quality assessed via cross-validation parameters (R²CV, RMSECV) and prediction metrics (R²P, RMSEP) [39] [21].
UFLC-DAD Methodologies
Chromatographic Conditions Optimization
Successful separation of phenolic compounds requires careful optimization of mobile phase composition, gradient profile, and column temperature. A representative method for 16 phenolic compounds utilizes a C18 column (250 × 4.6 mm, 5 μm) with a binary gradient consisting of mobile phase A (water with 0.1% formic acid) and mobile phase B (acetonitrile with 0.1% formic acid) [37].
Table 2: Representative UFLC-DAD Gradient for Phenolic Compound Separation
| Time (min) | Flow Rate (mL/min) | Mobile Phase A (% v/v) | Mobile Phase B (% v/v) |
|---|---|---|---|
| 0-4 | 0.7 | 100 | 0 |
| 5-20 | 0.7 | 98 | 2 |
| 27-30 | 0.7 | 96 | 4 |
| 32-35 | 0.7 | 90 | 10 |
| 40 | 0.7 | 80 | 20 |
| 42-45 | 0.7 | 0 | 100 |
| 50 | 0.7 | 100 | 0 |
| 55 | 0.7 | 100 | 0 |
The gradient elution profile typically spans 45-60 minutes, with a post-time equilibration period to return to initial conditions. Flow rates between 0.7-1.0 mL/min provide optimal separation efficiency, with column temperatures maintained at 25-40°C to ensure retention time reproducibility [37].
Sample Preparation and Extraction
Botanical samples require exhaustive extraction to liberate phenolic compounds from the plant matrix. Dried, homogenized plant material (leaves, bark, or fruits) is typically extracted with hydroalcoholic solvents (e.g., 70% ethanol or 80% methanol) using techniques such as maceration, ultrasound-assisted extraction, or Soxhlet extraction [38]. The extraction time, temperature, and solvent-to-material ratio significantly impact yield and must be optimized for each matrix.
Extracts are filtered (0.22-0.45 μm) prior to injection to remove particulate matter that could damage chromatographic systems. Solid-phase extraction (SPE) may be employed for additional cleanup in particularly complex matrices [37].
Method Validation Protocols
UFLC-DAD methods require rigorous validation to establish reliability. Key validation parameters include:
- Specificity: Resolution between analytes and potential interferents (>1.5)
- Linearity: Correlation coefficient (R² > 0.999) across working range
- Accuracy: Recovery rates (85-115%) for spiked samples
- Precision: Relative standard deviation (RSD < 5%) for replicate injections
- Sensitivity: Limit of detection (LOD) and quantification (LOQ) determined from signal-to-noise ratios [37]
Analytical Performance Comparison
Quantitative Performance Metrics
Table 3: Performance Characteristics for Phenolic Compound Analysis
| Performance Metric | UV-Vis with PLS | UFLC-DAD |
|---|---|---|
| Accuracy (Recovery %) | 85-110% (after model optimization) | 85-115% (validated) |
| Precision (RSD %) | 3-8% (highly matrix-dependent) | 1-5% (typically <3%) |
| Linear Range | Moderate (requires multivariate calibration) | Wide (3-4 orders of magnitude) |
| LOD for Phenolics | µg/mL range | ng/mL range (e.g., 2.4-9.4 ng/mL for gallic acid and catechin) |
| Multi-analyte Capacity | Limited to ~5-6 components with chemometrics | Excellent (16+ compounds demonstrated) |
| Analysis Time | Rapid (minutes per sample) | Longer (30-60 minutes per sample) |
Applications in Botanical Analysis
Quality Control and Authentication
UV-Vis spectroscopy coupled with multivariate analysis has successfully discriminated bud extracts (gemmoderivatives) from adult plant parts, addressing economically-motivated adulteration in the plant food supplement industry [39]. The technique differentiates samples based on their spectroscopic fingerprints without requiring chromatographic separation of individual components.
UFLC-DAD provides definitive confirmation of botanical identity through characteristic chemical profiles. In one study, wild fruits including hawthorn (Crataegus monogyna), cornelian cherry (Cornus mas), rosehip (Rosa canina), and blueberry (Vaccinium myrtillus) showed distinct phenolic fingerprints, with epicatechin identified as the predominant compound in three of the four species [37].
Age Prediction and Process Monitoring
Synchronous fluorescence spectroscopy with PLS regression has demonstrated remarkable capability in predicting the age of sweet wines (3-60 years) with a root mean square error of prediction (RMSEP) of 0.8 years [21]. The VIP-PLS model based on SF spectral data of diluted samples achieved a coefficient of determination (R²P) of 0.990, highlighting the predictive power of spectroscopic techniques combined with appropriate chemometrics.
UFLC-DAD established correlations between specific phenolic compounds (caftaric acid, catechin, and gallic acid) and wine age (p < 0.0001), providing chemical interpretation for the spectroscopic predictions [21].
Technique Selection Workflow
The Scientist's Toolkit: Essential Research Reagents and Materials
Table 4: Essential Research Reagents and Materials for Phenolic Compound Analysis
| Category | Specific Items | Function & Application |
|---|---|---|
| Chromatographic Columns | C18 reverse phase (250 × 4.6 mm, 5 μm) | Separation of phenolic compounds based on hydrophobicity |
| Mobile Phase Components | Water with 0.1% formic acid, Acetonitrile with 0.1% formic acid | Creates gradient elution for optimal separation |
| Reference Standards | Gallic acid, catechin, epicatechin, caffeic acid, ferulic acid, p-coumaric acid, quercetin | Method validation, calibration curves, compound identification |
| Extraction Solvents | Methanol (80%), Ethanol (70-80%), Acetone | Extraction of phenolic compounds from botanical matrices |
| Sample Preparation | Solid-phase extraction cartridges (C18), Syringe filters (0.22 μm, 0.45 μm) | Sample cleanup and particulate removal |
| Quality Control | Ascorbic acid, Butylated hydroxytoluene (BHT) | Antioxidant protection during extraction and analysis |
| Chemometric Software | MATLAB with PLS Toolbox, SIMCA, R with chemometrics packages | Multivariate data analysis for spectroscopic methods |
| Casanthranol | Casanthranol, MF:C21H22O10, MW:434.4 g/mol | Chemical Reagent |
| Isoformononetin-d3 | Isoformononetin-d3, MF:C16H12O4, MW:271.28 g/mol | Chemical Reagent |
The selection between UV-Vis spectroscopy and UFLC-DAD for analyzing phenolic compounds in complex matrices depends fundamentally on the specific analytical objectives. UV-Vis spectroscopy with multivariate analysis offers rapid, cost-effective screening suitable for quality control, authentication, and process monitoring where high throughput is prioritized over definitive compound identification. UFLC-DAD provides superior specificity, sensitivity, and multi-analyte quantification capability, making it indispensable for method development, regulatory compliance, and detailed phytochemical profiling.
Modern analytical workflows increasingly leverage both techniques synergistically, with UV-Vis serving as a rapid screening tool and UFLC-DAD providing definitive quantification. The integration of chemometrics with spectroscopic methods continues to expand the applications of UV-Vis, while advancements in chromatographic technology steadily improve the speed and sensitivity of UFLC-DAD methods. Understanding the complementary strengths and limitations of each technique enables researchers to design efficient, fit-for-purpose analytical strategies for phenolic compound analysis in complex botanical matrices.
Bakuchiol is a meroterpene phenolic compound, recognized as a natural, plant-derived alternative to retinol due to its similar anti-aging effects but with improved skin tolerability and photostability [17] [41]. Originating primarily from the seeds of Psoralea corylifolia L., bakuchiol's incorporation into cosmetic formulations has surged owing to its antioxidant, anti-inflammatory, and collagen-synthesizing properties [42] [41]. However, its efficacy and safety are contingent upon precise quantification and quality control in final products. This case study provides an in-depth technical guide for researchers and drug development professionals, framing the evaluation within the broader objective of selecting the most appropriate analytical technique—UV-Vis spectroscopy or Ultra-Fast Liquid Chromatography with a Diode Array Detector (UFLC-DAD)—for bakuchiol analysis. We present a direct comparison of these methodologies, supplemented with quantitative data, detailed protocols, and decision frameworks to guide analytical strategy.
Analytical Technique 1: UV-Vis Spectroscopy
UV-Vis spectroscopy offers a rapid and cost-effective approach for the quantitative analysis of bakuchiol in specific cosmetic matrices.
Methodology and Protocol
- Principle: The quantification relies on the absorption of ultraviolet light by the bakuchiol molecule, which features a chromophore that absorbs at a characteristic wavelength [17].
- Sample Preparation: A representative sample of the cosmetic product is accurately weighed. Due to bakuchiol's lipophilicity, absolute ethanol is used as the solvent for extraction. The sample is dissolved or diluted in ethanol and subjected to agitation (e.g., vortexing) to ensure complete extraction of the active compound [17].
- Instrumental Parameters: The analysis is performed using a standard UV-Vis spectrophotometer. The wavelength for quantification is set to 262 nm, corresponding to the maximum absorption of bakuchiol established using a standard reference material [17].
- Quantification: A calibration curve is constructed by preparing and analyzing a series of standard bakuchiol solutions of known concentrations in ethanol. The absorbance of the sample solution at 262 nm is measured, and the bakuchiol concentration is determined by interpolating the absorbance value against the linear regression of the standard curve [17].
Advantages and Limitations
This method is characterized by its simplicity, speed, and low operational cost. However, its major limitation is its susceptibility to interference from other cosmetic ingredients that also absorb in the UV range, such as certain oils and preservatives [17]. This is particularly problematic for complex emulsions, where incomplete extraction can lead to inaccurate results. Consequently, UV-Vis is best suited for qualitative identification or the quantitative analysis of simple, single-active-ingredient oil solutions where the matrix is well-understood and non-interfering.
Analytical Technique 2: UFLC-DAD
Chromatographic separation coupled with DAD detection provides a robust and selective method for quantifying bakuchiol in complex cosmetic matrices.
Methodology and Protocol
- Principle: This technique separates bakuchiol from other cosmetic components before detection, thereby eliminating most interferences that plague UV-Vis analysis [17].
- Sample Preparation: For complex matrices like oil-in-water emulsions, a more sophisticated extraction is required. Research indicates that tetrahydrofuran (THF) is a highly effective extraction solvent for bakuchiol from a wide range of cosmetic products. An optimized sample-to-solvent ratio of 1:4 (w/v) is recommended. The mixture is vortexed for a minimum of 5 minutes to ensure efficient extraction, followed by centrifugation at 14,000 rpm for 10 minutes at 25°C to clarify the extract for injection [42].
- Chromatographic Conditions:
- Column: Zorbax Eclipse Plus C18 (100 × 4.6 mm, 3.5 µm)
- Mobile Phase: Gradient elution with water and acetonitrile
- Flow Rate: 1.0 mL/min
- Column Temperature: 25°C
- Injection Volume: Typically 5-20 µL
- Detection (DAD): 260 nm [17]; for enhanced sensitivity and selectivity, fluorescence detection (FLD) can be employed at excitation/emission wavelengths of 264/338 nm [42].
- Quantification: Identification is based on the retention time of bakuchiol (~31.8 minutes under isocratic conditions with acetonitrile and 1% formic acid [17]). Quantification is achieved by comparing the peak area of the sample to a calibrated standard curve. The method demonstrates excellent linearity (R² > 0.9999) over a wide range and low limits of quantification (0.5 µg gâ»Â¹) [42].
Advantages and Limitations
UFLC-DAD offers high selectivity, sensitivity, and the ability to analyze bakuchiol in virtually any cosmetic formulation, regardless of complexity. It provides a definitive confirmation of the analyte's identity and purity. The primary drawbacks are the longer analysis time, higher cost of instrumentation and maintenance, and the need for more extensive method development and operator expertise compared to UV-Vis.
Critical Comparison of UV-Vis and UFLC-DAD
The following table synthesizes quantitative and qualitative data from experimental studies to provide a direct comparison of the two techniques for bakuchiol analysis [17] [42].
Table 1: Comparative Analysis of UV-Vis and UFLC-DAD for Bakuchiol Quantification
| Parameter | UV-Vis Spectroscopy | UFLC-DAD |
|---|---|---|
| Analytical Speed | Very fast (minutes per sample) | Slow to moderate ( >30 minutes per sample) |
| Cost | Low (instrumentation and operation) | High (instrumentation, solvents, and columns) |
| Selectivity | Low; highly susceptible to matrix interference | High; separates bakuchiol from other components |
| Sensitivity (LOQ) | Not specified, but functionally lower | 0.5 μg gâ»Â¹ [42] |
| Linear Range | Applicable for standard curves | 0.5–50.0 μg gâ»Â¹ [42] |
| Matrix Applicability | Limited to simple oil solutions | Universal (oils, emulsions, serums) |
| Accuracy (Recovery) | Inaccurate for emulsions | 93.37–106.39% [42] |
| Key Finding | Failed to quantify bakuchiol in oil-in-water emulsions due to incomplete extraction and interference [17]. | Accurately quantified bakuchiol in all tested matrix types and identified a product with only 50% of declared content [17]. |
The Scientist's Toolkit: Essential Research Reagents and Materials
The following table details key materials and reagents essential for the experimental analysis of bakuchiol in cosmetics.
Table 2: Key Research Reagents for Bakuchiol Analysis
| Reagent/Material | Function/Application | Technical Notes |
|---|---|---|
| Bakuchiol Standard | Primary reference standard for method calibration and quantification. | High-purity (>98%) compound is essential for accurate calibration curves [43]. |
| Tetrahydrofuran (THF) | Extraction solvent for bakuchiol from complex cosmetic matrices. | Demonstrated superior extraction efficiency (>90%) for most cosmetics compared to acetonitrile or methanol [42]. |
| Nicotinamide | Internal standard for quantitative NMR (qNMR) analysis. | Chosen for its stability, suitable solubility, and non-interfering NMR signals [17]. |
| Deuterated Chloroform (CDCl₃) | Solvent for NMR spectroscopy. | Allows for direct analysis of cosmetic samples with minimal preparation, exploiting bakuchiol's solubility [17]. |
| Zorbax Eclipse Plus C18 Column | Stationary phase for chromatographic separation. | Endcapped C18 column (100 x 4.6 mm, 3.5 µm) provides optimal separation for bakuchiol [42]. |
| Acetonitrile (HPLC Grade) | Mobile phase component for UFLC-DAD. | Used in gradient or isocratic elution, often with a modifier like formic acid to improve peak shape [17] [42]. |
| Fefefkfk | Fefefkfk, MF:C58H76N10O13, MW:1121.3 g/mol | Chemical Reagent |
| PreQ1-biotin | PreQ1-biotin, MF:C23H36N8O3S, MW:504.7 g/mol | Chemical Reagent |
Experimental Workflow and Decision Pathway
The following diagram illustrates the logical workflow for selecting and applying the appropriate analytical technique based on the analytical objectives and sample matrix, as derived from the case study data.
This case study demonstrates that the choice between UV-Vis and UFLC-DAD for bakuchiol quality control is not arbitrary but is dictated by the analytical requirement. UV-Vis spectroscopy serves as an excellent tool for rapid, cost-effective screening of bakuchiol in simple formulations where matrix interference is negligible. However, for definitive quality control—ensuring label claim accuracy, assessing stability, and analyzing complex, multi-ingredient cosmetic products—UFLC-DAD is the unequivocally superior technique. Its high selectivity and sensitivity provide the reliability required for research, development, and rigorous quality assurance, making it the recommended method for any application where data integrity is paramount.
Solving Analytical Challenges: Troubleshooting and Enhancing Performance
Ultraviolet-Visible (UV-Vis) spectroscopy serves as a foundational technique in pharmaceutical laboratories due to its simplicity, cost-effectiveness, and rapid analysis capabilities. However, its application in drug development and quality control is fraught with specific technical challenges that can compromise data accuracy and regulatory compliance. Understanding these pitfalls—particularly sample turbidity, spectral interferences, and dynamic range limitations—is crucial for researchers and scientists when selecting between UV-Vis and more advanced techniques like UFLC-DAD (Ultra-Fast Liquid Chromatography with Diode Array Detection). This guide provides an in-depth examination of these challenges, offering detailed experimental protocols and compensation strategies to enhance analytical decision-making.
Pitfall 1: Sample Turbidity and Light Scattering Effects
Underlying Mechanisms and Impact on Data Quality
Sample turbidity, caused by suspended particulate matter or macromolecular aggregates, introduces significant error sources by deviating from the fundamental Beer-Lambert law. These particulates scatter incident light rather than absorbing it, leading to erroneously high absorbance readings that do not accurately reflect the analyte concentration of interest. This effect is particularly problematic in biological matrices or poorly dissolved pharmaceutical formulations where colloidal suspensions or protein aggregates may be present [44]. The resultant baseline artifacts and inaccurate concentration measurements can severely impact method validation parameters, including accuracy, precision, and linearity [45].
Experimental Protocol for Turbidity Assessment and Correction
Materials and Equipment:
- UV-Vis spectrophotometer with cuvette holder
- Quartz cuvettes (10 mm pathlength)
- Centrifuge with appropriate tubes (50 mL capacity)
- Syringe filters (0.45 μm and 0.22 μm pore sizes)
- Filtration apparatus
- Sample vials and pipettes
Procedure:
- Initial Spectra Acquisition: Record the UV-Vis spectrum of the untreated sample across the wavelength range of interest (e.g., 200-800 nm) using a matched quartz cuvette with deionized water as blank [46].
- Visual Inspection: Examine the sample visually against a light source. Note any cloudiness or opalescence that suggests turbidity.
- Centrifugation Protocol: Transfer 15 mL of sample to a centrifuge tube. Centrifuge at 5,000 × g for 15 minutes at controlled temperature (e.g., 25°C). Carefully collect the supernatant without disturbing the pellet [47].
- Filtration Protocol: Pass an aliquot of the centrifuged sample through a 0.45 μm syringe filter, discarding the first 1-2 mL. For critical applications, perform a second filtration through a 0.22 μm filter [44].
- Post-Treatment Analysis: Re-acquire the UV-Vis spectrum of the treated sample using identical instrument parameters.
- Data Comparison: Calculate the percentage reduction in apparent absorbance at the analytical wavelength, particularly in regions where the analyte has minimal native absorption.
Interpretation: Effective turbidity correction is demonstrated by reduced baseline offset and noise, particularly at shorter wavelengths where scattering effects are most pronounced. The success of physical correction methods can be quantified by the decrease in the scattering coefficient derived from the baseline slope [45].
Pitfall 2: Spectral and Matrix Interferences
Classification of Interference Types
Spectral interferences in UV-Vis analysis manifest through multiple mechanisms that compromise method specificity. Chemical interferences arise from co-absorbing species whose absorption bands overlap with the target analyte, commonly encountered in complex pharmaceutical formulations containing multiple active ingredients, excipients, or degradation products [47]. Matrix effects originate from the sample solvent, pH modifiers, buffers, or dissolved impurities that absorb in the spectral region of interest, particularly below 230 nm where many organic solvents and functional groups demonstrate significant absorption [44].
Experimental Protocol for Interference Identification and Resolution
Materials and Equipment:
- UV-Vis spectrophotometer with scanning capability
- Standard solutions of pure analyte
- Potential interfering substances (excipients, degradation products)
- Buffer components and pH adjustment solutions
Procedure for Isoabsorbance Method (Single Interferent):
- Prepare separate standard solutions of the pure analyte and the suspected interferent at concentrations expected in samples.
- Record full spectra (200-400 nm) for both solutions and identify the analyte's wavelength of maximum absorption (λ_analytical).
- Identify a wavelength (λreference) where the interferent shows the same absorbance as at λanalytical, but the analyte demonstrates significantly different absorptivity [47].
- Develop a corrected absorbance calculation: Acorrected = Aanalytical - A_reference.
- Validate the method by analyzing synthetic mixtures with known ratios of analyte and interferent.
Procedure for Derivative Spectroscopy (Multiple Interferents):
- Acquire spectra of samples and standards with high resolution (e.g., 1 nm interval).
- Apply first or second derivative transformations using the instrument's software.
- Identify derivative zero-crossings or inflection points specific to the analyte that remain unaffected by broad background absorption [47].
- Construct the calibration curve using derivative amplitude values rather than raw absorbance.
- Establish system suitability criteria for derivative peak resolution and signal-to-noise ratios.
Three-Point Correction for Nonlinear Background:
- Select the analytical wavelength (λanalytical) and two additional wavelengths (λ1 and λ_2) on either side, equally spaced.
- Measure absorbance at all three wavelengths for samples and standards.
- Calculate corrected absorbance: Acorrected = Aanalytical - (A1 + A2)/2 [47].
Table 1: Comparative Analysis of Interference Correction Methods
| Method | Principle | Best Use Case | Limitations | Validation Parameters |
|---|---|---|---|---|
| Isoabsorbance | Spectral subtraction at matched interferent absorbance | Single known interferent with stable spectral profile | Fails with multiple interferents or concentration-dependent spectra | Specificity, Accuracy, Linearity |
| Derivative Spectroscopy | Resolution of overlapping peaks through differentiation | Multicomponent mixtures with partially resolved spectra | Reduced signal-to-noise ratio; requires optimization of derivative order | Precision, LOD, LOQ |
| Three-Point Correction | Linear interpolation of background absorption | Nonlinear background from complex matrices | Assumes linear background between flanking wavelengths | Accuracy, Robustness |
| Matrix-Matched Standards | Compensation through identical sample and standard matrices | Routine analysis of similar sample types | Requires extensive characterization of matrix composition | Accuracy, Precision |
Pitfall 3: Dynamic Range Limitations and Nonlinearity
Fundamental Principles and Deviation from Beer-Lambert Law
The Beer-Lambert law establishes a linear relationship between absorbance and concentration, but this relationship breaks down at high analyte concentrations due to several factors. Instrumental limitations include stray light reaching the detector, which becomes significant at high absorbance values (typically >1.2 AU) and causes negative deviation from linearity [48]. Chemical factors encompass molecular interactions at elevated concentrations, solute-solvent effects, and refractive index changes that alter the effective absorptivity [44]. These deviations pose significant challenges for method validation, particularly in establishing the quantitative range for pharmaceutical assays.
Experimental Protocol for Dynamic Range Assessment and Expansion
Materials and Equipment:
- High-precision analytical balance
- Volumetric flasks of appropriate capacity
- Standard reference material of known purity
- Appropriate solvent system
Procedure for Linearity and Range Determination:
- Stock Solution Preparation: Accurately weigh 100 mg of reference standard and dissolve in solvent to make 100 mL of stock solution (1000 μg/mL).
- Calibration Standards Preparation: Prepare at least 6 standard solutions covering the expected concentration range through serial dilution (e.g., 1, 5, 10, 25, 50, 75, 100 μg/mL).
- Spectra Acquisition: Measure absorbance of each standard in triplicate at the analytical wavelength using matched quartz cuvettes.
- Data Analysis: Plot mean absorbance versus concentration and perform linear regression analysis.
- Linearity Assessment: Calculate correlation coefficient (R²), y-intercept, and slope. Acceptable linearity typically demonstrates R² > 0.999 with a y-intercept not significantly different from zero [49].
- Range Establishment: Identify the concentration range where the response factor (absorbance/concentration) remains constant (typically ±2% RSD).
Strategies for Range Expansion:
- Pathlength Adjustment: For high absorbance samples, switch to shorter pathlength cuvettes (e.g., 1 mm instead of 10 mm) to maintain absorbance within the ideal 0.2-1.0 AU range [44].
- Sample Dilution: Develop and validate a dilution scheme that brings samples within the established linear range, accounting for potential dilution errors.
- Alternative Wavelength: Identify a secondary wavelength with lower absorptivity for high concentration samples, provided specificity is maintained.
Table 2: Quantitative Performance Metrics for UV-Vis Method Validation
| Validation Parameter | Acceptance Criteria | Experimental Approach | Impact of Pitfalls |
|---|---|---|---|
| Accuracy (% Recovery) | 98-102% | Spike recovery with known additions | Turbidity inflates recovery; interferences cause bias |
| Precision (% RSD) | ≤2% | Repeated measurements (n=6) | Light scattering increases variability |
| Linearity (R²) | >0.999 | Calibration curve (6+ points) | Nonlinearity at high concentrations reduces R² |
| Range | 80-120% of test concentration | Quality control samples at extremes | Limited by stray light at upper end |
| LOD (μg/mL) | Signal-to-noise ≥ 3:1 | Serial dilution of standard | Turbidity increases background noise |
| LOQ (μg/mL) | Signal-to-noise ≥ 10:1 | Serial dilution with precision | Scattering effects raise quantitation limit |
| Robustness | %RSD ≤ 2 with deliberate variations | Intentional method parameter changes | Susceptible to environmental factors |
Advanced Compensation Strategies: Data Fusion and Environmental Factor Control
Integrated Compensation for Multiple Interfering Factors
Recent research demonstrates that environmental factors (pH, temperature, conductivity) significantly interact with spectroscopic measurements, particularly in aqueous pharmaceutical systems. A data fusion approach that integrates spectral data with environmental parameters can substantially improve prediction accuracy for critical quality attributes [46]. This methodology employs weighted superposition of spectral features and environmental factors to establish multivariate calibration models that compensate for multiple interference sources simultaneously.
Experimental Protocol for Data Fusion Methodology:
- Sample Set Design: Collect samples encompassing natural variation in all relevant environmental factors (pH 3-9, temperature 15-35°C, conductivity 0-2000 μS/cm) [46].
- Multi-parameter Measurement: For each sample, record UV-Vis spectrum and simultaneously measure pH, temperature, and conductivity using calibrated multi-parameter instrumentation.
- Feature Selection: Identify feature wavelengths from the spectra using variable selection techniques (e.g., genetic algorithms, successive projections algorithm).
- Model Development: Fuse selected spectral features with environmental factors as additional input variables for partial least squares (PLS) or principal component regression (PCR) modeling.
- Validation: Employ cross-validation and external validation sets to assess model performance with and without environmental factor inclusion.
Performance Metrics: Implementation of this data fusion approach for Chemical Oxygen Demand prediction demonstrated significant improvement, with determination coefficient of prediction (Rₚᵣₑð’¹Â²) increasing to 0.9602 and root mean square error of prediction (RMSEP) decreasing to 3.52 compared to conventional spectral models [46].
Strategic Technique Selection: UV-Vis versus UFLC-DAD
The systematic evaluation of UV-Vis limitations directly informs the analytical technique selection process for pharmaceutical applications. UV-Vis spectroscopy offers advantages in speed, cost, and operational simplicity for routine quality control of well-characterized, single-component samples. However, when facing complex matrices, interference potential, or requirements for regulatory filing, UFLC-DAD provides superior capabilities for separation, identification, and quantification.
Decision Framework:
- Select UV-Vis when: Analyzing simple formulations with no expected interferences, working within established linear ranges, requiring rapid throughput for routine testing, or operating with limited resources [49].
- Select UFLC-DAD when: Analyzing multi-component formulations, characterizing impurity profiles, requiring confirmatory identification through spectral matching, dealing with complex biological matrices, or developing stability-indicating methods [36] [49].
UFLC-DAD specifically addresses UV-Vis limitations by physically separating components before detection, eliminating spectral interferences through chromatographic resolution, providing peak purity assessment through spectral matching, and offering wider dynamic range through automated dilution or calibration curve extension [36].
The Scientist's Toolkit: Essential Research Reagents and Materials
Table 3: Key Research Reagent Solutions for UV-Vis Method Development
| Reagent/Material | Function | Application Notes | Quality Specifications |
|---|---|---|---|
| Holmium Oxide Filter | Wavelength accuracy verification | Validates instrumental wavelength calibration across UV-Vis range | NIST-traceable certification required [48] |
| Neutral Density Filters | Photometric linearity assessment | Checks absorbance accuracy at multiple intensity levels | Calibrated at multiple wavelengths |
| Potassium Dichromate Solutions | Stray light determination | Measures stray light at lower wavelength range | High purity (ACS grade) in perchloric acid [48] |
| Certified Reference Materials | Method validation | Provides known absorbance standards for qualification | ISO 17034 accreditation |
| High-Purity Solvents | Sample preparation | Minimize background absorption in UV range | UV-spectrophotometric grade |
| Syringe Filters (0.45 μm, 0.22 μm) | Particulate removal | Addresses turbidity through physical separation | Low extractable membrane material |
| Buffer Components | pH control | Maintains consistent ionization state of analytes | UV-transparent reagents (e.g., phosphate) |
| Quartz Cuvettes | Sample containment | Provides UV transmission with defined pathlength | Matched pairs with specified pathlength tolerance |
| cGAS-IN-1 | cGAS-IN-1, MF:C18H19NO8, MW:377.3 g/mol | Chemical Reagent | Bench Chemicals |
| GSPT1 degrader-4 | GSPT1 degrader-4, MF:C24H21ClN4O5, MW:480.9 g/mol | Chemical Reagent | Bench Chemicals |
Workflow Visualization for Experimental Planning
Decision Workflow for UV-Vis Analysis
Navigating the common pitfalls of UV-Vis spectroscopy requires systematic assessment of sample turbidity, spectral interferences, and dynamic range limitations. Through implementation of the experimental protocols and compensation strategies outlined in this technical guide, researchers can enhance data quality and make informed decisions regarding analytical technique selection. While UV-Vis remains a valuable tool for pharmaceutical analysis, recognition of its inherent limitations enables appropriate application and knowing transition to more powerful techniques like UFLC-DAD when sample complexity or regulatory requirements demand higher specificity and separation capability.
The selection of an appropriate analytical technique is fundamental to the success of any pharmaceutical research and development project. Within this context, the decision between UV-Visible spectrophotometry and Ultra-Fast Liquid Chromatography with Diode Array Detection (UFLC-DAD) involves critical trade-offs between simplicity, cost, analytical performance, and environmental impact. UV-Vis spectrophotometry offers simplicity, cost-effectiveness, and reduced environmental footprint, making it suitable for well-defined, single-component analyses. In contrast, UFLC-DAD provides superior separation power, specificity, and the ability to handle complex multi-component mixtures, albeit with greater operational complexity, cost, and solvent consumption [35] [40].
This guide addresses three persistent technical challenges in UFLC-DAD analysis—peak tailing, co-elution, and column degradation—within the framework of analytical method selection. By providing systematic troubleshooting protocols and comparative performance data, we aim to empower researchers to optimize UFLC-DAD methods while understanding their appropriate application relative to alternative techniques like UV-Vis in pharmaceutical analysis.
Understanding and Addressing Peak Tailing
Peak tailing is a frequent chromatographic issue characterized by asymmetric peaks with prolonged trailing edges, which can significantly reduce resolution and quantification accuracy. Understanding its root causes is essential for effective troubleshooting.
Primary Causes and Mitigation Strategies
The table below summarizes the common causes of peak tailing and their respective solutions.
Table 1: Common Causes of and Solutions for Peak Tailing
| Category | Specific Cause | Impact on Peak Shape | Recommended Solution |
|---|---|---|---|
| Chemical Interactions | Secondary interactions with residual silanols [50] [51] | Tailing for basic/ionic compounds | Use high-purity, end-capped columns [51] |
| Metal surface interactions [51] | Tailing for chelating compounds | Use metal-free (e.g., PEEK) flow paths [51] | |
| Ionization state mismatch [50] [51] | Tailing for ionizable analytes | Adjust mobile phase pH to suppress analyte ionization [50] [51] | |
| Sample & Injection | Solvent mismatch [50] | Fronting or splitting, especially for early eluting peaks | Match injection solvent strength to initial mobile phase [50] |
| Column mass overload [50] [51] | Tailing due to saturated retention sites | Reduce injection volume or dilute sample [50] [51] | |
| Column & System | Column degradation/contamination [50] [51] | General tailing and loss of efficiency | Clean or replace column; use guard column [50] [51] |
| Void at column inlet [50] | Tailing for all peaks | Examine and replace inlet frit; refill column void [50] | |
| Extra-column volume [51] | Broadening and tailing due to post-column dispersion | Minimize tubing length and internal diameter [51] |
Experimental Protocol for Diagnosing Peak Tailing
A systematic approach is required to diagnose the root cause of tailing efficiently.
- Initial Assessment: Inject a standard solution and calculate the asymmetry factor (As) for the tailing peak. An As value consistently outside 0.9-1.2 indicates a problem [50].
- Isolate the Cause:
- Check for Systemic Issues: Observe if tailing affects all peaks in the chromatogram. If yes, the issue is likely physical (e.g., column void, extra-column volume) [50].
- Check for Chemical Issues: If tailing is analyte-specific, it suggests chemical interactions (e.g., with silanols or metals) [50] [51].
- Perform Diagnostic Tests:
- Sample Load Test: Halve the injection volume or concentration. If tailing is reduced, the issue was mass overload [50] [51].
- Solvent Match Test: Prepare the sample in a solvent that matches the initial mobile phase composition. If peak shape improves, a solvent mismatch was the cause [50].
- Blank Injection: Run a blank to rule out carryover or system contamination as sources of tailing [50].
The following workflow diagram outlines the logical decision process for troubleshooting peak tailing.
Resolving Co-elution Problems
Co-elution occurs when two or more compounds have insufficient resolution, leading to inaccurate integration and quantification. This is a key challenge where UFLC-DAD's separation power is critical versus UV-Vis, which cannot resolve overlapping spectra without sophisticated chemometrics [35] [40].
Strategies for Peak Resolution
Table 2: Method Development Strategies to Resolve Co-elution
| Parameter | Adjustment | Mechanism of Action | Considerations |
|---|---|---|---|
| Mobile Phase | Adjust pH (e.g., ±0.2 units) [52] | Alters ionization state of ionizable analytes, changing retention. | Must be within column pH stability range. |
| Change organic modifier ratio [18] [52] | Modifies solvent strength, affecting elution time. | Can be isocratic or gradient. | |
| Switch organic modifier (ACN vs. MeOH) [18] | Changes selectivity and interaction with analytes/stationary phase. | Methanol generates higher backpressure. | |
| Chromatographic System | Use gradient elution [18] [52] | Increases solvent strength over time to elute tightly retained compounds. | Requires longer re-equilibration. |
| Reduce column temperature [52] | Can improve selectivity for some compound pairs. | May increase backpressure. | |
| Use a column with different selectivity [18] | Changes the chemical nature of stationary phase interactions. | Requires method re-validation. |
Experimental Protocol for Method Optimization to Avoid Co-elution
A systematic approach to method development is crucial. The use of Design of Experiments (DoE) is highly recommended for efficient optimization [52].
- Initial Scouting: Use a linear gradient (e.g., 5-100% organic modifier over 10-20 minutes) to determine the approximate elution window and separation feasibility of your compounds.
- Critical Parameter Identification: Identify Critical Method Parameters (CMPs), typically mobile phase pH, gradient slope, and column temperature, that influence the Critical Quality Attributes (CQAs) like resolution between the critical pair [52].
- DoE Implementation: Employ an experimental design such as Box-Behnken to efficiently explore the interaction effects of the CMPs on the CQAs. This statistical approach minimizes the number of required experiments while maximizing information gain [52].
- Fine-Tuning and Robustness Testing: Use the model generated by the DoE to find the optimal method conditions. Finally, apply a Plackett-Burman design to verify the method's robustness to small, deliberate variations in the CMPs, ensuring reliability during routine use [52].
Preventing and Managing Column Degradation
Chromatographic column performance is the cornerstone of reliable UFLC-DAD analysis. Column degradation directly leads to peak tailing, loss of resolution, and pressure changes, undermining the advantages of UFLC over simpler techniques.
Comprehensive Column Maintenance Protocol
- Daily Operation:
- Use Guard Columns/In-Line Filters: Always use a guard column to trap particulates and strongly adsorbed compounds, protecting the more expensive analytical column [53] [51].
- Prevent Buffer Precipitation: When using buffer mobile phases, flush the system first with 10-20 column volumes of water or a 5-10% aqueous organic mix to remove salts, followed by a storage solvent (e.g., acetonitrile or methanol). Never switch directly from a high-concentration buffer to a high-organic solvent [54] [55].
- End-of-Run Storage:
- For reversed-phase columns, flush with at least 15-20 column volumes of water to remove buffers, followed by 15-20 column volumes of organic solvent (e.g., acetonitrile or methanol ≥ 50%) for storage. This prevents salt crystallization and microbial growth [54] [55].
- Seal the column tightly with the supplied end plugs to prevent the packing material from drying out [54].
- Preventive Maintenance Schedule:
- Performance Tracking: Log column performance metrics (pressure, plate count, tailing factor) over time [53].
- Cleaning: Perform periodic cleaning with strong solvents according to the manufacturer's instructions, especially after analyzing complex biological or soil extracts [53].
- Documentation: Maintain a detailed log of all samples analyzed, cleaning procedures, and performance verification tests for each column [53].
The Scientist's Toolkit: Essential Research Reagents and Materials
The following table details key materials and reagents essential for developing and maintaining robust UFLC-DAD methods.
Table 3: Essential Research Reagents and Materials for UFLC-DAD Analysis
| Item | Specification/Recommended Type | Critical Function in UFLC-DAD Analysis |
|---|---|---|
| HPLC-Grade Water | ≥18 MΩ·cm resistivity | Base for mobile phase to minimize UV-absorbing contaminants and particulates. |
| HPLC-Grade Solvents | Acetonitrile, Methanol (low UV cutoff) | Organic modifiers for mobile phase; purity is critical for low baseline noise. |
| Buffer Salts | High Purity (e.g., LiChropur) | Control mobile phase pH and ionic strength (e.g., potassium dihydrogen phosphate) [18] [52]. |
| Analytical Column | C18, 1.7-5μm particle size | Stationary phase for compound separation; the heart of the chromatographic system [18] [52]. |
| Guard Column | Matching stationary phase | Protects analytical column from particulates and irreversibly adsorbed compounds [53] [51]. |
| Vial Inserts & Septa | Low-UV, low-leachability | Prevents extraneous peaks ("ghost peaks") from vial/closure materials at high sensitivity [54]. |
| Reference Standards | Certified Reference Materials | For system calibration, qualification, and method validation to ensure data accuracy [53] [18]. |
Successful resolution of UFLC-DAD issues requires a systematic understanding of the interrelated causes of peak tailing, co-elution, and column degradation. By implementing the detailed troubleshooting workflows, method optimization protocols, and maintenance regimens outlined in this guide, researchers can significantly enhance the reliability and analytical performance of their UFLC-DAD systems.
The decision to employ UFLC-DAD over simpler techniques like UV-Vis spectrophotometry should be guided by the complexity of the analytical problem. For single-component analysis where specificity is not a concern, UV-Vis offers a greener, more cost-effective solution [35] [40]. However, for complex mixtures requiring high-resolution separation, UFLC-DAD is indispensable. Mastering its technical challenges ensures that researchers can leverage its full capabilities, making informed choices in analytical technique selection that align with research objectives, data quality requirements, and practical constraints.
Optimizing Sensitivity and Resolution in UFLC-DAD Methods
Ultra-Fast Liquid Chromatography coupled with a Photodiode Array Detector (UFLC-DAD) represents a significant advancement in analytical instrumentation, offering researchers enhanced separation capabilities with superior resolution and sensitivity compared to conventional techniques. Within the broader context of selecting appropriate analytical methodologies, understanding the distinct advantages of UFLC-DAD over standalone UV-Vis spectroscopy is crucial for method development in pharmaceutical and biochemical research. While UV-Vis spectroscopy provides valuable quantitative information for chromophore-containing compounds, it lacks the separation power required for complex matrices. UFLC-DAD integrates high-resolution chromatographic separation with full-spectrum ultraviolet-visible detection, enabling simultaneous multi-component analysis in complex biological samples such as milk, plasma, and tissue extracts. This technical guide explores systematic approaches for optimizing sensitivity and resolution in UFLC-DAD methods, providing researchers with practical frameworks for method development and validation.
Theoretical Foundations: UV-Vis versus UFLC-DAD
Fundamental Technique Comparisons
The selection between UV-Vis spectroscopy and UFLC-DAD depends primarily on analytical objectives, sample complexity, and required data specificity. UV-Vis spectroscopy operates as a bulk measurement technique, analyzing the collective absorbance properties of all light-absorbing compounds in a sample without separation. This makes it suitable for simple mixtures or single-component analysis where spectral overlap is negligible. In contrast, UFLC-DAD combines the physical separation power of liquid chromatography with the qualitative and quantitative capabilities of diode array detection, enabling resolution of complex mixtures into individual components while collecting full spectral data for each eluting peak.
The DAD component fundamentally differs from conventional UV-Vis detectors by simultaneously monitoring multiple wavelengths across a broad spectrum (typically 190-800 nm) rather than single wavelengths sequentially. This capability provides several critical advantages: peak purity assessment through spectral matching, selection of optimal wavelengths for different analytes within a single run, and post-acquisition data analysis at wavelengths not originally monitored. For drug development professionals, this means enhanced method robustness and the ability to perform comprehensive impurity profiling without additional injections.
Technical Specifications Comparison
Table 1: Comparative Analysis of UV-Vis Spectroscopy and UFLC-DAD Technical Capabilities
| Parameter | UV-Vis Spectroscopy | UFLC-DAD |
|---|---|---|
| Separation Mechanism | None | Reversed-phase, normal-phase, HILIC, ion-exchange |
| Detection Type | Bulk solution measurement | Post-separation individual analyte detection |
| Spectral Data | Single spectrum for entire sample | Full spectrum for each eluting compound |
| Analysis Time | Minutes | 10-30 minutes typically |
| Multi-component Analysis | Limited without chemometrics | Excellent for complex mixtures |
| Sensitivity | ~µg/mL range | ~ng/mL to pg/mL range |
| Peak Purity Assessment | Not available | Spectral overlay and matching algorithms |
| Method Development Complexity | Low | Moderate to high |
| Sample Cleanup Requirements | Often extensive | Minimal due to separation |
| Mobile Phase Considerations | Solvent must be transparent at λ | Gradient-compatible solvents required |
Critical Parameters for UFLC-DAD Optimization
Chromatographic Resolution Enhancement
Achieving baseline separation of complex mixtures requires systematic optimization of chromatographic parameters. Column selection represents the primary factor affecting resolution, with core-shell particle technology providing superior efficiency compared to fully porous particles. The research demonstrates that Kinetex C18 columns (1.7 µm, 150 mm × 2.1 mm) achieve satisfactory separation of orotic acid from endogenous milk components with retention at 6.44 ± 0.03 minutes [56]. The column chemistry, particle size, and dimensions directly impact peak capacity and resolution, with smaller particles (sub-2µm) providing enhanced efficiency at the cost of higher backpressure.
Temperature control represents another critical parameter, with elevated column temperatures (35°C) improving chromatographic efficiency by reducing mobile phase viscosity and enhancing mass transfer [56]. The optimized binary gradient elution program employs variable mixtures of aqueous and organic phases (typically water/acetonitrile or water/methanol with modifiers) to differentially elute compounds based on hydrophobicity. For complex separations involving structural analogs like β- and γ-forms of tocopherols and tocotrienols, C18 columns may struggle with resolution, necessitating specialized stationary phases including solid-core pentafluorophenyl, C30 silica, or polyvinyl alcohol columns [29].
Detection Sensitivity Optimization
Maximizing detection sensitivity in UFLC-DAD methods requires careful consideration of both chromatographic and detection parameters. The photodiode array detector provides wavelength optimization flexibility, allowing researchers to select the optimal detection wavelength for each analyte based on its absorption maxima and matrix interference. For orotic acid determination, detection at 278 nm provides optimal sensitivity while minimizing background interference from milk components [56].
Sample preparation techniques significantly impact method sensitivity, with protein precipitation using acetonitrile (1:1, v/v) followed by centrifugation and dilution proving effective for milk samples [56]. For fat-soluble analytes like tocopherols and tocotrienols in oils, gentle saponification and efficient extraction are necessary to concentrate analytes and remove interfering lipids [29]. Injection volume optimization (0.5-6 µL in the orotic acid method) balances sensitivity requirements with potential column overloading [56].
Table 2: Sensitivity and Precision Metrics for Optimized UFLC-DAD Methods
| Performance Parameter | Orotic Acid in Milk [56] | Tocochromanols in Oils [29] |
|---|---|---|
| Detection Limit | 0.04 ng | Not specified |
| Quantification Limit | 0.12 ng | Not specified |
| Intra-assay Precision (CV%) | 0.710-1.283% | Not specified |
| Inter-assay Precision (CV%) | 0.377-1.221% | Not specified |
| Accuracy (Recovery %) | 96.7-105.3% | Not specified |
| Linearity Range | Not specified | Not specified |
| Retention Time Stability | 6.44 ± 0.03 min | Not specified |
| Analytical Range | 25-36 mg/L (ovine milk) | Not specified |
| Sample Throughput | 27 min total run time | Not specified |
Experimental Protocols for UFLC-DAD Method Development
Sample Preparation Methodology
Protocol for Orotic Acid Determination in Milk:
- Precisely measure 1 mL of milk sample into a centrifuge tube
- Add 1 mL of HPLC-grade acetonitrile (1:1, v/v) for protein precipitation
- Vortex mix for 30 seconds to ensure complete precipitation
- Centrifuge at 4°C for 10 minutes at high speed (≥10,000 × g)
- Carefully transfer 1 mL of the cleared supernatant to a clean vial
- Dilute with 9 mL of ultrapure water (1:10 dilution)
- Filter through 0.22 µm or 0.45 µm membrane filter prior to injection [56]
Protocol for Tocopherol/Tocotrienol Analysis in Oils:
- Weigh approximately 100 mg of oil sample accurately
- Add 2 mL of ethanolic KOH solution (0.5-1.0 M) for saponification
- Heat at 60-70°C for 30 minutes with occasional shaking
- Cool to room temperature and add 2 mL of ultrapure water
- Extract with 3 × 2 mL of hexane or ethyl acetate
- Combine organic layers and evaporate under nitrogen stream
- Reconstitute residue in 1 mL of appropriate HPLC mobile phase [29]
Instrumental Parameters and Method Conditions
Chromatographic Conditions for Orotic Acid Analysis:
- Columns: Two Kinetex C18 columns (1.7 µm, 150 mm × 2.1 mm, 100 Å) with C18 pre-column (4 mm × 2 mm)
- Column Temperature: 35°C maintained throughout analysis
- Injection Volume: 0.5-6 µL optimized based on concentration
- Mobile Phase: Binary gradient with Component A (aqueous buffer/acid) and Component B (organic modifier)
- Gradient Program: Optimized binary gradient with specific timing for orotic acid elution at 6.44 minutes
- Run Time: 27 minutes including column re-equilibration [56]
Detection Parameters:
- Detection Wavelength: 278 nm for orotic acid (wavelength optimized for maximum absorbance)
- Spectral Range: 190-500 nm for full spectral acquisition when using DAD
- Data Collection Rate: 1-5 Hz depending on peak widths and required data density
- Reference Wavelength: Off or set to a non-absorbing region for baseline correction
For fluorescence detection of tocochromanols, set excitation wavelength to 290 nm and emission wavelength to 327 nm for optimal sensitivity [29].
The Scientist's Toolkit: Essential Research Reagents and Materials
Table 3: Essential Research Reagent Solutions for UFLC-DAD Method Development
| Reagent/Material | Specification | Function in UFLC-DAD Analysis |
|---|---|---|
| Kinetex C18 Column | 1.7 µm, 150 mm × 2.1 mm, 100 Å [56] | Stationary phase for reversed-phase separation of polar to moderate non-polar compounds |
| HPLC-grade Acetonitrile | ≥99.9% purity, low UV absorbance | Primary organic modifier for mobile phase; protein precipitation solvent |
| HPLC-grade Methanol | ≥99.9% purity, low UV absorbance | Alternative organic modifier for different selectivity |
| Trifluoroacetic Acid | HPLC-grade, ≥99.5% | Ion-pairing agent and mobile phase modifier to improve peak shape for acidic compounds |
| Ammonium Acetate/Formate | HPLC-grade, ≥99.0% | Buffer salts for mobile phase pH control and ionization suppression |
| Ultrapure Water | 18.2 MΩ·cm resistivity | Aqueous component of mobile phase; sample dilution |
| Orotic Acid Standard | Analytical standard, ≥98% purity | Quantification standard for method calibration and validation |
| Tocopherol/Tocotrienol Standards | α-, β-, γ-, δ- isoforms, ≥95% purity | Reference standards for fat-soluble vitamin analysis |
| Protein Precipitation Solvents | Acetonitrile, methanol, perchloric acid | Sample cleanup to remove proteinaceous material from biological matrices |
| Solid Phase Extraction Cartridges | C18, mixed-mode, silica | Sample concentration and cleanup for enhanced sensitivity |
Visualization of UFLC-DAD Method Optimization Workflow
Workflow for Systematic UFLC-DAD Method Development
Advanced Optimization Strategies
Method Validation and Quality Control
Comprehensive method validation establishes reliability and reproducibility for UFLC-DAD methods. The orotic acid method demonstrates excellent precision with inter- and intra-assay coefficients of variation below 1.3% and accuracy (recovery) between 96.7-105.3% [56]. Key validation parameters include:
- Linearity: Establishing calibration curves across the expected concentration range with correlation coefficients (R²) >0.995
- Precision: Evaluating repeatability (intra-day) and intermediate precision (inter-day) with CV% <5% for retention times and <10% for peak areas
- Accuracy: Recovery studies using spiked samples at multiple concentration levels
- Specificity: Resolution of analytes from potentially interfering matrix components
- Sensitivity: Determination of limit of detection (LOD) and quantification (LOQ) based on signal-to-noise ratios of 3:1 and 10:1, respectively
- Robustness: Deliberate variations in method parameters (temperature, flow rate, mobile phase pH) to assess method resilience
Troubleshooting Common UFLC-DAD Challenges
Troubleshooting Common UFLC-DAD Method Issues
Optimizing sensitivity and resolution in UFLC-DAD methods requires systematic approach addressing sample preparation, chromatographic separation, and detection parameters. The superior capabilities of UFLC-DAD over conventional UV-Vis spectroscopy for complex sample analysis make it indispensable in pharmaceutical and biochemical research. By implementing the detailed protocols, optimization strategies, and troubleshooting approaches outlined in this technical guide, researchers can develop robust, sensitive, and reproducible UFLC-DAD methods suitable for drug development, quality control, and research applications. The continued advancement in column chemistries, instrumentation, and data processing algorithms will further enhance the capabilities of UFLC-DAD methodologies in analytical science.
Sample Preparation Strategies for Complex Matrices like Oils and Plant Extracts
The analysis of complex biological matrices, such as plant extracts and oils, is a critical step in pharmaceutical, nutraceutical, and natural product research. The quality and reliability of analytical data from techniques like UV-Vis spectroscopy and Ultra-Fast Liquid Chromatography with Diode Array Detection (UFLC-DAD) are fundamentally dependent on the initial sample preparation strategy. Effective preparation aims to extract target analytes, remove interfering compounds, and present the sample in a form compatible with the subsequent analytical instrumentation. This guide provides a comprehensive overview of scientifically-grounded preparation methods, focusing on their application within a research framework that necessitates choosing between UV-Vis and UFLC-DAD analytical techniques.
The core challenge lies in the complexity of these matrices. Plant extracts contain a diverse range of secondary metabolites—such as alkaloids, flavonoids, terpenoids, and phenolic compounds—alongside primary constituents like sugars, proteins, and chlorophyll [57]. Oils comprise a mixture of triglycerides, fatty acids, and fat-soluble vitamins and pigments. Without proper preparation, these co-extractives can cause significant interference, leading to inaccurate quantification, reduced chromatographic resolution, and detector saturation.
Fundamental Extraction Principles and Solvent Selection
The initial extraction is the most pivotal stage in sample preparation. The choice of solvent and method dictates which compounds are successfully isolated from the raw material.
Solvent Polarity and Selectivity
The principle of "like dissolves like" is fundamental to solvent selection. Solvents are chosen based on their polarity to match the chemical nature of the target analytes [57]. Polar solvents (e.g., water, methanol, ethanol) are effective for extracting polar compounds like glycosides and polysaccharides, while solvents of intermediate polarity (e.g., acetone, dichloromethane) are suitable for flavonoids and tannins. Non-polar solvents (e.g., n-hexane, chloroform, ether) are ideal for isolating non-polar compounds such as oils, waxes, terpenoids, and alkaloids [57] [58].
The table below summarizes common solvents used in order of increasing polarity:
Table 1: Common Extraction Solvents and Their Properties [57]
| Solvent | Polarity Index | Suitable Compound Classes | Advantages | Disadvantages |
|---|---|---|---|---|
| n-Hexane | 0.009 | Oils, waxes, fats | Excellent for non-polar compounds; highly selective | Toxic, flammable |
| Diethyl Ether | 0.117 | Alkaloids, terpenoids, fatty acids | Low boiling point, miscible with water | Highly volatile, flammable, forms peroxides |
| Ethyl Acetate | 0.228 | Flavonoids, tannins, phenolics | Medium polarity, good for many secondary metabolites | Flammable |
| Chloroform | 0.259 | Terpenoids, flavonoids, fats | Colorless, sweet smell, soluble in alcohols | Carcinogenic, sedative properties |
| Dichloromethane | 0.309 | Alkaloids, terpenes | Good for medium-polarity compounds | Potential health hazard |
| Acetone | 0.355 | Various medium-polarity compounds | Miscible with water, low toxicity | Flammable |
| Ethanol | 0.654 | Polar compounds like phenolics, sugars | Non-toxic at low concentrations, self-preservative | Does not dissolve gums/waxes, flammable |
| Methanol | 0.762 | Alkaloids, glycosides, polar compounds | Effective for a wide range of polar compounds | Toxic, flammable |
| Water | 1.000 | Polar compounds, sugars, proteins | Cheap, non-toxic, non-flammable, highly polar | Promotes microbial growth, can cause hydrolysis |
Key Factors in Method Selection
Beyond solvent polarity, several other factors critically influence the choice of an extraction method [57]:
- Nature of the Plant Material: The physical structure (e.g., root, leaf, seed, bark) and its hardness determine whether grinding, crushing, or powdering is required before extraction.
- Temperature Sensitivity: Many bioactive compounds are thermolabile. Methods like steam distillation that involve high heat can degrade these compounds, making cold pressing or COâ‚‚ extraction preferable [58] [59].
- Intended Use of Extract: The required purity and the presence of solvent residues are governed by the final application. For pharmaceutical analysis, high purity and minimal solvent contamination are paramount.
- Selectivity: The solvent's ability to extract the desired compounds while leaving interfering substances behind is a key consideration.
Extraction Methodologies: Protocols and Applications
Various extraction techniques are employed, each with distinct protocols, mechanisms, and suitability for different sample types and analytical goals.
Conventional Liquid-Solvent Extraction Methods
Protocol 1: Maceration [57] [58] This is a simple, low-temperature soaking process.
- Plant Preparation: The plant material is dried and comminuted (finely cut, crushed, or ground into a moderately coarse powder).
- Extraction: The material is placed in a closed vessel, and a selected solvent (menstruum) is added.
- Steeping: The mixture is allowed to stand for a minimum of three days at room temperature with occasional shaking.
- Separation and Clarification: The liquid is strained from the solid residue (marc). The marc is pressed to recover any occluded liquid. The strained and expressed liquids are combined and clarified by filtration or subsidence.
- Analytical Context: Maceration is suitable for preparing samples for UV-Vis screening of total phenolic or flavonoid content. However, the extracts can be complex and may require further clean-up for UFLC-DAD analysis to prevent column fouling.
Protocol 2: Soxhlet Extraction [57] This is a continuous, semi-automated extraction method.
- Setup: The dried, ground plant material is placed in a cellulose or thimble, which is then positioned in the extraction chamber of a Soxhlet apparatus.
- Cycle: The solvent in the bottom flask is heated to boiling. The vapor condenses and drips onto the sample, filling the chamber. When the chamber is full, the siphon arm activates, emptying the solute-rich solution back into the bottom flask. This cycle repeats for hours or days.
- Concentration: The final extract is concentrated from the bottom flask.
- Analytical Context: Efficient for exhaustive extraction but uses elevated temperatures, which may degrade thermolabile analytes. The resulting complex extract often requires significant post-extraction purification before UFLC-DAD analysis.
Advanced and Specialized Extraction Methods
Protocol 3: Steam Distillation [58] [59] Ideal for volatile, heat-stable oils.
- Setup: Plant material is placed in a still (steam distillation apparatus).
- Steam Injection: Pressurized steam is injected through the plant material. The heat and steam cause the plant's essential oil sacs to rupture, releasing volatile oils.
- Co-Distillation and Collection: The vaporized oil and steam travel through a condenser, where they cool and return to liquid form.
- Separation: The liquid is collected in a separator, where the oil (hydrophobic) and water (hydrophilic) separate based on immiscibility and density. The oil is then siphoned off. The water phase (hydrosol) may also be collected.
- Analytical Context: The resulting essential oil is a concentrated source of volatile compounds. It can be diluted for direct UV-Vis analysis or dissolved in an appropriate solvent for profiling via UFLC-DAD.
Protocol 4: Supercritical Fluid Extraction (SFE) with COâ‚‚ [58] [59] A high-pressure, tunable method that uses supercritical COâ‚‚ as a solvent.
- Pressurization and Heating: CO₂ is pressurized and heated above its critical point (31°C, 74 bar), turning it into a supercritical fluid with liquid-like density and gas-like viscosity.
- Extraction: The supercritical COâ‚‚ is pumped through a chamber containing the plant material. It acts as a solvent, penetrating the matrix and dissolving the target compounds.
- Separation: The COâ‚‚-rich with dissolved solutes passes into a separate chamber where the pressure is reduced. This causes the COâ‚‚ to revert to a gaseous state, leaving the extracted material behind.
- Analytical Context: SFE is highly selective and produces clean, solvent-free extracts. The "tunability" of the solvent strength by adjusting pressure and temperature makes it ideal for isolating specific analyte classes for highly sensitive UFLC-DAD analysis. It avoids thermal degradation and solvent interference.
The following workflow diagram illustrates the decision-making process for selecting an appropriate extraction method based on the properties of the target analyte and the sample matrix.
Post-Extraction Clean-up and Concentration
Crude extracts often require further processing to be analysis-ready.
- Liquid-Liquid Extraction (LLE): Used to separate compounds based on solubility in two immiscible solvents. A common approach is to partition an aqueous extract with an organic solvent like dichloromethane or ethyl acetate to isolate non-polar from polar interferents [57].
- Solid-Phase Extraction (SPE): A more advanced and efficient clean-up technique. The extract is passed through a cartridge containing a sorbent (e.g., C18 for reverse-phase, silica for normal-phase). Target analytes are retained, while impurities are washed away. The analytes are then eluted with a strong solvent, resulting in a purified and concentrated sample [36]. This is highly recommended as a final step before UFLC-DAD to protect the column and enhance detection sensitivity.
Analytical Technique Selection: UV-Vis vs. UFLC-DAD
The choice between UV-Vis spectroscopy and UFLC-DAD is dictated by the required level of specificity, the complexity of the extract, and the analytical question.
UV-Vis Spectroscopy is best suited for:
- Rapid Screening: Quick quantification of total content of a compound class (e.g., total phenolics, total flavonoids, total carotenoids) using colorimetric assays.
- High-Throughput Analysis: When analyzing a large number of samples where specific compound identification is not the primary goal.
- Limited Sample Complexity: Relatively pure extracts or those where the analyte of interest is the dominant chromophore.
UFLC-DAD is required for:
- Specific Identification and Quantification: When individual compounds (e.g., a specific flavonoid like quercetin, or a vitamin) need to be identified and measured in a complex mixture [36].
- Multi-Analyte Determination: Simultaneous analysis of several compounds in a single run, such as vitamins B1, B2, and B6 in a fortified product or plant extract [36].
- Complex Matrices: Where significant spectral overlap and interference from other compounds make UV-Vis unreliable.
The table below contrasts the two techniques to guide selection.
Table 2: Analytical Technique Selection: UV-Vis vs. UFLC-DAD
| Parameter | UV-Vis Spectroscopy | UFLC-DAD |
|---|---|---|
| Analytical Scope | Total content of a compound class | Specific identification & quantification of individual analytes |
| Selectivity | Low | Very High |
| Separation Power | None | High (chromatographic separation) |
| Sample Throughput | High (fast) | Moderate (longer run times) |
| Data Output | Single spectrum; absorption at a specific wavelength | Chromatogram with retention time + UV-Vis spectrum for each peak |
| Ideal for Matrices | Simple or pre-purified extracts | Highly complex mixtures (e.g., crude plant extracts, oils) |
| Example Application | Total antioxidant capacity of an oil | Profiling and quantifying individual cannabinoids in a hemp extract |
The Scientist's Toolkit: Essential Research Reagents and Materials
Successful sample preparation relies on a suite of specific reagents and laboratory materials.
Table 3: Essential Research Reagents and Materials for Sample Preparation
| Item | Function & Application |
|---|---|
| Solvents (HPLC Grade) | High-purity methanol, ethanol, acetonitrile, water, hexane, chloroform. Used for extraction, dilution, and as mobile phases to minimize background interference. |
| Solid-Phase Extraction (SPE) Cartridges | e.g., C18, Silica, Amino-propyl. For post-extraction clean-up and concentration of samples to remove interfering matrix components prior to UFLC-DAD [36]. |
| Derivatization Agents | e.g., Potassium ferricyanide (for thiochrome formation from Vitamin B1). Used to convert non-UV-absorbing or non-fluorescent compounds into detectable derivatives for analysis [36]. |
| pH Buffers | e.g., Phosphate buffers, ammonium formate. Critical for maintaining pH during extraction to stabilize certain compounds and for use in mobile phases to control chromatographic separation [36]. |
| Antioxidants & Stabilizers | e.g., Ascorbic acid, Vitamin E oil. Added to extracts to prevent oxidation of sensitive compounds like polyphenols or unsaturated oils during storage and processing [58]. |
| Filter Membranes (0.45 µm, 0.22 µm) | Syringe filters (Nylon, PTFE). Essential for final clarification of samples to remove particulate matter that could damage HPLC systems or cause light scattering in UV-Vis cuvettes. |
The complete analytical workflow, from raw sample to data acquisition, integrates the sample preparation and analytical technique selection steps, as summarized below.
In modern analytical laboratories, particularly in pharmaceutical development and quality control, the choice of analytical technique is a critical determinant of efficiency, cost, and data reliability. The combination of Ultra-Violet Visible (UV-Vis) spectroscopy for rapid screening with Ultra-Fast Liquid Chromatography with Diode Array Detection (UFLC-DAD) for confirmatory analysis represents a powerful strategic approach that balances speed with specificity. This methodology leverages the inherent strengths of each technique: UV-Vis provides rapid, cost-effective analysis suitable for initial screening of samples, while UFLC-DAD delivers high-resolution separation and confirmation with superior specificity. Within the broader context of analytical technique selection, this complementary approach allows researchers to optimize resource allocation by rapidly identifying samples requiring detailed investigation, thereby increasing laboratory throughput without compromising analytical rigor.
The theoretical foundation for this combined approach rests on the complementary principles of these techniques. UV-Vis spectroscopy measures the absorption of light in the ultraviolet and visible regions by chromophoric compounds, following the Beer-Lambert law which states that absorbance is proportional to the concentration of the absorbing species [12]. While exceptionally valuable for quantitative analysis of known chromophores, conventional UV-Vis lacks separation capabilities, making it susceptible to interference in complex matrices. UFLC-DAD addresses this limitation by incorporating high-speed chromatographic separation prior to detection, utilizing columns packed with smaller particles (<2 μm) and operating at higher pressures compared to conventional HPLC, resulting in significantly enhanced speed, resolution, and sensitivity [18] [60]. The DAD component further strengthens the technique by providing full spectral information for each separated peak, enabling peak purity assessment and compound identification [12].
Technical Foundations: UV-Vis and UFLC-DAD Principles
UV-Vis Spectroscopy for Rapid Analysis
UV-Vis spectroscopy operates on the principle that molecules absorb light in the ultraviolet (typically 190-400 nm) and visible (400-800 nm) regions, causing electronic transitions. The key components of a modern UV-Vis spectrophotometer include a light source (usually deuterium for UV), a monochromator for wavelength selection, a sample compartment, and a photodetector. For quantitative analysis, the Beer-Lambert law (A = εbc) forms the fundamental basis, where A is absorbance, ε is the molar absorptivity (a compound-specific constant), b is the pathlength, and c is the concentration [12]. The selection of the maximum absorbance wavelength (λmax) for a given analyte is crucial for maximizing sensitivity.
The significant advantages of UV-Vis for screening purposes include its rapid analysis time (often seconds to minutes per sample), minimal sample preparation requirements, low operational costs, and simple operation. Furthermore, it is non-destructive to samples, allowing for further analysis if needed. However, its limitations are notable when dealing with complex mixtures, as it lacks separation capability and thus provides only composite spectra when multiple chromophores are present, potentially leading to inaccurate quantification due to overlapping absorptions [12]. This fundamental limitation is precisely why confirmation with a separation-based technique like UFLC-DAD becomes essential for complex samples.
UFLC-DAD for Confirmatory Analysis
UFLC represents an advancement over traditional High-Performance Liquid Chromatography (HPLC) by utilizing columns packed with smaller particles (typically 1.7-1.3 μm) and systems capable of operating at significantly higher pressures (exceeding 10,000 psi). According to the van Deemter equation, which describes the relationship between linear velocity and plate height, smaller particles provide enhanced efficiency without loss at higher flow rates, enabling faster separations with superior resolution [60]. For instance, one study demonstrated that a UFLC method achieved a run time of just 3 minutes for posaconazole analysis, compared to 11 minutes for a conventional HPLC method, representing a nearly 75% reduction in analysis time [18].
The Diode Array Detector (DAD) is a critical component that differentiates this approach from single-wavelength detection. Unlike a variable wavelength detector (VWD) that monitors at a single predetermined wavelength, a DAD simultaneously captures the full UV-Vis spectrum (e.g., 190-800 nm) for each eluting compound throughout the chromatographic run [12]. This capability provides three significant advantages for confirmatory analysis: (1) Peak Purity Assessment: By comparing spectra across different points of a chromatographic peak (upslope, apex, downslope), analysts can detect co-eluting impurities that might otherwise go unnoticed with single-wavelength detection. (2) Optimal Wavelength Selection: Post-run, analysts can extract chromatograms at different wavelengths to maximize sensitivity and selectivity for each compound. (3) Spectral Library Matching: Acquired spectra can be compared against reference spectra for compound identification, adding a second dimension of confirmation alongside retention time.
Table 1: Key Performance Comparison Between UV-Vis and UFLC-DAD Techniques
| Parameter | UV-Vis Spectroscopy | UFLC-DAD |
|---|---|---|
| Analysis Speed | Very fast (seconds-minutes) | Fast (minutes) |
| Sample Throughput | High | Moderate |
| Separation Capability | None | High-resolution |
| Specificity | Low in mixtures | High |
| Sensitivity | Good | Excellent |
| Structural Information | Limited spectral data | Full UV-Vis spectra + retention time |
| Sample Preparation | Minimal | Often required |
| Operational Cost | Low | Moderate to High |
| Primary Application | Rapid screening, quantification of pure compounds | Confirmatory analysis, complex mixtures |
Strategic Implementation: When to Combine Techniques
Ideal Application Scenarios
The combination of UV-Vis and UFLC-DAD is particularly advantageous in several research and quality control scenarios. First, in high-throughput screening environments such as pharmaceutical quality control and forensic toxicology, where numerous samples must be rapidly assessed to identify those requiring comprehensive analysis [61]. For example, in drug formulation analysis, UV-Vis can quickly quantify active ingredients in bulk powder or simple suspensions, while UFLC-DAD provides a stability-indicating method that can separate and detect degradants or related substances [18].
Second, this approach is valuable for method development and optimization, where UV-Vis can rapidly characterize spectral properties and determine optimal detection wavelengths before implementing more resource-intensive chromatographic methods. Third, in stability studies where multiple time-point samples are generated, UV-Vis offers a rapid means to monitor overall changes, with UFLC-DAD employed for detailed investigation of specific time points showing significant changes.
Fourth, the combination is particularly powerful for analysis of natural products and complex matrices like olive oil or wine, where multiple interfering compounds may be present [62] [21]. For instance, research on extra-virgin olive oil has demonstrated how UV-Vis can provide rapid screening for antioxidant molecules and quality parameters, while more specific techniques like HPLC-DAD or NMR offer confirmatory analysis and detailed characterization [62].
Decision Framework for Technique Selection
A strategic decision framework guides when to employ each technique individually or in combination. UV-Vis as a standalone technique is appropriate for well-characterized single-component systems, routine quality checks of standard solutions, and applications where the matrix is simple and known not to interfere. UFLC-DAD as a primary technique is necessary when analyzing complex mixtures, requiring peak purity assessment, method development for regulatory submissions, or when analyzing unknown samples.
The combined approach is recommended when facing large sample sets with expected variability, where rapid triage improves overall laboratory efficiency. It is also advised for method validation, where UV-Vis can provide rapid supporting data, and for troubleshooting unexpected results from UV-Vis screening, where UFLC-DAD can identify interferences or degradation products.
Diagram 1: Analytical Technique Selection Workflow. This decision tree guides the selection of UV-Vis, UFLC-DAD, or their combination based on sample characteristics and analytical requirements.
Experimental Protocols and Methodologies
Detailed Protocol for UV-Vis Screening of Pharmaceutical Compounds
The following protocol, adapted from posaconazole analysis research, provides a standardized approach for rapid screening of pharmaceutical compounds [18]:
Instrumentation and Reagents: UV-Vis spectrophotometer with 1 cm pathlength quartz cuvettes; Methanol (HPLC grade); Potassium dihydrogen orthophosphate (analytical grade); High purity distilled water; Standard compound (e.g., posaconazole); Sample suspension (e.g., Noxafil 40 mg/mL oral suspension).
Standard Solution Preparation:
- Prepare a 100 μg/mL stock solution by dissolving 10 mg of standard compound in 100 mL methanol.
- Serially dilute with methanol to create working standards covering the range of 5-50 μg/mL.
- For suspension formulations, dilute 0.1 mL of suspension to 10 mL with methanol, then further dilute to appropriate concentration.
Instrument Parameters:
- Wavelength range: 200-400 nm (scanning) or fixed at λmax (e.g., 262 nm for posaconazole)
- Scan speed: Medium to fast
- Bandwidth: 1-2 nm
- Pathlength: 1 cm
Analysis Procedure:
- Zero the instrument with methanol blank.
- Measure absorbance of standard solutions to generate calibration curve (r² > 0.999 recommended).
- Measure absorbance of sample solutions.
- Calculate concentration using Beer-Lambert law with extinction coefficient or calibration curve.
Data Interpretation: For pure compounds, direct quantification against standards is valid. For mixtures, observe spectral shape changes or deviations from standard curve, which may indicate interference requiring confirmatory analysis.
Detailed Protocol for Confirmatory UFLC-DAD Analysis
This protocol, adapted from pharmaceutical and food analysis studies, provides a robust method for confirmatory analysis following UV-Vis screening [18] [21]:
Instrumentation and Reagents: UFLC system with DAD detector; C18 column (e.g., 2.1 × 50 mm, 1.3 μm); Acetonitrile (HPLC grade); Potassium dihydrogen orthophosphate (15 mM); Methanol (HPLC grade); Formic acid; Standard compounds; Sample extracts from screening.
Mobile Phase Preparation:
- For isocratic methods: Prepare acetonitrile:15 mM potassium dihydrogen orthophosphate (45:55, v/v)
- For gradient methods: Program from acetonitrile:phosphate buffer (30:70) to (80:20) over 7 minutes
- Filter through 0.2 μm membrane and degas before use
Chromatographic Conditions:
- Column temperature: 40°C
- Flow rate: 0.4 mL/min
- Injection volume: 5 μL
- Detection: DAD monitoring 190-400 nm with specific monitoring at compound λmax
- Run time: 3-5 minutes (UFLC) vs. 10-15 minutes (conventional HPLC)
System Suitability Tests:
- Retention time reproducibility (%RSD < 1%)
- Peak asymmetry factor (0.8-1.5)
- Theoretical plates (>5000 per column)
- Resolution between critical pairs (>1.5)
Analysis Procedure:
- Inject blank (mobile phase) to confirm system cleanliness.
- Inject standard solutions to establish retention times and calibration.
- Inject sample solutions.
- Process data: quantify against calibration curve, check peak purity, and compare spectra against standards.
Confirmation Criteria:
- Retention time match with standard (±2%)
- Spectral match (purity angle < purity threshold)
- Signal-to-noise ratio for quantification (>10:1)
Table 2: Research Reagent Solutions for Combined UV-Vis and UFLC-DAD Analysis
| Reagent/Material | Specification | Primary Function | Application Notes |
|---|---|---|---|
| Acetonitrile | HPLC Grade | Mobile phase component | Better UV transparency than methanol for low UV detection |
| Methanol | HPLC Grade | Solvent for standards and samples | Suitable for most chromophoric compounds |
| Potassium Dihydrogen Orthophosphate | Analytical Grade | Buffer component for mobile phase | Maintains pH for reproducible retention; use 15-50 mM |
| Formic Acid | LC-MS Grade | Mobile phase additive | Improves peak shape in positive ion mode; typically 0.1% |
| C18 Column | Sub-2 μm particles | Stationary phase for UFLC | Provides high-resolution separation with core-shell technology |
| Reference Standards | Certified Purity >98% | Method calibration and identification | Essential for quantitative accuracy and peak identification |
Data Interpretation and Analysis
Correlation of UV-Vis and UFLC-DAD Results
The effective integration of UV-Vis screening with UFLC-DAD confirmation requires systematic correlation of data from both techniques. In ideal circumstances where no interferences are present, the quantitative results from UV-Vis and UFLC-DAD should demonstrate strong correlation, typically with a slope of 1.0 ± 0.1 in a correlation plot and a coefficient of determination (r²) exceeding 0.98. Discrepancies between the two methods often indicate potential issues that require investigation.
When UV-Vis results are higher than UFLC-DAD results, this typically suggests the presence of interfering compounds that co-absorb with the analyte in the UV-Vis measurement but are separated in the chromatographic system. Conversely, when UFLC-DAD results exceed UV-Vis measurements, this may indicate sample decomposition during the chromatographic process, ionization suppression/enhancement effects, or errors in standard preparation for one technique.
Statistical approaches for method comparison include Bland-Altman plots to assess bias between methods, paired t-tests to evaluate significant differences (p < 0.05 indicating significant difference), and calculation of relative standard deviation between methods. For regulatory applications, acceptance criteria typically require that the difference between methods does not exceed 2.0% for active pharmaceutical ingredients [18].
Advanced Data Analysis Techniques
Multivariate analysis techniques enhance the utility of data generated from both UV-Vis and UFLC-DAD. Principal Component Analysis (PCA) can be applied to UV-Vis spectral data to classify samples and identify outliers, while Partial Least Squares (PLS) regression can correlate spectral features with reference values to develop predictive models [21]. For example, in wine age prediction research, UV-Vis spectra combined with PLS regression achieved prediction errors as low as 0.8 years, demonstrating the power of multivariate analysis of spectral data [21].
For UFLC-DAD data, advanced chemometric approaches include multivariate curve resolution-alternating least squares (MCR-ALS) for deconvoluting co-eluting peaks, and parallel factor analysis (PARAFAC) for analyzing three-way data (retention time × wavelength × sample). These techniques can extract valuable information even from imperfectly separated peaks, extending the utility of the chromatographic data.
Diagram 2: Data Analysis Workflow for Combined Technique Approach. This workflow illustrates the systematic process for analyzing and correlating data from UV-Vis screening and UFLC-DAD confirmation.
The strategic combination of UV-Vis spectroscopy for rapid screening and UFLC-DAD for confirmatory analysis represents an optimized approach for modern analytical laboratories, particularly in pharmaceutical research and quality control. This methodology successfully balances the competing demands of efficiency and specificity, allowing laboratories to maintain high throughput without compromising data quality. The implementation of this complementary approach, supported by the decision framework and standardized protocols outlined in this guide, enables researchers to make informed decisions about technique selection based on specific sample characteristics and analytical requirements.
As analytical technologies continue to evolve, the integration of these techniques is likely to become more seamless, with automated data transfer and intelligent systems that can automatically flag discrepancies between screening and confirmation results. Furthermore, the incorporation of multivariate analysis and machine learning algorithms will enhance the predictive capability of initial screening methods, potentially reducing the need for confirmatory analysis in routine applications. Nevertheless, the fundamental principle demonstrated by this combined approach remains valid: effective analytical strategy often involves leveraging the complementary strengths of multiple techniques to achieve comprehensive characterization while optimizing resource utilization.
Ensuring Data Integrity: Method Validation and Strategic Comparison
In pharmaceutical research and drug development, the reliability of analytical data is the cornerstone of quality control, regulatory approval, and ultimately, patient safety. Whether developing a method for a novel drug substance or for routine quality control, demonstrating that an analytical procedure is fit for its intended purpose is a mandatory and rigorous process. This process, known as analytical method validation, provides documented evidence that a method consistently meets the predefined acceptance criteria for its key performance characteristics. For researchers selecting between techniques like UV-Visible spectrophotometry and more advanced methods such as UFLC-DAD, understanding these core validation parameters is critical.
The International Council for Harmonisation (ICH) provides the globally recognized framework for this validation through its Q2(R2) guideline, which outlines the fundamental parameters required to prove a method's reliability [63] [64]. This technical guide provides an in-depth exploration of the six key validation parameters—Specificity, Linearity, LOD, LOQ, Precision, and Accuracy—within the context of modern analytical practices. It is designed to equip researchers and drug development professionals with the knowledge to effectively validate their methods and make informed choices in analytical technique selection.
Core Principles of Analytical Method Validation
Analytical method validation is not a mere regulatory checkbox but a fundamental scientific exercise that ensures the integrity of data used to make critical decisions about drug quality. The ICH Q2(R2) guideline serves as the primary global standard, defining the validation criteria for analytical procedures used in the release and stability testing of commercial drug substances and products [63]. The U.S. Food and Drug Administration (FDA) and other regulatory authorities have adopted this guideline, making compliance essential for regulatory submissions [65] [64].
A significant modern shift in the validation landscape, underscored by the simultaneous issuance of ICH Q2(R2) and ICH Q14 (Analytical Procedure Development), is the move towards a lifecycle approach. This approach integrates method development with validation, advocating for proactive planning through an Analytical Target Profile—a prospective summary of the method's required performance characteristics [64]. This ensures that quality is built into the method from the outset, facilitating a more efficient, science-based, and risk-based validation process.
The Six Key Validation Parameters
Specificity
Specificity is the ability of an analytical procedure to assess the analyte unequivocally in the presence of other components that may be expected to be present. This includes impurities, degradation products, matrix components, and excipients [64]. It is a measure of the method's selectivity and is paramount for proving that the measured signal is indeed from the analyte of interest.
Experimental Protocols: For UV-Vis Spectrophotometry, specificity is often demonstrated by comparing the spectra of the pure analyte with samples containing potential interferents. For example, in a study quantifying oxytetracycline, the identity of the analyte was confirmed by comparing its UV spectrum to that of a reference standard, ensuring the spectra were stackable and the absorbance maximum at 268 nm was unaffected by the sample matrix [66]. In chromatographic methods like UFLC-DAD, specificity is assessed by verifying that the analyte peak is baseline-separated from other peaks and that the peak purity index, determined by the DAD, confirms a homogeneous peak.
Linearity and Range
Linearity defines the ability of the method to obtain test results that are directly proportional to the concentration of the analyte in a given range. The range is the interval between the upper and lower concentrations for which the method has demonstrated suitable levels of linearity, accuracy, and precision [64].
Experimental Protocols: Linearity is established by preparing and analyzing a series of standard solutions at a minimum of five concentration levels. The data is processed using linear regression analysis, which yields the slope, intercept, and correlation coefficient (r²). A high correlation coefficient (typically r² > 0.999 for chromatographic methods) indicates good linearity. For instance, a UV method for terbinafine hydrochloride demonstrated excellent linearity (r² = 0.999) over a range of 5–30 μg/mL [26], while a method for saxagliptin showed a linear response from 2–10 μg/mL [67].
Limit of Detection (LOD) and Limit of Quantification (LOQ)
The Limit of Detection (LOD) is the lowest amount of analyte in a sample that can be detected, but not necessarily quantified, under the stated experimental conditions. The Limit of Quantification (LOQ) is the lowest amount of analyte that can be quantitatively determined with acceptable accuracy and precision [26] [64].
Experimental Protocols: LOD and LOQ can be determined based on the standard deviation of the response and the slope of the calibration curve. The formulas are:
- LOD = 3.3 × σ / S
- LOQ = 10 × σ / S Where σ is the standard deviation of the blank or the response of low-concentration samples, and S is the slope of the calibration curve [26] [67]. In a UV method for terbinafine hydrochloride, the LOD and LOQ were found to be 0.42 μg and 1.30 μg, respectively [26].
Precision
Precision expresses the closeness of agreement between a series of measurements obtained from multiple sampling of the same homogeneous sample under the prescribed conditions. It is typically investigated at three levels [64]:
- Repeatability (intra-assay precision): Precision under the same operating conditions over a short interval of time.
- Intermediate precision: Precision within the same laboratory, incorporating variations like different days, different analysts, or different equipment.
- Reproducibility (inter-laboratory precision).
Experimental Protocols: Precision is expressed as the relative standard deviation (%RSD). A method is considered precise if the %RSD is below an acceptable threshold, often 2% for repeatability. For example, in the oxytetracycline study, the method was found to be repeatable with intermediate precision, with %RSD values lower than 2% and 4%, respectively [66]. Similarly, a UV method for terbinafine hydrochloride showed intraday and interday %RSD values of less than 2% [26].
Accuracy
Accuracy expresses the closeness of agreement between the value which is accepted as a conventional true value or an accepted reference value and the value found [64]. It is a measure of how close the test results are to the true value and is often reported as a percentage recovery.
Experimental Protocols: Accuracy is usually assessed by analyzing a sample of known concentration (e.g., a reference standard) or by performing a recovery study. In a recovery study, a known amount of pure analyte is spiked into a placebo or a pre-analyzed sample at multiple levels (e.g., 80%, 100%, 120%), and the resulting mixture is analyzed. The recovery percentage is calculated by comparing the measured value to the known added amount. The oxytetracycline method demonstrated excellent accuracy, with an absolute bias within a tolerable interval of ±2% [66]. Another study on terbinafine hydrochloride reported recovery values in the range of 98.54–99.98% [26].
The following diagram illustrates the logical relationship and workflow between these six key validation parameters:
Relationship Between Key Validation Parameters
Comparative Data and Application
The following tables summarize typical experimental data and acceptance criteria for these parameters, drawing from real-world research examples.
Table 1: Summary of Key Validation Parameters from Cited Studies
| Parameter | Drug Substance | Experimental Details | Results & Acceptance Criteria | Citation |
|---|---|---|---|---|
| Specificity | Oxytetracycline | Comparison of UV spectra of reference standard and sample in matrix. | Stackable spectra with λmax at 268 nm confirmed identity. | [66] |
| Linearity | Terbinafine HCl | Concentration range: 5–30 μg/mL. | Regression equation: Y = 0.0343X + 0.0294; r² = 0.999. | [26] |
| LOD & LOQ | Terbinafine HCl | Calculated via LOD=3.3σ/S, LOQ=10σ/S. | LOD = 0.42 μg, LOQ = 1.30 μg. | [26] |
| Precision | Oxytetracycline | Repeatability and intermediate precision. | %RSD < 2% (repeatable), < 4% (intermediate). | [66] |
| Accuracy | Terbinafine HCl | Recovery at 80%, 100%, 120% levels. | %Recovery range: 98.54% - 99.98%. | [26] |
Table 2: Typical Acceptance Criteria for a Quantitative UV-Vis Method
| Parameter | Typical Acceptance Criteria |
|---|---|
| Specificity | No interference from blank, placebo, or degradation products at the analyte's λmax. |
| Linearity | Correlation coefficient (r²) ≥ 0.995. |
| Precision (Repeatability) | Relative Standard Deviation (%RSD) ≤ 2.0%. |
| Accuracy | Mean Recovery: 98.0% - 102.0%. |
The Scientist's Toolkit: Essential Research Reagents and Materials
The following table details key reagents, materials, and instrumentation essential for developing and validating analytical methods, particularly for UV-Vis spectrophotometry.
Table 3: Essential Research Reagents and Materials
| Item | Function & Importance | Example from Research |
|---|---|---|
| Reference Standard | Highly characterized substance used as a benchmark for quantifying the analyte and verifying method accuracy. | Oxytetracycline RS was used to prepare calibration standards [66]. |
| Spectrophotometer | Instrument used to measure the absorption of light by the analyte; double-beam instruments offer higher stability. | GENESYS 10S UV-Vis and Agilent 8453 spectrophotometers were used [66]. |
| Analytical Balance | Precisely weighs small quantities of analyte and standards; critical for preparing accurate stock solutions. | Gram FV-220C analytical balance was used for weighing [66]. |
| Volumetric Glassware | Flasks and pipettes used to prepare solutions of precise concentrations, ensuring accuracy and linearity. | Used for preparing stock, calibration, and validation standards [66] [26]. |
| Suitable Solvent | Dissolves the analyte without interfering at the wavelength of analysis; often specified in pharmacopeias. | 0.01 N HCl was used as a solvent for oxytetracycline [66]. Water was used for terbinafine HCl [26]. |
| pH Meter | Used to adjust and control the pH of the solvent or mobile phase, which can critical for analyte stability and signal. | A HANNA pH meter was used in the oxytetracycline study [66]. |
The rigorous assessment of specificity, linearity, LOD, LOQ, precision, and accuracy forms the bedrock of a trustworthy analytical method. As outlined in the ICH Q2(R2) guideline, these parameters provide comprehensive evidence that a method is fit for its purpose, whether for quality control of a commercial product or supporting groundbreaking academic research. The evolving regulatory landscape, with its emphasis on a science- and risk-based lifecycle approach, challenges researchers to think more deeply about their analytical procedures from development through validation. By mastering these key validation parameters and applying them with a critical and thorough understanding, scientists can ensure the generation of reliable, high-quality data that advances both scientific knowledge and public health.
Applying ICH Q2(R2) Guidelines for UV-Vis and UFLC-DAD Methods
The selection of an appropriate analytical technique is a critical decision in pharmaceutical development, balancing factors such as analytical performance, cost, efficiency, and environmental impact. This technical guide examines the application of ICH Q2(R2) guidelines for validating Ultraviolet-Visible (UV-Vis) spectrophotometry and Ultra-Fast Liquid Chromatography with Diode Array Detection (UFLC-DAD) methods. The International Council for Harmonisation (ICH) formally adopted the Q2(R2) guideline in November 2023, providing updated guidance for validating analytical procedures [68]. Concurrently, ICH Q14 offers comprehensive guidance on analytical procedure development, creating a cohesive framework for the entire analytical lifecycle [69]. Understanding the validation requirements and performance characteristics of both UV-Vis and UFLC-DAD methods enables researchers, scientists, and drug development professionals to make informed decisions when selecting analytical techniques for specific applications, particularly in quality control environments for chromophoric compounds [35] [12].
Fundamental Principles of UV-Vis and UFLC-DAD Detection
UV-Visible Spectrophotometry
UV-Vis detectors are among the most commonly used detectors in liquid chromatography due to their reliability, ease of use, and universal response to chromophoric compounds [13] [12]. These detectors operate on the Beer-Lambert Law, which states that absorbance (A) is proportional to the product of the molar absorptivity (ε), pathlength (b), and analyte concentration (c) [12]. They measure the absorption of ultraviolet or visible light by components of an eluted mixture as they pass through a flow cell [70]. The maximum absorbance wavelength (λmax) is a characteristic property of chromophoric molecules and is typically used as the monitoring wavelength in HPLC for both quantitation and identification [12]. Key limitations include the requirement that analytes must contain chromophores and that the mobile phase must be optically transparent in the selected wavelength range [12].
Diode Array Detection in UFLC Systems
Diode Array Detectors (DAD), also known as Photodiode Array Detectors (PDA), represent a more advanced detection system that monitors the entire UV-Vis spectrum of material passing through the flow cell [12]. Unlike variable wavelength detectors that use a monochromator to select a specific wavelength, DADs utilize an array of photodiodes (typically 512 or 1024 pixels) to capture absorbance data across a broad spectrum simultaneously [12]. This capability provides both chromatographic and spectral data, enabling peak purity assessments and compound identification through spectral matching [12]. Modern UFLC-DAD systems offer significant advantages over conventional HPLC, including shorter analysis times, increased peak capacity, and reduced consumption of samples and solvents [35].
Diagram 1: Analytical Method Selection Workflow. This decision flowchart outlines the key considerations when selecting between UV-Vis and UFLC-DAD methodologies, including analyte properties, matrix complexity, and resource constraints.
ICH Q2(R2) Validation Framework: Key Parameters and Requirements
The ICH Q2(R2) guideline provides a comprehensive framework for validating analytical procedures, with specific considerations for different analytical techniques [63] [69]. The updated guideline emphasizes an Analytical Procedure Lifecycle approach and introduces more detailed requirements for various validation parameters [69] [68]. Training materials released by ICH in July 2025 illustrate both minimal and enhanced approaches to analytical development and validation, providing practical guidance for implementation [69].
Core Validation Parameters
Table 1: Key Validation Parameters as per ICH Q2(R2) and Their Application to UV-Vis and UFLC-DAD
| Validation Parameter | ICH Q2(R2) Requirement | UV-Vis Application | UFLC-DAD Application |
|---|---|---|---|
| Accuracy | Closeness between measured value and true value | Assessed via spike recovery; typically 98-102% for pharmaceuticals [12] | Similar accuracy requirements; evaluated through standard addition methods |
| Precision | Closeness of agreement between series of measurements | Demonstrated with RSD <0.2% for pharmaceutical QC [12] | Includes system, method, and intermediate precision; RSD typically <1% |
| Specificity | Ability to assess analyte unequivocally in presence of interferences | Limited for complex mixtures; suitable for pure compounds [35] | High specificity from separation + spectral data; peak purity assessment [12] |
| Linearity | Ability to obtain results proportional to analyte concentration | Linear range typically narrower; e.g., 8-12 μg/mL for MET [35] | Wider linear dynamic range; demonstrated via calibration curves |
| Range | Interval between upper and lower concentration levels | Limited concentration range due to Beer-Lambert deviation | Extended range suitable for impurity and assay determination |
| LOD/LOQ | Detection and quantification limits | Higher limits; suitable for major component analysis [35] | Lower LOD/LOQ; suitable for trace analysis and impurity detection |
| Robustness | Resistance to deliberate, small parameter variations | Evaluated against wavelength, dilution variations [35] | Assessed for flow rate, mobile phase pH, column temperature variations [9] |
Experimental Design and Method Validation Protocols
Sample Preparation and Handling
Proper sample preparation is critical for both UV-Vis and UFLC-DAD methods. For the analysis of metoprolol tartrate (MET) tablets, researchers prepared standard solutions by dissolving appropriate masses of MET reference standard in ultrapure water [35]. All solutions were protected from light and stored in dark places to prevent degradation [35]. For UFLC-DAD analysis, method optimization preceded formal validation, with careful attention to mobile phase composition, pH adjustment, and column selection [35] [9]. In the development of methods for guanylhydrazones, researchers employed factorial design to optimize chromatographic conditions, evaluating factors such as temperature, mobile phase composition, pH, and column length simultaneously [9].
UFLC-DAD Method Optimization
The UFLC-DAD method development typically begins with mobile phase selection. For MET analysis, absorbance was recorded at the maximum absorption wavelength (λ = 223 nm) [35]. For guanylhydrazones analysis, researchers selected a mobile phase consisting of pH 3.5 methanol-water (60:40 v/v), with acetic acid added as a modifier to improve peak symmetry and resolution [9]. The optimal detection wavelength was determined to be 290 nm based on multidimensional UV absorption spectra [9]. The advent of UFLC provides shorter analysis times, increased peak capacity, and significantly reduced consumption of samples and solvents compared to conventional HPLC [35].
Validation Experimental Protocols
Specificity/Selectivity Assessment
For UFLC-DAD methods, specificity was demonstrated through peak purity tests using spectral analysis [35] [12]. Retention times were 2.18, 2.64, and 5.08 minutes for LQM17, LQM14, and LQM10 guanylhydrazones, respectively, with no interference observed between compounds [9]. Similarity indexes exceeding 950 confirmed the absence of coelution [9]. For UV-Vis methods, specificity was assessed by comparing spectra of standard and sample solutions, though this approach has limitations in complex matrices [35].
Linearity and Range Evaluation
Linearity was established by analyzing at least five concentration levels in triplicate [35]. For MET analysis using UFLC-DAD, excellent linearity was achieved with correlation coefficients (r²) of 0.999 or better [35]. The calibration curve was constructed by plotting peak area against concentration, with acceptance criteria requiring a correlation coefficient ≥0.999 [35] [9].
Precision and Accuracy Studies
Precision was evaluated through both intra-day and inter-day studies with six replicates each [35] [9]. For MET analysis, precision results demonstrated RSD values below 2.0% for both methods [35]. Accuracy was assessed through spike recovery experiments at multiple concentration levels (e.g., 8, 10, and 12 μg/mL), with recovery percentages typically between 98-102% [35] [9].
Diagram 2: Analytical Method Validation Process. This workflow illustrates the key stages in validating analytical methods according to ICH Q2(R2), highlighting the relationship with method development activities outlined in ICH Q14.
Comparative Analysis: UV-Vis vs. UFLC-DAD Performance
Performance Metrics and Practical Considerations
Table 2: Comparative Performance of UV-Vis and UFLC-DAD for Pharmaceutical Analysis
| Performance Characteristic | UV-Vis Spectrophotometry | UFLC-DAD |
|---|---|---|
| Analysis Time | Faster (single measurement) | Longer (separation required) |
| Equipment Cost | Lower initial and maintenance costs | Significantly higher investment |
| Solvent Consumption | Lower volume per sample | Higher, but reduced vs. conventional HPLC [35] |
| Sample Throughput | High for routine analysis | Moderate, but increasing with UHPLC technologies |
| Operator Skill Required | Basic technical training | Advanced chromatographic expertise |
| Greenness Score (AGREE) | Generally higher [35] | Lower due to solvent consumption |
| Sensitivity | Limited by Beer-Lambert law | High sensitivity with pathlength optimization |
| Specificity for Complex Mixtures | Limited without separation [35] | Excellent with dual separation/spectral identification |
| Matrix Effect Susceptibility | High interference potential | Reduced through chromatographic separation |
| Information Content | Single wavelength or spectrum | Retention time + full UV spectrum for each peak |
Application-Based Method Selection
The choice between UV-Vis and UFLC-DAD methods depends heavily on the specific application requirements. For quality control of simple formulations with no interfering compounds, UV-Vis spectrophotometry offers a cost-effective, rapid solution [35]. For instance, in the analysis of MET tablets, researchers concluded that quality control could be effectively monitored using UV-Vis rather than UFLC, with significant cost savings and environmental benefits [35]. However, for complex mixtures, stability-indicating methods, or when peak purity assessment is required, UFLC-DAD provides superior performance despite higher operational complexity and cost [35] [12].
The Scientist's Toolkit: Essential Reagents and Materials
Table 3: Essential Research Reagents and Materials for UV-Vis and UFLC-DAD Analysis
| Item | Function/Purpose | Technical Specifications |
|---|---|---|
| Reference Standards | Quantification and method calibration | Certified purity ≥98% [35] |
| HPLC-Grade Solvents | Mobile phase preparation | Low UV cutoff, high purity to reduce background noise |
| Ultrapure Water | Solvent for aqueous mobile phases and standards | 18.2 MΩ·cm resistivity, filtered through 0.22 μm membrane |
| Acid Modifiers | Mobile phase pH adjustment | e.g., Trifluoroacetic acid, Phosphoric acid, Acetic acid [9] |
| UFLC Columns | Chromatographic separation | C18 stationary phase, sub-2μm particles for UHPLC [9] |
| Syringe Filters | Sample clarification | 0.22 μm or 0.45 μm pore size, compatible with organic solvents |
| Volumetric Glassware | Precise solution preparation | Class A precision for standard and sample preparation |
| UV Cuvettes/Flow Cells | Containment for sample measurement | Quartz with 10 mm pathlength; minimal dead volume for UFLC [12] |
Implementation Strategy and Compliance Considerations
Implementing ICH Q2(R2) compliant methods requires a systematic approach that considers the entire analytical procedure lifecycle. Regulatory authorities have officially incorporated Q2(R2) and Q14, with many others in the process of adoption [68]. A gap analysis toolkit has been proposed to streamline risk assessment and change management efforts when updating systems from the previous Q2(R1) guidance [68]. This toolkit identifies 56 specific omissions, expansions, and additions in Q2(R2) and provides a process for navigating these changes [68].
When implementing analytical methods under Q2(R2), laboratories should consider both minimal and enhanced approaches to analytical development and validation [69]. The enhanced approach incorporates more systematic method development and understanding, facilitated by risk assessment and prior knowledge [69]. For both UV-Vis and UFLC-DAD methods, establishing an Analytical Target Profile (ATP) is recommended, defining the required performance characteristics of the method based on its intended purpose [69] [71].
The application of ICH Q2(R2) guidelines to both UV-Vis and UFLC-DAD methods provides a robust framework for ensuring analytical procedure validity throughout their lifecycle. UV-Vis spectrophotometry offers advantages in simplicity, cost-effectiveness, and environmental friendliness for appropriate applications, while UFLC-DAD provides superior separation power, specificity, and information content for complex analyses. The choice between these techniques should be guided by a thorough understanding of the analytical requirements, sample characteristics, and regulatory expectations. By applying the principles outlined in this guide and leveraging the latest ICH Q2(R2) and Q14 guidelines, researchers and drug development professionals can select, develop, and validate appropriate methods that are fit for their intended purpose in pharmaceutical analysis.
The selection of an appropriate analytical technique is a critical decision in drug development and research. Ultraviolet-Visible spectroscopy (UV-Vis) and Ultra-Fast Liquid Chromatography with Diode Array Detection (UFLC-DAD) represent two fundamentally different approaches for quantification and analysis. UV-Vis is a straightforward spectrophotometric method that measures the absorption of light by analytes in solution, while UFLC-DAD is a sophisticated separation-based technique that combines chromatographic separation with full spectral verification. This technical guide provides an in-depth comparison of these methodologies across key parameters including analysis time, cost, sensitivity, and selectivity, framed within the context of optimizing analytical workflows in pharmaceutical settings. The objective is to deliver a structured framework that enables researchers, scientists, and drug development professionals to make informed, evidence-based decisions tailored to their specific project requirements, whether for rapid quality control or definitive compound identification and quantification.
Fundamental Principles and Instrumentation
UV-Visible Spectroscopy (UV-Vis)
UV-Vis spectroscopy operates on the principle of the Beer-Lambert law, which states that the absorbance of light by a solution is directly proportional to the concentration of the absorbing species and the path length of the light through the solution [12]. When a molecule absorbs ultraviolet or visible light, its electrons are excited from a ground state to a higher energy molecular orbital, producing a characteristic absorption spectrum [72]. The technique utilizes a deuterium light source for the UV range, a monochromator to select specific wavelengths, and a photodiode detector to measure the intensity of transmitted light after it passes through the sample cuvette [12]. This simple optical arrangement facilitates rapid, cost-effective quantification of chromophoric compounds in solution, making it ideal for routine quantitative analysis where sample composition is well-understood and interferences are minimal.
Ultra-Fast Liquid Chromatography with Diode Array Detection (UFLC-DAD)
UFLC-DAD represents a significant advancement in liquid chromatography, combining high-speed separation with comprehensive spectral detection. The system employs high-pressure pumps to force the mobile phase and sample through a tightly packed column, where separation occurs based on differential partitioning between the mobile and stationary phases [35]. The critical differentiator of DAD from conventional UV detectors is its ability to capture the entire UV-Vis spectrum (typically 190-400 nm or wider) for each eluting compound in real-time using an array of hundreds of photodiodes [10] [12]. Unlike a standard UV detector that measures at a single, fixed wavelength, the DAD simultaneously captures data across all wavelengths, enabling post-run analysis at any wavelength, peak purity assessment, and spectral confirmation of identity [23] [10]. This hyphenated technique provides a two-dimensional data matrix (retention time and absorbance spectrum) for enhanced specificity in complex mixtures.
Comparative Performance Analysis
Direct Comparison of Key Analytical Parameters
The choice between UV-Vis and UFLC-DAD involves balancing multiple performance characteristics against analytical requirements and resource constraints. The following table summarizes a direct comparison across critical parameters based on experimental data and technical specifications.
Table 1: Head-to-Head Comparison of UV-Vis and UFLC-DAD Analytical Characteristics
| Parameter | UV-Vis Spectroscopy | UFLC-DAD |
|---|---|---|
| Analysis Time | Very rapid (minutes per sample) | Longer (10-30 minutes per run) |
| Cost | Low initial investment and operating costs; environmentally friendly with minimal solvent use [35] [40] | High initial investment; significant ongoing costs for columns and solvents [35] |
| Sensitivity | Variable; can be insufficient for trace analysis in complex matrices [35] | Excellent; capable of detecting low μg/ml concentrations with high precision [25] |
| Selectivity | Low; susceptible to interference from other absorbing compounds [35] | High; physical separation combined with spectral verification provides superior specificity [35] [10] |
| Sample Throughput | High for direct measurements | Moderate; limited by chromatographic run times |
| Linear Dynamic Range | Can be limited at higher concentrations [35] | Wide linear range (e.g., 0.05-300 μg/ml for Levofloxacin) [25] |
| Multi-Component Analysis | Limited without chemometrics | Excellent; capable of resolving and quantifying multiple analytes simultaneously |
| Peak Purity Assessment | Not available | Built-in capability; compares spectra across a peak to detect co-elution [10] [12] |
| Regulatory Acceptance | Suitable for well-defined quality control applications | Preferred for regulatory submissions requiring compound identification |
Experimental Evidence and Validation Data
Comparative studies provide quantitative evidence for the performance differences between these techniques. In one investigation comparing the quantification of metoprolol tartrate (MET) in pharmaceuticals, both methods demonstrated adequate validation parameters, but with distinct limitations. The UV-Vis method offered simplicity, precision, and low cost but had limitations regarding sample volume and the detection of higher concentrations. In contrast, the optimized UFLC-DAD procedure provided advantages in speed and simplicity for the chromatographic approach, along with superior specificity [35].
A particularly revealing study on levofloxacin quantification demonstrated significant accuracy differences between the techniques. While both methods showed excellent linearity (R²=0.9991 for HPLC vs. R²=0.9999 for UV-Vis), the recovery rates revealed UV-Vis limitations in complex matrices. For medium concentrations (25 μg/ml) of levofloxacin, HPLC showed recovery of 110.96±0.23% compared to 99.50±0.00% for UV-Vis. More importantly, when the drug was loaded onto biodegradable composite scaffolds, the study concluded that "it is not accurate to measure the concentration of drugs loaded on the biodegradable composites by UV-Vis" due to impurity interference, establishing HPLC (and by extension UFLC-DAD) as the preferred method for evaluating sustained release characteristics from delivery systems [25].
The selectivity advantage of DAD detection was highlighted in DNA quantification studies, where fluorometry was proven more accurate than UV-Vis spectrophotometry regardless of the source. Statistically significant differences were observed between data obtained from UV-Vis spectrophotometry and fluorometry, with UV-Vis consistently overestimating DNA quantities, particularly in complex samples like FFPE tissues and FNAC smears [73]. This systematic overestimation by UV-Vis systems underscores their vulnerability to interference from other absorbing substances, a limitation effectively mitigated by the separation power of UFLC-DAD.
Experimental Protocols and Methodologies
Standard UV-Vis Quantification Protocol for Pharmaceuticals
The following protocol for quantifying active pharmaceutical ingredients (APIs) using UV-Vis spectroscopy has been validated for compounds with strong chromophores and minimal excipient interference [35] [40]:
Instrument Calibration: Power on the UV-Vis spectrophotometer and allow the deuterium lamp to warm up for 15-30 minutes. Perform baseline correction with an appropriate blank solution (typically the same solvent used for sample preparation).
Wavelength Selection: Identify the maximum absorption wavelength (λmax) of the target compound by scanning a standard solution across the UV range (typically 200-400 nm). For metoprolol tartrate, this was determined to be 223 nm [35].
Standard Solution Preparation: Precisely weigh the reference standard of the API and prepare a stock solution. Prepare a series of standard solutions covering the expected concentration range of the samples through serial dilution. For levofloxacin quantification, the linear range was established from 0.05-300 μg/ml [25].
Calibration Curve Construction: Measure the absorbance of each standard solution at the predetermined λmax. Plot absorbance versus concentration and determine the regression equation. A correlation coefficient (R²) of ≥0.999 is typically expected for validated methods [35].
Sample Preparation: For solid formulations, accurately weigh and powder not less than 20 tablets. Extract a quantity of the powder equivalent to one tablet into an appropriate solvent with sonication and filtration if necessary. For liquid formulations, dilute directly or after extraction as needed.
Absorbance Measurement: Measure the absorbance of the prepared sample solution against the blank. Ensure the absorbance falls within the linear range of the calibration curve; if not, adjust dilution accordingly.
Calculation: Calculate the API concentration using the regression equation from the calibration curve. Account for all dilution factors in the final calculation.
Standard UFLC-DAD Analysis Protocol for Pharmaceutical Compounds
This protocol outlines the general steps for quantifying APIs in complex formulations using UFLC-DAD, as applied in the analysis of metoprolol tartrate and levofloxacin [35] [25]:
Chromatographic Conditions Optimization:
- Column: Select an appropriate reverse-phase column (e.g., C18, 150-250 mm × 4.6 mm, 5 μm particle size)
- Mobile Phase: Optimize composition based on analyte polarity; for metoprolol tartrate, a mixture of phosphate buffer and methanol or acetonitrile is typical
- Flow Rate: 0.5-1.5 mL/min depending on column dimensions and pressure limitations
- Column Temperature: 30-40°C
- Injection Volume: 5-20 μL
- DAD Parameters: Set acquisition range to 200-400 nm; select monitoring wavelength based on analyte spectrum; for levofloxacin, 290 nm was used [25]
System Suitability Testing: Before sample analysis, inject standard solutions to confirm resolution, peak symmetry, retention time reproducibility, and sensitivity meet acceptance criteria.
Standard Solution Preparation: Prepare a stock solution of the reference standard at approximately 1 mg/mL. Prepare a series of working standard solutions by appropriate dilution to span the expected concentration range.
Calibration Curve Construction: Inject each standard solution in triplicate. Plot peak area versus concentration and determine the regression statistics. The method should demonstrate linearity with R² ≥ 0.999.
Sample Preparation: For tablets, weigh and powder not less than 20 units. Transfer an accurately weighed portion of the powder equivalent to one tablet to a volumetric flask. Add approximately 70% of the diluent (typically mobile phase or suitable solvent), sonicate for 10-30 minutes with intermittent shaking, cool, and dilute to volume. Filter through a 0.45 μm membrane filter before injection.
Chromatographic Analysis: Inject the prepared sample solutions and monitor the chromatogram. Identify the target peak based on retention time matching with the standard and confirm by spectral comparison using the DAD.
Peak Purity Assessment: For critical applications, apply the instrument's peak purity algorithm to compare spectra at the upslope, apex, and downslope of the peak to detect potential co-elution.
Calculation: Calculate the API content in the sample using the peak area and the regression equation from the calibration curve, accounting for all dilution factors.
Workflow Visualization
The fundamental difference between UV-Vis and UFLC-DAD analyses can be visualized through their distinct experimental workflows, from sample preparation to data interpretation. The following diagram illustrates the sequential steps for each technique, highlighting critical decision points and output differences.
Diagram 1: Comparative Workflow of UV-Vis and UFLC-DAD Analyses
The Scientist's Toolkit: Essential Research Reagent Solutions
Successful implementation of either UV-Vis or UFLC-DAD methodologies requires specific reagents and materials optimized for each technique's requirements. The following table details essential components for establishing these analytical methods in a research or quality control setting.
Table 2: Essential Research Reagents and Materials for UV-Vis and UFLC-DAD Analyses
| Item | Function/Purpose | Technical Specifications | Application Notes |
|---|---|---|---|
| HPLC-Grade Methanol | Mobile phase component; sample solvent | Low UV cutoff (<230 nm); high purity with minimal impurities | Essential for UFLC-DAD to reduce background noise; used in UV-Vis for sample preparation |
| HPLC-Grade Acetonitrile | Alternative mobile phase component | Low UV cutoff (<190 nm); different selectivity than methanol | Used in UFLC-DAD for method development; can improve separation efficiency |
| Ammonium Acetate/Formate | Buffer salts for mobile phase | HPLC-grade; volatile for MS compatibility if needed | Maintains consistent pH in UFLC-DAD mobile phase (typically 10-50 mM concentration) |
| Phosphate Buffers | Aqueous mobile phase component; sample solvent | HPLC-grade salts; prepare fresh and filter | Common in UV-Vis sample preparation and as UFLC-DAD mobile phase (non-volatile) |
| Reference Standards | Method calibration and validation | High purity (≥98%); certified reference materials when available | Essential for both techniques; establishes accuracy and quantification basis |
| C18 Reverse-Phase Column | Stationary phase for separation | 50-250 mm length; 2.1-4.6 mm ID; 1.7-5 μm particle size | Core component of UFLC-DAD system; selection depends on required resolution and speed |
| Syringe Filters | Sample clarification | 0.45 μm or 0.22 μm pore size; compatible with organic solvents | Critical for UFLC-DAD to protect column; recommended for UV-Vis with complex samples |
| UV-Transparent Cuvettes | Sample holder for UV-Vis | Quartz for low UV range; methacrylate for >300 nm | Pathlength typically 1 cm; must be matched to instrument requirements |
| Tetrabutylammonium Salts | Ion-pairing reagents | HPLC-grade; can enhance separation of ionizable compounds | Used in UFLC-DAD for challenging separations (e.g., levofloxacin analysis) [25] |
Strategic Selection Guide
Application-Specific Recommendations
The choice between UV-Vis and UFLC-DAD should be guided by specific analytical requirements, sample complexity, and regulatory considerations:
UV-Vis is Recommended For:
- High-throughput quality control of raw materials and finished products with known composition
- Dissolution testing where speed is critical and excipients do not interfere
- Economic analysis with limited budget for instrumentation and maintenance
- Environmental monitoring where high analyte concentrations are expected
- Educational and training laboratories where technique fundamentals are emphasized
UFLC-DAD is Essential For:
- Stability-indicating methods where degradation products must be resolved and quantified
- Complex formulations with multiple active ingredients
- Bioanalytical studies in complex matrices like plasma, serum, or tissue homogenates
- Method development for regulatory submissions requiring complete validation
- Natural product analysis where compound identification is required alongside quantification
- Impurity profiling and peak purity assessment as per ICH guidelines [12]
Emerging Trends and Advanced Applications
The analytical landscape continues to evolve with innovations in both techniques. For UV-Vis, the integration of chemometric approaches like the Net Analyte Signal (NAS) method combined with standard additions has enabled the quantification of active ingredients in solid pharmaceutical formulations without dissolution, representing a significant advancement for Process Analytical Technology (PAT) applications [40]. Similarly, multivariate calibration methods have extended UV-Vis capabilities for resolving overlapping spectral signals in complex mixtures like wines and natural products [21].
In the UFLC-DAD domain, advancements in column chemistry (sub-2μm particles) and system pressure capabilities continue to enhance separation efficiency and reduce analysis times. The development of intelligent Peak Deconvolution and Analysis (i-PDeA) functions, as mentioned in [10], enables mathematical resolution of co-eluting peaks based on their spectral differences, virtually enhancing chromatographic resolution without method redevelopment. Furthermore, the integration of machine learning approaches for UV spectrum prediction from molecular structure alone, as demonstrated by UV-adVISor [72], promises to accelerate method development and compound identification in both techniques.
The strategic selection between UV-Vis and UFLC-DAD represents a critical decision point in analytical method development that significantly impacts data quality, resource allocation, and project timelines. UV-Vis spectroscopy offers compelling advantages in analysis speed, cost-efficiency, and operational simplicity for well-defined applications where selectivity concerns are minimal. Conversely, UFLC-DAD provides unparalleled specificity, sensitivity, and regulatory defensibility for complex separation challenges, albeit with higher operational costs and longer analysis times. The evolving analytical landscape continues to enhance both technologies through chemometric advances, hardware improvements, and computational approaches, expanding their complementary roles in the researcher's toolkit. By applying the systematic comparison framework presented in this technical guide, scientists can make informed, justified selections aligned with their specific analytical requirements, quality standards, and resource constraints.
Evaluating Environmental Impact and Greenness Using AGREE Metrics
The growing emphasis on sustainability has made Green Analytical Chemistry (GAC) an essential discipline for modern laboratories, focusing on minimizing the environmental impact of analytical procedures while maintaining analytical performance [74]. Green analytical chemistry motivates analytical chemists to address health, safety, and environmental issues during analysis, representing a significant shift in how analytical challenges are approached while striving for environmental benignity [74]. Traditional green chemistry metrics like E-Factor or Atom Economy have proven inadequate for assessing analytical chemistry methods, leading to the development of dedicated assessment tools [74]. Among these, the Analytical GREEnness (AGREE) metric has emerged as a comprehensive, user-friendly approach that evaluates analytical procedures against all 12 principles of GAC [75].
The AGREE calculator provides both a unified pictogram and a numerical score between 0 and 1, enhancing interpretability and facilitating direct comparisons between methods [74] [75]. This tool is particularly valuable for researchers and drug development professionals who must select analytical techniques that balance analytical performance with environmental considerations. Within the context of selecting between UV-Vis spectroscopy and Ultra-Fast Liquid Chromatography with Diode Array Detection (UFLC-DAD), AGREE metrics offer a structured framework for evaluating the environmental footprint of each method, supporting more sustainable decision-making in analytical research and development [35].
Fundamentals of AGREE Metrics
The 12 Principles of Green Analytical Chemistry
The AGREE metric system is built upon the 12 SIGNIFICANCE principles of Green Analytical Chemistry, which comprehensively address the environmental impact of analytical methods [75]. These principles cover multiple aspects of analytical procedures, including material requirements, waste generation, energy consumption, analyst safety, and overall procedural approach. The twelve principles emphasize: (1) direct analytical techniques to avoid sample treatment; (2) minimal sample size and number of samples; (3) in-situ measurements; (4) integration of analytical processes and operations; (5) automation and miniaturization of methods; (6) avoidance of derivatization; (7) reduction of energy consumption; (8) use of eco-friendly reagents; (9) waste reduction and proper management; (10) multi-analyte determination; (11) practitioner safety; and (12) elimination of toxic reagents [75].
AGREE Assessment Methodology
The AGREE assessment tool transforms each of the 12 GAC principles into a score on a 0-1 scale through defined calculation methods [75]. The final score is the product of the assessment results for each principle, presented as both a numerical value and a color in a clock-like pictogram [75]. This output allows users to quickly identify both the overall greenness and specific strengths and weaknesses of an analytical method. The tool also incorporates flexible weighting, enabling users to assign different importance to each principle based on their specific analytical context and priorities [75]. For instance, in regulated pharmaceutical environments, principles related to operator safety might be weighted more heavily than in research settings.
The AGREE software is freely available, open-source, and features a user-friendly interface that simplifies the assessment process [75]. Users input data related to each of the 12 principles, and the software automatically generates the characteristic circular pictogram with the overall score displayed in the center and performance for each principle shown in corresponding segments [75]. This visualization immediately communicates whether a method is ideally green (scores approaching 1 with dark green color), acceptable, or poor in terms of environmental impact.
Complementary Green Assessment Tools
While AGREE provides a comprehensive evaluation framework, several complementary metrics have been developed to address specific assessment needs. The AGREEprep metric specializes in evaluating sample preparation steps, which often account for significant environmental impact in analytical methods [76] [74]. Other tools include the National Environmental Methods Index (NEMI) with its simple pictogram-based approach; the Analytical Eco-Scale which assigns penalty points to non-green attributes; the Green Analytical Procedure Index (GAPI) offering a visual assessment of the entire analytical process; and more recent developments like the Carbon Footprint Reduction Index (CaFRI) focusing specifically on climate impact [74] [75]. The 2025 introduction of Analytical Green Star Analysis (AGSA) provides a star-shaped visualization combining intuitive assessment with an integrated scoring system [74]. These tools can be used alongside AGREE to obtain a multidimensional understanding of a method's environmental performance.
Experimental Protocols for Greenness Assessment
Sample Preparation and Method Validation
Proper sample preparation is critical for accurate greenness assessment. Research has demonstrated that sample stability during analysis can significantly impact method sustainability. In studies evaluating phenolic compounds in apple juices, acidification with MeOH containing 1% acetic acid provided significantly better compound stability over 44 hours compared to raw apple juice injection, reducing the need for repeated analyses and associated resource consumption [19]. Such optimization directly supports GAC Principle 9 (waste reduction) by preventing analytical failures and the need for reanalysis.
Method validation parameters must be established before greenness assessment to ensure analytical reliability. Studies comparing UV-Vis and UFLC-DAD methods for pharmaceutical analysis typically validate specificity/selectivity, sensitivity, linearity, dynamic range, detection limit, quantification limit, accuracy, precision, and robustness [35]. For instance, in the determination of metoprolol tartrate (MET) in commercial tablets, both UV-Vis and UFLC-DAD methods were rigorously validated, with the UFLC-DAD method offering advantages in speed and simplicity while the spectrophotometric method provided simplicity, precision, and lower cost [35]. Such validation ensures that greenness comparisons are made between functionally equivalent analytical methods.
Data Collection for AGREE Assessment
Implementing AGREE metrics requires systematic data collection across multiple aspects of the analytical procedure. The following table outlines key parameters and measurement approaches for comprehensive greenness assessment:
Table 1: Data Collection Framework for AGREE Assessment
| Assessment Category | Specific Parameters to Record | Measurement Approach |
|---|---|---|
| Sample Treatment | Number of preparation steps, sample damage extent, analysis type (remote, in-field, on-line, at-line, off-line) | Procedural documentation, workflow analysis |
| Sample Size | Sample mass/volume, number of samples required for statistical significance | Experimental recording, statistical calculation |
| Reagent Consumption | Volumes and masses of all solvents, standards, and chemicals used | Inventory tracking, method documentation |
| Energy Demand | Instrument power ratings, analysis time, standby energy consumption | Power measurement, operational timing |
| Waste Generation | Total waste volume, waste composition, treatment methods applied | Waste tracking, disposal documentation |
| Operator Safety | Toxicity, flammability, corrosivity of all chemicals used; required PPE | Safety Data Sheet review, hazard pictogram count |
AGREE Scoring Protocol
The AGREE calculator transforms the collected data into principle-specific scores using defined algorithms [75]. For example, Principle 1 (direct analytical techniques) employs a scoring table where remote sensing without sample damage receives a perfect score of 1.00, while external sample pre-treatment with numerous steps scores 0.00 [75]. Principle 2 (minimal sample size) uses logarithmic transformations of sample mass or volume to calculate scores, favoring miniaturized approaches [75]. Principle 8 (green reagents) evaluates solvent and chemical choices based on published greenness criteria, with water and ethanol receiving higher scores than chlorinated or toxic solvents [75].
After inputting all data, the software generates the AGREE pictogram, which should be interpreted by considering both the overall score and the performance in individual principles. Methods scoring above 0.75 are generally considered green, those between 0.50-0.75 have moderate greenness, and methods below 0.50 have significant environmental concerns [75]. The color coding (red-yellow-green) of each principle segment quickly identifies specific areas for improvement, enabling targeted method optimization to enhance sustainability.
Application to Analytical Technique Selection: UV-Vis vs. UFLC-DAD
Technical Foundations of UV-Vis and UFLC-DAD
UV-Vis spectroscopy is a widely used analytical technique that measures the absorption of ultraviolet and visible light by chromophoric compounds. The technique operates on the Beer-Lambert Law, which states that absorbance is proportional to the concentration of the absorbing species, path length, and molar absorptivity [12]. UV-Vis instruments typically use a deuterium lamp for UV light and a tungsten lamp for visible light, with a monochromator to select specific wavelengths [12]. The technique is popular due to procedural simplicity, instrument availability, precision, speed, and accuracy [35]. However, limitations include requirements for larger sample volumes in some configurations, difficulties with overlapping absorption bands, and interference from other absorbing compounds [35].
UFLC-DAD combines the separation power of ultra-fast liquid chromatography with the detection capabilities of a diode array detector. UFLC systems operate at higher pressures than conventional HPLC, providing shorter analysis times, increased peak capacity, and reduced consumption of samples and solvents [35]. The DAD detector simultaneously monitors multiple wavelengths across the UV-Vis spectrum, capturing complete spectral information for each chromatographic peak [12]. This enables peak purity assessment, spectral confirmation of compound identity, and method development flexibility [23] [12]. Compared to single-wavelength UV detectors, DAD can reveal co-eluting compounds that might otherwise remain undetected, providing higher confidence in results [23].
Comparative Greenness Assessment Using AGREE
Applying AGREE metrics to UV-Vis and UFLC-DAD methods reveals distinct environmental profiles for each technique. A study comparing these methods for metoprolol tartrate analysis in pharmaceuticals demonstrated that the UV-Vis method generally achieved higher greenness scores due to substantially lower solvent consumption, reduced energy requirements, and minimal waste generation [35]. The simplified sample preparation and direct measurement approach of UV-Vis spectroscopy aligns with multiple GAC principles, particularly Principle 1 (direct analysis), Principle 7 (energy reduction), and Principle 9 (waste minimization).
UFLC-DAD methods, while more resource-intensive, provide superior selectivity for complex mixtures, which can sometimes justify their environmental footprint in specific applications [35]. The technique's main environmental drawbacks include higher solvent consumption, greater energy demand for pumping and separation, and more substantial waste generation [35]. However, method optimization through miniaturization, solvent substitution, and gradient optimization can significantly improve the greenness profile of UFLC-DAD methods. The AGREE assessment helps identify which technique provides the optimal balance of analytical performance and environmental considerations for a given application.
Quantitative Comparison of Environmental Impact
The environmental differences between UV-Vis and UFLC-DAD methods can be quantified across multiple parameters. Research on pharmaceutical analysis demonstrates that UFLC-DAD typically consumes 10-50 times more solvent per analysis than UV-Vis methods [35]. Energy consumption follows a similar pattern, with UFLC systems requiring substantial power for pumping systems, column heating, and detection, while UV-Vis instruments have relatively modest energy demands. Waste generation differences are equally significant, with UFLC-DAD producing mixed organic-aqueous waste streams that require specialized disposal, while UV-Vis primarily generates aqueous solutions that are more easily treated or recycled.
Table 2: Quantitative Environmental Comparison of UV-Vis vs. UFLC-DAD for Pharmaceutical Analysis
| Parameter | UV-Vis Method | UFLC-DAD Method | Greenness Advantage |
|---|---|---|---|
| Solvent Consumption | 1-10 mL per analysis (primarily aqueous) | 50-500 mL per analysis (organic-aqueous mixtures) | UV-Vis |
| Energy Demand | 0.01-0.05 kWh per analysis | 0.5-2.0 kWh per analysis | UV-Vis |
| Waste Generation | 5-15 mL per sample (mostly aqueous) | 50-600 mL per sample (mixed organic-aqueous) | UV-Vis |
| Analysis Time | 1-5 minutes per sample | 10-30 minutes per sample | UV-Vis |
| Multi-analyte Capability | Limited without chemometrics | Excellent separation of multiple compounds | UFLC-DAD |
| Selectivity in Mixtures | Poor to moderate without separation | Excellent with chromatographic separation | UFLC-DAD |
| Method Development | Straightforward, minimal optimization | Complex, requires extensive optimization | UV-Vis |
Case Studies and Research Applications
Pharmaceutical Quality Control Application
A comprehensive study comparing UV-Vis and UFLC-DAD methods for quantifying metoprolol tartrate (MET) in commercial tablets demonstrated the practical implications of greenness assessment in pharmaceutical analysis [35]. The research found that for quality control of tablets containing MET, UV-Vis spectroscopy provided adequate performance with significantly better greenness metrics [35]. The UV-Vis method achieved comparable accuracy and precision for routine analysis while using substantially fewer resources, generating less waste, and having lower energy demands [35]. This case illustrates that for single-analyte determination in formulations where selectivity is not a primary concern, simpler spectroscopic methods may offer sufficient analytical performance with superior environmental profiles.
The AGREE assessment of both methods highlighted specific advantages for UV-Vis in Principles 1 (direct analysis), 7 (energy reduction), and 9 (waste minimization), while UFLC-DAD showed strengths in Principle 10 (multi-analyte capability) and Principle 4 (method integration) [35]. The study concluded that quality control of MET tablets could be effectively monitored using the more cost-effective and environmentally friendly UV-Vis approach rather than UFLC-DAD, without compromising analytical reliability for this specific application [35].
Complex Matrix Analysis
In applications requiring analysis of complex mixtures, the superior selectivity of UFLC-DAD may justify its environmental impact. Research on polyphenol quantification in apple juices demonstrated that chromatographic separation was essential for accurate quantification of individual compounds in complex natural product matrices [19]. The study developed UHPLC methods coupled with both UV-PDA and MS/MS detection, noting that despite higher resource consumption, the chromatographic approach was necessary to address co-elution issues and matrix effects that would compromise direct spectroscopic analysis [19].
This case study illustrates the importance of considering analytical requirements when applying AGREE metrics. While the UHPLC method scored lower on greenness compared to potential direct spectroscopic approaches, it provided the necessary selectivity for the research objectives [19]. The study also highlighted how method optimization, including improved stability through acidified dilution and reduced analysis time through UHPLC, could partially mitigate the environmental impact while maintaining analytical performance [19].
AGREEprep for Sample Preparation Assessment
The evaluation of sample preparation steps using AGREEprep provides crucial insights for improving method sustainability. A assessment of 174 standard methods with sample preparation steps from CEN, ISO, and Pharmacopoeias revealed generally poor greenness performance, with 67% of methods scoring below 0.2 on the AGREEprep scale (where 1 represents the highest possible score) [77]. The worst performance was observed in methods for environmental analysis of organic compounds (86% scoring below 0.2), followed by food analysis (62%), inorganic and trace metals analysis (62%), and pharmaceutical analysis (45%) [77].
These findings highlight that sample preparation remains a significant sustainability challenge in analytical chemistry. The poor scores reflect continued reliance on resource-intensive, outdated techniques that conflict with global sustainability efforts [77]. This assessment serves as a call to action for updating standard methods by incorporating contemporary, greener sample preparation approaches that maintain analytical performance while reducing environmental impact [77].
The Scientist's Toolkit: Research Reagent Solutions
Table 3: Essential Reagents and Materials for Green Analytical Methods
| Reagent/Material | Function in Analysis | Greenness Considerations | Alternative Solutions |
|---|---|---|---|
| Acetonitrile | Common UFLC mobile phase component | Hazardous, energy-intensive production, problematic waste | Ethanol, methanol, or water-rich mobile phases |
| Methanol | Extraction solvent, mobile phase component | Toxic, flammable, hazardous waste | Ethanol, alternative green solvents |
| Chlorinated Solvents | Extraction and separation | Highly toxic, environmental persistence | Terpene-based solvents, ethyl acetate |
| Derivatization Agents | Enhancing detection of non-chromophoric compounds | Toxic, generates additional waste | Direct analysis methods, alternative detection |
| Water | Universal solvent, mobile phase component | Green but requires purification energy | On-site water purification systems |
| Ethanol | Extraction solvent, mobile phase | Renewable, biodegradable, less toxic | Often preferable to methanol or acetonitrile |
The application of AGREE metrics to evaluate UV-Vis and UFLC-DAD methods provides a structured framework for balancing analytical performance with environmental responsibility. The evidence indicates that UV-Vis spectroscopy generally offers superior greenness profiles for applications where its selectivity limitations are acceptable, while UFLC-DAD remains essential for complex analyses despite its higher environmental footprint [35]. This assessment approach enables researchers and drug development professionals to make informed decisions that align analytical methodology with sustainability goals.
Future developments in green analytical chemistry will likely focus on miniaturization, automation, and alternative solvent systems to improve the environmental performance of both techniques. The ongoing development and refinement of assessment tools like AGREE, AGREEprep, and AGSA will provide increasingly sophisticated metrics for quantifying and comparing method greenness [74] [78]. As regulatory and societal pressures for sustainability intensify, the integration of greenness assessment into analytical method development and selection will become increasingly essential for modern laboratories [77] [74]. By adopting these assessment frameworks, researchers can contribute to more sustainable scientific practices while maintaining the high analytical standards required for pharmaceutical research and quality control.
In pharmaceutical research and drug development, the choice of an analytical technique is a fundamental decision that balances competing priorities: the need for speed and operational simplicity against the demand for specificity and comprehensive data. Ultraviolet-Visible (UV-Vis) spectrophotometry and Ultra-Fast Liquid Chromatography with Diode Array Detection (UFLC-DAD) represent two powerful yet distinct approaches to chemical analysis. UV-Vis spectroscopy offers a straightforward method for quantifying chromophoric compounds in solution based on their light absorption properties, operating on the well-established Beer-Lambert law [12]. In contrast, UFLC-DAD combines high-resolution chromatographic separation with full-spectrum ultraviolet detection, enabling the identification and quantification of individual components within complex mixtures [79] [10]. This technical guide provides a structured decision framework to help researchers, scientists, and drug development professionals select the most appropriate technique based on their specific analytical requirements, sample complexity, and operational constraints, framed within the broader context of analytical method selection.
The fundamental distinction between these techniques lies in their operational scope: UV-Vis provides a composite spectrum of all light-absorbing compounds in a sample, while UFLC-DAD first separates mixture components chromatographically before obtaining individual UV-Vis spectra for each separated compound [12] [10]. This core difference dictates their respective applications, with UV-Vis excelling in simple, rapid quantification of single components or combined parameters, and UFLC-DAD providing specific identification and quantification of individual analytes in complex matrices. As the pharmaceutical industry increasingly prioritizes both efficiency and comprehensive characterization, understanding the technical capabilities and limitations of each technique becomes essential for optimal analytical strategy.
Fundamental Principles and Technological Evolution
UV-Vis Spectrophotometry: Core Principles and Modern Advancements
UV-Vis spectrophotometry operates on the principle that molecules containing chromophores (light-absorbing functional groups) will absorb specific wavelengths of light in the ultraviolet (190-380 nm) and visible (380-750 nm) regions. The resulting absorption spectrum provides both quantitative information through Beer's Law, which relates absorbance to concentration, and limited qualitative information through characteristic absorption maxima (λmax) [12]. Modern UV-Vis systems have evolved significantly from earlier bulky, standalone instruments to incorporate sophisticated features that enhance laboratory efficiency.
Recent advancements in UV-Vis technology focus on improving usability, integration, and reliability. Key developments include:
- Intuitive Interfaces and Guided Workflows: Modern instruments feature touchscreen controls with pre-programmed methods and real-time visual feedback, significantly reducing training requirements and minimizing user error [80].
- Enhanced Scanning Performance: Improved optical systems and faster scanning capabilities increase sample throughput, with instruments like the Techcomp UV2500 engineered for rapid, stable readings ideal for processing dozens or hundreds of samples daily [80].
- Compact Footprint and Connectivity: Contemporary designs prioritize space efficiency without performance compromise, featuring smaller benchtop footprints and enhanced connectivity options including SD card slots and PC software integration for secure data handling [80].
- Improved Optical Stability: Incorporation of robust optical components with fewer moving parts, thermal regulation, enhanced detectors, and solid-state light sources improves measurement stability, reduces drift, and extends instrument lifespan [80].
UFLC-DAD: Integrated Separation and Detection
UFLC-DAD represents a sophisticated hyphenated technique that combines the separation power of ultra-fast liquid chromatography with the spectral acquisition capabilities of diode array detection. The chromatographic component separates mixture components based on their differential partitioning between a stationary phase and a mobile phase pumped at high pressure [79]. Following separation, the DAD component simultaneously monitors multiple wavelengths and captures full UV-Vis spectra for each eluting compound [12] [10].
The diode array detector represents a significant advancement over conventional single-wavelength UV detectors. Unlike variable wavelength detectors that use a monochromator to select a specific wavelength before the flow cell, DAD detectors pass polychromatic light through the flow cell and then disperse it onto an array of photodiodes after transmission [12]. This fundamental difference in optical design enables continuous monitoring of all wavelengths simultaneously, providing three-dimensional data (time, absorbance, and wavelength) for each analysis [10].
Modern UFLC-DAD systems continue to evolve, with recent innovations focusing on:
- Advanced Spectral Deconvolution: New systems employ mathematical deconvolution of spectrometer output to plot concentrations of individual components in real time, even for partially co-eluting peaks [81].
- Intelligent Peak Deconvolution: Technologies like Shimadzu's i-PDeA function utilize both temporal and spectral information to deconvolute co-eluting peaks, providing virtual separation of chromatographically unresolved compounds [10].
- Enhanced Biocompatibility: Recent introductions like the Waters Alliance iS Bio HPLC System feature bio-inert designs with MaxPeak HPS technology specifically tailored for biopharmaceutical applications [81].
- System Integration and Eco-Design: New systems like the Shimadzu i-Series incorporate eco-friendly designs with reduced energy consumption, compact footprints, and advanced control software for remote operation [81].
Technical Comparison: Capabilities and Limitations
Table 1: Direct comparison of UV-Vis spectrophotometry and UFLC-DAD across key technical parameters
| Parameter | UV-Vis Spectrophotometry | UFLC-DAD |
|---|---|---|
| Principle | Measures light absorption by chromophores in solution [12] | Combines chromatographic separation with full-spectrum UV detection [79] [10] |
| Sample Throughput | High (rapid analysis, typically seconds to minutes) [80] | Moderate to low (longer analysis times, typically minutes to hours) |
| Information Content | Composite spectrum of all absorbing species; limited qualitative data [12] | Individual spectra for each separated component; rich qualitative and quantitative data [10] |
| Specificity | Low for mixtures (cannot distinguish individual components) [12] | High (separation precedes detection) [79] |
| Detection Limits | ~10â»â¶ to 10â»â· M (dependent on molar absorptivity) [12] | ~10â»â¹ to 10â»Â¹Â² M (enhanced through pre-concentration) |
| Quantitative Precision | High (%RSD typically <0.5-2% with proper technique) [12] | Very high (%RSD typically <0.2-1% for chromatography) [12] |
| Multi-component Analysis | Limited, requires significant spectral differences and chemometrics [82] | Excellent, inherent through chromatographic separation [79] |
| Peak Purity Assessment | Not possible | Excellent (spectral comparison across peak) [10] |
| Sample Requirements | Minimal preparation for simple matrices | Often requires extensive sample clean-up and preparation |
| Operational Complexity | Low (minimal training required) [80] | High (requires significant technical expertise) |
| Method Development | Typically straightforward | Can be complex and time-consuming |
| Equipment and Consumable Costs | Low to moderate | High (instrumentation, columns, solvents) |
| Environmental Impact | Lower solvent consumption | Higher solvent consumption and waste generation |
Table 2: Typical application domains for UV-Vis and UFLC-DAD techniques
| Application Area | UV-Vis Preferred Applications | UFLC-DAD Preferred Applications |
|---|---|---|
| Pharmaceutical Quality Control | Raw material identity testing, finished product assay for single components [12] | Stability-indicating methods, impurity profiling, complex formulations [12] |
| Bioanalysis | Protein quantification (A280), cell density measurements | Drug metabolism studies, biomarker quantification, therapeutic drug monitoring [36] |
| Food and Beverage Analysis | Total phenolic content, antioxidant assays, color measurements | Specific vitamin quantification, additive analysis, contaminant screening [21] [36] |
| Environmental Monitoring | Aggregate parameter analysis (e.g., nitrate, ozone) | Pesticide residues, pollutant profiling, targeted contaminant quantification [79] |
| Research and Development | Kinetic studies, method scouting, teaching laboratories | Metabolite identification, natural products analysis, degradant characterization [83] [21] |
Advantages and Limitations in Practice
UV-Vis Spectrophotometry offers compelling advantages in scenarios requiring rapid analysis with minimal sample preparation. Its strengths include exceptional reliability, ease of use, high precision, excellent linearity, and minimal training requirements [12]. These characteristics make it ideal for quality control applications of chromophoric compounds, particularly in pharmaceutical settings where regulations often require precision better than 0.2% RSD for drug potency testing [12]. However, UV-Vis faces significant limitations when analyzing complex mixtures, as it cannot distinguish between individual components with overlapping spectra without employing advanced chemometric techniques [82]. Additionally, it requires optical transparency in the mobile phase and exhibits variable response dependent on analyte molar absorptivity [12].
UFLC-DAD addresses these limitations through its hyphenated approach, offering high specificity, powerful peak purity assessment capabilities, and the ability to resolve complex mixtures into individual components [10]. The technology provides both identification confidence through spectral matching and quantitative precision through chromatographic resolution. The DAD's ability to monitor multiple wavelengths simultaneously enables method development flexibility and retrospective data analysis without reinjection [12]. However, these advantages come with increased operational complexity, higher costs (both capital and operational), lengthier analysis times, and greater solvent consumption [12]. The technique requires significant technical expertise for both method development and instrument maintenance, making it less suitable for routine testing in resource-limited environments.
Decision Framework: Selection Criteria and Guidelines
When to Prefer UV-Vis Spectrophotometry
UV-Vis spectrophotometry represents the optimal choice in several well-defined scenarios:
- Single Component Analysis: When analyzing a single chromophoric compound in a relatively simple matrix without interfering substances, UV-Vis provides rapid, precise quantification with minimal method development [12].
- High-Throughput Screening: In applications requiring analysis of dozens or hundreds of samples daily, UV-Vis offers significantly faster cycle times and higher throughput [80].
- Limited Resources and Expertise: For laboratories with budget constraints, limited technical staff, or minimal method development capabilities, UV-Vis delivers reliable results with lower operational complexity [80].
- Teaching and Training Environments: Academic laboratories benefit from UV-Vis's straightforward operation and direct demonstration of spectroscopic principles [80].
- Preliminary Method Scouting: Initial compound characterization, including λmax determination and approximate concentration estimation, is efficiently performed using UV-Vis before committing to more complex techniques.
When to Prefer UFLC-DAD
UFLC-DAD becomes essential in more analytically challenging situations:
- Complex Mixtures: When samples contain multiple chromophoric compounds with potentially overlapping spectral features, UFLC-DAD's separation power is indispensable [79].
- Specificity Requirements: In regulated environments requiring positive identification and peak purity confirmation, such as pharmaceutical impurity testing or stability-indicating methods, UFLC-DAD provides essential verification capabilities [12] [10].
- Unknown Screening: When samples may contain unexpected or unidentified components, UFLC-DAD's full spectral capture enables retrospective analysis without sample reinjection [10].
- Matrix Complexity: For samples with challenging backgrounds or potential interferents, chromatographic separation effectively isolates analytes of interest from matrix components [36].
- Method Development Flexibility: The ability to monitor multiple wavelengths simultaneously facilitates method optimization and transfer between different systems or laboratories.
Diagram 1: Decision workflow for selecting between UV-Vis and UFLC-DAD techniques
Advanced Applications and Hybrid Approaches
Chemometric Enhancements to UV-Vis Spectroscopy
While traditional UV-Vis faces limitations with complex mixtures, advanced chemometric methods coupled with machine learning algorithms significantly expand its capabilities. Multivariate calibration techniques including Partial Least Squares (PLS), Principal Component Regression (PCR), and Multivariate Curve Resolution-Alternating Least Squares (MCR-ALS) enable simultaneous quantification of multiple analytes in mixtures [82]. These approaches mathematically resolve overlapping spectral signals, effectively compensating for UFLC-DAD's lack of physical separation.
Recent research demonstrates the power of these hybrid approaches. In one pharmaceutical application, researchers developed a machine learning-enhanced UV-spectrophotometric method utilizing MCR-ALS for simultaneous quantification of five compounds in novel anti-glaucoma formulations, achieving recovery percentages of 98-102% with low prediction errors [82]. The study strategically employed a D-optimal design generated by MATLAB's candexch algorithm to create robust validation sets, overcoming limitations of random data splitting in machine learning chemometric methods [82]. Similarly, ensemble learning algorithms like Random Forest and Extremely Randomized Trees have been successfully applied to UV-Vis identification of multi-class pesticides in HPLC/DAD analysis, demonstrating the potential for pattern recognition in complex spectral data [79].
Integrated Workflows: Leveraging Both Techniques
Sophisticated analytical workflows often benefit from strategic integration of both techniques:
- Primary Screening with UV-Vis: Initial sample assessment using UV-Vis to determine approximate concentration ranges and screen for expected components, followed by targeted UFLC-DAD analysis for specific quantification.
- Method Development Synergy: Using UV-Vis spectra obtained from standard solutions to determine optimal monitoring wavelengths for UFLC-DAD method development.
- Quality Control Tiered Approach: Implementing UV-Vis for routine quality control testing of well-characterized materials, with UFLC-DAD reserved for investigative testing, method validation, and complex problem-solving.
Table 3: Essential research reagents and materials for UV-Vis and UFLC-DAD applications
| Reagent/Material | Typical Application | Function/Purpose |
|---|---|---|
| HPLC-Grade Solvents (acetonitrile, methanol) [36] | UFLC-DAD mobile phase | Sample dissolution, chromatographic separation |
| Buffer Salts (phosphate, acetate) [36] | UFLC-DAD mobile phase modification | pH control, ion-pairing, improving separation |
| Derivatization Agents [36] | Enhanced detection for non-chromophoric compounds | Convert non-UV-absorbing analytes to detectable forms |
| Reference Standards [36] [82] | Both techniques | Method calibration, quantitative accuracy |
| Solid Phase Extraction (SPE) Cartridges [36] | Sample preparation for UFLC-DAD | Matrix clean-up, analyte pre-concentration |
| Quartz Cuvettes [82] | UV-Vis sample containment | UV-transparent sample holder for spectral measurement |
Experimental Protocols and Methodologies
Standard UV-Vis Protocol for Single-Component Quantification
Scope and Application: This protocol describes the quantification of a single chromophoric compound in solution using UV-Vis spectrophotometry, suitable for pharmaceutical raw material testing or simple formulation analysis [12].
Materials and Equipment:
- Double-beam UV-Vis spectrophotometer with 1 cm pathlength quartz cuvettes
- Analytical balance (accuracy ±0.1 mg)
- Appropriate solvent (UV-grade, spectroscopically transparent)
- Reference standard of target analyte
Procedure:
- Standard Solution Preparation: Accurately weigh 25-100 mg of reference standard and dissolve in known volume of appropriate solvent to prepare stock solution (typical concentration 1000 μg/mL) [82].
- Calibration Series: Prepare minimum of five standard solutions covering expected sample concentration range through serial dilution.
- Spectral Acquisition: Scan standards across appropriate wavelength range (typically 200-400 nm) to determine λmax [82].
- Quantitative Measurement: Measure absorbance of standards and samples at predetermined λmax.
- Calibration Curve: Plot absorbance versus concentration and determine regression parameters.
- Sample Analysis: Process unknown samples identically to standards and calculate concentration from calibration curve.
Method Validation Parameters:
- Linearity (R² > 0.995 typical)
- Precision (RSD < 2%)
- Accuracy (98-102% recovery)
- Limit of Detection (LOD) and Quantification (LOQ)
UFLC-DAD Protocol for Multi-component Analysis
Scope and Application: This protocol describes the simultaneous quantification of multiple components in complex mixtures, suitable for pharmaceutical formulations or natural products [36] [10].
Materials and Equipment:
- UFLC system with quaternary pump, autosampler, and DAD detector
- Appropriate analytical column (C18, C8, or other selective stationary phase)
- Mobile phase components (HPLC-grade solvents, buffers)
- Reference standards for all target analytes
Procedure:
- Mobile Phase Preparation: Prepare mobile phase components, filter through 0.45 μm membrane, and degas thoroughly.
- Standard Solution Preparation: Prepare individual stock solutions (1000 μg/mL) for each analyte, then prepare mixed calibration standards covering expected concentration range [36].
- Chromatographic Optimization: Develop gradient or isocratic method to achieve baseline separation of all analytes (resolution >1.5).
- Spectral Library Development: Acquire full UV-Vis spectra (200-400 nm) for each pure analyte standard for future peak identification [10].
- System Suitability Testing: Verify chromatographic performance (precision, resolution, tailing factor) meets acceptance criteria before sample analysis.
- Data Acquisition: Inject standards and samples, monitoring at optimal wavelengths for each analyte while simultaneously collecting full spectra for peak purity assessment [10].
Method Validation Parameters:
- Specificity (resolution from potential interferents)
- Linearity for each component
- Precision (intra-day, inter-day)
- Accuracy (recovery studies)
- LOD/LOQ for each analyte
- Robustness (deliberate method variations)
The selection between UV-Vis spectrophotometry and UFLC-DAD represents a strategic decision that balances analytical needs against practical constraints. UV-Vis offers unparalleled efficiency, simplicity, and cost-effectiveness for straightforward analytical challenges, while UFLC-DAD provides the specificity, resolution, and comprehensive data required for complex mixtures and regulated environments. The decision framework presented in this guide enables systematic evaluation based on sample complexity, information requirements, throughput needs, and available resources.
Future developments in both techniques continue to expand their applications and capabilities. UV-Vis spectroscopy is evolving through integration with advanced chemometric methods and machine learning algorithms, transforming it from a simple univariate technique to a powerful multivariate tool [82]. Modern instruments emphasize user-friendly interfaces, faster scanning, compact footprints, and improved connectivity [80]. UFLC-DAD systems are advancing through enhanced spectral deconvolution capabilities, improved detection limits, and more sophisticated data processing algorithms [81] [10]. The ongoing convergence of these technologies suggests a future where hybrid approaches and intelligent method selection become standard practice in analytical laboratories.
For researchers and drug development professionals, the optimal analytical strategy often involves leveraging both techniques appropriately within a tiered analytical approach. UV-Vis serves as an efficient frontline tool for routine analysis and initial screening, while UFLC-DAD provides definitive results for complex separations and regulatory submissions. As both technologies continue to evolve within the framework of green analytical chemistry principles, the focus will increasingly shift toward methods that balance analytical performance with environmental responsibility, cost-effectiveness, and practical utility in real-world laboratory settings.
Conclusion
The choice between UV-Vis and UFLC-DAD is not a matter of one technique being superior, but of selecting the right tool for the specific analytical question. UV-Vis spectroscopy offers unmatched speed, simplicity, and cost-effectiveness for well-defined, high-concentration analytes, making it ideal for rapid quality checks and routine analysis. In contrast, UFLC-DAD provides the necessary separation power, specificity, and sensitivity for complex mixtures, low-concentration analytes, and demanding regulatory environments like impurity profiling. By understanding their foundational principles, practical applications, and validation requirements, scientists can make strategic decisions that enhance data reliability, accelerate drug development timelines, and ensure robust quality control from the lab to the clinic.
References
- 1. UV-Vis Spectroscopy: Principle, Strengths and Limitations ... [https://www.technologynetworks.com/analysis/articles/uv-vis-spectroscopy-principle-strengths-and-limitations-and-applications-349865]
- 2. UV-Vis Spectroscopy: Principle, Parts, Uses, Limitations [https://microbenotes.com/uv-vis-spectroscopy/]
- 3. Beer-Lambert Law | Transmittance & Absorbance [https://www.edinst.com/resource/the-beer-lambert-law/]
- 4. The Beer-Lambert Law [https://chem.libretexts.org/Bookshelves/Physical_and_Theoretical_Chemistry_Textbook_Maps/Supplemental_Modules_(Physical_and_Theoretical_Chemistry)/Spectroscopy/Electronic_Spectroscopy/Electronic_Spectroscopy_Basics/The_Beer-Lambert_Law]
- 5. UV Spectroscopy Market Size & Share Analysis [https://www.mordorintelligence.com/industry-reports/uv-spectroscopy-market]
- 6. 4.4: UV-Visible Spectroscopy [https://chem.libretexts.org/Bookshelves/Analytical_Chemistry/Physical_Methods_in_Chemistry_and_Nano_Science_(Barron)/04%3A_Chemical_Speciation/4.04%3A_UV-Visible_Spectroscopy]
- 7. UV/VIS Spectroscopy Applications in Chemistry [https://www.avantes.com/applications/cases/uv-vis-spectroscopy-applications-in-chemistry/]
- 8. The Bouguerâ€Beerâ€Lambert Law: Shining Light on ... [https://pmc.ncbi.nlm.nih.gov/articles/PMC7540309/]
- 9. Development and Validation of HPLC-DAD and UHPLC ... [https://pmc.ncbi.nlm.nih.gov/articles/PMC6151785/]
- 10. UV vs Diode-Array (PDA) Detectors for (U)HPLC [https://www.ssi.shimadzu.com/service-support/faq/liquid-chromatography/knowledge-base/uv-vs-pda-detectors/index.html]
- 11. HPLC Analysis with Diode Array Detection [https://ctlatesting.com/blogs/articles/hplc-analysis-with-diode-array-detection]
- 12. Ultraviolet Detectors: Perspectives, Principles, and Practices [https://www.chromatographyonline.com/view/ultraviolet-detectors-perspectives-principles-and-practices]
- 13. Detector Technologies for (U)HPLC [https://www.thermofisher.com/blog/analyteguru/detector-technologies-for-u-hplc/]
- 14. A Review of Quantitative and Topical Analysis ... [https://pmc.ncbi.nlm.nih.gov/articles/PMC11051960/]
- 15. The New Application of UHPLC-DAD-TOF/MS in ... [https://pubmed.ncbi.nlm.nih.gov/30936829/]
- 16. The New Application of UHPLC-DAD-TOF/MS in ... [https://www.frontiersin.org/journals/pharmacology/articles/10.3389/fphar.2019.00194/full]
- 17. Comparison of Quantification Using UV-Vis, NMR, and ... [https://www.mdpi.com/1422-0067/26/14/6638]
- 18. A Comparative Study of Newly Developed HPLC-DAD and ... [https://pmc.ncbi.nlm.nih.gov/articles/PMC4167226/]
- 19. Comparison of Two Methods, UHPLC-UV and UHPLC-MS/ ... [https://pmc.ncbi.nlm.nih.gov/articles/PMC6270524/]
- 20. Comparing HPLC Detectors: UV vs Refractive Index [https://eureka.patsnap.com/report-comparing-hplc-detectors-uv-vs-refractive-index]
- 21. UV-Vis absorption, synchronous fluorescence ... [https://link.springer.com/article/10.1007/s00217-025-04874-z]
- 22. 7. Principle and Feature of Various Detection Methods (1) [https://www.hitachi-hightech.com/global/en/knowledge/analytical-systems/hplc/hplc-basics/course7.html]
- 23. "DAD vs. UV in HPLC: Why Results Differ" [https://www.linkedin.com/posts/sahar-sehati-604b42237_hplc-analyticalchemistry-pharmaceuticalanalysis-activity-7339641579034329088-b42K]
- 24. Optimizing DAD Acquisition Method Settings - Articles [https://community.agilent.com/knowledge/lc-portal/kmp/lc-articles/kp116.optimizing-dad-acquisition-method-settings]
- 25. Comparison of high-performance liquid chromatography ... [https://pmc.ncbi.nlm.nih.gov/articles/PMC6425260/]
- 26. Development and validation of the UV-spectrophotometric ... [https://pmc.ncbi.nlm.nih.gov/articles/PMC3658052/]
- 27. UV spectroscopy for assay development and ... [https://phosphortech.com/uv-spectroscopy-for-assay-development-and-pharmaceutical-drug-formulation/]
- 28. Using UV-Vis Spectrophotometry In Drug Stability Testing ... [https://www.hunterlab.com/blog/using-uv-vis-spectrophotometry-in-drug-stability-testing-can-predict-commercial-viability/]
- 29. Optimization of high-efficient pre-column sample ... [https://www.sciencedirect.com/science/article/abs/pii/S030881462302527X]
- 30. Innovations in Liquid Chromatography: 2025 HPLC ... [https://www.chromatographyonline.com/view/innovations-in-liquid-chromatography-2025-hplc-column-and-accessories-review]
- 31. Development and Validation of HPLC-DAD/FLD Methods ... [https://www.mdpi.com/1420-3049/30/19/3902]
- 32. In Silico High-Performance Liquid Chromatography ... [https://pmc.ncbi.nlm.nih.gov/articles/PMC11983366/]
- 33. Development and validation of a green/blue UHPLC-MS ... [https://www.nature.com/articles/s41598-025-15614-4]
- 34. Development and Validation of an HPLC-DAD Method to ... [https://www.mdpi.com/2306-5710/11/3/59]
- 35. Comparative analysis and validation of analytical ... [https://www.sciencedirect.com/science/article/abs/pii/S0019452224000530]
- 36. Development and Validation of HPLC-DAD/FLD Methods for ... [https://pmc.ncbi.nlm.nih.gov/articles/PMC12525618/]
- 37. Simultaneous Determination of 16 Phenolic Compounds in ... [https://pmc.ncbi.nlm.nih.gov/articles/PMC12348741/]
- 38. Quantification of Phenolic Compounds by HPLC/DAD and ... [https://www.mdpi.com/2223-7747/14/11/1733]
- 39. Feasibility of UV–VIS–Fluorescence spectroscopy ... [https://pmc.ncbi.nlm.nih.gov/articles/PMC5502037/]
- 40. Analysis of Solid Formulates Using UV-Visible Diffused ... [https://www.mdpi.com/2227-9040/12/11/227]
- 41. Comprehensive review of the skin use of bakuchiol [https://link.springer.com/article/10.1007/s11101-024-09926-y]
- 42. Development of a new chromatographic method for the ... [https://pmc.ncbi.nlm.nih.gov/articles/PMC10449805/]
- 43. Dynamic variations of bioactive compounds driven by ... [https://arabjchem.org/dynamic-variations-of-bioactive-compounds-driven-by-enzymes-in-psoralea-corylifolia-l-from-growth-to-storage-and-processing/]
- 44. UV-VIS Spectroscopy Not Working? Common Limitations ... [https://www.pgeneral.com/service-maintenance-and-repair/uv-vis-spectroscopy-not-working-common-limitations-and-how-to-overcome-them/]
- 45. Correcting Ultraviolet-Visible Spectra for Baseline Artifacts [https://www.sciencedirect.com/science/article/pii/S0022354923003350]
- 46. The Influence and Compensation of Environmental Factors ... [https://www.mdpi.com/2076-3417/15/4/1694]
- 47. How to overcome interferences in UV – Visible ... [https://lab-training.com/overcome-interferences-uv-visible-spectroscopic-studies/]
- 48. Errors in Spectrophotometry and Calibration Procedures to ... [https://pmc.ncbi.nlm.nih.gov/articles/PMC5293527/]
- 49. Comparative Study of UV And HPLC Methods for Estimation ... [https://www.ijsrtjournal.com/article/Comparative-Study-of-UV-And-HPLC-Methods-for-Estimation-of-Drug]
- 50. LC Troubleshooting Essentials: A Guide to Common ... [https://www.chromatographyonline.com/view/lc-troubleshooting-essentials-a-guide-to-common-problems-and-solutions-for-peak-tailing-ghost-peaks-and-pressure-spikes]
- 51. Common Causes Of Peak Tailing in Chromatography - Blogs [https://www.alwsci.com/news/common-causes-of-peak-tailing-in-chromatograph-85154438.html]
- 52. A Novel Method for Development and Validation ... [https://pmc.ncbi.nlm.nih.gov/articles/PMC11447722/]
- 53. Top 10 HPLC Equipment Maintenance Tips for Optimal ... [https://raxcon.co.ke/top-10-hplc-equipment-maintenance-tips-for-optimal-performance-in-2025/]
- 54. Tips to maintain your HPLC & UHPLC systems and columns [https://www.waters.com/blog/tips-to-maintain-your-hplc-uhplc-systems-and-columns/?srsltid=AfmBOoqmuuzkyai0WQs9aipichkk7CQ22ymjqFXEmlCWdRWQpmzwgmsd]
- 55. HPLC and column maintenance [http://www.chromforum.org/viewtopic.php?t=107244]
- 56. The Improved Method for Determination of Orotic Acid in Milk by... [https://pubmed.ncbi.nlm.nih.gov/34827928/]
- 57. Preparation of Medicinal Plants: Basic Extraction and ... [https://pmc.ncbi.nlm.nih.gov/articles/PMC7398001/]
- 58. A Comprehensive Guide to Essential Oil Extraction Methods [https://www.newdirectionsaromatics.com/blog/untapping-the-power-of-nature-essential-oil-extraction-methods/]
- 59. Top 4 Ways to Extract Essential Oils from Plants [https://www.customprocessingservices.com/blog/top-4-ways-to-extract-essential-oils-from-plants]
- 60. Comparison of ultra-performance liquid chromatography ... [https://www.sciencedirect.com/science/article/abs/pii/S0021967305021151]
- 61. Screening by LC–MS-MS and Fast Chromatography [https://www.spectroscopyonline.com/view/screening-lc-ms-ms-and-fast-chromatography-alternative-approach-traditional-immunoassays]
- 62. Near UV-Vis and NMR Spectroscopic Methods for Rapid ... [https://www.mdpi.com/2076-3921/9/12/1245]
- 63. ICH Q2(R2) Validation of analytical procedures [https://www.ema.europa.eu/en/ich-q2r2-validation-analytical-procedures-scientific-guideline]
- 64. ICH and FDA Guidelines for Analytical Method Validation [https://www.labmanager.com/ich-and-fda-guidelines-for-analytical-method-validation-34252]
- 65. Q2(R2) Validation of Analytical Procedures March 2024 [https://www.fda.gov/regulatory-information/search-fda-guidance-documents/q2r2-validation-analytical-procedures]
- 66. Development and validation of an ultraviolet-visible ... [https://www.frontiersin.org/journals/analytical-science/articles/10.3389/frans.2023.1066348/full]
- 67. Analytical Method Development and Validation of UV- ... [https://juniperpublishers.com/gjpps/GJPPS.MS.ID.555735.php]
- 68. Navigating ICH Q2(R2) compliance in analytical method ... [https://pubmed.ncbi.nlm.nih.gov/40154788/]
- 69. ICH publishes Training Materials on Q2(R2) and Q14 [https://www.gmp-compliance.org/gmp-news/ich-publishes-training-materials-on-q2r2-and-q14]
- 70. The Different Types of HPLC Detectors [https://scioninstruments.com/us/blog/the-different-types-of-hplc-detectors/]
- 71. [June 2024] Implementing ICH Q2(R2) Validation of ... [https://insider.thefdagroup.com/p/june-2024-implementing-ich-q2r2-validation]
- 72. UV-adVISor: Attention-Based Recurrent Neural Networks to ... [https://pmc.ncbi.nlm.nih.gov/articles/PMC9137254/]
- 73. Comparison of Fluorometric and UV Spectrophotometric ... [https://pmc.ncbi.nlm.nih.gov/articles/PMC8672151/]
- 74. Assessing the Environmental Impact of Analytical Methods [https://www.chromatographyonline.com/view/the-green-component-assessing-the-environmental-impact-of-analytical-methods]
- 75. AGREE—Analytical GREEnness Metric Approach and ... [https://pmc.ncbi.nlm.nih.gov/articles/PMC7588019/]
- 76. A Tutorial on AGREEprep an Analytical Greenness Metric ... [https://www.sciencedirect.com/science/article/pii/S2772582022000225]
- 77. Greenness assessment of 174 CEN, ISO, and ... [https://www.sciencedirect.com/science/article/pii/S2772582025000336]
- 78. Greenness evaluation metric for analytical methods and ... [https://pubmed.ncbi.nlm.nih.gov/40756999/]
- 79. Heterogeneous ensemble learning applied to UV-VIS ... [https://www.sciencedirect.com/science/article/abs/pii/S016974392500070X]
- 80. How UV-Vis is Evolving in 2025 for Better Lab Efficiency [https://www.richmondscientific.com/how-uv-vis-is-evolving-in-2025-for-better-lab-efficiency?srsltid=AfmBOorTK57zC2U5Qh6aovuA5yNA1nCxZfPnSBdSD2MeXMz4WXMUsmzk]
- 81. New HPLC, MS, and CDS Products from 2024–2025 [https://www.chromatographyonline.com/view/new-hplc-ms-and-cds-products-from-2024-2025-a-brief-review]
- 82. D-optimal candexch algorithm-enhanced machine learning ... [https://bmcchem.biomedcentral.com/articles/10.1186/s13065-025-01572-5]
- 83. UV-Vis absorption spectrophotometry and LC-DAD-MS-ESI ... [https://www.sciencedirect.com/science/article/pii/S0003267023007845]