A Practical Guide to Demonstrating Peak Purity in HPLC Method Validation
This guide provides researchers, scientists, and drug development professionals with a comprehensive framework for demonstrating peak purity during HPLC method validation.
A Practical Guide to Demonstrating Peak Purity in HPLC Method Validation
Abstract
This guide provides researchers, scientists, and drug development professionals with a comprehensive framework for demonstrating peak purity during HPLC method validation. Covering foundational principles, methodological applications, troubleshooting, and regulatory alignment, it details techniques like Photodiode Array (PDA) and LC-MS assessment. The article emphasizes practical strategies for forced degradation studies, optimizing separations, and integrating peak purity data to meet ICH guidelines, ensuring the development of robust, stability-indicating methods for pharmaceutical quality control.
Understanding Peak Purity: The Cornerstone of Reliable HPLC Analysis
What is Peak Purity and Why is it Critical in Pharmaceutical Analysis?
In high-performance liquid chromatography (HPLC), a chromatographic peak is the visual representation of a compound detected as it elutes from the column. Peak purity refers to the degree to which this signal is attributable to a single chemical compound, as opposed to multiple co-eluting substances [1] [2]. The fundamental question in peak purity assessment is: "Is this chromatographic peak comprised of a single chemical compound?" [1]. In practice, however, the tools available to analysts typically answer a slightly different, more constrained question: "Is this chromatographic peak composed of compounds having a single spectroscopic signature?" This is more accurately termed spectral peak purity [1].
The assurance of peak purity is not merely a technical formality; it is a foundational requirement for accurate qualitative and quantitative analysis. Assuming a peak is pure when it is not leads to inaccurate quantification of the active ingredient and a failure to detect and quantify potentially harmful impurities [1]. This is especially critical in the pharmaceutical industry, where undetected co-elution can compromise drug safety and efficacy.
The Critical Role of Peak Purity in Pharmaceutical Analysis
The pharmaceutical industry dedicates immense effort to peak purity assessment, driven by the paramount objective of ensuring drug product quality and patient safety [1]. This focus is enshrined in regulatory expectations, which mandate compliance with International Conference on Harmonisation (ICH) guidelines (Q3A – Q3D) concerning impurities in new drug substances and products [1].
Impact on Safety and Efficacy
The presence of undetected impurities, even at low levels, can have severe consequences. History provides stark examples:
- (S)-(+)-Naproxen is an effective treatment for arthritis, but its enantiomer can cause liver poisoning [1].
- (S,S)-(+)-Ethambutol treats tuberculosis effectively, whereas its enantiomer can cause blindness [1].
- R-thalidomide was used to treat morning sickness, but its enantiomer is a teratogen [1].
These cases underscore that accurate peak purity assessment is a critical line of defense in ensuring the safety and efficacy of drug products. It is a core component of developing a stability-indicating method, which provides evidence that the analytical procedure is adequate for monitoring the quality of the drug substance and product throughout its shelf life [1].
Theoretical Foundations of Peak Purity Assessment
The most common tool for peak purity assessment is the photodiode array (PDA) detector, which captures ultraviolet-visible (UV-Vis) spectra at multiple points across a chromatographic peak [2] [3].
The Principle of Spectral Similarity
The underlying concept of spectral peak purity is based on viewing a spectrum as a vector in n-dimensional space, where 'n' is the number of data points (wavelengths) in the spectrum [1]. The similarity between two spectra is quantified by calculating the angle between their vector representations.
To visualize this, consider a simplified spectrum measured at just three wavelengths (λ1, λ2, λ3). This spectrum can be plotted as a vector in three-dimensional space. When comparing two spectra (vector a and vector b), the spectral similarity is calculated as the cosine of the angle (θ) between them [1]:
[ \cos \theta = \frac{\mathbf{a} \cdot \mathbf{b}}{||\mathbf{a}|| \cdot ||\mathbf{b}||} ]
Where the numerator is the dot product of the two vectors, and the denominator is the product of their lengths [1]. If the angle θ is zero, the shapes of the two spectra are identical, even if their overall intensities differ.
An equivalent approach used by some software is the calculation of the correlation coefficient between two mean-centered spectra [1]. The two measures are equivalent when vectors are mean-centered before calculation.
Purity Angle and Purity Threshold
In practical software implementations like Waters Empower, peak purity is determined by comparing two key parameters [4] [5]:
- Purity Angle: This is a numerical value representing the spectral variation across the peak. It is the average value of the angle between each spectrum within the peak and the spectrum at the peak's apex. A larger purity angle indicates greater spectral variation, suggesting potential co-elution [5].
- Purity Threshold (or Threshold Angle): This is a reference value representing the allowed level of spectral variation, typically derived from the baseline noise. It is an index of the effect of noise over the entire peak and is often the sum of a "Noise Angle" and a "Solvent Angle" [4] [5].
The peak purity determination is made by comparing these two values [3] [5]:
- If Purity Angle < Purity Threshold, the peak is considered "pure" (i.e., no spectral differences exceeding the noise level were detected).
- If Purity Angle > Purity Threshold, the peak is considered "impure," indicating a high likelihood that components with different spectra are co-eluting [5].
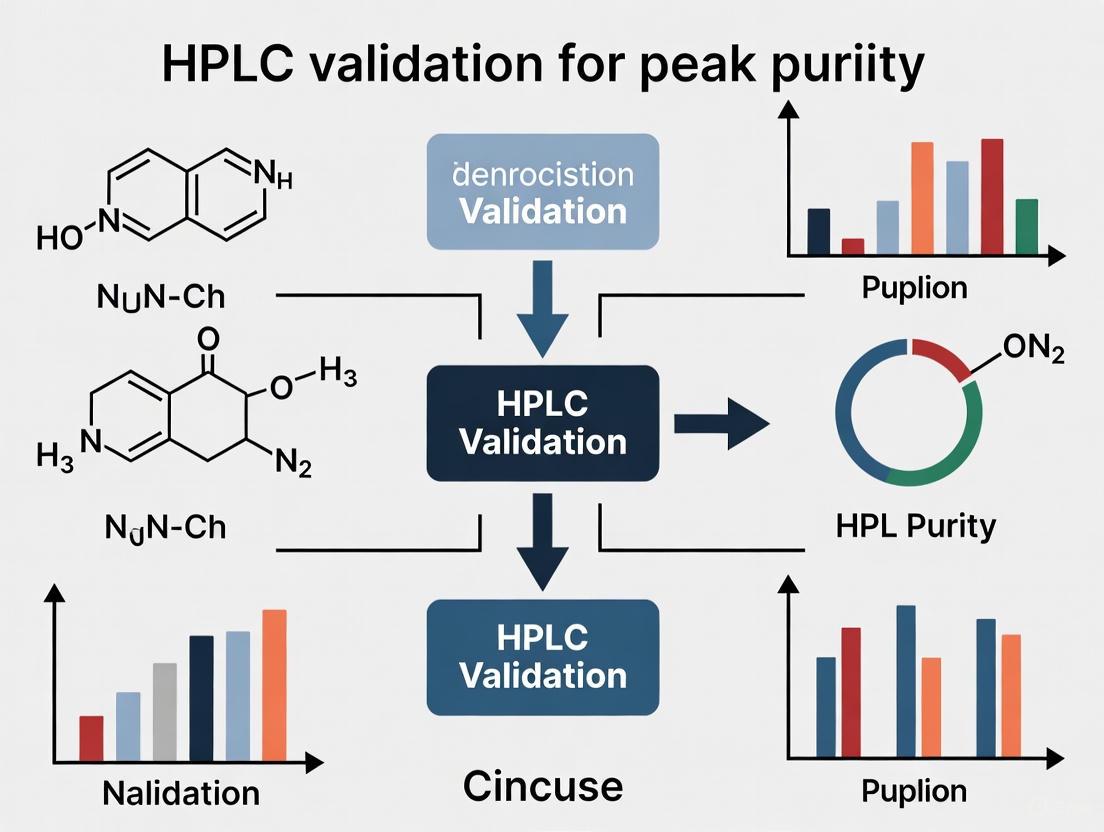
The following diagram illustrates the logical workflow for this assessment:
Methodologies and Experimental Protocols for Peak Purity
Integrating peak purity assessment into HPLC method development and validation requires a systematic and rigorous approach.
Configuring PDA-Based Peak Purity Analysis
A typical workflow for setting up peak purity in software like Waters Empower involves several critical steps [4] [6]:
- Enable Purity Calculation: In the processing method, select the "Purity Enabled" checkbox.
- Set Active Peak Region: The default is often 100%, meaning all spectra from 'peak liftoff' to 'peak touchdown' are used. If the baseline is noisy, reducing this percentage (e.g., to 80%) excludes noisy baseline spectra from the calculation, improving reliability [4].
- Determine Threshold Angle: It is recommended to first try the AutoThreshold function. This automatically determines the Solvent Angle as a function of the Maximum Spectral Absorbance (MSA) of the peak [4].
- Validation: AutoThreshold must be validated by processing six injections of a standard. If the Purity Angle is less than the Purity Threshold for all peaks in all injections, AutoThreshold is considered suitable [4].
- Limitation: The AutoThreshold can only be used for unknown samples if their MSA is less than 1.0 AU and less than five times the MSA of the standard used in the method development [4].
Best Practices for Reliable Purity Assessment
To ensure high-quality spectra and reliable purity results, several pre-processing steps are essential [7]:
- Background Correction: The mobile phase or sample matrix can contribute to background absorption. This is corrected by subtracting a reference spectrum taken from a baseline region before or after the peak. Using two baseline spectra allows for linear interpolation to compensate for a slowly changing background [7].
- Set Appropriate Wavelength Range: The analysis range should be restricted to wavelengths significant to the analysis. Including very low wavelengths can introduce high noise, while including irrelevant high wavelengths increases calculation time and random noise [7].
- Spectral Normalization: This step compensates for the changing concentration of the component as the peak elutes. Spectra are normalized and overlaid for graphical presentation, allowing for shape comparison independent of concentration [7].
- Apply an Absorbance Threshold: This excludes the lower part of the peak from the calculation, which contributes more to noise than signal. Setting the threshold too low can cause false "fails," while setting it too high can cause false "passes" [7].
Case Study: Peak Purity in Forced Degradation Studies
A 2025 study on furosemide pediatric formulations provides a clear example of peak purity assessment in practice [8]. The experimental protocol was as follows:
- Objective: Develop and validate an HPLC method for simultaneous quantification of furosemide (FUR), its degradation product FUR-B, and preservatives methylparaben (MP) and propylparaben (PP).
- Chromatographic Conditions:
- Column: Symmetry C18 (4.6 × 250 mm, 5 µm)
- Mobile Phase: 0.1% acetic acid in water and acetonitrile (60:40, v/v)
- Flow Rate: 1.0 mL/min
- Detection: 272 nm (optimal for FUR-B sensitivity)
- Forced Degradation: Samples were stressed under various conditions (e.g., acid, base, peroxide, heat, light) to generate degradation products.
- Key Result: The optimized method achieved baseline separation of FUR from its degradation products, which was confirmed by forced degradation studies. This demonstrated the method's stability-indicating property and its ability to accurately monitor the formation of FUR-B over time, especially in formulations stored at elevated temperatures [8].
Table 1: Key Purity Parameters from Waters Empower Documentation
| Parameter | Description | Function in Purity Assessment |
|---|---|---|
| Purity Angle | Average angle between each spectrum in the peak and the apex spectrum [5]. | Quantifies spectral variation across the peak. A larger angle suggests impurity. |
| Purity Threshold | Value based on baseline noise, determining allowable spectral variation [4] [5]. | Serves as a pass/fail threshold. A purity angle below this indicates a "pure" peak. |
| Active Peak Region (%) | Percentage of the peak (from start to end) used in the calculation [4]. | Can be reduced to exclude noisy baseline spectra. |
| AutoThreshold | Automated function to determine the Threshold Angle [4]. | Simplifies setup but requires validation with multiple standard injections. |
Limitations and Complementary Techniques
Despite its utility, PDA-based peak purity analysis has significant limitations that scientists must acknowledge.
Key Limitations of Spectral Peak Purity
- Cannot Prove Purity, Only Detect Impurity: It is crucial to remember that we can only prove a peak is impure. A "pure" result does not definitively prove a single compound is present [7].
- Similar Spectra: Impurities and degradation products are often structurally similar to the main component, leading to highly similar UV spectra. In such cases, spectral contrast angles will be small, making co-elution difficult to detect [1].
- Uniform Co-elution: If an impurity co-elutes with the same ratio and profile as the main peak throughout the entire chromatographic band, the summed spectrum will remain constant. The purity test, which looks for spectral changes across the peak, will fail to detect this [5].
- Detector Insensitivity: A UV detector will not respond to impurities that lack a chromophore. An impurity could be present but invisible to the PDA detector [7].
Orthogonal Techniques for Comprehensive Assessment
To overcome these limitations, orthogonal techniques are essential.
- Liquid Chromatography-Mass Spectrometry (LC-MS): LC-MS provides a more definitive assessment by detecting co-elution based on mass differences rather than UV absorbance. It is particularly useful for identifying low-level contaminants and is highly specific [2].
- Two-Dimensional Correlation (2D-corr) Analysis: Advanced chemometric techniques like 2D-corr analysis can be applied to data from multi-channel detectors (e.g., coulometric array detectors). The synchronous contour plot can indicate the number of components in a peak, while the asynchronous plot can reveal overlapping species, providing a powerful tool for verifying signal purity [9].
- Method Optimization: The most fundamental approach is to improve the chromatographic separation itself. This can be achieved by screening columns of different selectivity, adjusting mobile phase pH, and using optimization software tools in a Quality-by-Design (QbD) framework [1] [2].
Table 2: Comparison of Peak Purity Assessment Techniques
| Technique | Principle | Advantages | Limitations |
|---|---|---|---|
| PDA (DAD) | Spectral similarity (UV-Vis) [1] [3]. | Widely available, non-destructive, easy to implement. | Cannot detect impurities with similar spectra or no chromophore [1] [7]. |
| LC-MS | Mass-to-charge ratio (m/z) [2]. | High specificity and sensitivity, can identify unknowns. | Destructive; matrix effects can suppress ionization; more expensive [2]. |
| 2D-LC | Orthogonal separation mechanisms [1]. | High resolving power for complex mixtures. | Complex instrumentation and method development. |
| 2D-corr Analysis | Chemometric analysis of multi-channel data [9]. | Can deconvolute signals from unresolved peaks. | Requires specialized software and expertise. |
The Scientist's Toolkit: Essential Reagents and Materials
Successful peak purity analysis relies on high-quality materials and reagents. The following table details key items used in the cited research.
Table 3: Essential Research Reagent Solutions for HPLC Peak Purity Studies
| Item | Function/Description | Example from Literature |
|---|---|---|
| HPLC Column (C18) | The stationary phase for compound separation. Different selectivities are often screened. | Symmetry C18, 4.6 × 250 mm, 5 µm [8]; Kinetex C18 [8]. |
| Mobile Phase Buffers | The liquid solvent that elutes analytes from the column. pH and composition are critical for resolution. | 0.1% Acetic acid in water [8]; Ammonium acetate buffer (pH 4.4) [9]. |
| Organic Modifiers | Mixed with aqueous buffers to control retention and selectivity. | Acetonitrile (ACN) [8] [9]; Methanol (MeOH) [9]. |
| High-Purity Standards | Well-characterized reference materials for method development and validation. | Furosemide (FUR), Furosemide Related Compound B (FUR-B) [8]. |
| Stressed Samples | Samples subjected to forced degradation (heat, light, acid, base, peroxide) to generate impurities [1]. | Used to validate that a method is stability-indicating [1] [8]. |
Peak purity assessment is a critical, non-negotiable component of modern pharmaceutical analysis, directly supporting drug safety and efficacy by ensuring the accuracy of qualitative and quantitative results. While PDA-based spectral matching with metrics like Purity Angle and Purity Threshold is a powerful and widely used tool, it is not infallible. A "pure" result should be interpreted as "no spectral differences were detected," not as definitive proof of a single component.
A robust approach to demonstrating peak purity in HPLC validation research therefore relies on a holistic strategy that combines optimized chromatographic separation, critical interpretation of PDA data with an understanding of its limitations, and the use of orthogonal techniques like LC-MS where necessary. This multi-faceted approach, framed within a Quality-by-Design mindset, provides the highest confidence in analytical results and ensures the quality and safety of pharmaceutical products.
In the pharmaceutical industry, the validation of High-Performance Liquid Chromatography (HPLC) methods is not merely a scientific best practice but a regulatory requirement to ensure drug safety, quality, and efficacy. The International Council for Harmonisation (ICH) guidelines, along with relevant FDA guidance documents, form a comprehensive framework that governs every aspect of analytical method validation, including the critical assessment of peak purity. These regulatory drivers provide standardized approaches to method validation (ICH Q2(R1)), control of impurities in drug substances and products (ICH Q3A-Q3B), management of elemental impurities (ICH Q3D), and residual solvents (ICH Q3C). Within this framework, demonstrating peak purity—confirming that a chromatographic peak represents a single chemical entity—stands as a fundamental requirement, particularly for stability-indicating methods and impurity profiling. This technical guide examines the interconnected nature of these regulatory documents and provides detailed protocols for compliance, with special emphasis on peak purity assessment as a critical quality attribute in HPLC method validation.
Decoding the Regulatory Landscape: Guidelines and Their Interrelationships
ICH Q2(R1): Validation of Analytical Procedures
ICH Q2(R1), "Validation of Analytical Procedures: Text and Methodology," establishes the fundamental criteria for validating analytical methods. The guideline categorizes validation characteristics based on the type of analytical procedure (identification, testing for impurities, assay) and provides methodology for assessing each parameter. For impurity methods, this includes specificity, accuracy, precision, detection limit, quantitation limit, linearity, and range. The demonstration of specificity—the ability to assess unequivocally the analyte in the presence of components that may be expected to be present—is particularly crucial for peak purity assessment [10]. The guideline mandates that peak purity tests should be performed to demonstrate that the analyte chromatographic peak is not attributable to more than one component, a fundamental requirement for accurate impurity quantification and identification.
ICH Q3A(R2) and Q3B(R2): Impurities in New Drug Substances and Products
ICH Q3A(R2), "Impurities in New Drug Substances," and ICH Q3B(R2), "Impurities in New Drug Products," establish thresholds for reporting, identifying, and qualifying impurities in drug substances and products. These guidelines provide the regulatory context for why peak purity assessment is critical—without demonstrated peak purity, accurate quantification and control of impurities is compromised. Q3B(R2) specifically addresses impurities in new drug products, establishing thresholds based on maximum daily dose and requiring analytical procedures to be validated to demonstrate capability of detecting and quantifying impurities [11]. The guideline emphasizes that the analytical methods should be capable of separating both degradation products and process-related impurities, directly linking to the need for robust peak purity assessment.
ICH Q3C and Q3D: Elemental Impurities and Residual Solvents
ICH Q3D, "Guideline for Elemental Impurities," provides a risk-based approach to controlling elemental impurities in drug products, categorizing elements into classes based on their toxicity and likelihood of occurrence [12]. While elemental impurities are typically analyzed using spectroscopic techniques like ICP-MS rather than HPLC, the guideline's risk-assessment principles influence analytical control strategies across all testing methodologies. Similarly, ICH Q3C provides guidelines for residual solvents, employing the concept of permitted daily exposure (PDE) limits. These complementary guidelines complete the comprehensive impurity control framework that, when integrated with HPLC method validation requirements, ensure thorough product quality assessment.
FDA Guidance on Elemental Impurities
The FDA's "Elemental Impurities in Drug Products" guidance implements ICH Q3D in the US regulatory context, recommending control strategies consistent with the risk-based approach [13]. For HPLC method validation, this underscores the need for understanding potential interference from elemental impurities, though the primary analytical techniques differ.
Table 1: Summary of Key Regulatory Guidelines and Their Impact on HPLC Method Validation
| Guideline | Focus Area | Key Requirements Relevant to HPLC | Peak Purity Implications |
|---|---|---|---|
| ICH Q2(R1) | Analytical Method Validation | Validation of specificity, accuracy, precision, LOD, LOQ, linearity, range | Mandates demonstration that analyte peaks are pure and not attributable to multiple components |
| ICH Q3A(R2) | Impurities in New Drug Substances | Establishing thresholds for reporting, identifying, and qualifying impurities | Requires methods to separate and accurately quantify impurities, necessitating peak purity verification |
| ICH Q3B(R2) | Impurities in New Drug Products | Control of degradation products in formulated drugs | Necessitates stability-indicating methods with demonstrated specificity and peak purity for degradants |
| ICH Q3D | Elemental Impurities | Risk-based control of elemental impurities | Complements HPLC control strategies for organic impurities; different analytical technique |
Peak Purity Assessment: Methodologies and Regulatory Significance
Fundamental Concepts and Technical Approaches
Peak purity assessment is the process of demonstrating that a chromatographic peak corresponds to a single chemical entity, free from co-eluting substances. This is particularly critical in pharmaceutical analysis where undetected co-elution can lead to inaccurate quantification of both active ingredients and impurities, potentially compromising product quality and patient safety [2]. The most common technical approaches for peak purity assessment include:
Photodiode Array (PDA) Detection: This is the primary tool for peak purity assessment in HPLC. A PDA detector collects full UV-Vis spectra at multiple points across a chromatographic peak (typically at the upslope, apex, and downslope). The software then compares these spectra for consistency, calculating numerical indicators such as purity angle and purity threshold [2] [3]. A purity angle less than the purity threshold suggests a pure peak, while the opposite indicates potential co-elution.
Liquid Chromatography-Mass Spectrometry (LC-MS): This technique provides more definitive peak purity assessment by detecting co-elution based on mass differences rather than spectral variations. LC-MS is particularly valuable for identifying low-level contaminants that may have similar UV spectra to the main component [2].
Orthogonal Separation Techniques: Employing different separation mechanisms (e.g., different column chemistries, mobile phase compositions, or chromatographic modes) can confirm peak purity by demonstrating consistent results across methods.
Purity Angle and Purity Threshold: Calculations and Interpretation
The mathematical foundation of UV-based peak purity assessment relies on the comparison between purity angle and purity threshold:
- Purity Angle: A numerical representation of the spectral variation across a chromatographic peak. It quantifies the differences between spectra collected at different points of the peak [3].
- Purity Threshold: A reference value derived from the baseline noise, representing the maximum allowable spectral variation for a peak to be considered pure [3].
The fundamental decision rule is: if the Purity Angle is less than the Purity Threshold, the peak is considered pure; if it exceeds the threshold, co-elution is suspected [3]. However, analysts must exercise caution as these automated calculations have limitations and should be verified through manual spectral examination.
Regulatory Expectations and Compliance Strategies
Regulatory authorities expect demonstrated specificity and peak purity for analytical methods used in stability studies and impurity profiling. ICH Q2(R1) requires that analytical procedures be validated to demonstrate specificity for the analyte in the presence of potential impurities [10]. This is typically achieved through forced degradation studies, where the drug substance is subjected to various stress conditions (acid, base, oxidation, thermal, photolytic) to generate degradation products. The analytical method must then demonstrate separation of these degradants from the main peak and from each other, with confirmed peak purity for the active ingredient [10].
For compliance, manufacturers should:
- Incorporate peak purity assessment during method development and validation
- Perform forced degradation studies under relevant stress conditions
- Use orthogonal detection methods (PDA plus MS) for critical methods
- Document manual review of spectral overlays in addition to software-generated purity metrics
- Establish system suitability criteria that include peak purity verification
Experimental Protocols for Peak Purity Demonstration
Comprehensive Method Validation Protocol
A robust HPLC method validation for impurity determination should systematically address all parameters outlined in ICH Q2(R1), with particular emphasis on specificity and peak purity demonstration:
Materials and Equipment:
- HPLC system with photodiode array detector or LC-MS capability
- Appropriate chromatographic column (typically C18 or equivalent)
- Reference standards of active pharmaceutical ingredient (API) and known impurities
- Reagents: HPLC-grade water, organic modifiers (methanol, acetonitrile), buffer salts
Procedure: 1. Specificity and Peak Purity Assessment: - Prepare individual solutions of API and each known impurity - Inject separately to determine retention times and spectral characteristics - Prepare mixture of API and impurities to demonstrate resolution - Collect UV spectra across each peak (up-slope, apex, down-slope) - Calculate purity angle and purity threshold for main component - Manually overlay spectra to visually confirm consistency
Forced Degradation Studies:
- Acid degradation: Expose API to 0.1N HCl at room temperature for 2-4 hours [10]
- Base degradation: Expose API to 0.1N NaOH at room temperature for 2-4 hours [10]
- Oxidative degradation: Treat API with 3% hydrogen peroxide for 2-4 hours [10]
- Thermal degradation: Heat solid API at 80°C for 24 hours [10]
- Photolytic degradation: Expose API to UV light (254 nm) for 24 hours per ICH Q1B [10]
- Analyze stressed samples alongside unstressed control
- Confirm peak purity of main peak in all degradation samples
- Identify and characterize degradation products
Validation Parameters:
- Linearity: Prepare minimum of 5 concentrations from LOQ to 150% of specification level
- Accuracy: Perform recovery studies at 80%, 100%, 120% of target concentration
- Precision: Repeatability (minimum 6 replicates) and intermediate precision (different days, analysts)
- LOD/LOQ: Determine via signal-to-noise ratio (typically 3:1 for LOD, 10:1 for LOQ) or statistical methods
- Robustness: Deliberate variations in flow rate, temperature, mobile phase composition
Case Study: Mesalamine Method Validation and Forced Degradation
A recent study demonstrates comprehensive method validation with peak purity assessment for mesalamine, an anti-inflammatory drug [10]. The researchers developed a reversed-phase HPLC method using a C18 column with methanol:water (60:40 v/v) mobile phase at 0.8 mL/min flow rate and UV detection at 230 nm. The method was validated per ICH Q2(R1) guidelines and demonstrated excellent linearity (R² = 0.9992) across 10-50 μg/mL range, high accuracy (99.05-99.25% recovery), and precision (%RSD < 1%). Forced degradation studies revealed that mesalamine was most susceptible to alkaline degradation, followed by oxidative degradation, while showing relative stability under acidic, thermal, and photolytic conditions. Crucially, peak purity assessment confirmed that the mesalamine peak was homogeneous and well-separated from degradation products in all stress conditions, validating the method as stability-indicating [10].
Table 2: Experimental Parameters for HPLC Method Validation Based on Mesalamine Case Study
| Validation Parameter | Experimental Design | Acceptance Criteria | Results in Mesalamine Study |
|---|---|---|---|
| Linearity | 5 concentrations (10-50 μg/mL), triplicate injections | R² ≥ 0.998 | R² = 0.9992 |
| Accuracy | Spike recovery at 80%, 100%, 120% of target | Recovery 98-102% | 99.05-99.25% recovery |
| Precision (Repeatability) | 6 replicates of standard solution | %RSD ≤ 1% | %RSD < 1% |
| Specificity | Forced degradation studies + peak purity | No co-elution; purity angle < threshold | Demonstrated in all stress conditions |
| LOD/LOQ | Signal-to-noise ratio method | S/N ≥ 3 for LOD; ≥10 for LOQ | LOD: 0.22 μg/mL; LOQ: 0.68 μg/mL |
| Robustness | Deliberate method variations | %RSD < 2% for system suitability | %RSD < 2% achieved |
The Scientist's Toolkit: Essential Reagents and Materials
Successful implementation of HPLC methods compliant with ICH guidelines requires specific materials and reagents carefully selected for their intended applications. The following table details essential components for method validation and peak purity assessment:
Table 3: Essential Research Reagents and Materials for HPLC Method Validation
| Item | Specification | Function in HPLC Analysis | Regulatory Considerations |
|---|---|---|---|
| HPLC Column | C18, 150 mm × 4.6 mm, 5 μm | Separation of analytes based on hydrophobicity | Column efficiency and selectivity must be validated; documented in method |
| Mobile Phase Solvents | HPLC-grade methanol, acetonitrile, water | Carrier medium for chromatographic separation | Low UV cutoff, minimal impurities; documented certificates of analysis |
| Buffer Salts | High-purity ammonium formate, acetate, phosphate | Control of mobile phase pH for ionization control | Must be compatible with detection system; volatile for LC-MS |
| Reference Standards | Certified reference materials with documented purity | Quantification and identification of analytes | Must be traceable to recognized standards; purity certified |
| System Suitability Standards | Mixtures with known resolution characteristics | Verify chromatographic system performance | Must meet predefined criteria before sample analysis |
| Filters | 0.45 μm or 0.22 μm membrane filters | Removal of particulate matter from samples | Material compatibility studies required to avoid adsorption |
Troubleshooting and Best Practices in Peak Purity Assessment
Common Challenges and Solutions
Despite technological advances, several challenges persist in peak purity assessment:
Baseline Noise and Sensitivity Settings: As noted in chromatography forums, widening the scan range to 190-400 nm sometimes causes software to flag a peak as impure, while restricting it to 210-400 nm produces a pure result. This highlights how low-wavelength noise can distort purity calculations, leading to false positives. Selecting appropriate scan parameters reduces these errors and improves reliability [2].
Spectral Similarity of Co-eluting Compounds: When co-eluting compounds have similar UV spectra, PDA detection may fail to identify impurity presence. In such cases, orthogonal techniques like LC-MS provide more reliable detection [2].
Software Algorithm Variations: Different HPLC software platforms may calculate purity metrics differently, as evidenced by a forum user questioning why their peak purity match value exceeded 900 on a 1-1000 scale. This emphasizes the need for understanding platform-specific calculations and cross-validating with manual spectral review [2].
Best Practices for Regulatory Compliance
To ensure robust peak purity assessment and regulatory compliance:
Never Rely on Single Metrics: Software-generated purity scores should be considered alongside manual spectral review. As one case revealed, a purity angle below threshold suggested a pure peak, but careful examination showed small spectral variations at peak edges indicating possible co-elution [2].
Optimize Chromatographic Separation: Before relying on peak purity assessment, optimize separation conditions through mobile phase composition, gradient profile, column selection, and temperature to minimize co-elution possibilities.
Implement Orthogonal Detection: For critical methods, supplement PDA detection with mass spectrometry for definitive peak identity confirmation [2].
Document Comprehensive System Suitability: Include peak purity verification in system suitability tests to ensure ongoing method validity.
Maintain Awareness of Limitations: Understand that UV-based peak purity is a qualitative tool indicating spectral consistency but does not definitively confirm a single compound, especially with spectrally similar impurities.
The successful demonstration of peak purity in HPLC method validation requires a holistic understanding of the interconnected ICH guidelines and FDA guidance documents. ICH Q2(R1) provides the methodological framework for validation, while the Q3 series establishes the impurity control context that makes peak purity assessment essential. Rather than treating these guidelines as separate requirements, successful pharmaceutical scientists integrate them into a comprehensive approach that ensures method robustness, regulatory compliance, and ultimately, product quality and patient safety. As analytical technologies advance, the fundamental regulatory principles embodied in these documents continue to provide the foundation for reliable HPLC method validation, with demonstrated peak purity remaining a cornerstone of stability-indicating methodology.
In high-performance liquid chromatography (HPLC), the assurance of peak purity is a cornerstone of method validation, particularly in pharmaceutical analysis where it directly impacts drug safety and efficacy. This principle hinges on the concept of spectral homogeneity—the uniformity of a compound's ultraviolet-visible (UV-Vis) spectrum across its entire chromatographic peak. Assessing this homogeneity is the primary defense against co-elution, a phenomenon where two or more compounds elute simultaneously, potentially leading to inaccurate quantification and misidentification [1] [2]. This guide explores the fundamental principles, assessment techniques, and limitations of using spectral data to ensure peak purity within the context of HPLC method validation.
Theoretical Foundation of Spectral Homogeneity
The Spectral Vector Model
The theoretical basis for spectral peak purity assessment in most chromatographic data systems treats a spectrum as a vector in n-dimensional space, where n is the number of data points (wavelengths) in the spectrum [1]. To visualize this, consider a spectrum measured at just three wavelengths. It can be plotted as a vector in three-dimensional space, where the vector's end point has coordinates corresponding to the absorbance values at those three wavelengths [1].
Quantifying Spectral Similarity
When assessing a chromatographic peak for purity, multiple spectra are acquired across the peak profile. The similarity of these spectra is quantified by calculating the angle (θ) between the vector of each spectrum and the vector of a reference spectrum (often taken at the peak apex) [14] [1]. The core metric derived from this angle is the cosine or the correlation coefficient (r).
The similarity between two spectra, represented as vectors a and b, is given by:
cosθ = (a • b) / (||a|| ||b||) [1]
Where the numerator is the dot product of the vectors, and the denominator is the product of their lengths (norms). This calculation is independent of signal amplitude, relying solely on spectral shape [1]. An alternate, yet equivalent, measure used by some software is the correlation coefficient between the two spectra, which yields the same result when the vectors are mean-centered [14] [1]. A perfect match between spectra results in a θ of 0° (cosθ = 1), while increasing angles indicate greater spectral dissimilarity.
From Theory to Software Metric
In practice, software transforms these calculations into a more convenient purity index. For instance, the similarity factor is often expressed as 1000 × r², providing a value on a scale where 1000 indicates perfect spectral homogeneity [14] [15]. The software compares all spectra within a peak against the reference spectrum and computes a purity angle. If this angle exceeds a pre-defined purity threshold—which accounts for the system's spectral noise—the peak is flagged as potentially impure [1] [16].
The Critical Link: Spectral Heterogeneity and Co-elution
Co-elution is the primary risk that spectral homogeneity assessment aims to detect. It occurs when two or more compounds with similar chromatographic properties exit the column at the same time, appearing as a single peak [17] [18]. The following diagram illustrates the logical workflow for detecting this risk.
Manifestations of Co-elution
The risks of undetected co-elution are significant. In quantitative analysis, it leads to overestimation of the target analyte's concentration, compromising assay accuracy [1] [2]. In qualitative analysis, it can cause analysts to miss critical impurities or degradation products. This is especially dangerous in pharmaceuticals, where impurities can have toxicological consequences, as evidenced by historical cases involving enantiomers like thalidomide [1].
Methodologies for Assessing Spectral Homogeneity
Standard PDA-Based Assessment Protocol
The most common tool for peak purity assessment is the photodiode array (PDA) detector, which captures full UV-Vis spectra in real-time [2]. The standard experimental workflow is as follows.
Key Steps and Considerations:
- Baseline Correction: Accurate definition of the peak start and stop points is crucial, as the baseline must be subtracted before purity analysis [1].
- Spectral Acquisition: Modern software can collect numerous spectra (e.g., ~100) across a single peak [18].
- Noise Consideration: The purity threshold (T~j~) is often calculated using the variance of the spectral noise (Var~noise~) and the variance of the sample and reference spectra (Var~j~, Var~ref~) to avoid false positives:
T~j~ = 1000 × [1 - 0.5 × (Var~noise~/Var~j~ + Var~noise~/Var~ref~)²][14]. - Spectral Parameters: The slit width and spectral bandpass of the detector impact results. A narrower slit width reduces the measurable purity angle, increasing sensitivity to minor spectral differences [16].
An Alternative Protocol: The 3D Ellipsoid Volume Approach
Recent research proposes an alternative algorithm that uses linear regression for a more granular comparison [14]. The methodology is detailed below.
Experimental Protocol:
- Spectral Acquisition and Normalization: Export all spectra collected during the peak's elution interval, typically in CSV format [14].
- Pairwise Linear Regression: Perform linear regression between each unique pair of normalized spectra. For each comparison, this generates a slope, intercept, and correlation coefficient (r) [14].
- Statistical Summary: Calculate the mean and standard deviation for the resulting populations of slopes, intercepts, and correlation coefficients [14].
- Ellipsoid Volume Calculation: Visualize the data as an ellipsoid in 3D Cartesian space. The center is defined by the mean values (mean slope, mean intercept, mean r), and the axes are defined by 2 × standard deviation for each variable. Calculate the volume (EV) of this ellipsoid [14].
- Purity Metric Transformation: The final purity value is computed as PEV = -log~10~(EV). A higher PEV indicates greater spectral homogeneity [14].
This approach was validated using test solutions of compounds like carbamazepine and diazepam, evaluating its robustness against factors such as analyte concentration and spectral similarity [14].
Quantitative Data and Thresholds
The table below summarizes key metrics and their interpretation from different assessment methodologies.
Table 1: Key Metrics for Spectral Purity Assessment
| Metric | Calculation Method | Interpretation | Typical Ideal Value | Key Limitations |
|---|---|---|---|---|
| Spectral Similarity (e.g., Agilent) | Cosine of angle (θ) or correlation coefficient (r) between spectral vectors, often reported as 1000 × r² [14] [15] | Higher value indicates greater spectral homogeneity | 1000 [15] | Fails when impurities have highly similar UV spectra [1] [15] |
| Purity Angle vs. Purity Threshold (e.g., Waters) | Angle between sample spectrum and reference spectrum, compared to a threshold angle derived from system noise [1] | Peak is "pure" if Purity Angle < Purity Threshold | Purity Angle ≈ 0 | Sensitive to baseline noise and selection of spectral range [2] |
| Purity Ellipsoid Volume (PEV) | PEV = -log~10~(EV), where EV is the volume of a 3D ellipsoid from regression parameters [14] | Higher PEV indicates greater spectral homogeneity | N/A (Comparator metric) | Requires data export and external calculation; newer method [14] |
Limitations and Complementary Techniques
Despite its utility, UV-based spectral homogeneity assessment has well-documented limitations. Analysts must be aware of these to avoid false conclusions.
Table 2: Common Limitations and Challenges of Spectral Purity Assessment
| Limitation | Description | Potential Consequence |
|---|---|---|
| Similar UV Spectra | Impurities or degradation products are often structurally similar to the main analyte, leading to highly similar UV profiles [1] [2]. | False Negative: Co-elution is not detected. |
| Large Concentration Differences | The spectral contribution of a low-concentration impurity may be masked by the dominant analyte [14] [1]. | False Negative: Minor co-elution is not detected. |
| Perfect Co-elution | The ratio of the co-eluting compounds remains constant across the entire peak profile, resulting in a uniform, albeit mixed, spectrum [14]. | False Negative: Co-elution is not detected. |
| Spectral Noise and Parameters | High baseline noise, especially at low wavelengths (<210 nm), or inappropriate slit width/spectral range can distort calculations [2] [16]. | False Positive/Poor Reproducibility: A pure peak may be flagged as impure. |
Orthogonal Techniques to Confirm Purity
Given these limitations, regulatory-compliant method validation requires orthogonal strategies.
- Liquid Chromatography-Mass Spectrometry (LC-MS): This is a definitive orthogonal technique because it separates compounds based on mass-to-charge ratio rather than UV spectral properties. It is highly effective for detecting co-elution, even with structurally similar compounds or low-level contaminants [2].
- Forced Degradation Studies: These studies are a regulatory expectation for stability-indicating methods. The API is subjected to stress conditions (acid, base, oxidation, heat, light), and the method's ability to separate the main analyte from its degradation products demonstrates specificity and confirms peak purity under relevant conditions [1] [10].
- Modification of Chromatographic Conditions: Changing the column chemistry (e.g., from C18 to a biphenyl or HILIC phase) or adjusting the mobile phase pH can alter selectivity and resolve co-elutions that were undetected under the original conditions [1] [18].
The Scientist's Toolkit: Essential Reagents and Materials
The following table lists key materials used in developing and validating methods for peak purity assessment, as cited in the research.
Table 3: Essential Research Reagents and Materials for Peak Purity Experiments
| Item | Function / Application | Example from Literature |
|---|---|---|
| HPLC System with PDA Detector | Hardware for separation and real-time UV-Vis spectral acquisition. | Agilent 1260 series; Shimadzu UFLC system [14] [10] |
| C18 Chromatographic Column | The stationary phase for reverse-phase separation, the most common mode in HPLC. | Kinetex EVO C18 (100 x 2.1 mm, 2.6 µm); ODS C18 (150 x 4.6 mm, 5 µm) [14] [10] |
| HPLC-Grade Solvents | Mobile phase components (e.g., water, acetonitrile, methanol). | Acetonitrile from Sigma-Aldrich; HPLC-grade water from Milli-Q system [14] [10] |
| Pharmaceutical Reference Standards | High-purity compounds for method development and as calibration standards. | Carbamazepine, Diazepam USP reference standards; Mesalamine API [14] [10] |
| Acid/Base for Forced Degradation | To induce hydrolytic degradation and test method specificity. | 0.1 N HCl and 0.1 N NaOH [10] |
| Oxidizing Agent | To induce oxidative degradation and test method specificity. | 3% Hydrogen Peroxide (H₂O₂) [10] |
Spectral homogeneity remains a fundamental, though not infallible, principle in HPLC method validation. The vector-based model of spectral comparison provides a powerful tool for initial peak purity assessment. However, its inherent limitations necessitate a skeptical and multi-faceted approach. Reliable peak purity demonstration requires more than trusting a single software-generated number; it demands a thorough strategy that includes understanding the chemical context of the analytes, optimizing detection parameters, and, crucially, employing orthogonal techniques like LC-MS and forced degradation studies. By integrating these elements, scientists can confidently address co-elution risks, ensuring the accuracy of quantitative results and the safety and quality of pharmaceutical products.
In high-performance liquid chromatography (HPLC), the fundamental assumption is that each chromatographic peak corresponds to a single, pure compound. However, impure peaks—those containing co-eluting substances—represent a critical vulnerability in pharmaceutical analysis that can compromise data integrity, product quality, and ultimately, patient safety. When co-elution occurs undetected, quantification becomes inaccurate, leading to potentially misleading results across all phases of drug development and quality control [2].
The consequences of impure peaks extend throughout the pharmaceutical lifecycle, from early development to post-market surveillance. In impurity profiling, even minor co-elution can affect results, potentially allowing harmful degradation products or process-related impurities to escape detection [2]. In assay validation, impure peaks directly impact accuracy and precision measurements, potentially leading to incorrect potency assessments. Most critically, for patient safety, undetected impurities may include toxic, mutagenic, or carcinogenic compounds that pose serious health risks, particularly in drugs with narrow therapeutic indices [19]. This technical guide examines the multifaceted consequences of impure peaks within the context of demonstrating peak purity in HPLC validation research.
Critical Consequences of Impure Peaks
Impacts on Assay Accuracy and Method Validation
The presence of impure peaks fundamentally undermines the reliability of analytical methods, with cascading effects throughout the validation process:
- Inaccurate Quantification: Co-eluting compounds lead to inflated peak areas or heights, resulting in overestimation of the target analyte's concentration. This directly impacts assay accuracy, potentially masking potency issues in drug substances and products [2].
- Compromised Validation Parameters: During method validation as per ICH Q2(R1) guidelines, impure peaks systematically distort key parameters including accuracy, precision, and linearity [20]. For instance, in the validation of an RP-HPLC method for Fosamprenavir, precision was demonstrated with %RSD values of 0.5–1.7% for the drug and its impurities—a level of reliability that would be unattainable with impure peaks [21].
- Reduced Method Robustness: Methods susceptible to peak impurities demonstrate poor robustness when transferred between laboratories, where subtle differences in equipment or reagents can exacerbate separation issues [22]. This was highlighted in a study of Furosemide formulations, where robust resolution between the drug and its related compound B (FUR-B) was essential for accurate stability assessment [8].
Compromised Impurity Profiling and Control
Impurity profiling represents one of the most severely impacted areas when peak purity is not assured:
- Incomplete Impurity Identification: Pharmaceutical impurities, including organic impurities, inorganic impurities, and residual solvents, must be identified and quantified to ensure patient safety [19]. Co-elution can cause dangerous impurities to remain undetected, as their signals are masked by the main analyte peak.
- Underestimation of Degradation Products: For stability-indicating methods, impure peaks can obscure degradation products that form during the drug's shelf life. In the Fosamprenavir study, method specificity was confirmed through resolution between the drug and its potential impurities (isomer, amino, propyl, nitro, and Amprenavir), with retention times ranging from 2.3 to 8.6 minutes [21]. Without this resolution, critical stability information would be lost.
- Regulatory Non-Compliance: Regulatory guidelines from FDA, EMA, and ICH mandate thorough impurity profiling. Methods unable to demonstrate peak purity risk regulatory rejection during submission reviews [20] [19].
Table 1: Validation Parameters Compromised by Impure Peaks
| Validation Parameter | Impact of Impure Peaks | Consequence |
|---|---|---|
| Accuracy | Inflated peak area from co-elution | Incorrect potency assessment |
| Precision | Variable contribution from impurities | Higher %RSD, poor repeatability |
| Specificity | Inability to resolve mixtures | Failed identification of critical impurities |
| Linearity | Non-linear response due to multiple components | Incorrect quantification, especially at LOD/LOQ |
| Robustness | Method failure with minor parameter changes | Failed method transfer between laboratories |
Direct Risks to Patient Safety
The most severe consequences of impure peaks manifest as potential risks to patient safety:
- Toxic Impurity Exposure: Undetected impurities can include toxic, mutagenic, or carcinogenic compounds. For example, in Furosemide formulations, the degradation product FUR-B must be carefully monitored and controlled, with refrigeration required to prevent its formation [8].
- Reduced Therapeutic Efficacy: Impurities can interfere with the therapeutic activity of the Active Pharmaceutical Ingredient (API), particularly in drugs with a narrow therapeutic index where small variations in concentration can lead to treatment failure [19].
- Altered Pharmacokinetics: Undetected impurities may affect drug absorption, distribution, metabolism, or excretion, potentially leading to unexpected side effects or reduced efficacy [19].
- Stability and Shelf-Life Concerns: The presence of impurities can accelerate drug degradation, reducing shelf life and potentially leading to administration of sub-potent medications [19].
Experimental Approaches for Peak Purity Assessment
Methodologies and Protocols
Demonstrating peak purity requires systematic approaches throughout method development and validation:
- Photodiode Array (PDA) Detection: The most common tool for peak purity assessment, PDA detectors measure UV absorbance across a peak to identify spectral variations indicating co-elution. Software typically generates metrics such as purity angle and purity threshold based on spectral comparisons [2].
- LC-MS for Definitive Assessment: Liquid chromatography-mass spectrometry provides more definitive assessment by detecting co-elution based on mass differences rather than UV absorbance. This is particularly valuable for identifying low-level contaminants that may not show spectral differences in PDA analysis [2].
- Forced Degradation Studies: These studies intentionally stress drug substances under various conditions (heat, light, pH, oxidation) to generate degradation products. The method's ability to resolve these degradation products from the main peak demonstrates specificity and peak purity. In the Fosamprenavir method, forced degradation confirmed baseline separation of the drug from its degradation products [21].
- Systematic Optimization: Method development should include adjusting mobile phase composition, gradient profile, column selection, and operational parameters to achieve baseline separation. The Furosemide study compared multiple columns and mobile phase compositions to achieve optimal resolution between FUR, FUR-B, methylparaben, and propylparaben [8].
Table 2: Experimental Conditions for Peak Purity Assessment in Recent Studies
| Analytical Study | Column | Mobile Phase | Detection | Key Separation Achieved |
|---|---|---|---|---|
| Fosamprenavir & Impurities [21] | Zobrax C18 (100 × 4.6 mm, 5 μm) | 0.1% OPA in water and ACN (gradient) | 264 nm | Resolution between isomer (4.7 min), propyl (4.3 min), and main peak (5.3 min) |
| Five COVID-19 Antivirals [23] | Hypersil BDS C18 (150 × 4.6 mm, 5 μm) | Water:methanol (30:70 v/v, pH 3.0) | 230 nm | Baseline separation of 5 antivirals in 6 min |
| Furosemide Formulation [8] | Symmetry C18 (250 × 4.6 mm, 5 μm) | 0.1% acetic acid:ACN (60:40 v/v) | 272 nm | Resolution between FUR, FUR-B, methylparaben, propylparaben |
Workflow for Peak Purity Assessment
The following diagram illustrates the systematic approach to peak purity assessment in HPLC method validation:
The Scientist's Toolkit: Essential Research Reagents and Materials
Successful peak purity assessment requires specific reagents, materials, and instrumentation selected for their suitability to the analytical challenge:
Table 3: Essential Research Reagents and Materials for Peak Purity Assessment
| Item | Function & Importance | Example from Literature |
|---|---|---|
| HPLC-Grade Solvents | Mobile phase components with minimal UV absorbance; critical for baseline stability and detection sensitivity | 0.1% orthophosphoric acid in water and acetonitrile for Fosamprenavir method [21] |
| Validated Reference Standards | High-purity compounds for identification and quantification; essential for confirming retention times and spectral matches | Pure Fosamprenavir (99.98%) and impurity standards from Icon Laboratories [21] |
| C18 Chromatographic Columns | Reversed-phase stationary phases with different selectivity; enables method optimization for challenging separations | Zobrax C18, Symmetry C18, and Kinetex C18 columns with varying dimensions and particle sizes [21] [8] |
| PDA Detector | Multi-wavelength UV-Vis detection enabling spectral comparison across peaks; primary tool for peak purity assessment | Agilent 1260 Infinity II with DAD for COVID-19 antiviral study [23] |
| Mass Spectrometer | Definitive identification of co-eluting compounds through mass detection; orthogonal technique to PDA | LC-MS systems for impurity profiling [19] |
| pH Adjustment Reagents | Mobile phase modifiers that alter selectivity through pH control; critical for ionizable compounds | 0.1% ortho-phosphoric acid for pH adjustment to 3.0 in COVID-19 antiviral method [23] |
The consequences of impure peaks in HPLC analysis represent a significant challenge with far-reaching implications for pharmaceutical analysis and patient safety. Through systematic assessment using PDA detectors, LC-MS confirmation, and forced degradation studies, analysts can demonstrate peak purity with high confidence. The approaches outlined in this guide provide a framework for developing reliable methods that ensure accurate impurity profiling, valid assay results, and ultimately, safer pharmaceutical products for patients. As analytical technologies continue to advance, the fundamental requirement remains: each chromatographic peak must represent a single compound to ensure the integrity of pharmaceutical analysis from development through quality control.
In the pharmaceutical industry, ensuring drug product quality and patient safety is a paramount objective, with regulatory agencies worldwide mandating strict adherence to guidelines for impurity profiling in new drug substances and products [1]. The development of a specific, stability-indicating method is therefore critical, as it provides evidence that the analytical procedure can adequately monitor the quality of the material throughout its shelf life by accurately quantifying the active pharmaceutical ingredient (API) and any potential degradation products [1] [24]. At the heart of validating such methods lies peak purity assessment, a powerful diagnostic tool that answers a fundamental question: is this chromatographic peak comprised of a single chemical compound, or are hidden components co-eluting with my analyte of interest? [1].
Assuming a peak is pure when it is not can lead to profoundly inaccurate quantitative determinations and flawed qualitative assessments, potentially allowing harmful impurities to go undetected [1]. The high-stakes nature of this analysis is illustrated by historical examples where isomeric impurities caused severe adverse effects, such as liver poisoning or teratogenic outcomes [1]. This technical guide explores the core principles, methodologies, and practical implementation of peak purity analysis within the framework of HPLC validation for stability-indicating methods, providing drug development professionals with the knowledge to confidently demonstrate the specificity of their analytical procedures.
Theoretical Foundations of Peak Purity
The Core Concept of Spectral Peak Purity
In practice, commercial HPLC software tools do not directly answer whether a chromatographic peak contains a single chemical compound. Instead, they address a more accessible question: is this chromatographic peak composed of compounds having a single spectroscopic signature? This concept, known as spectral peak purity, is assessed by examining the evolution of the UV or mass spectrum across the peak profile [1]. The underlying assumption is that if the spectra collected at different points across the peak (start, apex, and end) are consistent in shape, then the peak likely contains only one component. Conversely, significant spectral variation suggests the presence of co-eluting compounds [3] [1].
Mathematical Basis for Spectral Comparison
The theoretical foundation of spectral peak purity assessment in most chromatographic data systems is based on viewing a spectrum as a vector in n-dimensional space, where n is the number of data points in the spectrum [1]. A simple three-wavelength spectrum can be visualized as a vector in three-dimensional space, terminating at coordinates defined by its absorbance values. To quantify the similarity between two spectra, the angle (θ) between their vector representations is calculated.
The spectral similarity is computed as the cosine of the angle θ using the formula:
[ \cos \theta = \frac{\mathbf{a} \cdot \mathbf{b}}{\|\mathbf{a}\|\|\mathbf{b}\|} ]
where a and b represent the vectors of the two spectra being compared, the numerator is their dot product, and the denominator is the product of their lengths [1]. This calculation yields a value independent of signal amplitude, depending only on spectral shape. Some software packages use the correlation coefficient between mean-centered spectra, which is mathematically equivalent to the cosine of the angle between the vectors [1].
Table 1: Key Metrics in Peak Purity Assessment
| Metric | Definition | Interpretation |
|---|---|---|
| Purity Angle | A numerical representation of spectral variation across a peak [3]. | Lower values indicate more consistent spectra. |
| Purity Threshold | A reference value derived from baseline noise, representing maximum allowed variation for a pure peak [3]. | Establishes the pass/fail threshold. |
| Spectral Contrast Angle | The angle (θ) between spectral vectors in n-dimensional space [1]. | θ = 0° indicates identical spectra; larger angles indicate greater dissimilarity. |
| Match Factor/Correlation Coefficient | A measure of spectral similarity, equivalent to cos(θ) for mean-centered spectra [1]. | A value of 1.000 indicates perfect similarity. |
Critical Implementation in Method Validation
The Role of Peak Purity in Demonstrating Specificity
Within the method validation framework, peak purity analysis is a critical component for establishing specificity—the ability of a method to unequivocally assess the analyte in the presence of potential interferents such as impurities, degradation products, or excipients [24]. Regulatory guidelines from ICH require stability-indicating methods to physically separate degradation products from the API [24]. Peak purity assessment using a photodiode array (PDA) detector or mass spectrometry (MS) provides orthogonal confirmation that the method can discriminate between the API and any co-eluting impurities [24].
The process is integrated into forced degradation studies, where drug substances are intentionally stressed under various conditions (acid, base, oxidation, heat, and light) to generate degradation products [1] [25]. The resulting samples are analyzed using the developed HPLC method, and peak purity assessment is performed on the main analyte peak to confirm that no degradation products are co-eluting with it, thus demonstrating the method's stability-indicating capability [25].
Practical Workflow for Peak Purity Assessment
The standard workflow for conducting a peak purity assessment using a PDA detector involves several key steps, which are often automated within HPLC software platforms like Waters Empower, Agilent ChemStation, or Shimadzu LabSolutions [3]:
- Collect Spectral Data Across the Peak: During HPLC analysis, the PDA detector collects full UV-Vis spectra at multiple time points across the chromatographic peak, typically at the start, apex, and end of the peak [3].
- Perform Background Correction: To ensure comparisons are between the analyte and potential impurities without interference, background spectra from the mobile phase or matrix are subtracted from each peak spectrum. This can be done manually by specifying reference points or automatically by the software [7].
- Compare Spectra Across the Peak: The software compares all collected spectra using mathematical algorithms based on vector analysis or correlation coefficients [1].
- Calculate Purity Angle and Threshold: The software computes the purity angle (quantifying spectral variation) and the purity threshold (based on baseline noise) [3].
- Interpret Results: If the purity angle is less than the purity threshold, the peak is considered pure. If the purity angle exceeds the threshold, the peak is flagged as potentially impure [3].
- Visual Inspection: Finally, analysts should visually examine the overlaid, normalized spectra and the purity plot generated by the software, as automated metrics can sometimes be misleading [2].
Figure 1: A workflow diagram for peak purity assessment using a photodiode array (PDA) detector, showing the key steps from data collection to final interpretation.
Advanced Techniques and Analytical Considerations
Complementary and Advanced Assessment Techniques
While PDA-based peak purity is the most common approach, several other techniques enhance assessment confidence:
- Liquid Chromatography-Mass Spectrometry (LC-MS): LC-MS provides a more definitive assessment by detecting co-elution based on mass differences rather than UV spectral shape. It is particularly valuable for identifying low-level contaminants that may not have distinct UV spectra [2].
- Principal Component Analysis (PCA): Advanced chemometric techniques like PCA can outperform built-in software algorithms in detecting impurities, especially for minor components with very similar spectra. One study showed PCA outperforming commercial software by a factor of ten in detecting a minor impurity with a similar spectrum [26].
- Orthogonal Separation: The best secondary technique often uses an RPLC method with different selectivity or an entirely different separation mechanism (e.g., HILIC) to challenge the peak purity results from the primary method [24] [7].
Limitations and Key Considerations
Despite its utility, UV-based peak purity analysis has significant limitations that analysts must acknowledge:
- Proving Impurity, Not Purity: It is only possible to prove conclusively that a peak is impure. One cannot prove a peak is pure, only that impurity was not detected given the method's limitations [7].
- Structurally Similar Impurities: Impurities and degradation products are often structurally similar to the API, leading to highly similar DAD spectra. In such cases, spectral comparison may lack the sensitivity to distinguish them [1] [7].
- Complete Co-elution: If an impurity completely co-elutes with the target compound and has an identical spectrum, peak purity assessment cannot resolve them [7].
- Detector Sensitivity: The impurity must be detectable by the chosen detector. A UV-transparent impurity will not be detected by a PDA [7].
Table 2: Detector and Parameter Considerations for Reliable Peak Purity
| Factor | Influence on Peak Purity | Best Practice Recommendation |
|---|---|---|
| Sample Rate | Too slow: insufficient data points.Too fast: increased noise, reduced sensitivity. | Adjust to obtain enough scans across the narrowest peak (e.g., 20-30 points) [7]. |
| Spectral Bandwidth | Wider bandwidth: improved signal-to-noise (S/N).Narrower bandwidth: improved selectivity. | Select based on the need to detect impurities (wider) or maximize selectivity (narrower) [7]. |
| Slit Width | Wider slit: increased sensitivity but reduced spectral resolution.Narrower slit: higher spectral resolution. | Use a narrower slit to preserve small spectral differences crucial for purity assessment [7]. |
| Wavelength Range | Too wide: may include high-noise regions, causing false positives.Too narrow: may miss spectral differences. | Restrict the range to significant wavelengths for the analytes to reduce noise [2] [7]. |
| Absorbance Threshold | Too low: noise included in calculation, false fails.Too high: fails may be incorrectly passed. | Set to exclude the noisy lower portion of the peak from the calculation [7]. |
Experimental Protocols and Case Studies
Protocol for Forced Degradation with Peak Purity Assessment
A standard protocol for validating a stability-indicating method, incorporating peak purity assessment, is summarized below and illustrated with a case study on simultaneous estimation of cefixime and linezolid [25]:
- Prepare Drug Sample: Dissolve the drug substance or product in an appropriate solvent to a known concentration (e.g., 100 μg/ml) [25].
- Apply Stress Conditions:
- Acidic Hydrolysis: Treat sample with 0.1 N HCl at room temperature or elevated temperature for a specified time [25].
- Alkaline Hydrolysis: Treat sample with 0.1 N NaOH at room temperature or elevated temperature [25].
- Oxidative Degradation: Expose sample to hydrogen peroxide (e.g., 3% or 30%) [25].
- Thermal Stress: Heat the solid drug or solution in an oven [25].
- Photolytic Stress: Expose drug to UV light or cool white fluorescent light as per ICH options [25].
- Neutralize and Dilute: After stress, neutralize hydrolyzed samples and dilute with mobile phase to the target concentration for analysis [25].
- Chromatographic Analysis: Inject stressed samples into the HPLC system using the optimized stability-indicating method [25].
- Perform Peak Purity Analysis:
- For each major analyte peak, use the PDA software to collect spectra across the peak.
- Apply background correction using appropriate baseline points.
- Calculate the purity angle and purity threshold.
- Visually inspect the overlaid, normalized spectra for any divergence.
- Interpret Results: Successful validation requires that the peak purity test confirms the homogeneity of the API peak in the presence of degradation products, demonstrating the method's specificity [25].
The Scientist's Toolkit: Essential Reagents and Materials
Table 3: Key Research Reagent Solutions for Peak Purity and Specificity Studies
| Reagent/Material | Function in Experiment |
|---|---|
| PDA Detector | Enables collection of full UV-Vis spectra across a chromatographic peak for spectral comparison [3] [2]. |
| MS-Compatible HPLC System | Provides orthogonal detection based on mass, allowing identification of co-eluting compounds with similar UV spectra [24] [2]. |
| Forced Degradation Reagents | (e.g., 0.1 N HCl, 0.1 N NaOH, H₂O₂) Used to intentionally degrade the drug substance and generate potential impurities for testing method specificity [25]. |
| Placebo Mixture | A mock formulation containing all excipients without the API. Used to demonstrate that excipients do not interfere with the analyte peak [24]. |
| Reference Standards | Highly purified samples of the API and available impurities. Essential for confirming retention times and spectral identities [24] [27]. |
| "Cocktail" Solution | A mixture of API spiked with known impurities. Used for method optimization and as a system suitability test to verify resolution [24]. |
Peak purity assessment is an indispensable element in the development and validation of stability-indicating HPLC methods. It provides critical evidence for method specificity, ensuring that the analytical procedure can accurately quantify the API and monitor degradation products without interference from co-eluting impurities. While primarily based on spectral comparison algorithms using PDA detection, a robust purity assessment strategy acknowledges the technique's limitations and incorporates orthogonal techniques like LC-MS and advanced chemometrics where necessary. By rigorously applying the principles, workflows, and troubleshooting practices outlined in this guide, scientists and drug development professionals can confidently set the stage for reliable stability studies, ultimately contributing to the delivery of safe and efficacious pharmaceutical products to patients.
Proven Techniques for Peak Purity Assessment: From PDA to Orthogonal Methods
In the realm of High-Performance Liquid Chromatography (HPLC), the Photodiode Array (PDA) detector, also referred to as a Diode Array Detector (DAD), has established itself as an indispensable analytical tool. Unlike conventional UV-Vis detectors that measure absorbance at a single wavelength, PDA detectors simultaneously capture spectral data across a broad wavelength range (typically 190-400 nm or 190-900 nm) for each time point during chromatographic separation [28]. This capability to obtain three-dimensional data (time, absorbance, and wavelength) provides a significant advantage for method development, validation, and critical applications such as peak purity assessment.
The core operating principle of a PDA detector involves a polychromatic light source (usually deuterium and tungsten lamps) that passes through the sample flow cell [28]. The transmitted light is then dispersed onto an array of silicon photodiodes, where each diode corresponds to a specific wavelength [29]. Each photodiode functions as a p-n junction semiconductor, generating an electrical current proportional to the intensity of incident light (photons) via the photovoltaic effect [30] [31]. This parallel detection capability enables the continuous collection of full UV-Vis spectra throughout the chromatographic run, providing a comprehensive dataset for advanced analytical interpretation [28] [29].
The Role of PDA in HPLC Method Validation and Peak Purity Assessment
Peak Purity Assessment Fundamentals
Peak purity analysis is a critical validation parameter in HPLC, particularly for pharmaceutical quality control and impurity profiling, where accurate quantification is paramount [2]. Retention time alone is insufficient to confirm that a chromatographic peak represents a single compound, as co-elution of impurities with similar retention characteristics can lead to inaccurate quantification and misleading results [2]. PDA detection addresses this limitation by enabling spectral comparison across different regions of a chromatographic peak.
The assessment involves collecting multiple spectra across the peak (at the upslope, apex, and downslope) and comparing them for spectral homogeneity [2]. HPLC software algorithms calculate metrics such as purity angle and purity threshold to numerically express the degree of spectral match [2]. A pure compound typically exhibits consistent spectra throughout the peak, while a co-eluting impurity manifests as spectral variations, particularly at the peak edges [2]. This capability makes PDA an essential tool for demonstrating method specificity and ensuring accurate quantification of target analytes in the presence of potential impurities.
Advantages and Limitations in Peak Purity Assessment
PDA detection offers several distinct advantages for peak purity assessment. It provides non-destructive analysis while maintaining the sample integrity for subsequent investigation. The technology enables retrospective data analysis, as full spectral information is captured throughout the run, allowing re-examination of data without reinjection [28]. PDA detectors also facilitate method development optimization by identifying optimal detection wavelengths for each component in a mixture [28].
However, PDA-based peak purity assessment has important limitations that analysts must recognize. The technique primarily detects impurities with different spectral characteristics from the main compound; impurities with similar UV spectra may remain undetected [2]. Sensitivity constraints also exist, as low-level impurities (typically <1-5%) may not generate sufficient spectral contrast for reliable detection [2]. Additionally, the technique requires compounds to possess chromophoric properties for UV-Vis detection [28]. These limitations necessitate a cautious interpretation of purity results and often require orthogonal confirmation techniques such as LC-MS for comprehensive impurity profiling [2].
Experimental Protocols for Peak Purity Assessment
Standard Operating Procedure for Peak Purity Analysis
A validated protocol for peak purity assessment using HPLC-PDA should include the following critical steps:
Instrument Setup and Qualification: Utilize an HPLC system equipped with a PDA detector. Verify detector performance according to manufacturer specifications, including wavelength accuracy, photometric accuracy, and baseline noise [32] [33].
Chromatographic Separation: Employ optimized separation conditions specific to the analytical method. For example, in the analysis of herbal medicine compounds, researchers have utilized reverse-phase C18 columns (4.6 × 250 mm, 5 μm) with gradient elution comprising 0.05% aqueous formic acid and methanol at a flow rate of 1.0 mL/min [34] [35].
PDA Detection Parameters: Set the PDA detector to acquire spectra across an appropriate wavelength range (e.g., 200-400 nm) with a resolution of 1-2 nm. The specific spectral range should be selected to minimize baseline noise while capturing characteristic spectra of the analytes [2].
Data Collection: Process the chromatographic run while collecting full spectral data for all peaks of interest. Ensure adequate sampling density across peaks (minimum 10-15 spectra per peak) for reliable purity assessment [2].
Spectral Analysis: Using the HPLC software, select multiple spectra across each peak (typically at the leading edge, apex, and trailing edge) and generate overlay plots for visual comparison [2].
Purity Algorithm Application: Apply the instrument's purity matching algorithm to calculate numerical values (purity angle, purity threshold, or match factor) comparing spectra from different peak regions [2].
Result Interpretation: Interpret purity results conservatively, recognizing that a "pure" designation from PDA assessment indicates spectral homogeneity but does not definitively prove the absence of all impurities [2].
Method Validation Parameters for HPLC-PDA
When validating an HPLC-PDA method for regulated environments, several key parameters must be established:
Table 1: Key Validation Parameters for HPLC-PDA Methods
| Validation Parameter | Acceptance Criteria | Application in Peak Purity |
|---|---|---|
| Specificity | No interference from impurities; spectral purity confirmed | Demonstrates separation of known and unknown impurities |
| Linearity | Correlation coefficient (r²) ≥ 0.999 | Ensures accurate quantification across specified range [34] [35] |
| Detection Limit (LOD) | Signal-to-noise ratio ≥ 3 | Determines minimum level for impurity detection [32] [33] |
| Quantification Limit (LOQ) | Signal-to-noise ratio ≥ 10 | Establishes lowest quantifiable level [32] [33] |
| Precision | Relative Standard Deviation (RSD) < 2% for retention time | Confirms method reliability for purity assessment [34] |
| Accuracy | Recovery 95-105% | Verifies trueness of quantification [32] |
Advanced Implementation and Troubleshooting
Workflow Visualization for Peak Purity Assessment
The following diagram illustrates the systematic workflow for peak purity assessment using HPLC-PDA:
Troubleshooting Common Peak Purity Issues
Analysts frequently encounter several challenges when performing peak purity assessment:
Spectral Noise Interference: Baseline noise, particularly at low wavelengths (<210 nm), can distort spectral comparisons and lead to false impurity flags [2]. Solution: Optimize spectral acquisition parameters, employ narrower bandwidths, or restrict the spectral comparison range to regions with better signal-to-noise characteristics [2].
Insufficient Spectral Contrast: Impurities with similar chromophores to the main compound may not generate significant spectral differences. Solution: Apply mathematical enhancement techniques (e.g., derivative spectroscopy or spectral ratioing) to amplify subtle spectral differences [2].
Concentration-Dependent Spectral Shifts: At high concentrations, compounds may exhibit non-linear absorbance behavior or spectral shifts. Solution: Analyze samples at multiple concentrations to identify concentration-dependent effects and perform purity assessment at appropriate analyte levels.
Co-eluting Impurities with Similar Spectra: PDA cannot reliably detect impurities with nearly identical UV spectra to the main compound. Solution: Employ orthogonal detection methods such as LC-MS for definitive confirmation when PDA results are ambiguous [2].
Essential Research Reagent Solutions
Table 2: Essential Materials and Reagents for HPLC-PDA Methods
| Item | Function/Application | Specification Considerations |
|---|---|---|
| HPLC-PDA System | Chromatographic separation with spectral detection | Wavelength range: 190-900 nm; Spectral resolution: ≤1.5 nm [28] |
| Analytical Column | Compound separation | C18 reverse-phase; 250 mm length; 4.6 mm ID; 5 μm particle size [34] [35] |
| Mobile Phase Solvents | Liquid chromatographic separation | HPLC-grade water, acetonitrile, methanol with 0.05-0.1% modifiers (e.g., formic acid) [34] |
| Reference Standards | Method validation and compound identification | Certified purity ≥98% [32] [34] [35] |
| PDA Flow Cell | Sample detection path | Standard pathlength: 10 mm; Volume: ~13 μL [28] |
| Syringe Filters | Sample clarification | 0.45 μm or 0.22 μm PTFE or nylon [35] |
Comparative Detection Technologies
While PDA detection represents the industry standard for spectral-based detection in HPLC, it is essential to recognize its position within the broader context of detection technologies. Mass spectrometry (MS) provides superior sensitivity and definitive identification based on mass-to-charge ratio, making it particularly valuable for confirming PDA-based peak purity findings [2]. For comprehensive analytical workflows, the combination of PDA with MS detection represents the most robust approach for peak purity assessment, leveraging the strengths of both technologies [2].
Other detection modalities include evaporative light scattering detection (ELSD) for non-chromophoric compounds, refractive index (RI) detection for universal response, and fluorescence detection for specific fluorescent analytes. Each technology offers distinct advantages for particular applications, but PDA remains the most versatile for general pharmaceutical analysis due to its balance of sensitivity, specificity, and wealth of spectral information.
Photodiode Array detection maintains its status as the industry standard for HPLC analysis by providing critical spectral information that enables reliable peak purity assessment. While the technology has limitations in detecting impurities at very low concentrations or with nearly identical spectra, its non-destructive nature, full spectral capture capability, and compatibility with mass spectrometry make it an indispensable tool for modern analytical laboratories. As regulatory requirements for method validation continue to evolve, particularly in pharmaceutical quality control, the comprehensive data provided by PDA detection ensures its ongoing relevance for demonstrating method specificity, identifying potential co-elutions, and ensuring accurate quantification in complex matrices.
Interpreting Purity Angle vs. Purity Threshold in Software (Empower, OpenLab, LabSolutions)
This technical guide provides chromatographers and pharmaceutical scientists with a comprehensive framework for interpreting purity angle and purity threshold within modern chromatography data systems (CDS). Peak purity assessment using Photodiode Array (PDA) or Diode Array Detection (DAD) represents a critical analytical technique for demonstrating method specificity in HPLC method validation, particularly for stability-indicating methods in pharmaceutical development. This whitepaper synthesizes current implementation protocols across major CDS platforms—including Waters Empower, Agilent OpenLab CDS, and Shimadzu LabSolutions—while establishing the mathematical foundations, practical workflows, and interpretation criteria essential for robust peak purity assessment in regulated environments. Within the broader context of HPLC validation research, proper interpretation of these spectral purity parameters provides compelling evidence for detecting co-eluting impurities and degradation products, thereby supporting drug product quality and patient safety.
The assessment of peak purity represents a fundamental requirement in pharmaceutical analysis, where the International Conference on Harmonisation (ICH) guidelines Q3A–Q3D mandate rigorous impurity profiling of new drug substances and products. The primary objective of peak purity analysis is to determine whether a chromatographic peak consists of a single chemical entity or contains co-eluting impurities with similar spectral characteristics. This assessment is particularly crucial for stability-indicating methods that must detect and quantify degradation products formed under various stress conditions.
In practice, peak purity tools available in commercial CDS software do not directly answer "Is this peak pure?" but rather address the more nuanced question: "Does this chromatographic peak contain compounds having different spectroscopic signatures?" This distinction is critical, as structurally related impurities may share nearly identical UV spectra, potentially escaping detection by spectral comparison alone. Thus, understanding the capabilities and limitations of spectral purity assessment forms the foundation for appropriate implementation and interpretation within pharmaceutical method validation.
Theoretical Foundations of Spectral Peak Purity
Mathematical Principles of Spectral Comparison
The theoretical basis for spectral peak purity assessment in modern CDS platforms relies on representing UV spectra as vectors in n-dimensional space, where n corresponds to the number of wavelength data points acquired. The similarity between two spectra is quantified by calculating the angle between their corresponding vectors [1].
For two spectral vectors a and b, the cosine of the angle θ between them is calculated as:
An alternative approach employed by some systems uses the correlation coefficient (r) between mean-centered spectra:
where $\bar{a}$ and $\bar{b}$ represent the mean absorbance values of each spectrum. After mean-centering, the correlation coefficient becomes mathematically equivalent to the cosine of the spectral contrast angle [1].
The Purity Angle and Purity Threshold Concepts
Purity Angle: This parameter represents the average angle between the spectrum at the peak apex and all other spectra across the chromatographic peak. A smaller purity angle indicates greater spectral homogeneity throughout the peak [5].
Purity Threshold: This value establishes the acceptance limit for spectral variation, incorporating both instrumental noise (Noise Angle) and mobile phase contributions (Solvent Angle). The threshold represents the maximum spectral variation that can be attributed to these non-component-related factors [5] [6].
The following diagram illustrates the logical relationship between these concepts in peak purity assessment:
Software-Specific Implementation
Waters Empower Platform
Parameter Configuration
In Empower software, peak purity assessment requires specific parameter configuration in the Processing Method [6] [36]:
- Purity Enabled: Must be selected to activate peak purity calculations
- Active Peak Region (% ): Defines the percentage of peak spectra used for analysis (default 100%). This value may be reduced to exclude noisy baseline regions [6]
- Spectral Contrast Wavelength Range: Should be set above the UV cutoff of the mobile phase and within the absorbance range of target analytes [36]
- Threshold Criteria: Typically set to "AutoThreshold" for initial method development, which automatically calculates solvent angle based on Maximum Spectral Absorbance (MSA) [6]
Interpretation Protocol
Empower provides a two-tiered approach to peak purity interpretation [5] [36]:
Tabular Results: Review the Peaks table for numerical comparison:
- If Purity Angle < Purity Threshold → Peak is spectrally pure
- If Purity Angle > Purity Threshold → Potential co-elution detected
Graphical Verification: Examine the Purity Plot for detailed assessment:
- The green purity line should remain below the blue threshold line across the entire peak
- Even with acceptable tabular results, regions where the purity line exceeds the threshold indicate potential co-elution [37]
Table 1: Empower Peak Purity Interpretation Guide
| Purity Angle vs. Threshold | Purity Plot Observation | Interpretation | Recommended Action |
|---|---|---|---|
| Purity Angle < Purity Threshold | Purity line remains completely below threshold line | Peak is spectrally pure | Accept purity assessment |
| Purity Angle < Purity Threshold | Purity line exceeds threshold at peak edges | Potential minor co-elution or overload | Reduce concentration; investigate peak edges |
| Purity Angle > Purity Threshold | Purity line consistently above threshold | High probability of co-elution | Investigate impurity profile; optimize separation |
Agilent OpenLab CDS Platform
Parameter Configuration
OpenLab CDS employs a simplified parameter set for UV impurity checking [38]:
- Calculate UV Purity: Select to enable calculations for all integrated peaks or identified peaks only
- Wavelength Range: Define lower and upper wavelengths based on solvent cutoff and compound absorption characteristics
- Sensitivity: Adjustable parameter (default 50%) that influences threshold calculation and purity flagging
- Threshold Exceptions: Number of consecutive data points permitted below threshold before impurity flagging
Interpretation Protocol
OpenLab CDS provides purity assessment through multiple visualization tools [38]:
- Injection Results Window: Displays color-coded purity flags (green = pure, red = impure)
- Chromatograms Window: Shows purity indicators alongside chromatographic peaks
- Peak Details Window: Provides detailed purity ratio curve for in-depth investigation
The software automatically calculates impurity sensitivity values for identified compounds, which can be manually adjusted or automatically determined using the "Calculate Sensitivity for All Compound(s)" function in OpenLab CDS 2.4 and later [38].
Cross-Platform Comparative Analysis
Table 2: Peak Purity Parameter Comparison Across CDS Platforms
| Parameter | Waters Empower | Agilent OpenLab CDS | Shared Principles |
|---|---|---|---|
| Spectral Comparison Basis | Spectral contrast angle | Correlation coefficient/equivalent | Vector-based spectral comparison |
| Primary Metrics | Purity Angle, Purity Threshold | UV Purity Value, Sensitivity | Normalized spectral difference metrics |
| Noise Incorporation | Noise Angle + Solvent Angle | Sensitivity adjustment | Account for spectral noise contributions |
| Configuration Approach | Individual parameter setting | Global and compound-specific sensitivity | Wavelength range optimization |
| Visualization Tools | Purity Plot, Spectrum Review | Peak Details, Purity Ratio Curve | Graphical representation of spectral homogeneity |
| Result Flagging | Numerical comparison (Angle vs. Threshold) | Color-coded purity indicators | Automated purity assessment |
Experimental Protocols for Method Validation
Establishing Peak Purity Parameters
A systematic approach to parameter establishment ensures robust peak purity assessment [6] [38]:
Initial Method Setup:
- Inject a high-purity standard at appropriate concentration (ensure absorbance <1.0 AU)
- Extract wavelength of interest and configure basic integration parameters
- Set wavelength range to avoid mobile phase absorption regions
Threshold Determination:
- For Empower: Utilize AutoThreshold function with six replicate standard injections
- For OpenLab: Begin with default sensitivity (50%) and adjust based on standard results
- Verify consistent purity assessment across all replicate injections
Noise Assessment:
- Select appropriate noise interval in regions without peaks or spectral features
- Verify random noise spectrum shape; avoid intervals with structured noise resembling analyte spectra [36]
Forced Degradation Studies Protocol
Forced degradation studies provide critical validation of method specificity for stability-indicating methods [39]:
Stress Conditions Application:
- Acid degradation: 1N HCl, 80°C, 1 hour (neutralize before analysis)
- Base degradation: 1N NaOH, 80°C, 1 hour (neutralize before analysis)
- Oxidative degradation: 3% H₂O₂, room temperature, 3 hours
- Thermal degradation: 80°C, 6 hours
- Photolytic degradation: 5000 lux + 90 μW, 24 hours
Peak Purity Assessment:
- Analyze stressed samples using established purity parameters
- Verify spectral purity of main peak across all degradation conditions
- Confirm resolution from nearest degradation product peaks
- Document any conditions resulting in co-elution
The following workflow illustrates the integrated approach to peak purity validation:
Advanced Technical Considerations
Limitations and Complementary Techniques
Despite its utility, spectral peak purity assessment has inherent limitations that necessitate complementary techniques:
- Structurally Similar Impurities: Compounds with nearly identical chromophores may produce similar UV spectra despite being chemically distinct, potentially leading to false purity assessments [1]
- Uniform Co-elution: When impurities co-elute in constant proportion throughout the peak, spectral homogeneity may be observed despite actual mixture composition [5]
- Concentration Effects: At high concentrations (>1.0 AU), absorbance non-linearity can cause spectral distortion and inaccurate purity assessments [5] [37]
To address these limitations, orthogonal techniques should be employed:
- Mass Spectrometric Detection: Provides definitive molecular weight confirmation for peak identity and impurity detection
- Orthogonal Chromatography: Utilization of different stationary phases with complementary selectivity
- Multiple Wavelength Analysis: Assessment of peak shape and ratio consistency across different wavelengths
Troubleshooting Common Issues
Table 3: Peak Purity Troubleshooting Guide
| Observation | Potential Causes | Investigation Steps | Resolution Approaches |
|---|---|---|---|
| High Purity Angle in Standards | Concentration too high (>1.0 AU) Mobile phase background absorption Spectral noise | Check maximum spectral absorbance Review solvent background spectrum Examine noise interval selection | Dilute sample to <1.0 AU Narrow wavelength calculation range Select alternative noise interval |
| Inconsistent Purity Results | Inappropriate threshold settings Noisy baseline Inadequate spectral contrast | Verify threshold calculation method Reduce Active Peak Region % Evaluate wavelength range suitability | Manually set solvent angle if needed Exclude noisy baseline spectra Optimize spectral acquisition range |
| Purity Plot Inconsistencies | Peak fronting or tailing Co-elution at peak edges Solvent perturbations | Examine peak symmetry Check for shoulder peaks Review mobile phase composition | Optimize chromatographic conditions Improve separation efficiency Adjust mobile phase ratio |
Research Reagent Solutions for Peak Purity Analysis
Successful implementation of peak purity assessment requires specific reagents and materials optimized for HPLC with photodiode array detection:
Table 4: Essential Materials for Peak Purity Analysis
| Material/Reagent | Specification | Function in Analysis | Quality Considerations |
|---|---|---|---|
| HPLC-Grade Acetonitrile | Low UV cutoff (<190 nm) | Mobile phase component | Minimize UV-absorbing impurities |
| High-Purity Water | 18.2 MΩ·cm resistance | Mobile phase component | Remove particulate and organic contaminants |
| Buffer Salts | HPLC grade (e.g., potassium dihydrogen phosphate) | Mobile phase modifier | Low UV background; controlled pH |
| Reference Standards | Certified purity (>99%) | System qualification and threshold setting | Documented purity and stability |
| Forced Degradation Reagents | ACS grade (HCl, NaOH, H₂O₂) | Stress studies for validation | Fresh preparation for consistent concentration |
| Column Conditioning Solvents | Matching initial mobile phase | Column equilibration | Ensure reproducible retention |
The accurate interpretation of purity angle versus purity threshold represents a critical competency for chromatographers engaged in pharmaceutical method validation. While software platforms differ in specific implementation, the fundamental principles of spectral comparison remain consistent across systems. Effective peak purity assessment requires not only proper parameter configuration but also comprehensive understanding of the mathematical foundations, method validation protocols, and inherent limitations of spectral comparison techniques.
When implemented within a holistic method validation framework that includes forced degradation studies and orthogonal confirmation, peak purity assessment provides compelling evidence of method specificity for stability-indicating methods. This evidence directly supports the broader thesis that rigorous HPLC method validation—incorporating robust peak purity assessment—is essential for ensuring drug product quality, safety, and efficacy throughout the product lifecycle.
Step-by-Step Guide to Spectral Comparison and Vector Analysis
This technical guide provides researchers and drug development professionals with a comprehensive framework for implementing spectral comparison and vector analysis to demonstrate peak purity in high-performance liquid chromatography (HPLC) validation. Peak purity assessment is critical in pharmaceutical analysis to ensure accurate quantification and identification of active pharmaceutical ingredients (APIs) and to detect co-eluting impurities that may compromise drug safety and efficacy. Through detailed explanations of theoretical principles, methodological protocols, and practical applications, this whitepaper establishes spectral vector analysis as an essential tool for robust HPLC method validation in regulatory-compliant environments.
Theoretical Foundations of Spectral Vector Analysis
The Vector Model of Spectral Data
In spectral comparison for HPLC peak purity assessment, ultraviolet-visible (UV-Vis) spectra captured by diode array detectors (DAD) are treated as mathematical vectors in n-dimensional space, where n corresponds to the number of wavelength data points collected [1]. This conceptual framework enables quantitative comparison of spectral signatures across a chromatographic peak. To visualize this principle, consider a simplified three-wavelength spectrum measured at wavelengths λ1, λ2, and λ3, which can be represented as a vector in three-dimensional space terminating at coordinates corresponding to the absorbance values at these three wavelengths [1]. This vector representation forms the mathematical basis for spectral similarity assessment in modern chromatographic data systems.
Quantifying Spectral Similarity
Spectral similarity between two spectra is quantified by calculating the angle between their vector representations in n-dimensional space [1]. For two spectral vectors a and b, the cosine of the angle θ between them is calculated as:
[ \cos(\theta) = \frac{\mathbf{a} \cdot \mathbf{b}}{||\mathbf{a}|| \cdot ||\mathbf{b}||} = \frac{\sum{i=1}^{n} ai bi}{\sqrt{\sum{i=1}^{n} ai^2} \cdot \sqrt{\sum{i=1}^{n} b_i^2}} ]
An alternative approach employed by some chromatographic data systems uses the correlation coefficient between mean-centered spectra [1]. When vectors are mean-centered before calculation, the correlation coefficient is equivalent to the cosine of the angle between vectors:
[ r = \frac{\sum{i=1}^{n} (ai - \bar{a})(bi - \bar{b})}{\sqrt{\sum{i=1}^{n} (ai - \bar{a})^2} \cdot \sqrt{\sum{i=1}^{n} (b_i - \bar{b})^2}} = \cos(\theta) ]
In both approaches, a perfect spectral match yields a value of 1 (cosine of 0°), while completely dissimilar spectra yield values approaching 0 (cosine of 90°) [1]. This quantitative measure of spectral similarity enables objective assessment of peak homogeneity throughout the elution profile.
Spectral Purity Assessment Workflow
The following diagram illustrates the comprehensive workflow for spectral purity assessment in HPLC validation:
Instrumentation and Data Acquisition
Spectral comparison for peak purity assessment requires an HPLC system equipped with a photodiode array detector (PDA) or diode array detector (DAD) capable of collecting full spectral data across defined wavelength ranges throughout the chromatographic run [2]. The detector captures three-dimensional data: absorbance as a function of time and wavelength, creating a detailed spectral signature at each time point during peak elution [1]. Optimal spectral data collection requires appropriate parameter selection, including wavelength range (typically 190-400 nm for UV-active compounds), spectral acquisition rate, and bandwidth to ensure sufficient spectral resolution while maintaining appropriate signal-to-noise ratios [2].
Critical Preprocessing Steps
Before spectral comparison, proper data preprocessing is essential for accurate results. Baseline correction must be applied using the baseline defined between peak start and stop limits to eliminate background interference [1]. Additionally, selection of appropriate spectral range is crucial, as excessively wide ranges may incorporate high noise regions (e.g., below 210 nm) that can distort purity calculations and lead to false positives [2]. Some advanced implementations, such as the Spectral and Chromatographic Overall Analysis (SCOA) method, employ techniques like the Whittaker smoother to eliminate baseline drift caused by solvents [40]. These preprocessing steps ensure that spectral comparisons reflect true chemical differences rather than instrumental artifacts.
Experimental Protocols for Peak Purity Validation
Forced Degradation Studies
Forced degradation studies are mandated components of stability-indicating method validation and provide critical samples for peak purity assessment [24]. These studies involve subjecting the drug substance to various stress conditions to generate potential degradation products. The specific protocols include:
- Acid and Base Hydrolysis: Expose drug substance to 0.1-1 M HCl or NaOH at elevated temperatures (e.g., 40-60°C) for specified durations (typically 1-24 hours) to assess hydrolytic stability [24].
- Oxidative Stress: Treat with 0.1-3% hydrogen peroxide at room temperature for several hours to evaluate oxidative degradation pathways [41].
- Thermal Stress: Heat solid drug substance to 40-80°C for days to weeks to simulate accelerated stability conditions [24].
- Photostress: Expose to controlled UV and visible light according to ICH Q1B guidelines to assess photodegradation behavior [24].
After stress treatment, samples are analyzed using the developed HPLC-DAD method, and peak purity is assessed for the main API peak to confirm separation from degradation products [41].
System Suitability Testing for Purity Assessment
System suitability testing must be performed before peak purity evaluation to ensure data quality. The following table outlines critical parameters and acceptance criteria:
Table 1: System Suitability Requirements for Spectral Purity Assessment
| Parameter | Acceptance Criterion | Purpose in Purity Assessment |
|---|---|---|
| Theoretical Plates | ≥2000 | Ensures adequate chromatographic efficiency |
| Tailing Factor | ≤2.0 | Confirms symmetric peak shape |
| Resolution | ≥2.0 between closest eluting peaks | Verifies separation capability |
| Injection Repeatability | RSD ≤ 2.0% for peak areas | Ensures system precision |
| Spectral Signal-to-Noise | ≥10:1 at low wavelength | Confirms spectral quality |
Spectral Comparison Experimental Procedure
The step-by-step protocol for performing spectral comparison analysis includes:
- Chromatographic Analysis: Inject sample solutions using validated HPLC-DAD method with collection of full spectral data across appropriate wavelength range [1].
- Peak Identification: Identify target peak(s) for purity assessment and establish peak start and end points based on baseline deviation [1].
- Spectrum Selection: Automatically or manually select multiple spectra across the chromatographic peak (typically 5-12 spectra including upslope, apex, and downslope) [41].
- Spectral Normalization: Apply normalization algorithms to account for concentration differences across the peak profile [1].
- Similarity Calculation: Compute spectral similarity between all selected spectra and a reference spectrum (typically at peak apex) using vector angle or correlation algorithms [1].
- Purity Threshold Comparison: Compare calculated purity values against established thresholds (purity factor ≥990 in many systems) to determine peak homogeneity [41].
- Visual Inspection: Examine overlaid normalized spectra for visible differences that might indicate co-elution, even if purity threshold is met [2].
Essential Research Reagent Solutions
The following table catalogues critical materials and reagents required for implementing robust spectral comparison studies in HPLC validation:
Table 2: Essential Research Reagents and Materials for Spectral Purity Analysis
| Reagent/Material | Function/Application | Technical Specifications |
|---|---|---|
| HPLC-Grade Solvents | Mobile phase preparation; sample dissolution | Low UV cutoff; minimal spectral impurities |
| Buffer Components | Mobile phase pH control | Non-UV absorbing; volatile buffers preferred for LC-MS |
| Reference Standards | System qualification; spectral libraries | Certified purity ≥95%; structural characterization |
| Forced Degradation Reagents | Stress study sample preparation | ACS grade or higher (HCl, NaOH, H₂O₂) |
| Placebo Formulations | Specificity demonstration | Matrix without API; representative of final product |
| Column Phases | Chromatographic separation | Multiple selectivities (C18, CN, phenyl, etc.) |
| Spectral Validation Standards | Detector wavelength verification | Certified reference materials (e.g., caffeine, holmium oxide) |
Data Interpretation and Analytical Decision-Making
Purity Thresholds and Acceptance Criteria
In pharmaceutical applications, peak purity is typically determined using software-calculated metrics such as purity factor, with a common acceptance threshold of ≥990 (on a 0-1000 scale) indicating a spectrally pure peak [41]. The purity angle, another commonly used metric, should be less than the purity threshold angle for the peak to be considered pure [2]. However, these numerical values should not be used in isolation. As demonstrated in case studies, a purity factor of 835.895 clearly indicates peak impurity, while values above 999.433 suggest spectral purity [41]. Despite meeting numerical thresholds, analysts should always visually inspect spectral overlays and examine peak shapes for subtle indications of co-elution that automated algorithms might miss [2].
Troubleshooting Common Issues
Several technical challenges can complicate spectral purity interpretation:
- Low Wavelength Noise: Excessive noise at wavelengths below 210 nm can distort purity calculations, potentially causing false positives. Restricting spectral range to 210-400 nm may improve reliability [2].
- Similar UV Spectra: Structurally related impurities often exhibit highly similar UV spectra, making detection challenging. In such cases, even significant co-elution may not trigger purity failures [1].
- Concentration Effects: Large concentration differences across a peak can mask spectral differences. Proper normalization algorithms are essential for accurate comparison [1].
- Baseline Effects: Improper baseline selection can significantly impact purity calculations. Baseline points should be selected in regions where no absorbance occurs [1].
When spectral purity assessment is inconclusive or when analyzing compounds with similar chromophores, orthogonal techniques such as liquid chromatography-mass spectrometry (LC-MS) provide definitive confirmation by detecting co-elution based on mass differences rather than UV spectral properties [2].
Regulatory Framework and Method Validation
Integration into Analytical Method Validation
Spectral purity assessment is an integral component of method specificity demonstration within the overall validation of stability-indicating HPLC methods according to ICH guidelines [24]. The International Council for Harmonization (ICH) Q2(R1) validation guidelines require demonstration of method specificity—the ability to assess unequivocally the analyte in the presence of components that may be expected to be present [24]. Peak purity testing via spectral comparison directly addresses this requirement by providing evidence that the analyte peak is uncompromised by co-eluting impurities. For regulatory submissions, peak purity data from forced degradation studies provides critical evidence that the method is stability-indicating and suitable for monitoring product quality throughout its shelf life [24].
Documentation and Reporting Requirements
Comprehensive documentation of spectral purity assessment should include:
- Instrument Parameters: Detector configuration, spectral acquisition range, and resolution settings [1].
- Processing Methods: Algorithms used for baseline correction, normalization, and similarity calculations [2].
- Reference Spectra: Identification of which spectra were used as reference for comparison [41].
- Numerical Results: Purity factors, purity angles, or correlation values for all assessed peaks [41].
- Spectral Overlays: Visual representations of normalized spectra across the peak profile [2].
- Case Justifications: Explanations for any deviations from expected results or acceptance criteria [24].
This documentation provides evidence of method robustness and supports the overall validation conclusion that the method is suitable for its intended use in pharmaceutical quality control [24].
Leveraging LC-MS for Definitive Purity Assessment Based on Mass
In the pharmaceutical industry and other sectors reliant on precise chemical analysis, demonstrating peak purity—the assurance that a chromatographic peak corresponds to a single chemical entity—is a fundamental requirement for ensuring product quality, safety, and efficacy [1]. Traditional methods for purity assessment, such as diode-array detection (DAD), answer the question: "Is this chromatographic peak composed of compounds having a single spectroscopic signature?" [1]. While useful, these methods can be limited when impurities are structurally similar to the main analyte and thus possess nearly identical UV spectra [1]. Liquid Chromatography-Mass Spectrometry (LC-MS) and tandem mass spectrometry (LC-MS/MS) provide a more definitive solution by leveraging the mass of the molecule itself as a highly specific detection parameter. The exceptional selectivity and sensitivity of LC-MS/MS make it a powerful tool for revealing co-eluting impurities and degradants that other detectors might miss, thereby playing a critical role in method validation and the development of stability-indicating methods within a broader pharmaceutical research framework [42].
LC-MS Fundamentals for Purity Assessment
Core Principles of Mass Spectrometry in Purity Analysis
Mass spectrometry detectors identify analytes based on their mass-to-charge ratio (m/z), a fundamental property that provides a dimension of selectivity orthogonal to chromatographic retention time [42]. This is the core advantage for purity assessment: even compounds that co-elute chromatographically (i.e., have identical or very similar retention times) can be distinguished if they have different molecular masses or produce distinct fragment ions [42].
Tandem mass spectrometry (MS/MS) enhances this specificity further. In a typical triple quadrupole instrument, the first mass analyser (Q1) filters ions, allowing only the precursor ion of the target analyte to pass. These selected ions are then fragmented in a collision cell (Q2), and the resulting product ions are analysed in the second mass analyser (Q3) [42]. The technique of selected reaction monitoring (SRM), where a specific precursor-product ion transition is monitored, provides an exceptionally selective signal for quantification [42]. For purity assessment, any deviation in the expected mass or fragmentation pattern across a chromatographic peak can be a definitive indicator of a co-eluting impurity.
Comparison of Detection Techniques
The following table compares LC-MS to other common detection techniques used in purity assessment:
Table 1: Comparison of Peak Purity Assessment Techniques
| Detection Technique | Basis of Detection | Advantages for Purity | Key Limitations for Purity |
|---|---|---|---|
| Diode-Array Detection (DAD) | UV-Vis spectral similarity [1] | Simple, widely available; good for impurities with different chromophores | Limited for structurally similar impurities with nearly identical spectra [1] |
| Coulometric Array Detection | Electrochemical response at different potentials [9] | High sensitivity; can differentiate redox-active compounds | Requires analytes to be electroactive; less universal than MS |
| LC-MS / LC-MS/MS | Mass-to-charge ratio (m/z) and fragmentation patterns [42] | High specificity based on molecular mass; can detect co-elutions of isobaric and similar compounds | Instrument cost and complexity; susceptible to matrix effects [43] |
Experimental Design and Methodologies
Sample Preparation Strategies
Proper sample preparation is critical for reliable LC-MS results and can range from simple to complex techniques, depending on the sample matrix and required sensitivity [42].
- Protein Precipitation: A simple and fast technique involving the addition of an organic solvent (e.g., acetonitrile) or acid to precipitate proteins from biological fluids like plasma or serum. After centrifugation, the supernatant can be injected directly or evaporated and reconstituted [42]. While rapid, it removes only a fraction of the matrix and may not be sufficient for very complex samples.
- Solid-Phase Extraction (SPE): A more selective technique where the analyte is retained on a sorbent while matrix components are washed away. The analyte is then eluted with a stronger solvent [42]. SPE produces cleaner sample extracts and can be used to concentrate the analyte, but it is more time-consuming and complex than protein precipitation.
- Liquid-Liquid Extraction (LLE) & Supported Liquid Extraction (SLE): These techniques separate hydrophobic analytes from an aqueous phase based on partitioning into an organic solvent. SLE performs this partition on a solid diatomaceous earth bed, offering higher throughput and cleaner extracts than traditional LLE [42].
An Internal Standard (IS), ideally a stable isotope-labeled analog of the analyte, must be added at the very beginning of sample preparation. The IS corrects for variability in sample preparation, injection, and ionization efficiency, ensuring the accuracy and precision of the results [44] [42].
Liquid Chromatography Considerations
Chromatographic separation remains the first line of defense against co-elution, even with the high specificity of MS detection.
- Mode of Chromatography: Reversed-phase chromatography is the most commonly used mode, where analytes interact with a hydrophobic stationary phase (e.g., C18) and are eluted with a mobile phase of increasing organic solvent (e.g., acetonitrile or methanol) [45] [42].
- Gradient Elution: Essential for complex samples with a wide range of analyte polarities, gradient elution ensures that all components are adequately retained and eluted with sharp peaks, improving sensitivity and the probability of separating potential impurities from the main peak [45].
- Column Selection: Short columns (10-15 cm) with small particle sizes (e.g., 1.7-2.6 µm) are often recommended for efficient separations and faster analysis times during method development [9] [44] [45].
Mass Spectrometric Parameters for Purity
To develop a method for purity assessment, key mass spectrometric parameters must be optimized.
- Ionization Source: Electrospray Ionization (ESI) is frequently used due to its effectiveness with a wide range of molecules, particularly in LC-MS-based bioanalysis [44] [42].
- Data Acquisition Modes:
- Full Scan/SIM: Useful for a untargeted screening of impurities, providing the full mass spectrum.
- Selected Reaction Monitoring (SRM): The gold standard for targeted, highly sensitive quantification. It enhances signal-to-noise ratio and is ideal for monitoring specific known impurities or degradants [42].
- Optimization: The instrument parameters, including source temperature, gas flows, and collision energy for fragmentation, must be optimized for the specific analyte(s) of interest to ensure maximum sensitivity and specificity [44].
The workflow below illustrates the typical process for developing and executing an LC-MS/MS-based purity assessment method.
Validation of the LC-MS Purity Method
For an LC-MS method to be relied upon for definitive purity assessment, especially in a regulated environment, it must be rigorously validated. Key performance characteristics, as outlined in international guidelines like ICH M10, must be demonstrated [44] [43] [45].
Table 2: Essential Validation Parameters for an LC-MS Purity Method
| Validation Parameter | Definition & Importance | Typical Acceptance Criteria |
|---|---|---|
| Specificity/SELECTIVITY | The ability to unequivocally assess the analyte in the presence of other components [43] [45]. Critical for proving the method can distinguish the API from impurities. | No interference from blank matrix, placebo, or known impurities at the retention time of the analyte [44]. |
| Accuracy | The closeness of the measured value to the true value [43]. Ensures impurity levels are correctly quantified. | Recovery within ±15% of the known concentration for impurities [43]. |
| Precision | The degree of agreement between a series of measurements [43]. | RSD ≤15% for repeated measurements of impurities [43]. |
| Linearity | The ability of the method to produce results proportional to analyte concentration [43]. | A correlation coefficient (r) of >0.99 over the validated range [43] [45]. |
| Limit of Quantification (LOQ) | The lowest concentration that can be reliably and accurately measured [43]. Defines the lowest level at which an impurity can be reported. | Signal-to-noise ratio ≥10:1; precision and accuracy within ±20% [43]. |
| Stability | The ability of the analyte to remain unchanged in the sample matrix under specific conditions [43]. Ensures integrity of samples during analysis. | Analyte response within ±15% of the initial value under defined storage conditions [43]. |
Advanced Techniques and Case Studies
Two-Dimensional Correlation Analysis Coupled with MS
When chromatographic separation is incomplete, advanced chemometric tools can aid in deconvoluting co-eluting signals. Two-dimensional correlation (2D-corr) analysis is one such technique, recently applied to chromatographic data from a multi-channel coulometric detector [9]. The synchronous contour plot can indicate the number of different components present in a peak, while the asynchronous plot can reveal the presence of overlapping species [9]. In a study of chili extracts, 2D-corr analysis suggested the presence of three co-eluting species in a single peak, which were subsequently identified by LC-MS as quinic acid, ascorbic acid, and phenylalanine [9]. This demonstrates a powerful workflow where a suspicion of impurity raised by one technique can be definitively confirmed and identified by LC-MS.
A Scientist's Toolkit: Essential Research Reagent Solutions
The following table details key reagents and materials essential for implementing a robust LC-MS purity method.
Table 3: Essential Reagents and Materials for LC-MS Purity Assessment
| Item | Function & Importance | Technical Notes |
|---|---|---|
| Stable Isotope-Labeled Internal Standard (e.g., Bu-d8) | Corrects for losses during sample prep and ion suppression/enhancement during MS analysis, improving accuracy and precision [44] [42]. | Ideally, the IS is an analyte analog labeled with ²H, ¹³C, or ¹⁵N, ensuring nearly identical chemical behavior. |
| HPLC-Grade Solvents & Mobile Phase Additives | Form the liquid mobile phase for chromatographic separation. Purity is critical to avoid background noise and contamination. | Use MS-grade solvents and additives (e.g., ammonium acetate, formic acid) to minimize ion suppression and instrument contamination [44]. |
| Certified Reference Standards | Provide a known concentration and identity for calibrating the instrument and confirming the identity of the target analyte and impurities. | Use certified reference materials (CRMs) from reputable suppliers to ensure traceability and accuracy [46]. |
| SPE Cartridges or LLE/SLE Materials | For selective sample clean-up and concentration of analytes, reducing matrix effects and improving method sensitivity [42]. | Select sorbent or solvent based on the chemical properties (e.g., pKa, lipophilicity) of the target analyte. |
Liquid Chromatography-Mass Spectrometry provides an unambiguous and definitive approach to peak purity assessment by leveraging the fundamental property of molecular mass. Its superior specificity over spectroscopic techniques makes it indispensable in modern pharmaceutical analysis for revealing co-eluting impurities, supporting forced degradation studies, and validating stability-indicating methods. A well-designed LC-MS method, incorporating appropriate sample preparation, chromatographic separation, and mass spectrometric detection, and rigorously validated according to regulatory guidelines, offers scientists the highest level of confidence in demonstrating the purity of their compounds, thereby ensuring the safety and quality of final drug products.
Conducting Forced Degradation Studies to Challenge Method Selectivity
In the pharmaceutical industry, demonstrating that an analytical method can accurately measure the active ingredient and its degradation products is a fundamental requirement for regulatory approval and patient safety. Forced degradation studies, also known as stress testing, are intentional experiments that expose a drug substance or product to harsh conditions to generate degradation products. The primary goal is to challenge the selectivity of the stability-indicating method, proving its ability to separate and quantify the analyte of interest from its impurities and degradation products under various stress conditions [1]. Within the broader context of High-Performance Liquid Chromatography (HPLC) validation research, these studies provide the critical evidence required to demonstrate peak purity—confirming that the measured peak for the active pharmaceutical ingredient (API) is not co-eluting with or obscured by other compounds [1] [2].
The ability to prove peak purity is not merely an academic exercise; it has direct consequences for drug safety and efficacy. History provides stark examples of the importance of detecting impurities, such as in the case of thalidomide, where one enantiomer was therapeutic while the other was a teratogen [1]. Modern regulatory guidelines, including those from the International Council for Harmonisation (ICH) and specific regional authorities like Brazil's ANVISA (RDC 964/2025), mandate forced degradation studies to justify the method's suitability for monitoring product quality throughout its shelf life [47]. This technical guide provides an in-depth exploration of how to design, execute, and interpret forced degradation studies to effectively challenge method selectivity and provide defensible evidence of peak purity.
Core Principles of Selectivity and Peak Purity
The Role of Selectivity in Chromatographic Separations
Selectivity (α) is a measure of a chromatographic system's ability to discriminate between different chemical compounds based on their differing physicochemical properties [48] [49]. It is quantitatively defined as the ratio of the capacity factors (k') for two adjacent peaks and is the most powerful factor in the master resolution equation for improving the separation between analytes [49]:
[ \alpha = \frac{k'2}{k'1} ]
Where (k'2) is the capacity factor of the later-eluting peak and (k'1) is the capacity factor of the earlier-eluting peak. A selectivity value of 1 indicates no separation, while values greater than 1 indicate separation. In the context of forced degradation, the aim is to develop a method with sufficient selectivity to resolve the API from all potential degradation products that may form under relevant stress conditions [49].
Defining and Assessing Peak Purity
Peak purity refers to the confirmation that a chromatographic peak represents a single chemical compound [1]. The most common tool for assessing peak purity is the photodiode array (PDA) detector, which captures full ultraviolet (UV) spectra across the entire peak [1] [2]. The underlying principle involves comparing spectra taken at different points across the peak (up-slope, apex, and down-slope) and assessing their similarity [1].
Commercial software typically assesses spectral similarity using one of two equivalent mathematical approaches [1]:
Spectral Contrast Angle (Cosine θ): The spectra are treated as vectors in n-dimensional space, and the angle between them is calculated. A pure peak will have a spectral contrast angle of zero degrees.
[ \cos \theta = \frac{\mathbf{a} \cdot \mathbf{b}}{\|\mathbf{a}\|\|\mathbf{b}\|} ]
Correlation Coefficient (r): After mean-centering the spectral data, the correlation coefficient between spectra is calculated, which is equivalent to the cosine of the spectral contrast angle.
[ r = \frac{\sum{i=1}^{n}(ai - \bar{a})(bi - \bar{b})}{\sqrt{\sum{i=1}^{n}(ai - \bar{a})^2 \sum{i=1}^{n}(b_i - \bar{b})^2}} ]
It is crucial to understand that these algorithms answer the question, "Does this chromatographic peak consist of compounds with a single spectroscopic signature?" rather than definitively proving the presence of only one compound [1]. Structurally similar impurities often have highly similar UV spectra, which can lead to false purity assessments. Therefore, peak purity data should never be used in isolation and must be supported by other orthogonal techniques and careful manual review of spectral overlays [1] [2].
Figure 1: A workflow diagram for peak purity assessment using a photodiode array (PDA) detector, highlighting the need for verification with orthogonal techniques.
Designing a Forced Degradation Study
Stress Conditions and Experimental Design
A well-designed forced degradation study subjects the API and the drug product to a range of stress conditions to simulate and accelerate the degradation that might occur over the product's shelf life. The ICH guidelines and related regional regulations (e.g., ANVISA RDC 964/2025) provide a framework for these studies [47]. The latest regulatory updates, such as RDC 964/2025, emphasize scientific justification over rigid rules, removing the previous obligation to achieve exactly 10% degradation of the API and allowing for exemptions with proper rationale [47]. The standard stress conditions include:
- Acidic Hydrolysis: Typically using 0.1-1 N HCl at elevated temperatures (e.g., 40-80°C) for several hours to several days [50] [51].
- Basic Hydrolysis: Using 0.1-1 N NaOH under similar temperature and time conditions as acid hydrolysis [50] [51].
- Oxidative Stress: Exposure to 1-3% hydrogen peroxide (H₂O₂) at room temperature or mildly elevated temperatures [50] [51]. Recent guidelines like RDC 964/2025 now also require auto-oxidation experiments using radical initiators, increasing the number of oxidation tests [47].
- Thermal Stress: Solid-state stability is assessed by exposing the API and drug product to dry heat (e.g., 50-110°C) for a defined period [50] [51].
- Photolytic Stress: Exposure to UV and/or visible light per ICH Q1B guidelines to determine photostability [50] [51].
The objective is to generate sufficient degradation (typically 5-20%) to create meaningful levels of degradation products for method challenge, without using excessively harsh conditions that could lead to irrelevant degradation pathways [47].
The Scientist's Toolkit: Essential Reagents and Materials
A successful forced degradation study requires carefully selected reagents and equipment. The following table details key research reagent solutions and their specific functions in the process.
Table 1: Key Research Reagent Solutions for Forced Degradation Studies
| Reagent/Material | Function in Forced Degradation | Typical Concentration/Range |
|---|---|---|
| Hydrochloric Acid (HCl) | Acidic hydrolysis to challenge ester and amide bonds. | 0.1 - 1.0 N [51] |
| Sodium Hydroxide (NaOH) | Basic hydrolysis to challenge ester and amide bonds. | 0.1 - 1.0 N [51] |
| Hydrogen Peroxide (H₂O₂) | Oxidative stress to challenge sulfide, thiol, and amine groups. | 1 - 3% v/v [51] |
| Radical Initiators | Auto-oxidation studies to simulate radical-mediated degradation, as per updated regulatory requirements. | Varies (e.g., AIBN) [47] |
| Buffer Salts | To prepare mobile phases at specific pH values for method development and optimization. | e.g., 50 mM Phosphate [51] [52] |
| HPLC Solvents | To prepare mobile phases and sample solutions (ACN, MeOH, Water). | HPLC Grade [50] [51] |
| Stationary Phases | Columns with different selectivities (C18, Cyano, Phenyl) to achieve separation. | 5 µm particle size common [50] [51] |
Analytical Method Considerations and Peak Purity Assessment
Developing the Stability-Indicating Method
The analytical method used for forced degradation studies must be "stability-indicating," meaning it can accurately quantify the API and resolve it from its degradation products [1]. Method development typically begins with screening columns of different selectivity and mobile phases at different pH values to find conditions that separate all components [1] [45]. The use of a Quality-by-Design (QbD) approach, utilizing method optimization software tools, is increasingly expected to ensure methods are robust from the start [1].
Reverse-phase HPLC with a C18 column is the most common starting point, but alternative phases like cyano or biphenyl can impart different selectivity, which is crucial for separating structurally similar compounds and isomers [49]. For example, a biphenyl phase can improve selectivity for aromatic analytes through pi-interactions [49]. The mobile phase composition, including the type of organic modifier (acetonitrile vs. methanol), buffer pH, and gradient profile, are systematically optimized to achieve baseline resolution ((R_s \geq 1.5)) between the API and all known degradation products [49] [45].
Practical Assessment of Peak Purity
Once a method is developed and stressed samples are analyzed, peak purity is assessed. With a PDA detector, this involves a careful review of both software-generated metrics (purity angle vs. threshold) and manual inspection of spectral overlays [1] [2]. Best practices include:
- Proper Baseline Setting: Ensure the software correctly identifies the start and end of the peak to avoid baseline noise skewing the purity results [1].
- Review Spectral Overlays: Visually inspect the overlaid spectra from the up-slope, apex, and down-slope of the peak. Any noticeable differences indicate potential co-elution [2].
- Understand Limitations: Be aware that impurities with very similar UV spectra to the API (common with structurally related degradation products) may not be detected by spectral comparison alone [1].
When PDA data is inconclusive or when higher confidence is required, orthogonal techniques should be employed:
- Liquid Chromatography-Mass Spectrometry (LC-MS): Provides definitive peak purity assessment based on mass differences rather than UV spectra. It is particularly powerful for identifying unknown degradation products and confirming co-elution [2].
- Two-Dimensional Liquid Chromatography (2D-LC): Offers a robust solution by separating compounds on two different columns with orthogonal separation mechanisms, virtually guaranteeing that any co-eluting peaks from the first dimension are resolved in the second [1].
- Two-Dimensional Correlation Analysis (2D-corr): A chemometric approach that can be applied to data from multi-channel detectors (e.g., coulometric array detectors) to reveal the presence of overlapping species in a chromatographic peak by analyzing synchronous and asynchronous contour plots [9].
Case Studies and Data Presentation
Case Study: Mesalamine Tablets
A 2025 study developed a robust stability-indicating RP-HPLC method for mesalamine in formulated products [50]. The method used a C18 column with a methanol:water (60:40 v/v) mobile phase and UV detection at 230 nm. Forced degradation was performed, and the method demonstrated excellent linearity (10-50 µg/mL, R² = 0.9992), precision (%RSD < 1%), and accuracy (recoveries of 99.05-99.25%). The results of the forced degradation studies are summarized in the table below.
Table 2: Forced Degradation Results for Mesalamine (Mesacol, 800 mg) [50]
| Stress Condition | Details | Degradation Observed | Peak Purity of Mesalamine |
|---|---|---|---|
| Acidic Hydrolysis | Not specified | Yes | Confirmed (Method specific) |
| Basic Hydrolysis | Not specified | Yes | Confirmed (Method specific) |
| Oxidative Stress | Not specified | Yes | Confirmed (Method specific) |
| Thermal Stress | Not specified | Yes | Confirmed (Method specific) |
| Photolytic Stress | Not specified | Yes | Confirmed (Method specific) |
| Commercial Tablet Assay | N/A | N/A | 99.91% Recovery |
Case Study: Efonidipine HCl and Metoprolol Succinate
A recent 2025 study developed a simultaneous quantification method for Efonidipine HCl Ethanolate (EFO) and Metoprolol Succinate (MET) [51]. The method used a C18 column with a ternary mobile phase of ACN:methanol:phosphate buffer (pH 3.5) and a PDA detector. Forced degradation studies were conducted, and the results demonstrated the method's selectivity.
Table 3: Forced Degradation Results for EFO and MET [51]
| Stress Condition | Details | EFO Degradation | MET Degradation | Method Selectivity |
|---|---|---|---|---|
| Acidic Hydrolysis | 1 N HCl | Yes | Yes | Maintained |
| Basic Hydrolysis | 1 N NaOH | Yes | Yes | Maintained |
| Oxidative Stress | 3% H₂O₂ | Yes | Yes | Maintained |
| Thermal Stress | 110°C for 3 h | No | No | Maintained |
| Photolytic Stress | UV light | No | No | Maintained |
The study successfully validated the method as per ICH Q2(R2) guidelines, proving its reliability for routine analysis and stability studies [51].
Regulatory and Practical Considerations
Meeting Regulatory Standards
Forced degradation studies are a regulatory expectation outlined in ICH guidelines (Q1A, Q1B, Q3A-Q3D) and regional regulations like ANVISA's RDC 964/2025 [1] [47]. The latest trends in regulation emphasize:
- Scientific Justification: Moving away from fixed degradation targets (e.g., 10% degradation) towards a science-based rationale for the extent of degradation and the conditions used [47].
- Comprehensive Reporting: Requiring proof that the stability-indicating method is suitable and that chromatographic peaks are pure [47].
- Mass Balance: The process of adding the assay value of the API and the levels of all degradation products, should be close to 100%. Modern guidelines allow for more scientific justifications to explain mass balance deviations, often supported by predictive software tools [47].
Troubleshooting Selectivity and Purity Issues
Even with careful development, methods can face selectivity challenges. A systematic diagnostic checklist can be used to investigate issues [48]:
- Verify Mobile Phase and pH: Small pH changes, especially near the pKa of analytes, can drastically alter selectivity. Prepare mobile phases gravimetrically for accuracy [48].
- Confirm Correct Stationary Phase: Even different batches of the same nominal phase (e.g., C18) from the same manufacturer can exhibit different selectivity. Always use the specified column [48].
- Check Column Temperature: Temperature fluctuations can affect selectivity, particularly for ionogenic analytes [48].
- Investigate Instrument Dwell Volume: Differences in the dwell volume (system volume) between HPLC instruments can cause shifts in retention time and selectivity in gradient methods [48].
Forced degradation studies are a critical component of HPLC method validation, serving as the ultimate challenge to a method's selectivity and its ability to demonstrate peak purity. A well-executed study, designed with current regulatory expectations in mind, provides confidence that the method will reliably monitor the quality and stability of a drug product throughout its lifecycle. By combining robust chromatographic separation with rigorous peak purity assessment using PDA detection and, when necessary, orthogonal techniques like LC-MS, scientists can generate defensible data that ensures patient safety and meets global regulatory standards. The field continues to evolve with advances in predictive software, sophisticated chemometric tools, and more nuanced regulatory guidance, all aimed at fostering a deeper scientific understanding of drug degradation behavior.
In high-performance liquid chromatography (HPLC) method validation for pharmaceutical analysis, demonstrating that a method is stability-indicating is a fundamental regulatory requirement. A core aspect of this demonstration is peak purity assessment—verifying that the active pharmaceutical ingredient (API) peak is pure and free from coeluting impurities or degradants [24]. Single-dimension HPLC with diode array detection (DAD) is often used for peak purity but faces inherent limitations, including the inability to differentiate impurities with similar spectra or those present at low levels relative to the API [53] [54].
Orthogonal techniques employing different separation mechanisms or detection principles are essential to overcome these limitations and provide definitive proof of peak purity. This guide explores two powerful orthogonal approaches: two-dimensional liquid chromatography (2D-LC) and method spiking. These techniques provide complementary evidence for method specificity, ensuring the accurate quantification of APIs and the reliable detection of impurities throughout the drug product lifecycle.
Two-Dimensional Liquid Chromatography (2D-LC) for Peak Purity
Fundamental Principles and Instrumentation
Two-dimensional liquid chromatography (2D-LC) significantly enhances separation power by coupling two independent separation mechanisms. In a 2D-LC system, fractions of effluent from the first dimension (1D) column are transferred—or "heart-cut"—via a valve interface to a second dimension (2D) column for further separation [54]. The key to success is orthogonality, where the two separation dimensions employ different selectivities, such as different stationary phases or mobile phase pH, to resolve compounds that coelute in a single dimension [53] [55].
Table 1: 2D-LC System Components and Their Functions
| System Component | Function in 2D-LC Analysis |
|---|---|
| First Dimension Pump | Delivers mobile phase for the primary separation. |
| Second Dimension Pump | Provides rapid gradient elution for the 2D separation. |
| Interface Valve with Loops | Heart-cuts 1D effluent fractions for transfer to the 2D column. |
| 1D Detector | Monitors the initial chromatographic separation. |
| 2D Detector | Detects analytes after the second separation; often a DAD or MS. |
A common instrumental setup involves an eight-port, two-position valve equipped with two sample loops. This configuration allows one loop to be filled with 1D effluent while the other loop's contents are being injected and separated on the 2D column, enabling continuous operation [54]. The following diagram illustrates this workflow:
Diagram 1: 2D-LC Instrument Workflow (Total Width: 760px)
Developing an Effective 2D-LC Screening Platform
Developing a robust 2D-LC method for peak purity requires careful selection of conditions for both dimensions to maximize orthogonality.
- First Dimension (1D) Separation: Typically uses the primary HPLC method for assay and impurities. Its role is to perform the initial separation under standardized conditions [53] [56].
- Second Dimension (2D) Separation: The goal is to achieve different selectivity. This can be done by changing the column chemistry and/or mobile phase composition while remaining in reversed-phase mode for practicality [53]. Research indicates that screening a set of four columns with four different volatile mobile phases can adequately cover the selectivity space for method development [55].
For the 2D separation, using a column with no ionic functionality (e.g., a C8 or C18) and an ammonium acetate mobile phase buffered at pH 5 has been shown to provide good selectivity for isomers at 25°C [55]. The 2D separation must be fast to keep pace with the 1D analysis, often employing short columns (e.g., 50 mm length) with small particles and steep gradients [53].
Experimental Protocol for Peak Purity Assessment
The following workflow, used by industry leaders like Janssen Pharmaceuticals, ensures comprehensive peak purity assessment [56]:
- Forced Degradation: Stress the drug product sample using acid, base, peroxides, heat, and light to generate degradants.
- 1D Analysis: Inject the stressed sample onto the 1D column (the primary method).
- Heart-Cutting: Transfer one or multiple fractions from the apex and shoulders of the API peak from the 1D effluent to the 2D column via the interface valve. Cutting the peak into several pieces helps pinpoint where coelution might occur [56].
- 2D Separation: Separate the heart-cut fraction on the orthogonal 2D column.
- Purity Assessment: Analyze the resulting 2D chromatogram. A single peak indicates a pure API in the 1D method. Multiple peaks confirm coelution of impurities with the API.
Application Examples and Performance Data
2D-LC has proven effective in solving challenging peak purity issues that other techniques cannot.
- Detecting Low-Level Impurities: In one case, 2D-LC was used to detect and identify a bromo-substituted API impurity coeluting in the tail of the main chloro-substituted API peak at a level below 0.05%. The impurity was undetectable by the 1D method alone but was clearly resolved and identified by MS in the second dimension [54].
- Resolving Isomers and Enantiomers: 2D-LC is uniquely capable of resolving stereoisomers that have identical spectral and mass properties. A heart-cut 2D-LC method using an achiral 1D column and a chiral 2D column successfully separated phenylalanine enantiomers for accurate quantitation [54].
- Analysis of Complex Matrices: A 2D-LC method was developed for detecting toxic Gelsemium alkaloids in honey, a complex matrix. The method demonstrated excellent performance, as summarized below [57]:
Table 2: Performance Data of a 2D-LC Method for Alkaloids in Honey
| Validation Parameter | Result for Gelsemine, Koumine, and Humantenmine |
|---|---|
| Correlation Coefficient (r) | > 0.998 |
| Recovery | 81.0% – 94.2% |
| Intra-day Precision (RSD) | ≤ 5.0% |
| Inter-day Precision (RSD) | ≤ 3.8% |
| Limit of Detection (LOD) | 2 ng/g |
| Limit of Quantification (LOQ) | 5 ng/g (Gelsemine, Koumine); 20 ng/g (Humantenmine) |
Method Spiking for Accuracy and Specificity
Principles and Purpose of Spike Recovery
Spike recovery experiments are a cornerstone of analytical method validation, primarily used to demonstrate accuracy—the closeness of test results to the true value [24] [58]. In this context, accuracy is determined by spiking a known quantity of a reference standard of the analyte (e.g., the API or a known impurity) into a blank or placebo matrix and measuring the percentage of the analyte recovered by the method [24]. Acceptable recovery demonstrates that the method is accurate and that the matrix does not interfere with the quantification of the analyte.
Detailed Experimental Protocol for Spiking
The following protocol outlines a standard approach for conducting spike recovery studies for a drug product formulation, as commonly applied in pharmaceutical quality control [58].
Sample Preparation:
- Placebo Mixture: Mix and crush at least 20 dosage units of the placebo (formulation without API) to create a homogeneous powder.
- Spiking Levels: Weigh the placebo powder at three concentration levels: 80%, 100%, and 120% of the target test concentration. Prepare three samples at each level.
- Spiking: Add (spike) known amounts of the analyte reference standard to the placebo samples at a 1:1 ratio.
- Extraction and Analysis: Process the samples using the validated method (e.g., extraction, dilution) and analyze by HPLC.
Calculation:
- The recovery percentage for each sample is calculated as: (Measured Concentration / Spiked Concentration) × 100%.
- The mean recovery and relative standard deviation (RSD) across all samples (typically nine determinations) are then calculated.
Acceptance Criteria:
Diagram 2: Spike Recovery Workflow (Total Width: 760px)
Limitations and Critical Considerations
While spike recovery is a required validation parameter, scientists must be aware of its limitations. A critical pitfall is that good spike recovery does not necessarily prove that native analytes are fully extracted from the sample matrix.
An illustrative study on rhubarb components showed that while spike recoveries for aloe-emodin, rhein, and emodin were acceptable (97%-103%), the actual extraction efficiencies of the native analytes from the plant material were unacceptably low (73%-94%) over various extraction durations [60]. This discrepancy occurs because spiked pure standards are only deposited on the surface of an already-processed sample and do not experience the same strong matrix interactions as native analytes embedded within the sample.
Therefore, for methods involving complex matrices like medicinal herbs, extraction efficiency of native analytes must be tested separately to ensure spike recovery truly represents the method's accuracy [60]. If recovery values fall outside acceptance criteria (e.g., 80-120%), the cause must be investigated, which may include matrix interference, inadequate extraction, or instability of the analyte [59].
The Scientist's Toolkit: Essential Research Reagent Solutions
Successful implementation of orthogonal techniques requires careful selection of materials and reagents. The following table details key solutions used in the experiments cited within this guide.
Table 3: Key Research Reagent Solutions for Orthogonal HPLC Techniques
| Reagent Solution | Function and Application |
|---|---|
| PRS Cation Exchange Cartridge | Solid-phase extraction (SPE) sorbent for purifying complex samples like honey; selectively retains basic compounds like alkaloids [57]. |
| Oasis HLB Cartridge | A reversed-phase SPE sorbent for general sample clean-up and extraction of a wide range of analytes from aqueous matrices [57]. |
| Ammonium Acetate Buffer (pH 4.5, 6.8) | A volatile buffer compatible with MS detection; provides pH control for orthogonal separations in 2D-LC, influencing ionization and selectivity of ionizable APIs [53] [55]. |
| Trifluoroacetic Acid (TFA) / Water | A common ion-pairing agent and mobile phase additive in reversed-phase HPLC; often improves peak shape for peptides and large molecules but can reduce selectivity differences between columns [53] [55]. |
| Forced Degradation Solutions (1M HCl, 1M NaOH, 10% H₂O₂) | Chemical stressors used in specificity studies to generate degradation products and demonstrate the stability-indicating property of the method [58]. |
Orthogonal techniques are non-negotiable for demonstrating unimpeachable peak purity and method specificity in modern HPLC validation. Two-dimensional liquid chromatography provides a direct, powerful means to physically separate and identify coeluting impurities that are invisible to traditional single-dimension methods. Method spiking, while a fundamental accuracy test, must be applied and interpreted with a clear understanding of its potential limitations regarding native analyte extraction.
Used in concert, 2D-LC and rigorous spiking protocols provide a comprehensive orthogonal strategy. This strategy delivers the robust scientific evidence required to ensure the safety and efficacy of pharmaceutical products by guaranteeing that analytical methods can reliably monitor and quantify the API in the presence of impurities and degradants throughout the product's shelf life.
Overcoming Common Peak Purity Challenges and False Results
Identifying and Resolving False Positives and False Negatives
This technical guide examines the critical challenge of false positives and false negatives in High-Performance Liquid Chromatography (HPLC) analysis, with a specific focus on demonstrating peak purity in pharmaceutical method validation. Ensuring accurate peak purity assessment is fundamental to drug safety and efficacy, as undetected coelutions can lead to inaccurate quantification of active ingredients and impurities [1].
Core Concepts and Impact on Peak Purity
In HPLC validation, the concepts of false positives and false negatives are directly tied to the reliability of peak purity assessments.
A false positive occurs when a peak is incorrectly flagged as impure, suggesting a coelution that does not exist. This can trigger unnecessary method redevelopment, leading to resource waste and project delays. Conversely, a false negative is a more dangerous scenario where an impure peak, containing a coeluting compound, is incorrectly classified as pure. This can have severe consequences, including inaccurate quantification of the main active component and failure to detect potentially harmful impurities or degradation products [1].
The reliability of peak purity assessment is a cornerstone of method validation, particularly for stability-indicating methods in pharmaceutical analysis. The goal is to develop a method that is specific enough to distinguish the active ingredient from impurities, degradants, and excipients [45]. The presence of structurally similar impurities, such as degradation products, makes this task particularly challenging, as their spectral signatures can be nearly identical [1].
Detection Methodologies and Instrumentation
Photodiode Array (PDA) Detection
The most common tool for peak purity assessment is the photodiode array (PDA) detector, which captures UV spectra across a chromatographic peak [2]. The theoretical basis relies on comparing spectra from different parts of a peak (up-slope, apex, down-slope) to identify spectral variations indicative of coelution [1].
Commercial software quantifies this spectral similarity using algorithms based on vector analysis. Each spectrum is treated as a vector in n-dimensional space, and the angle (θ) between vectors or the correlation coefficient (r) is calculated [1]. A perfect match (θ = 0°, r = 1.000) suggests a pure peak, while significant deviations suggest impurity.
Limitations of PDA: A fundamental limitation is that PDA assesses spectral purity, not chemical purity. It can only answer whether compounds within a peak have identical spectroscopic signatures [1] [2]. Two coeluting compounds with nearly identical UV spectra, a common scenario with structurally similar impurities, can produce a false negative. Furthermore, baseline noise and low detector sensitivity, especially at shorter UV wavelengths, can cause false positives [2].
Mass Spectrometry (MS) Detection
Liquid chromatography-mass spectrometry (LC-MS) provides a more definitive peak purity assessment by separating compounds based on their mass-to-charge ratio (m/z) rather than UV spectral profiles [2]. The ability to detect ions unique to different chemical compounds makes LC-MS a powerful orthogonal technique for confirming peak purity, as it can identify coelutions that PDA cannot discern [61].
Advanced and Orthogonal Techniques
For complex separations where one-dimensional chromatography is insufficient, two-dimensional liquid chromatography (2D-LC) can be employed. This technique significantly increases peak capacity by subjecting the effluent from the first column to a second, orthogonally selective separation [1]. In non-targeted screening, advanced prioritization strategies, such as chemistry-driven or prediction-based prioritization, help manage complex data and reduce misidentification [61].
Table 1: Comparison of Peak Purity Detection Techniques
| Technique | Principle of Operation | Key Strengths | Inherent Limitations |
|---|---|---|---|
| PDA/UV Detection | Spectral similarity comparison across a peak [1] | Universal, cost-effective, standard in most HPLC systems [2] | Cannot distinguish coeluting compounds with identical/similar spectra [1] |
| Mass Spectrometry (LC-MS) | Detection based on mass-to-charge ratio (m/z) [2] | High specificity, can identify coelutions invisible to UV [2] | Higher cost, complex operation, not all compounds ionize equally [39] |
| 2D-LC | Two sequential, orthogonal separations [1] | Dramatically increased peak capacity for complex mixtures [1] | Method complexity, longer analysis times, requires specialized instrumentation |
Troubleshooting and Resolution Strategies
Effectively managing false positives and negatives requires a systematic approach to both method development and data review.
Optimizing Chromatographic Separation
The most robust solution to coelution is to prevent it through method optimization.
- Adjust Mobile Phase: Modifying the composition, pH, or buffer concentration can significantly alter selectivity and resolve peaks [2] [45].
- Modify Gradient Program: Optimizing the gradient profile can improve separation, especially for samples with a wide range of analyte polarities [45].
- Change Column Selectivity: Switching to a column with different stationary phase chemistry (e.g., C8 vs. C18, or using a different manufacturer's phase) is one of the most effective ways to resolve coelutions [1] [62].
Refining Detection and Data Analysis
When coelution is suspected, refining the detection strategy is crucial.
- Manual Spectral Review: Never rely solely on software-generated purity scores. Visually inspect overlaid spectra from the up-slope, apex, and down-slope of the peak for subtle differences [2].
- Optimize PDA Parameters: Select appropriate wavelength ranges (e.g., 210-400 nm instead of 190-400 nm) to minimize noise-induced false positives [2]. Ensure proper baseline subtraction before analysis [1].
- Apply Orthogonal Detection: Use LC-MS to confirm or refute PDA-based purity findings. The combination of techniques provides higher confidence [2].
Correcting Quantification Bias
In fields like extractables and leachables (E&L), variability in detector response factors (RFs) can lead to significant quantification bias and false negatives. The RRFlow model has been proposed to address this. It uses relative response factors (RRFs) to rescale concentrations, more accurately reflecting the true amount of an analyte present and reducing both false positives and false negatives compared to traditional methods that use an uncertainty factor (UF) alone [63].
Diagram 1: Decision workflow for resolving peak purity uncertainties.
Experimental Protocols for Robust Peak Purity Demonstration
Forced Degradation Studies
Forced degradation studies are a critical component of method validation for demonstrating specificity and the stability-indicating nature of a method [1] [45]. These studies involve stressing the drug substance or product under conditions such as acid, base, oxidative, thermal, and photolytic stress to generate potential degradation products [1] [39].
Protocol:
- Sample Preparation: Expose the sample to various stress conditions. For acid/base degradation, this typically involves heating (e.g., 80°C) in 1 N HCl or 1 N NaOH for a defined period (e.g., 1 hour) [39].
- Neutralization and Analysis: Neutralize the stressed samples and analyze them using the developed HPLC method alongside an unstressed control.
- Peak Purity Assessment: Perform peak purity analysis using PDA on the main peak from all stressed samples to ensure no coeluting degradation products are present [1]. The method is considered specific if the analyte peak is pure and free from interference from degradation products or excipients [45].
Method Validation Parameters
A comprehensive method validation protocol is essential to establish that the HPLC method is reliable for its intended purpose. Key parameters defined by ICH guidelines include [45]:
Table 2: Key Method Validation Parameters to Minimize False Results
| Validation Parameter | Objective | Protocol Summary | Role in Managing False Results |
|---|---|---|---|
| Specificity | To prove that the method can assess the analyte without interference [45] | Analyze blank, placebo, standard, and forced degradation samples. Demonstrate peak purity of the analyte [45]. | Directly confirms the method's ability to distinguish the analyte, reducing false positives/negatives. |
| Linearity & Range | To demonstrate proportional response to analyte concentration [45] | Prepare and analyze analyte at a minimum of 5 concentrations. Calculate correlation coefficient (R²) [39]. | Ensures accurate quantification, preventing false results due to detector saturation or insensitivity. |
| Accuracy | To establish agreement between measured and true value [45] | Spike placebo with known analyte amounts (e.g., 80%, 100%, 120%). Calculate percent recovery [39]. | Validates that the method does not systematically over/under-estimate content. |
| Precision | To demonstrate the closeness of repeated measurements [45] | Perform multiple injections of a homogeneous sample (repeatability) and/or by different analysts/days (intermediate precision) [45]. | Quantifies random error, ensuring results are reproducible and not anomalous. |
| Robustness | To measure method resilience to small parameter changes [39] | Deliberately vary parameters like flow rate (±0.1 mL/min), column temperature (±2°C), mobile phase pH (±0.1) [39]. | Identifies critical method parameters that, if uncontrolled, could lead to coelution (false negative). |
The Scientist's Toolkit: Essential Reagents and Materials
Table 3: Key Research Reagent Solutions for HPLC Method Validation
| Item | Function/Application | Example from Literature |
|---|---|---|
| C18 Reverse Phase Column | The most common stationary phase for retaining and separating non-polar to moderately polar analytes [45]. | Inertsil ODS-3 V column (4.6 x 250 mm, 5 µm) used for carvedilol analysis [39]. |
| HPLC-Grade Solvents & Buffers | To prepare mobile phase with high purity and minimal UV background noise, crucial for sensitivity and accurate peak purity [62]. | Acetonitrile and 0.02 mol/L potassium dihydrogen phosphate (pH 2.0) used in a gradient elution for carvedilol [39]. |
| Reference Standards | Highly purified compounds used to identify and quantify target analytes and impurities [45]. | Carvedilol and impurity C standards sourced from National Institutes for Food and Drug Control (NIFDC) [39]. |
| Forced Degradation Reagents | Chemicals used to intentionally degrade the drug substance to validate method specificity [39]. | 1 N Hydrochloric Acid (HCl), 1 N Sodium Hydroxide (NaOH), 3% Hydrogen Peroxide (H₂O₂) [39]. |
Optimizing Chromatographic Conditions to Resolve Co-eluting Peaks
In high-performance liquid chromatography (HPLC) method development for pharmaceutical analysis, the phenomenon of co-elution presents a fundamental challenge that directly impacts the reliability of analytical results. Co-elution occurs when two or more compounds do not separate chromatographically, potentially leading to inaccurate quantification and misidentification of impurities [17]. Within the context of drug development and validation research, demonstrating peak purity—providing evidence that a chromatographic peak comprises a single chemical entity—is paramount for ensuring product safety and efficacy [1]. The presence of undetected impurities due to co-elution can have significant consequences, as illustrated by historical examples where different enantiomers of the same compound produced markedly different biological effects, ranging from therapeutic benefit to toxicity [1]. This technical guide provides an in-depth examination of systematic approaches for resolving co-eluted peaks, with particular emphasis on strategies for demonstrating peak purity within HPLC method validation frameworks.
Theoretical Foundations of Chromatographic Resolution
The Resolution Equation and Its Components
Chromatographic resolution (Rs) quantitatively measures the separation between two peaks and is defined by a fundamental equation that describes the relationship between efficiency, selectivity, and retention [64] [65]:
Rs = (√N/4) × [(α - 1)/α] × [k2/(1 + k2)]
Where:
- N is the column plate number representing column efficiency
- α is the selectivity factor (ratio of capacity factors for closely eluting peaks)
- k is the retention (capacity) factor for the more retained compound [65]
This equation reveals that resolution is governed by three distinct parameters: efficiency (N), which affects peak width; selectivity (α), which determines the relative spacing between peaks; and retention (k), which controls how long analytes remain on the column [64] [65]. Understanding these independent contributions is essential for developing a systematic approach to resolving co-eluting peaks.
Peak Purity Assessment Fundamentals
Peak purity assessment determines whether a chromatographic peak consists of a single component or multiple co-eluted compounds. The most common approach utilizes photodiode array (PDA) detection, which collects ultraviolet-visible spectra at multiple points across the peak [1] [3] [2]. The theoretical basis for spectral peak purity assessment treats each spectrum as a vector in n-dimensional space, where n is the number of data points in the spectrum [1]. Spectral similarity is quantified by calculating the angle between vectors representing spectra from different regions of the peak, typically expressed through two key parameters:
- Purity Angle: A numerical representation of spectral variation across the peak
- Purity Threshold: A reference value derived from baseline noise, representing the maximum allowed variation for a peak to be considered pure [3]
A peak is generally considered pure when the purity angle is less than the purity threshold [3]. It is crucial to recognize that this approach answers whether a peak contains compounds with identical spectroscopic signatures, not necessarily whether it contains a single chemical compound [1]. This distinction highlights the importance of orthogonal detection methods for definitive peak purity confirmation.
Systematic Optimization Strategies for Resolving Co-eluting Peaks
Adjusting Selectivity (α) Parameters
Selectivity manipulation represents the most powerful approach for resolving co-eluting peaks, as it directly affects the relative spacing of compounds in the chromatogram [64].
Mobile Phase Composition Modifications:
- Organic Modifier Selection: Changing the organic modifier can significantly alter selectivity. When acetonitrile fails to provide adequate separation, switching to methanol or tetrahydrofuran frequently improves resolution. Figure 4 provides solvent strength relationships to estimate equivalent concentrations when changing modifiers [64].
- pH Optimization: For ionizable compounds, adjusting mobile phase pH can dramatically impact retention and selectivity. Using buffers instead of pure water enables precise pH control, which can alter the ionization state of analytes and consequently their interaction with the stationary phase [64].
- Buffer Concentration and Ionic Strength: Modifying buffer concentration and ionic strength can fine-tune separations, particularly for ionic compounds, by affecting the solvation of analytes and their interaction with the stationary phase [66].
Stationary Phase Modifications:
- Bonded Phase Chemistry: Changing the bonded ligand on the stationary phase surface represents one of the most effective approaches to altering selectivity. Different functional groups (C8, C18, phenyl, cyano, amino) interact differently with various analyte structures [64].
- Pore Size Considerations: For high molecular weight compounds such as proteins, larger pore size packings (e.g., 300Å instead of 100Å) may be necessary to facilitate access to the stationary phase surface [64].
Table 1: Selectivity Optimization Parameters and Their Applications
| Parameter | Adjustment | Mechanism | Typical Applications |
|---|---|---|---|
| Organic Modifier | Acetonitrile → Methanol → THF | Changes solvent polarity and specific interactions | General reversed-phase applications, especially for compounds with differing polarity |
| Mobile Phase pH | ±1-2 pH units | Alters ionization state of ionizable compounds | Acids, bases, amphoteric compounds |
| Buffer Concentration | 5-50 mM | Modifies ionic interactions with stationary phase | Ionic compounds, ion-pairing applications |
| Stationary Phase | C18 → Phenyl → Cyano | Changes chemical functionality for different interactions | Structural isomers, compounds with specific functional groups |
Enhancing Efficiency (N) Parameters
Column efficiency improvements can resolve moderately overlapped peaks by reducing peak width, thereby decreasing overlap [64].
Particle Size Optimization:
- Columns with smaller particles (e.g., sub-2μm) produce higher plate numbers, resulting in sharper peaks that are more easily resolved [64] [66]. As demonstrated in Figure 1, resolution increased from approximately 0.8 to 1.25 when using smaller particles under otherwise identical conditions [64].
- Solid-core or fused-core particles provide high efficiency with lower backpressure compared to totally porous particles, allowing for improved resolution without exceeding instrument pressure limits [64].
Column Dimensions and Temperature:
- Column Length: Increasing column length enhances resolution by providing more theoretical plates. As shown in Figure 2, doubling column length from 100mm to 200mm improved separation of a protein digest, evidenced by a 40% increase in peak capacity [64].
- Column Temperature: Elevated temperatures reduce mobile phase viscosity and increase diffusion rates, enhancing efficiency. Figure 3 demonstrates that increasing temperature from 70°C to 100°C eliminated overlap of peaks 3 and 4 in a separation of amyloid β peptides [64]. For small molecules, temperatures of 40-60°C are recommended, while 60-90°C may be appropriate for larger molecules [64].
Table 2: Efficiency Optimization Parameters and Their Effects
| Parameter | Adjustment | Effect on Efficiency | Practical Considerations |
|---|---|---|---|
| Particle Size | Reduce from 5μm to 1.7μm | Increases plate count significantly | Higher backpressure; requires UHPLC instrumentation |
| Column Length | Increase length 50-100% | Linear increase in plate number | Increased analysis time and backpressure |
| Column Temperature | Increase 10-30°C | Reduces viscosity, improves mass transfer | Potential thermal degradation of analytes |
| Flow Rate | Adjust to Van Deemter minimum | Optimizes efficiency for given particle size | Lower flow increases analysis time |
Comprehensive Optimization Workflow
The following diagram illustrates a systematic approach to resolving co-eluting peaks:
Systematic Optimization Workflow for Resolving Co-eluting Peaks
Advanced Technical Approaches for Complex Separations
Peak Purity Assessment Methodologies
Photodiode Array (PDA) Detection:
- Spectral Acquisition: Collect UV-visible spectra at multiple points across the peak (start, apex, end) using a PDA detector [3]. The software compares these spectra to identify variations that may indicate co-elution.
- Spectral Contrast Angle: Calculate the angle between vectors representing spectra from different regions of the peak. A greater angle indicates higher spectral dissimilarity and potential co-elution [1]. As illustrated in Figure 2, even similar spectra of isomeric compounds (angelicin and psoralen) showed a measurable spectral contrast angle of 11.4° [1].
- Baseline Considerations: Proper baseline selection is critical for accurate purity assessment. The baseline should run from peak start to stop limits, and spectra should be mean-centered before comparison to eliminate concentration-dependent effects [1].
Mass Spectrometry Detection:
- LC-MS provides a more definitive assessment of peak purity by detecting co-elution based on mass differences rather than UV spectral variations [2]. This is particularly valuable for compounds with similar UV spectra but different molecular weights.
- MS detection enables identification of low-level contaminants that may not significantly affect UV spectral shape but could impact product quality or safety [2].
Computational Peak Deconvolution:
- Algorithmic Approaches: Advanced computational methods can mathematically resolve co-eluted peaks. The exponentially modified Gaussian (EMG) function is commonly used for peak deconvolution [17].
- Functional Principal Component Analysis (FPCA): This method detects sub-peaks with the greatest variability, providing multidimensional peak representation that helps preserve differences between experimental variants [17].
- Clustering Methods: Hierarchical clustering can separate convolved fragments of chromatograms into groups consisting of similar peaks based on shape, enabling identification of co-eluted compounds across multiple chromatograms [17].
Method Validation Considerations for Peak Purity
Within pharmaceutical method validation, demonstrating specificity—the ability to unequivocally assess the analyte in the presence of potential impurities—is fundamental [67] [8]. Key approaches include:
- Forced Degradation Studies: Subject the drug substance to stress conditions (acid, base, oxidation, heat, light) to generate degradation products, then demonstrate separation of the analyte from these products [1] [8].
- Resolution Monitoring: Quantitatively demonstrate resolution between closely eluting peaks, particularly the analyte and its known impurities or degradation products. As shown in the furosemide method validation, resolution values should meet acceptance criteria (typically Rs > 2.0) for all critical pairs [8].
- Peak Homogeneity: Use PDA or MS to demonstrate peak homogeneity across the entire peak profile, confirming the absence of co-eluting compounds [1] [2].
Experimental Protocols and Case Studies
Detailed Method Development Protocol
Initial Scouting and Optimization:
- Column Screening: Evaluate 3-4 columns with different selectivities (e.g., C18, phenyl, cyano) using a standardized gradient method [68].
- Mobile Phase Optimization: Screen different pH conditions (e.g., pH 3, 5, 7) and organic modifiers (acetonitrile, methanol) to identify optimal selectivity [64] [68].
- Temperature Optimization: Evaluate separation at multiple temperatures (e.g., 30°C, 40°C, 50°C) to identify potential efficiency improvements [64].
Systematic Parameter Refinement:
- Gradient Optimization: Fine-tune gradient slope and shape to maximize resolution of critical pairs while minimizing analysis time.
- Flow Rate Adjustment: Optimize flow rate based on Van Deemter considerations for the specific particle size being used [66].
- Injection Volume Optimization: Ensure injection volume is 1-2% of total column volume to avoid mass overload effects that degrade resolution [66].
Case Study: Furosemide Method Development
A recent study developing an HPLC method for simultaneous quantification of furosemide (FUR), its degradation product (FUR-B), and preservatives (methylparaben and propylparaben) provides an excellent case study in systematic optimization [8]:
Experimental Conditions:
- Columns Tested: Kinetex C18 and Symmetry C18
- Mobile Phases: 0.1% acetic acid in water:acetonitrile in ratios of 70:30 and 60:40 (v/v)
- Detection: PDA at 272 nm (optimized for FUR-B sensitivity)
- Flow Rates: 0.5 mL/min and 1.0 mL/min
Results and Optimization Decisions: The Kinetex C18 column with mobile phase 70:30 at 0.5 mL/min flow rate provided the highest resolution values (31.68 between FUR-B and MP; 30.12 between MP and FUR; 45.44 between FUR and PP) but required longer analysis times. The Symmetry C18 column with mobile phase 60:40 at 1.0 mL/min provided acceptable resolution with improved analysis time and was selected for the validated method [8]. This case demonstrates the practical trade-offs between resolution, analysis time, and symmetry factors that must be balanced during method development.
Research Reagent Solutions for Peak Resolution Studies
Table 3: Essential Materials and Reagents for Peak Resolution Optimization
| Reagent/ Material | Function/Application | Selection Considerations |
|---|---|---|
| C18 Stationary Phases | Primary reversed-phase separation | Various chain lengths, endcapping, and particle sizes (1.7-5μm) |
| Alternative Phases (Phenyl, Cyano) | Selectivity modulation for problematic separations | Different interaction mechanisms for specific compound classes |
| HPLC-grade Acetonitrile | Primary organic modifier | Low UV cutoff, purity appropriate for detection mode |
| HPLC-grade Methanol | Alternative organic modifier | Different selectivity compared to acetonitrile |
| Buffer Salts (e.g., phosphate, acetate) | Mobile phase pH control | UV transparency at detection wavelength, solubility |
| pH Adjustment Reagents (e.g., formic acid, ammonium hydroxide) | Mobile phase pH modification | Volatility for LC-MS applications |
| Reference Standards | System suitability and peak identification | Certified purity, stability under analytical conditions |
Resolving co-eluting peaks in HPLC requires a systematic approach that leverages fundamental chromatographic principles while employing modern detection technologies for peak purity assessment. The most effective strategy typically begins with selectivity optimization through mobile phase and stationary phase modifications, as this approach directly affects relative peak spacing. Efficiency enhancements through particle size reduction, column length adjustment, or temperature optimization provide additional resolution improvements for moderately overlapped peaks. Throughout method development, peak purity assessment using PDA detection or mass spectrometry provides critical data to confirm successful resolution of co-eluted compounds. By integrating these approaches within a structured method development framework, researchers can reliably resolve co-eluting peaks and demonstrate peak purity, ultimately supporting the development of robust, validated HPLC methods that ensure drug product quality and patient safety.
The Impact of Baseline Noise, Wavelength Selection, and Integration Parameters
In High-Performance Liquid Chromatography (HPLC) validation research, demonstrating peak purity is fundamental to ensuring the reliability, accuracy, and regulatory compliance of analytical methods, particularly in pharmaceutical development [1] [2]. Peak purity confirmation provides critical evidence that the measured signal for an analyte originates from a single chemical entity, uncontaminated by co-eluting impurities or degradation products [1]. This assessment is complicated by several interconnected technical factors, with baseline noise, wavelength selection, and integration parameters representing three critical variables that directly impact the credibility of purity determinations.
Excessive baseline noise can obscure minor impurities and compromise the signal-to-noise ratio (S/N), thereby raising the effective limits of detection and quantification [69] [70]. Suboptimal wavelength selection may reduce method sensitivity or mask spectral differences between co-eluting compounds with similar chromophores [71]. Furthermore, improper integration parameters can lead to inaccurate peak area calculations and faulty baseline correction, misrepresenting true peak characteristics and purity [72] [73]. This technical guide examines the impact of these three factors within the context of HPLC validation research, providing detailed methodologies and data interpretation frameworks to support robust peak purity demonstrations.
Baseline Noise: Origins, Impact, and Mitigation
Understanding Baseline Noise and Its Classification
Baseline noise refers to short-term, irregular fluctuations in the chromatographic detector signal that are unrelated to actual analyte peaks [69]. It is crucial to distinguish noise from baseline drift, which represents a gradual, long-term shift in the baseline often caused by temperature changes or mobile phase composition variations [69]. The signal-to-noise ratio (S/N) is a key metric that quantifies the ability to distinguish analyte signals from background fluctuations, directly affecting method sensitivity and detection limits [69] [71] [70].
Table 1: Classification and Characteristics of Baseline Noise
| Noise Type | Characteristics | Common Causes |
|---|---|---|
| High-Frequency Noise | Rapid, jagged fluctuations | Electronic detector noise, stray light, improper grounding |
| Low-Frequency Noise | Broader, slower undulations | Temperature fluctuations, pump pulsations, mobile phase composition changes |
| Spikes | Sharp, isolated upward/downward peaks | Air bubbles in detector, lamp arcing, electrical interference |
Impact of Baseline Noise on Peak Purity Assessment
Baseline noise directly compromises peak purity assessment in several ways. It recreases sensitivity by lowering the S/N ratio, making it difficult to distinguish small impurity peaks from background fluctuations [69] [70]. According to ICH guidelines, the limit of detection (LOD) typically requires an S/N of 3:1, while the limit of quantitation (LOQ) requires 10:1 [70]. Noise also complicates peak integration by increasing variability in determining peak start and end points, potentially leading to incorrect area calculations [72]. Furthermore, it compromises spectral purity algorithms because diode array detectors (DAD) rely on consistent spectral profiles across the peak; noise-induced spectral variations can falsely suggest impurity co-elution [1] [2].
Systematic Troubleshooting of Baseline Noise
A methodical approach to identifying and resolving noise sources is essential for reliable peak purity assessment.
Diagram 1: Systematic troubleshooting for baseline noise (7 words)
Detector-Related Noise Solutions
UV Lamp Issues: Deuterium lamps have a finite lifespan. Decreased output intensity, particularly at low wavelengths (<220 nm), increases noise as less light reaches the photodiodes [71]. Regular lamp performance checks through onboard diagnostics and proactive replacement based on manufacturer recommendations are essential. Flow Cell Problems: Bubbles or contamination within the flow cell cause noise and spikes. Implement regular cleaning protocols and ensure proper mobile phase degassing to prevent bubble formation [69] [71]. Electronic Settings: Data acquisition rate and signal processing parameters significantly impact observed noise. Higher acquisition rates capture more noise but provide better peak definition, while lower rates smooth noise but may miss narrow peaks [72] [71]. The time constant (or response time) acts as an electronic filter; higher values reduce noise but can distort peak shape and suppress small peaks near the detection limit [70].
Mobile Phase and Pump-Related Solutions
Mobile Phase Quality: Impurities in solvents or buffers are a common noise source. Use HPLC-grade solvents, high-purity additives, and filter all mobile phases through 0.2-0.45 μm membranes [69]. Inadequate Degassing: Dissolved gases forming microbubbles in the detector flow cell cause significant noise spikes and baseline instability. Implement thorough degassing using helium sparging, vacuum filtration, or inline degassers [69] [71]. Pump Pulsations and Mixing Issues: Worn pump seals or malfunctioning check valves cause flow irregularities that manifest as periodic baseline noise [69]. For gradient methods, insufficient mobile phase mixing creates composition variations that change UV background absorption, appearing as noise [71]. Adding an inline mixer or small volume mixer can dramatically improve baseline stability [71].
Wavelength Selection: Strategic Implications for Sensitivity and Purity
Wavelength Optimization for Sensitivity and Specificity
Wavelength selection represents a critical compromise between detection sensitivity and selectivity for impurity detection. Lower wavelengths (<220 nm) generally provide greater sensitivity for many compounds but come with significant limitations. At these shorter wavelengths, many mobile phase components (methanol absorbs up to 210 nm) and additives demonstrate stronger UV absorption, increasing baseline noise and reducing light throughput to the detector [71]. Higher wavelengths (>240 nm) typically offer lower background noise and greater mobile phase flexibility but may sacrifice sensitivity for some analytes [71].
Table 2: Wavelength Selection Guidelines for Optimal Performance
| Wavelength Range | Advantages | Limitations | Recommended Applications |
|---|---|---|---|
| Low UV (<220 nm) | High sensitivity for many compounds with chromophores | High background noise with certain solvents; limited mobile phase compatibility | Trace analysis when solvents permit; compounds with only end absorption |
| Mid UV (220-240 nm) | Balanced sensitivity and selectivity; compatible with most common HPLC solvents | Moderate sensitivity for some compounds | General pharmaceutical analysis; methods requiring robustness |
| High UV (>240 nm) | Low background noise; compatibility with wider range of buffers and additives | Reduced sensitivity for compounds lacking aromatic or conjugated systems | Methods where excipients or matrix components absorb at lower wavelengths |
Detector Configuration Parameters
Slit Width Selection: Diode array detectors allow adjustment of the spectral slit width, which determines the wavelength range focused onto each photodiode [71]. Wider slit widths increase light throughput, improving S/N ratio but decreasing spectral resolution, which can compromise peak purity assessment [71]. Narrower slit widths provide better spectral resolution for purity assessment but increase noise [71]. Spectral Acquisition Range: When using DAD for peak purity assessment, the selected wavelength range impacts the reliability of spectral comparisons. Restricting the range to avoid regions of high noise (e.g., below 210 nm) can improve purity assessment reliability, provided the analytes have sufficient absorbance in the selected range [2].
Advanced Wavelength Strategies for Peak Purity
For critical peak purity assessments, employing multi-wavelength monitoring can enhance impurity detection capability. Comparing chromatographic profiles at multiple wavelengths (typically the λmax of the main component and a ratio wavelength) can reveal shoulders or asymmetries indicating potential co-elution [2]. When developing stability-indicating methods, analyzing stressed samples at multiple wavelengths helps identify degradation products with different spectral characteristics than the parent compound [1].
Integration Parameters: Defining Peak Boundaries and Areas
Fundamental Integration Parameters and Their Effects
Integration parameters determine how the data system identifies peaks, establishes baseline boundaries, and calculates areas—all critical for accurate quantification and reliable peak shape assessment [72].
Peak Width: This setting establishes the minimum expected peak width, helping the integrator distinguish between true analyte peaks and short-term noise spikes [72] [73]. Setting an appropriate peak width value (typically based on average peak widths at approximately half-height) prevents integration of noise while ensuring all analytes of interest are detected [72]. Threshold (or Slope): This parameter determines the sensitivity for detecting peak start and end points based on changes in the slope of the chromatographic trace (second derivative) [72]. If set too high, small peaks may be missed; if set too low, baseline fluctuations may be incorrectly identified as peaks [72] [73]. Data Acquisition Rate: The number of data points collected per second fundamentally impacts integration accuracy [72]. Too few data points across a peak (fewer than 15-20) can lead to inaccurate area calculations and poor reproducibility, while excessive data points increase file size without improving integration and may increase observed noise [72] [71].
Advanced Integration Techniques for Complex Chromatograms
Integration Time Programs: Most modern data systems allow changing integration parameters at specific times during the chromatogram to address varying peak characteristics across the run [73]. This approach enables different threshold or peak width settings for early-eluting sharp peaks versus broader later-eluting peaks [73]. Baseline Correction Techniques: Proper baseline construction between partially resolved peaks significantly impacts area calculations and peak shape assessment [72] [73]. The "drift" parameter influences how the integrator handles a rising or falling baseline, determining whether perpendicular drop or skimming algorithms are applied [73]. Negative Peak Handling: Some detection techniques or system anomalies produce negative peaks that can interfere with proper integration of adjacent positive peaks. Time programs can specify "negative peak reject" during specific time intervals to eliminate this interference [73].
Diagram 2: Methodical approach to integration optimization (6 words)
Experimental Protocols for Parameter Optimization and Validation
Protocol 1: Systematic Baseline Noise Investigation
Objective: Identify and minimize sources of baseline noise to achieve optimal S/N ratio for reliable peak purity assessment. Materials: HPLC system with DAD, appropriate analytical column, HPLC-grade water, mobile phase components, 0.2 μm nylon or PVDF filters, ultrasonic bath or online degasser. Methodology: Begin with a clean system and fresh HPLC-grade water as the mobile phase. Record the baseline for 30 minutes with the mobile phase flowing but no injection, measuring peak-to-peak noise. Systematically introduce method-specific conditions: (1) Add organic modifier; (2) Add buffer salts; (3) Implement the planned gradient program; (4) Set to the intended detection wavelength. After each modification, measure noise levels and identify components contributing significantly to noise. Optimization Experiments: Compare noise levels at different wavelengths, particularly if using low UV detection. Evaluate the impact of data acquisition rate and time constant settings on observed noise and peak shape fidelity. Test different mixing conditions (in-line mixer vs. static mixer vs. no mixer) for gradient methods. Acceptance Criteria: For impurity methods targeting 0.1% level, S/N should be sufficient to reliably detect and quantify at this level (typically S/N >10 for LOQ) [70].
Protocol 2: Wavelength Selection and Detector Configuration
Objective: Establish detection parameters that provide optimal sensitivity for both main component and potential impurities while maintaining spectral specificity for purity assessment. Materials: DAD-equipped HPLC system, reference standards of main component and available impurities/degradation products, mobile phase matching the final method composition. Methodology: Inject individual reference standards and collect full UV spectra (190-400 nm or instrument range) in the actual method mobile phase. Identify λmax for each compound and regions of spectral dissimilarity. Evaluate the effect of slit width on signal-to-noise ratio and spectral resolution by analyzing standards at different slit width settings (e.g., 1, 2, 4, 8 nm). Optimization Experiments: Create overlays of all relevant spectra to identify wavelengths that maximize detection of potential impurities while maintaining adequate response for the main component. Test method sensitivity at different candidate wavelengths by injecting diluted standard solutions to determine LOD and LOQ at each wavelength. Acceptance Criteria: Selected wavelength should provide appropriate sensitivity for targeted detection limits while maintaining sufficient spectral contrast between main component and known impurities [1] [2].
Protocol 3: Integration Parameter Validation
Objective: Establish integration parameters that accurately and reproducibly define peak areas and shapes across the analytical range. Materials: HPLC system with data acquisition software, system suitability standard containing all target analytes at known concentrations, samples containing potential impurities. Methodology: Inject system suitability standard using initial integration parameters. Evaluate integration for all peaks, noting any incorrect baseline assignments, peak splitting, or failure to detect minor peaks. Systematically adjust peak width, threshold, and drift parameters to achieve correct integration. For complex regions with partially resolved peaks, implement time programs with specific parameters for different chromatographic regions. Validation Experiments: Prepare triplicate injections at different concentration levels (e.g., 50%, 100%, 150% of target) to verify integration consistency across the working range. Challenge the integration with samples containing known impurities at expected levels to ensure proper detection and integration of minor components. Compare automated integration results with manual integration for critical peaks. Acceptance Criteria: Integration parameters should produce consistent peak areas (%RSD <2% for replicate injections) and accurate baseline assignment as verified by manual review [72] [73].
The Scientist's Toolkit: Essential Research Reagent Solutions
Table 3: Key Reagents and Materials for HPLC Method Development and Validation
| Item/Category | Function/Application | Technical Considerations |
|---|---|---|
| HPLC-Grade Solvents | Mobile phase components | Low UV absorbance; minimal particulate contamination; consistent purity between lots |
| High-Purity Buffer Salts | Mobile phase modifiers for pH control | Low UV background; high solubility; volatile alternatives available for LC-MS |
| 0.2 μm Membrane Filters | Mobile phase and sample filtration | Nylon for aqueous; PVDF for organic solvents; compatible with all system components |
| Reference Standards | Method development and validation | Certified purity; proper storage conditions; sufficient quantity for all validation studies |
| Column Care Products | System and column maintenance | Guard columns; sealing frits; appropriate cleaning solvents for column regeneration |
Within HPLC validation research, credible peak purity demonstration depends on carefully controlling and optimizing three interconnected technical elements: baseline noise, wavelength selection, and integration parameters. Excessive noise raises practical detection limits and compromises spectral purity assessments. Suboptimal wavelength selection can mask impurities with similar chromophores or needlessly sacrifice method sensitivity. Imprecise integration parameters distort peak area calculations and shape assessment, potentially obscuring evidence of co-elution. By implementing the systematic troubleshooting approaches, optimization protocols, and validation strategies detailed in this guide, researchers can develop robust HPLC methods capable of providing defensible peak purity data that meets rigorous scientific and regulatory standards.
In high-performance liquid chromatography (HPLC) method validation for drug development, demonstrating peak purity is a fundamental requirement to ensure the identity, efficacy, and safety of a pharmaceutical compound. This task becomes profoundly more complex when dealing with isomers—molecules sharing identical molecular formulas but differing in atomic connectivity or spatial orientation. Such structurally similar compounds often possess distinct biological activities; a prime historical example is thalidomide, where one enantiomer provided the desired therapeutic effect while the other was teratogenic [74].
Establishing peak purity necessitates chromatographic techniques that can separate the analyte of interest from all potential impurities, including its own isomers. This guide details advanced strategies in column selectivity, focusing on chiral, Hydrophilic Interaction Liquid Chromatography (HILIC), and normal-phase modes. These techniques are indispensable for resolving compounds where conventional reversed-phase chromatography fails, as it primarily separates by polarity, a property that often differs very little between isomers [75]. By leveraging the unique selectivity of these advanced modes, scientists can provide robust evidence of peak purity, a critical component of any regulatory submission.
Fundamental Concepts: Isomerism and Peak Purity
Types of Isomerism
Isomerism, a phenomenon where multiple compounds share the same molecular formula, is typically categorized as follows:
- Stereoisomerism: Molecules differ only in the spatial arrangement of their atoms. This category includes:
- Enantiomers: Non-superimposable mirror images, crucial in pharmacology as they can have vastly different interactions with biological systems [74].
- Diastereomers: Stereoisomers that are not mirror images, often possessing different physical properties and easier to separate.
- Constitutional Isomerism: Molecules differ in the connectivity of their atoms, meaning their bonds are arranged in a different order.
The Peak Purity Challenge in HPLC Validation
The peak-purity function in a diode-array UV detector (DAD) works by comparing UV spectra taken at various points across a chromatographic peak. If the spectra are sufficiently different, it suggests the presence of co-eluting compounds. However, this method has significant limitations for isomer analysis. Chemically related compounds, including most isomers, frequently have nearly identical UV spectra. Consequently, even under ideal conditions, a DAD may be unable to distinguish a pure peak from a mixture of co-eluting isomers [75]. This inherent limitation makes chromatographic resolution the primary and most reliable tool for proving peak purity in the presence of isomers.
Chromatographic Modes for Isomer Separation
Chiral Separation
Chiral separation is a three-dimensional process that relies on creating transient diastereomeric complexes between the enantiomers and a chiral selector in the stationary phase.
Mechanisms and Stationary Phases
Polysaccharide-based chiral stationary phases (CSPs) are among the most popular due to their broad chiral recognition capabilities and scalability [74]. The selectivity of these phases is influenced by several factors:
- Type of Polysaccharide: The base material, either cellulose or amylose, imparts different structural properties.
- Cellulose forms a tight, layered structure.
- Amylose has a more open, helical structure that can often separate enantiomers that cellulose cannot [74].
- Nature of the Chiral Selector: The functional groups attached to the polysaccharide backbone (e.g., tris(3,5-dimethylphenylcarbamate)) are critical for chiral recognition, directing analytes toward specific interaction sites on the sugar moiety.
- Position of Functional Groups: Even a simple change in the position of a methyl group on the chiral selector can drastically alter selectivity, enabling the separation of challenging compounds like myclobutanil [74].
Method Development and Optimization
Achieving optimal chiral resolution requires a systematic screening approach, manipulating variables that affect selectivity [74].
Table 1: Key Parameters for Optimizing Chiral Separations
| Parameter | Options for Optimization | Impact on Selectivity |
|---|---|---|
| Stationary Phase | Cellulose vs. Amylose; Different chiral selectors (e.g., AD, AS, OD, OJ) | Drastic changes in enantiomer elution order and resolution based on molecular fit [74]. |
| Mobile Phase | Normal-phase (Hexane/IPA), Reversed-phase, Polar Organic Mode | Additive type/concentration can reverse elution order; solvent polarity affects hydrogen bonding and dipole interactions [74]. |
| Temperature | 5°C to 50°C | Can reverse elution order; higher temperatures generally improve efficiency and peak shape but reduce retention [74]. |
The following workflow outlines a systematic approach to chiral method development:
Hydrophilic Interaction Liquid Chromatography (HILIC)
HILIC is a powerful complement to reversed-phase chromatography for the separation of polar compounds, including certain isomers that are poorly retained in RPLC.
Retention Mechanism and Phases
The HILIC mechanism involves a polar stationary phase and a mobile phase typically consisting of acetonitrile with a small percentage (3-40%) of water or aqueous buffer. It is believed that water adsorbs onto the polar stationary surface to form a water-rich layer. Analytes are then partitioned between this aqueous layer and the organic-rich mobile phase. Additional interactions such as hydrogen bonding and electrostatic interactions also contribute to retention [76]. Common stationary phases include:
- Pure Silica Gel: Popular for LC-MS applications due to low background noise [76].
- Amino (NH₂) Phases: Especially suitable for carbohydrate (sugar) separation [76].
- Diol and Amide-Based Phases: Provide different selectivity and are highly hydrophilic.
HILIC vs. Aqueous Normal Phase (ANP)
The terms HILIC and Aqueous Normal Phase (ANP) are often used interchangeably, but a distinction exists. True ANP retention, exhibited by silica hydride-based phases, provides a dual retention mechanism. These phases can retain both hydrophobic compounds (via a reversed-phase mechanism at high aqueous content) and hydrophilic compounds (via a normal-phase-like mechanism at high organic content) [77]. In some cases, there is even a composition range where both types of compounds are retained simultaneously, offering unique separation capabilities for complex mixtures [77].
Normal-Phase Chromatography (NPC)
Normal-phase chromatography is particularly effective for separating isomers because its separation mechanism is based on adsorptive interactions between the solute and the polar functional groups on the stationary surface. These interactions are highly dependent on the three-dimensional shape of the molecule, allowing one isomer to interact more strongly with the stationary phase than another [75]. This is a key advantage over RPLC for isomer separation.
- Stationary Phases: Bare silica, or polar bonded phases like amino (NH₂) and diol.
- Mobile Phases: Typically consist of non-polar or weakly polar organic solvents like hexane, isopropanol, dichloromethane, or ethyl acetate [76]. The elution strength increases with the polarity of the solvent.
Table 2: Comparison of Chromatographic Modes for Isomer Separation
| Mode | Stationary Phase | Mobile Phase | Retention Mechanism | Best For |
|---|---|---|---|---|
| Chiral | Polysaccharide-based, Cyclodextrin, etc. | Varies by mode (normal, reversed, polar organic) | Formation of transient diastereomeric complexes | Separating enantiomers based on chiral recognition [74]. |
| HILIC | Silica, Amino, Diol, Amide | High organic (ACN) with 3-40% aqueous buffer | Partitioning into water layer, H-bonding, electrostatic | Polar, water-soluble isomers; orthogonal to RPLC [76]. |
| Normal Phase | Silica, Amino, Diol | Non-polar organics (hexane, IPA, DCM) | Adsorptive interactions with polar surface groups | Isomers differing in molecular shape & polarity [75]. |
Practical Experimental Protocols
Protocol: HILIC Method Development for Polar Isomers
The following workflow provides a step-by-step guide for developing a HILIC method, incorporating critical considerations for mobile phase preparation and column care to ensure reproducible results [76].
Critical Notes for HILIC Protocols [76]:
- Mobile Phase: Use ammonium formate or acetate buffers (e.g., 10 mM) for best reproducibility and peak shape. Avoid phosphate buffers to prevent precipitation. Ensure the organic content is always at least 40%.
- Sample Diluent: Dissolve the sample in 100% acetonitrile or a 75/25 mixture of acetonitrile/methanol. Avoid water or DMSO as strong solvents, which can cause severe peak distortion.
- Column Equilibration: HILIC columns require thorough equilibration. Equilibrate with at least 20 column volumes of the starting mobile phase to achieve stable retention times.
Protocol: Chiral Screening Strategy
A comprehensive chiral screening protocol should be employed to maximize the chance of success:
- Stationary Phase Screening: Inject the sample on a set of 3-5 complementary CSPs, such as amylose tris(3,5-dimethylphenylcarbamate), cellulose tris(3,5-dimethylphenylcarbamate), and others with different functional groups.
- Elution Mode Screening: For each promising CSP, screen different elution modes:
- Normal Phase: Hexane / Isopropanol with possible acidic/basic additives.
- Polar Organic: 100% Methanol or Ethanol with additives.
- Reversed Phase: Water / Acetonitrile or Methanol with buffers.
- Fine-Tuning: Once a promising separation is identified, fine-tune the method by varying temperature, additive concentration, and gradient profile to achieve baseline resolution.
The Scientist's Toolkit: Essential Research Reagents and Materials
Successful isomer separation relies on the appropriate selection of columns, solvents, and accessories.
Table 3: Essential Research Reagents and Materials for Isomer Separation
| Item | Function / Description | Example Applications |
|---|---|---|
| Polysaccharide CSPs | Chiral columns with amylose or cellulose base for enantiomer separation; wide applicability. | Chiral method screening; preparative enantioseparation [74]. |
| HILIC Columns (e.g., Amide) | Polar stationary phases for retaining highly hydrophilic isomers. | Separation of sugars, polar metabolites, nucleotides [76]. |
| Silica Hydride ANP Columns | Columns with dual retention mechanism (ANP and reversed-phase). | Complex mixtures of hydrophobic and hydrophilic compounds [77]. |
| Inert HPLC Hardware | Columns with passivated hardware to minimize metal-analyte interactions. | Improved peak shape for metal-sensitive compounds like phosphorylated species [78]. |
| High-Purity Solvents & Buffers | ACN, MeOH, IPA, Hexane; Ammonium formate/acetate for HILIC. | Mobile phase preparation; critical for detection (esp. MS) and reproducibility. |
| Centrifugal Partition Chromatography | Liquid-liquid preparative technique without solid support. | Scalable chiral separation; difficult isomer purifications (e.g., Vitamin E, Nebivolol) [79]. |
Within the rigorous context of HPLC validation for drug development, demonstrating peak purity is non-negotiable. For isomers, which pose a significant analytical challenge, this goal is only achievable through the strategic application of advanced selectivity modes. Chiral chromatography, HILIC, and normal-phase chromatography provide powerful and often complementary tools to resolve complex mixtures of stereoisomers and constitutional isomers that defy conventional reversed-phase separation. By adopting a systematic method development strategy and understanding the underlying retention mechanisms, scientists can reliably prove the purity of a peak, thereby ensuring the quality, safety, and efficacy of pharmaceutical products and fulfilling critical regulatory requirements.
In high-performance liquid chromatography (HPLC), the fundamental assumption that one chromatographic peak corresponds to a single chemical component is not always valid. Peak purity assessment (PPA) is therefore a critical analytical procedure used to evaluate whether a chromatographic peak is attributable to a single component or results from the co-elution of multiple substances [1]. Within the pharmaceutical industry, demonstrating peak purity is an essential part of developing and validating stability-indicating methods (SIMs) for drug substances and products, directly impacting the accurate determination of assay and impurities [80]. A failed peak purity assessment indicates potential co-elution, which can compromise data integrity and lead to inaccurate conclusions about drug safety and efficacy [1].
This case study provides an in-depth technical guide for troubleshooting failed peak purity assessments. We will explore the fundamental principles of spectral peak purity, systematically diagnose common causes of failure, present practical experimental protocols for resolution, and discuss advanced orthogonal techniques. The content is framed within the broader context of HPLC method validation, emphasizing how robust peak purity demonstration supports regulatory submissions and ensures product quality.
Theoretical Foundations of Peak Purity Assessment
Core Principle: Spectral Homogeneity
The most common peak purity assessment technique uses a photodiode array (PDA) detector to evaluate spectral homogeneity across a chromatographic peak. The core principle posits that for a pure peak, the normalized UV spectrum remains constant at every point during the peak's elution. Conversely, a changing spectral profile suggests the presence of multiple, co-eluting compounds [1] [3].
Commercial chromatography data systems (CDS) implement this principle by calculating a purity angle and a purity threshold [3]. The purity angle is a numerical value representing the spectral variation across the peak. The purity threshold is a reference value derived from the baseline noise, representing the maximum allowable spectral variation for a peak to be considered pure [3]. The fundamental decision rule is:
- Peak is Pure: Purity Angle < Purity Threshold
- Peak is Impure: Purity Angle > Purity Threshold [3]
Mathematical Basis: Vector Correlation Analysis
The algorithms in CDS software are based on vector correlation analysis. Each spectrum collected across the peak is treated as a vector in n-dimensional space, where 'n' is the number of data points (wavelengths) in the spectrum [1]. Spectral similarity is quantified by calculating the angle (θ) between these vectors.
Two spectra are considered identical if the angle between their vectors is zero, even if their absolute intensities differ [1]. The cosine of this angle, equivalent to the correlation coefficient (r) between mean-centered spectra, serves as the metric for similarity [1]. The "purity angle" used in software like Waters Empower is directly related to this spectral contrast angle [80].
Table 1: Key Metrics in Spectral Peak Purity Assessment
| Metric | Calculation/Method | Interpretation | Common Software Implementation |
|---|---|---|---|
| Spectral Contrast Angle (θ) | Angle between spectral vectors in n-dimensional space [1]. | θ = 0°: Identical spectra; Larger θ: Greater spectral difference. | - |
| Purity Angle | Weighted average of spectral contrast angles across the peak [80]. | Represents the degree of spectral variance within the peak. | Waters Empower [80] |
| Purity Threshold | Derived from baseline noise and solvent contributions [80]. | The maximum allowed spectral variation for a pure peak. | Waters Empower [80] |
| Spectral Similarity | ( r = \cos \theta ) (correlation coefficient) [1]. | r = 1: Perfect match; r < 1: Spectral differences. | Agilent OpenLab (as 1000 × r²) [80] |
Figure 1: A systematic troubleshooting workflow for a failed peak purity assessment, guiding the analyst from initial failure to root cause categorization.
Troubleshooting the Failure: A Systematic Approach
A failed purity assessment requires a structured investigation to determine if it is a "true positive" (actual co-elution) or a "false positive" (a pure peak failing due to analytical artifacts) [80]. The following sections detail this diagnostic process.
Data Acquisition Parameters
Incorrect instrument settings can introduce spectral noise or artifacts, leading to false purity failures.
- Sample Rate/Scan Speed: An acquisition rate that is too slow results in too few data points across the peak, failing to capture its true spectral profile. Excessively fast scanning can increase noise and reduce the signal-to-noise ratio (S/N), negatively impacting purity calculations [7]. The CDS can often recommend a rate based on the narrowest peak width.
- Spectral Bandwidth and Slit Width: Increasing the bandwidth can improve S/N but may reduce selectivity by blending fine spectral features. A narrow slit width improves spectral resolution but decreases light throughput and sensitivity, which is critical for detecting minor impurities [7]. For peak purity, optimal settings balance sufficient S/N with the resolution needed to distinguish similar spectra.
Data Processing Settings
Software algorithms require correct configuration; suboptimal settings are a common source of false positives [80].
- Background Correction: The software must subtract the background signal from the mobile phase or matrix. Incorrect baseline correction, especially with gradient elution, is a major cause of false positives [80] [7]. Using an automatic baseline selection or manually setting appropriate baseline points before and after the peak is crucial.
- Spectral Normalization: This process corrects for the changing concentration of the analyte across the peak, allowing comparison of spectral shape independent of concentration [7]. Using the wrong normalization method can distort spectral comparisons.
- Absorbance Threshold: This setting excludes the lower, noisier parts of the peak from the purity calculation. Setting the threshold too low includes excessive noise, potentially causing a false fail; setting it too high may exclude meaningful data from the peak tails where impurities often become visible [7].
- Wavelength Range: The analysis should be restricted to a range where the analyte has significant absorbance. Including regions of high noise or no absorbance can skew the purity calculation [7].
Table 2: Common Causes and Solutions for False Positive Purity Failures
| Category | Specific Cause | Impact on Purity Assessment | Recommended Solution |
|---|---|---|---|
| Data Acquisition | High noise / Low S/N [7] | Increases purity angle, causing false fails. | Optimize detector settings; increase analyte concentration if possible. |
| Extreme wavelengths (<210 nm) [80] | High UV background and noise. | Use a higher wavelength with better S/N, if the analyte's spectrum allows. | |
| Low impurity concentration (<0.1%) [80] | Impurity signal is below reliable detection limit. | Use concentration techniques or more sensitive detection (e.g., MS). | |
| Data Processing | Incorrect background correction [80] [7] | Fails to account for shifting baseline, causing spectral artifacts. | Use automatic or manual baseline correction with appropriate reference points. |
| Suboptimal integration [80] | Peak start/end points include noise or neighboring peaks. | Manually adjust integration to accurately define the peak of interest. | |
| Low absorbance threshold [7] | Includes excessive baseline noise in the calculation. | Increase the threshold to exclude the noisy base of the peak. | |
| Chemical/Physical | Significant baseline shift [80] | Creates a sloping background, distorting spectra. | Use a flatter gradient or mobile phase; ensure proper equilibration. |
| Matrix interference [80] | Co-eluting excipients or unrelated substances affect spectra. | Improve sample cleanup; use selective detection. |
Chemical and Physical Causes
If acquisition and processing parameters are optimized and the peak still fails, the cause is likely a true co-elution or a fundamental chemical issue.
- Structurally Similar Impurities: The most challenging scenario is when an impurity is structurally analogous to the main compound (e.g., a degradation product). Such impurities often have nearly identical UV spectra, making them difficult for PDA-based PPA to resolve, leading to false negatives [1] [80]. This is a key limitation of the technique.
- Co-elution Near the Apex: If an impurity's retention time is nearly identical to the main peak, its spectral contribution remains relatively constant across the peak, making detection via spectral shape changes very difficult [7].
- Mobile Phase and Matrix Effects: A steep mobile phase gradient can cause a shifting baseline absorbance, which, if not correctly compensated for during background correction, can be misinterpreted as spectral variance [80]. Matrix components from the sample can also interfere.
Experimental Protocols for Resolution
Once a true co-elution is suspected, the following experimental protocols can be employed to resolve the issue.
Primary Protocol: Chromatographic Separation Optimization
The most direct solution is to improve the chromatographic resolution.
- Objective: To achieve baseline resolution (R_s > 1.5) between the analyte and the co-eluting impurity.
- Materials:
- HPLC system with PDA detector.
- Columns of different selectivities (e.g., C18, phenyl, cyano, pentafluorophenyl).
- Mobile phase components (buffers, acetonitrile, methanol).
- Standards of the analyte and available impurities.
- Methodology:
- Screen Column Chemistries: Test the sample on 2-3 columns with different bonded phases to exploit alternative selectivity [1].
- Modify Mobile Phase pH: For ionizable compounds, a small change in buffer pH (e.g., ±0.5 units) can significantly alter retention and selectivity. Ensure the pH is within the column's stable range.
- Adjust Organic Modifier: Replace acetonitrile with methanol, or use a mixture, to change the elution strength and selectivity.
- Optimize Gradient Profile: Flatten the gradient around the retention time of the target peak to increase the time window for separation.
- Adjust Temperature: Change the column temperature (e.g., 25°C to 40°C) to potentially alter selectivity and efficiency.
- Validation: After achieving separation, inject stressed samples (e.g., acid, base, oxidative, thermal) to verify that the method can separate the analyte from its forced degradation products [1] [81].
Orthogonal Techniques for Peak Purity Confirmation
When PDA assessment is inconclusive or insufficient, orthogonal techniques are required.
- Mass Spectrometry (MS): This is a powerful orthogonal technique. A pure peak should show a consistent mass spectrum and a single extracted ion chromatogram (XIC) for the precursor ion across the peak. Co-elution is indicated by changing mass spectra or multiple XICs [80]. MS is particularly valuable for detecting impurities with poor UV chromophores.
- Two-Dimensional Liquid Chromatography (2D-LC): In comprehensive 2D-LC, the entire effluent from a first separation column is transferred to a second column with different separation mechanics (e.g., from reversed-phase to HILIC). Co-eluting peaks in the first dimension have a high probability of being separated in the second dimension [1] [80].
- Spiking Studies: A known impurity or degradant standard is added (spiked) into the sample. A significant increase in the area of the target peak, or the appearance of a shoulder, confirms co-elution. The absence of such changes supports peak purity [80].
- Advanced Chemometric Techniques: As demonstrated in recent research, two-dimensional correlation (2D-corr) analysis can be applied to data from multi-channel detectors (like a 16-sensor coulometric array) [9]. The asynchronous contour plot can reveal the presence of overlapping species within a single chromatographic peak that are not apparent in a 1D analysis [9].
Figure 2: A decision tree for confirming peak purity using orthogonal techniques when the initial PDA-based assessment fails or is inconclusive.
The Scientist's Toolkit: Essential Reagents and Materials
Table 3: Key Research Reagent Solutions for Peak Purity Investigations
| Item / Reagent | Function / Application | Technical Specification / Notes |
|---|---|---|
| HPLC Columns (Various Selectivities) | To achieve separation by exploiting different chemical interactions. | C18 (standard), Phenyl, Cyano, Pentafluorophenyl (PFP). Keep a toolkit of 3-4 column types [1]. |
| Mobile Phase Buffers | To control pH for ionizable analytes, critical for modulating selectivity. | e.g., Ammonium formate (MS-compatible), Potassium phosphate (UV-compatible). pH range typically 2.0-8.0. |
| Organic Modifiers | To act as the strong solvent in reversed-phase chromatography. | Acetonitrile (most common), Methanol (alternative selectivity). HPLC-grade purity is essential. |
| Forced Degradation Reagents | To intentionally generate degradation products for stability-indicating method validation [1] [80]. | 0.1M HCl (acid), 0.1M NaOH (base), 3% H₂O₂ (oxidative). Use with caution. |
| Known Impurity & Degradant Standards | For spiking studies to confirm identity and co-elution. | Sourced from certified suppliers or isolated from stressed samples. |
| Photodiode Array (PDA) Detector | The primary tool for UV spectral peak purity assessment. | Must be capable of collecting full spectra during peak elution. Ensure proper configuration of slit width and bandwidth [7]. |
A failed peak purity assessment should not be viewed as a terminal endpoint but as a critical diagnostic signal within the analytical method development lifecycle. Successfully troubleshooting this failure requires a systematic approach that begins with verifying data acquisition and processing parameters to rule out false positives before concluding that true co-elution exists.
As outlined in this guide, the investigative process progresses logically from basic parameter checks to sophisticated orthogonal confirmations. The ultimate resolution often lies in fundamental chromatographic optimization—leveraging different column selectivities, mobile phase pH, and solvent modifiers. For the most challenging separations, advanced techniques like 2D-LC or MS detection provide the definitive characterization needed to ensure method specificity.
Within the rigorous context of pharmaceutical validation, a thoroughly investigated and resolved peak purity issue strengthens the overall validity of the stability-indicating method. By applying this structured troubleshooting framework, scientists can transform a purity failure from a problem into an opportunity to deepen their understanding of the method and the molecule, thereby delivering robust, reliable data to support drug development and ensure patient safety.
Integrating Peak Purity into Method Validation and Regulatory Submissions
Positioning Peak Purity within the ICH Q2(R2) Validation Framework
Within pharmaceutical analysis, demonstrating the purity of chromatographic peaks is a critical, yet often misunderstood, component of method validation. This technical guide positions peak purity assessment within the modern framework of ICH Q2(R2), clarifying its foundational role in establishing method specificity. We detail how conclusive peak purity evidence is not derived from a single test but is the product of a structured, multi-technique approach, integrating data from stress studies, diode-array detection (DAD/PDA), and mass spectrometry (MS). This whitepaper provides drug development professionals with explicit protocols to design validation studies that robustly demonstrate peak purity, thereby ensuring accurate quantification and the safety and efficacy of drug products.
In high-performance liquid chromatography (HPLC), the assumption that a single peak corresponds to a single compound is a pervasive risk. Peak purity refers to the degree to which a chromatographic peak is attributable to a single analyte component, free from co-elution with impurities, degradants, or matrix components [1]. The inability to detect co-elution can lead to inaccurate quantification of both the active ingredient and impurities, directly compromising drug product safety and efficacy [1].
The ICH Q2(R2) guideline, effective in March 2024, provides the overarching framework for validating analytical procedures [82]. While the term "peak purity" is not explicitly listed as a validation parameter, its assessment is an integral and essential part of demonstrating method specificity—the ability to assess the analyte unequivocally in the presence of components that may be expected to be present, such as impurities and excipients [83]. Consequently, positioning peak purity within ICH Q2(R2) requires a scientific and risk-based strategy to prove that an analytical procedure can deliver reliable results, even when faced with the challenge of potential co-elutions.
Peak Purity and ICH Q2(R2): Establishing the Link to Specificity
The updated ICH Q2(R2) guideline reinforces a holistic approach to validation, emphasizing that analytical procedures should be "fit for purpose" throughout their lifecycle [84]. For methods used in assay and impurity testing, the cornerstone of this fitness is specificity.
Specificity as a Core Validation Parameter
Within ICH Q2(R2), specificity is a fundamental validation parameter for several types of analytical procedures, including:
- Identification tests: To ensure the identity of an analyte.
- Quantitative tests for impurities' content: To accurately reflect the purity of a sample.
- Assay of drug substance or product: To measure the analyte accurately and quantitatively [85].
Peak purity assessment is the practical experimental work that provides evidence for specificity. It answers the critical question: Can the method distinguish the analyte from all potential co-eluting substances?
A Multi-Faceted Approach to Demonstration
Regulatory evaluations expect a scientifically justified approach to demonstrating specificity, which for peak purity involves a combination of strategies [82] [1]:
- Analysis of stressed samples: Samples of the drug substance or product subjected to stress conditions (e.g., acid, base, oxidation, thermal, photolytic) are used to generate potential degradants. The method's ability to separate the main analyte peak from degradant peaks is assessed.
- Assessment of spectral homogeneity: Using DAD or MS detection to examine the homogeneity of a peak's spectral signature across its width.
- Use of an orthogonal procedure: Comparing results from a method with different separation principles (e.g., HILIC vs. RP-LC) provides compelling evidence of purity.
The following workflow outlines the integrated process for establishing peak purity within a method validation study:
Foundational Concepts and Techniques for Peak Purity Assessment
The Principle of Spectral Purity with DAD/PDA
The most common tool for peak purity assessment is the photodiode array (PDA) detector, also referred to as a DAD [2]. The core concept, known as spectral purity, is based on comparing spectra taken from different segments of a chromatographic peak (e.g., the upslope, apex, and downslope). The underlying principle treats each spectrum as a vector in n-dimensional space, where n is the number of wavelength data points [1].
Spectral similarity is quantified using the cosine of the angle (θ) between these vectors or, equivalently, the correlation coefficient (r) between the spectra [1]. The formulas for these calculations are:
- Cosine Similarity: ( \cos(\theta) = \frac{\mathbf{a} \cdot \mathbf{b}}{\|\mathbf{a}\|\|\mathbf{b}\|} )
- Correlation Coefficient: ( r = \frac{\sum{j=1}^{n}(aj - \bar{a})(bj - \bar{b})}{\sqrt{\sum{j=1}^{n}(aj - \bar{a})^2 \sum{j=1}^{n}(b_j - \bar{b})^2}} )
Where ( \mathbf{a} ) and ( \mathbf{b} ) are the spectral vectors, ( aj ) and ( bj ) are the absorbance values, and ( \bar{a} ) and ( \bar{b} ) are the mean absorbance values. When the vectors are mean-centered, ( \cos(\theta) = r ) [1].
Commercial HPLC software uses this principle to generate a purity angle and a purity threshold. A peak is typically considered "pure" if the purity angle is less than the purity threshold across the entire peak. However, this is not a definitive confirmation but an indicator of spectral homogeneity.
Advanced and Orthogonal Assessment Techniques
While PDA/DAD is ubiquitous, its limitations necessitate advanced and orthogonal techniques.
Liquid Chromatography-Mass Spectrometry (LC-MS): LC-MS provides a more definitive assessment by separating signals based on mass-to-charge ratio (m/z) rather than UV spectral profile [2]. It is highly effective for identifying low-level contaminants that may have similar UV spectra to the main analyte.
Two-Dimensional Correlation (2D-corr) Analysis: Recent research demonstrates the application of 2D-corr analysis to data from multi-channel detectors, such as a coulometric array. The synchronous contour plot can indicate the number of components present, while the asynchronous plot can reveal the presence of overlapping species within a single peak, providing a powerful chemometric tool for purity verification [9].
Experimental Protocols for Peak Purity Assessment
A robust peak purity assessment is built on systematic protocols. The following sections provide detailed methodologies for key experiments.
Protocol 1: Peak Purity Analysis via HPLC-DAD
This protocol describes the standard procedure for assessing spectral purity using an HPLC system equipped with a DAD.
1. Equipment and Reagents:
- HPLC system with DAD detector and software capable of peak purity analysis (e.g., Empower, Chromeleon, OpenLAB).
- Analytical column appropriate for the method (e.g., C18).
- Mobile phases and samples as per the validated method.
- Stressed and unstressed samples of the drug substance and product.
2. Procedure:
- A. Instrument Setup: Configure the DAD acquisition parameters. A sufficient data acquisition rate (e.g., 10-20 points per peak) and appropriate spectral settings are critical [7].
- B. Spectral Acquisition: Acquire chromatograms with spectral data across the peak of interest. Key parameters to optimize are detailed in the table below.
- C. Data Processing:
- Perform background correction using automatic or manual baseline selection to remove contributions from the mobile phase or matrix [7].
- Set a relevant wavelength range that excludes high-noise regions (e.g., below 210 nm) but captures the characteristic spectral features of the analyte [2] [7].
- Apply an absorbance threshold to exclude noisy data from the peak edges from the purity calculation [7].
- The software will normalize the spectra and calculate the purity angle and threshold.
3. Data Interpretation: Manually review the overlaid normalized spectra from across the peak. A pure peak will show perfect overlay. Any divergence in the spectra, particularly at the peak edges, indicates potential co-elution, even if the software's purity score passes [2].
Table 1: Key HPLC-DAD Parameters for Optimal Peak Purity Analysis
| Parameter | Recommended Setting | Rationale and Impact |
|---|---|---|
| Scan Range | e.g., 210-400 nm | Excludes high-noise regions below 210 nm while capturing analyte spectra [2]. |
| Data Acquisition Rate | ≥10 points per peak | Ensures sufficient data points to model peak shape and detect spectral variations [7]. |
| Bandwidth | 4-8 nm | A wider bandwidth improves S/N but may reduce spectral selectivity [7]. |
| Slit Width | As narrow as possible | A wider slit width increases sensitivity but decreases spectral resolution, potentially "smoothing out" subtle spectral differences [7]. |
| Absorbance Threshold | Set above baseline noise | Excludes noisy data from the peak onset and tail, reducing false positives for impurity detection [7]. |
Protocol 2: Orthogonal Confirmation via LC-MS
This protocol is used to confirm or refute suspected co-elution identified by DAD.
1. Equipment and Reagents:
- HPLC system coupled to a mass spectrometer.
- Appropriate LC column and MS ionization source (e.g., ESI, APCI).
2. Procedure:
- A. Method Translation: Adapt the original HPLC method for MS compatibility (e.g., replace non-volatile buffers with ammonium formate or acetate).
- B. Data Acquisition: Inject the sample and acquire data in full-scan mode (e.g., m/z 100-1000) to detect all ionizable components.
- C. Extracted Ion Chromatogram (XIC) Analysis: Extract ions specific to the analyte and potential impurities/degradants. The presence of multiple chromatographic peaks for different ions at the same retention time confirms co-elution.
3. Data Interpretation: Co-elution is confirmed if the extracted ion chromatograms for two different masses show peak maxima at the same retention time. The mass spectrum at any point across the peak can also be inspected for the presence of multiple ions.
The Scientist's Toolkit: Essential Reagents and Materials
Table 2: Key Research Reagent Solutions for Peak Purity Studies
| Item | Function in Peak Purity Assessment |
|---|---|
| Stressed Samples | Forced degradation samples (acid, base, oxidative, thermal, photolytic) are used to challenge the method's specificity by generating potential degradants that could co-elute [1]. |
| High-Purity Reference Standards | A well-characterized standard of the analyte is essential for obtaining a clean reference spectrum for purity comparison and for method development and calibration. |
| MS-Compatible Buffers | Volatile buffers like ammonium formate and acetate are required for LC-MS based orthogonal purity assessment, as they do not cause ion suppression or source contamination. |
| Columns of Differing Selectivity | Columns with different chemistries (e.g., C18, phenyl-hexyl, HILIC) are used to develop orthogonal methods or to test the robustness of the primary method's separation [1]. |
Troubleshooting and Best Practices
Even with careful execution, peak purity analysis can yield ambiguous results. The following decision logic can guide the investigator:
Common Pitfalls and Solutions:
- False "Pure" Results: Occurs when a co-eluting impurity has a nearly identical UV spectrum to the analyte (common with structurally similar compounds) [1]. Solution: Do not rely on DAD alone; incorporate stress studies and orthogonal detection like MS.
- False "Impure" Flags: Can be caused by high baseline noise, particularly at low wavelengths, or an improper baseline correction [2] [7]. Solution: Optimize DAD settings (slit width, bandwidth), apply an appropriate absorbance threshold, and ensure correct background subtraction.
- Software Discrepancies: Different software packages may use slightly different algorithms, leading to varying purity scores [2]. Solution: The numerical score is a guide; manual review of spectral overlays and peak shape is indispensable.
Positioning peak purity correctly within the ICH Q2(R2) validation framework is fundamental to establishing reliable and robust analytical procedures. It is not a standalone parameter but the evidentiary foundation of method specificity. As outlined in this guide, a successful strategy is built on a holistic approach that combines forced degradation studies, DAD-based spectral analysis, and orthogonal confirmation with LC-MS.
Drug development professionals must adopt this multi-faceted, science- and risk-based mindset. By implementing the detailed protocols and best practices described herein, scientists can provide the compelling evidence required by regulators to demonstrate that their methods are truly fit-for-purpose, thereby ensuring the accurate quantification and control of pharmaceutical products throughout their lifecycle.
Linking Purity Assessments to Specificity, Linearity, and Precision Data
In high-performance liquid chromatography (HPLC), the demonstration of peak purity is a critical aspect of method validation, providing assurance that the measured analytical signal for a target analyte is not compromised by co-eluting substances. Within a structured validation framework, purity assessments are intrinsically linked to the validation parameters of specificity, linearity, and precision. These parameters form an interdependent triad that collectively guarantees the reliability of the purity determination. Specificity ensures that the method can distinguish the analyte from impurities, linearity confirms that the detector response is proportional to concentration across the expected range—a prerequisite for accurate purity quantification—and precision demonstrates that the method yields consistent results. This guide examines the technical protocols and acceptance criteria for these parameters, providing a foundation for establishing HPLC methods that deliver trustworthy peak purity assessments in pharmaceutical development and quality control.
Core Validation Parameters and Their Interrelationship
The following diagram illustrates the logical relationship between the core validation parameters and their collective role in supporting reliable peak purity assessments.
This relationship model demonstrates that peak purity is not a standalone measurement but a conclusion drawn from the successful integration of specificity, linearity, and precision data. In practice, a method's ability to accurately assess purity fails if any one of these three pillars is compromised.
Experimental Protocols for Key Validation Parameters
Specificity and Peak Purity Protocol
Objective: To demonstrate that the method can unequivocally quantify the analyte in the presence of potential impurities, degradation products, and matrix components.
Materials & Reagents:
- Standard of analyte (high purity)
- Known and potential impurities (synthetic intermediates, by-products)
- Placebo formulation (excipients)
- Forced degradation materials (acid, base, oxidant, heat, light)
Methodology:
- Individual Injections: Separately inject the analyte, each impurity, and the placebo preparation. Confirm that impurities are resolved from the analyte peak and from each other.
- Forced Degradation Studies: Stress the analyte under relevant conditions (e.g., 0.1N HCl and NaOH for acid/base degradation, 3% H₂O₂ for oxidative degradation, heat at 70°C for thermal degradation, and exposure to UV light for photolytic degradation) [86].
- Peak Homogeneity Assessment: Use a diode-array detector (DAD) to acquire spectral data across the analyte peak. Compare spectra at the peak apex, up-slope, and down-slope. A pure peak demonstrates homogeneous spectra (match factor > 999) [86].
- Resolution Calculation: For critical peak pairs, calculate resolution (Rs). The target is typically Rs ≥ 2.0 for baseline separation [87].
System Suitability: The peak purity index should be ≥ 990 for the analyte peak in the presence of degradation products.
Linearity and Range Protocol
Objective: To establish that the analytical procedure produces a detector response that is directly proportional to the concentration of the analyte across the specified range.
Materials & Reagents:
- Stock standard solution of analyte
- Appropriate diluent (e.g., mobile phase or water)
- Volumetric flasks and precision pipettes
Methodology:
- Solution Preparation: Prepare a stock standard solution at the target concentration. Serially dilute this solution to obtain at least five concentrations spanning the range (e.g., 50% to 150% of the target concentration) [86].
- Injections and Measurement: Inject each solution in triplicate and record the peak response (area).
- Statistical Analysis: Plot the mean peak response against concentration. Perform linear regression analysis to calculate the correlation coefficient (r), coefficient of determination (r²), y-intercept, slope, and residual sum of squares.
- Evaluate Residuals: Examine a plot of residuals versus concentration; it should show random scatter, indicating the model's goodness of fit.
Precision Evaluation Protocol
Objective: To demonstrate the degree of scatter between a series of measurements obtained from multiple sampling of the same homogeneous sample under prescribed conditions.
Materials & Reagents:
- Homogeneous sample (e.g., drug product or substance)
- Standard solutions at target concentration
Methodology:
- Repeatability (Intra-day Precision): Prepare six independent sample preparations at 100% of the test concentration by a single analyst using the same equipment on the same day. Calculate the % relative standard deviation (%RSD) of the assay results [86].
- Intermediate Precision (Ruggedness): Repeat the repeatability study on a different day by a second analyst using a different HPLC system and column from the same supplier. Incorporate the results from both analysts/days to calculate the overall %RSD [86].
Quantitative Data and Acceptance Criteria
The following tables summarize the typical acceptance criteria and experimental outcomes for the key validation parameters discussed, based on International Council for Harmonisation (ICH) requirements and practical applications [86] [83].
Table 1: Validation Parameters and Acceptance Criteria for an HPLC Purity Method
| Validation Parameter | Experimental Focus | Acceptance Criteria | Regulatory Reference |
|---|---|---|---|
| Specificity | Resolution from closest eluting impurity | Rs ≥ 2.0 [87] | ICH Q2(R2) [83] |
| Peak Purity | Spectral homogeneity via DAD | Purity index ≥ 990 (or match factor > 999) | In-house & Pharmacopoeia |
| Linearity | Correlation coefficient (r²) | r² ≥ 0.99 [86] | ICH Q2(R2) [83] |
| Precision (Repeatability) | %RSD of six sample preparations | %RSD < 2.0% [86] | ICH Q2(R2) [83] |
| Accuracy | Mean recovery at multiple levels | Bias ≤ 5% for each level [86] | ICH Q2(R2) [83] |
Table 2: Exemplary Experimental Data from a Validated HPLC Method for Ga-68-DOTATATE [86]
| Concentration (µg/mL) | Intra-day Precision (%RSD, n=6) | Inter-day Precision (%RSD) | Accuracy (Bias %) |
|---|---|---|---|
| 0.5 (LOQ) | 0.52 | 0.61 | +4.8 |
| 1.0 | 0.35 | 0.45 | -2.1 |
| 1.5 | 0.28 | 0.33 | +1.5 |
| 2.0 | 0.25 | 0.28 | -1.2 |
| 3.0 | 0.22 | 0.20 | +0.8 |
The data in Table 2 demonstrates a well-controlled method, where precision (expressed as %RSD) and accuracy (expressed as bias %) meet the strict acceptance criteria required for pharmaceutical quality control across the validated range.
The Scientist's Toolkit: Essential Research Reagents and Materials
The following table details key reagents, materials, and instrumentation critical for executing the validation protocols described in this guide.
Table 3: Essential Research Reagent Solutions and Materials for HPLC Validation
| Item/Category | Technical Function & Importance | Exemplary Specification / Note |
|---|---|---|
| Ultra-Pure Solvents & Water | Mobile phase component; minimizes baseline noise & system peaks. | Trace metal grade; HPLC grade or better [86]. |
| Trifluoroacetic Acid (TFA) | Ion-pairing reagent & pH modifier; critical for controlling selectivity & peak shape. | Used at 0.1% (v/v) in water & acetonitrile [86]. |
| Certified Reference Standards | Provides known identity & purity for method calibration & peak assignment. | GMP-grade peptide for biopharmaceuticals [86]. |
| C18 Analytical Column | Stationary phase; primary determinant of separation selectivity & efficiency. | 150 mm x 3.0-4.6 mm, 3 µm particle size, 120Å pore [86]. |
| Forced Degradation Reagents | Creates potential impurities & degradants for specificity & stability studies. | 0.1N HCl/NaOH, 3% H₂O₂ [86]. |
| Diode-Array Detector (DAD) | Enables peak purity & homogeneity assessment via spectral comparison. | Essential for confirming specificity [86]. |
This guide establishes that reliable HPLC peak purity assessment is the product of a strategically integrated validation process. The interconnected parameters of specificity, linearity, and precision form a robust framework that ensures analytical results are not only precise but also accurate and specific. The experimental protocols and acceptance criteria outlined, aligned with ICH guidelines, provide a actionable roadmap for researchers to demonstrate that their methods are fit-for-purpose. In the regulated environment of drug development, adopting this holistic approach to validation is not merely a regulatory formality but a fundamental scientific practice that underpins product quality and patient safety.
Developing Scientifically Justified Acceptance Criteria for Purity Tests
In high-performance liquid chromatography (HPLC), establishing scientifically justified acceptance criteria for purity tests is a fundamental requirement in pharmaceutical development and quality control. The primary objective is to ensure the accurate detection and quantification of impurities and degradation products, thereby guaranteeing drug safety, efficacy, and quality. Peaks that appear pure based on retention time alone may, in fact, be mixtures of coeluted components, leading to inaccurate quantitative results and potentially compromising patient safety [1] [2]. This guide provides a comprehensive framework for developing robust, scientifically sound acceptance criteria for purity tests within HPLC method validation, with a specific focus on demonstrating peak purity.
Theoretical Foundations of Peak Purity
The Concept of Spectral Peak Purity
At its core, peak purity assessment in HPLC seeks to answer a critical question: "Is this chromatographic peak composed of a single chemical compound?" However, conventional techniques more accurately answer a refined question: "Is this chromatographic peak composed of compounds having a single spectroscopic signature?" [1]. This distinction is crucial, as it highlights the methodology's reliance on the uniqueness of a compound's spectroscopic properties, typically measured using a photodiode array (PDA) or mass spectrometry (MS) detector.
The theoretical basis for spectral peak purity assessment lies in vector mathematics. A spectrum, measured at n wavelengths, is treated as a vector in n-dimensional space. The similarity between two spectra—for instance, one taken at the peak apex and another at the peak shoulder—is quantified by the angle between their corresponding vectors [1].
Spectral similarity is calculated as the cosine of the angle θ between two spectral vectors, a and b: [ \cos(\theta) = \frac{\mathbf{a} \cdot \mathbf{b}}{\|\mathbf{a}\|\|\mathbf{b}\|} ] An alternate, equivalent calculation uses the correlation coefficient between the two mean-centered spectra [1]. A perfect spectral match yields a θ of 0° (cos θ = 1), while increasing angles indicate decreasing similarity. In practice, structurally similar impurities often have highly similar UV spectra, making their detection and differentiation challenging and requiring careful interpretation [1].
Regulatory Significance in Pharmaceutical Analysis
The rigorous assessment of peak purity is mandated by regulatory frameworks to control impurities in drug substances and products, as outlined in ICH Q3A–Q3D guidelines [1]. The dire consequences of undetected coelution are starkly illustrated by historical examples where one enantiomer of a drug provided therapeutic benefit while its counterpart caused severe toxicity, such as liver poisoning or birth defects [1]. These cases underscore that accurate peak purity assessment is not merely a technical exercise but a critical component of patient safety and product efficacy.
Key Experiments and Methodologies
Developing a validated, stability-indicating HPLC method involves several key experiments designed to challenge the method's ability to accurately quantify the active ingredient and its impurities under a variety of conditions.
Forced Degradation Studies
Forced degradation, or stress testing, is conducted to intentionally degrade the drug substance or product and validate that the analytical method can adequately separate and quantify degradation products [24].
- Purpose: To identify likely degradation pathways and products, and to demonstrate that the method remains specific and stability-indicating in the presence of these degradants [24].
- Protocol: Samples of the drug substance or product are stressed under various conditions, including:
- Acid and Base Hydrolysis: Treatment with solutions like 0.1N HCl and 0.1N NaOH at elevated temperatures (e.g., 40-70°C) for several hours to several days [24].
- Oxidative Degradation: Exposure to oxidizing agents such as 0.1-3% hydrogen peroxide at room or elevated temperatures [24].
- Photolytic Degradation: Exposure to UV and visible light as per ICH Q1B guidelines [24].
- Thermal Degradation: Solid and solution state studies at elevated temperatures (e.g., 50-105°C) [24].
- Evaluation: The stressed samples are analyzed to demonstrate that the method can resolve the API from all degradation products and that mass balance is achieved (approximately 98-102%) [24].
Specificity and Selectivity Assessment
Specificity is the ability of a method to measure the analyte accurately in the presence of other components like impurities, degradants, or excipients [24].
- Protocol:
- Analysis of Interferences: Inject a procedural blank, a placebo (for drug products), and a sample solution to demonstrate no interference at the retention times of the analyte and impurities [24].
- "Cocktail" or Marker Solution: Analyze a mixture of the API spiked with known impurities and degradation products to verify baseline resolution for all critical pairs [24].
- Peak Purity Assessment: For every peak of interest in the stressed samples and the marker solution, peak purity is evaluated using a PDA detector or MS to confirm the absence of coelution [24].
Peak Purity Assessment in Practice
The practical workflow for assessing peak purity using a PDA detector involves several critical steps, as illustrated below.
Critical Steps and Troubleshooting:
- Baseline Removal: Proper baseline correction between the peak start and stop limits is essential before analysis to avoid artifacts [1].
- Spectral Comparison: Spectra from multiple points across the peak (up-slope, apex, down-slope) are compared against a reference spectrum (usually from the peak apex) [1].
- Interpretation: The software calculates a purity angle and a purity threshold. A purity angle less than the purity threshold suggests spectral homogeneity, but this is not a guarantee [2].
- Manual Review: Automated metrics should never be used alone. Analysts must manually inspect overlaid spectra for subtle shape variations, particularly at the peak edges, which can indicate coelution [2].
- Limitations: UV-based peak purity is a powerful tool but has limitations. It cannot distinguish between impurities with nearly identical spectra. Factors like baseline noise and detector sensitivity, especially at low wavelengths, can lead to false positives or negatives [2]. Low signal-to-noise ratios for minor peaks can also compromise the reliability of the purity assessment.
Defining Acceptance Criteria
Scientifically justified acceptance criteria are not one-size-fits-all; they must be tailored to the method's purpose, the analyte's concentration, and regulatory expectations. The following tables summarize typical acceptance criteria for various validation parameters relevant to purity testing.
Table 1: General Acceptance Criteria for HPLC Method Validation Parameters for Purity Tests
| Validation Parameter | Typical Acceptance Criteria for Purity/Related Substances | Key Considerations & Justification |
|---|---|---|
| Specificity | No interference from blank, placebo, or known impurities. Resolution (Rs) ≥ 2.0 between critical peak pairs [88]. | Demonstrates the method can distinguish the analyte from other components. A resolution of ≥2.0 indicates baseline separation [88]. |
| Accuracy (Recovery) | For Impurities: 80-120% recovery at levels near the reporting threshold; 90-110% or 95-105% at higher levels [89] [24]. | The criteria are wider at lower concentrations due to greater analytical variability. The level of acceptable bias is risk-based [89]. |
| Precision (Repeatability) | System Precision: RSD ≤ 2.0% for replicate injections of a standard [88].Method Precision: RSD ≤ 5.0-10.0% for impurity content, depending on level [24]. | Tighter criteria for system performance. Method precision accounts for entire sample preparation and analysis procedure. |
| Linearity | Correlation coefficient (r) ≥ 0.998 [86] [90]. | Demonstrates the detector response is proportional to the analyte concentration over the specified range. |
| Solution Stability | % Difference from initial ≤ 2.0% [90]. | Ensures the analyte in solution does not degrade during the analytical sequence, which could skew results. |
Table 2: Acceptance Criteria for Peak Purity and System Suitability Tests (SSTs)
| Parameter | Acceptance Criteria | Rationale |
|---|---|---|
| Peak Purity (PDA-based) | Purity angle < Purity threshold [2]. Visually similar spectra across the peak with no significant spectral mismatches. | The primary, automated metric. However, must be confirmed by manual spectral review to avoid false negatives/positives [2]. |
| Peak Tailing Factor | USP Tailing Factor (Tf) ≤ 2.0 [88]. | Ensures acceptable peak symmetry for accurate integration, especially important for minor impurities. |
| Theoretical Plates | As specified, often > 2000 for the main peak [88]. | A measure of column efficiency; ensures the system is providing adequate separation power. |
The Scientist's Toolkit: Essential Reagents and Materials
The following table details key materials and reagents essential for conducting rigorous purity tests and method validation.
Table 3: Key Research Reagent Solutions and Materials for Purity Method Validation
| Item / Reagent | Function / Purpose in Purity Testing |
|---|---|
| Photodiode Array (PDA) Detector | The primary tool for UV-based peak purity assessment. It captures full spectra across a peak, enabling spectral comparison and homogeneity checks [1] [2]. |
| MS-Compatible HPLC System | Provides orthogonal confirmation of peak purity. Mass spectrometry detects coelution based on mass differences, which is more definitive than UV spectral differences, especially for trace-level impurities [24] [2]. |
| Forced Degradation Reagents | Acids (HCl), bases (NaOH), oxidants (H2O2), etc., used in stress studies to generate degradation products and challenge method specificity [24]. |
| Certified Reference Standards | High-purity materials of the API and known impurities/degradants. Essential for confirming identity, establishing retention times, and determining relative response factors for accurate quantification [24] [90]. |
| Placebo Formulation | A mock drug product containing all excipients but without the API. Used in specificity testing to demonstrate that excipient peaks do not interfere with the analyte peaks [24]. |
| Chromatography Data System Software | Software with advanced peak purity algorithms to calculate spectral contrast angles, purity thresholds, and generate 3D contour plots for visual data interrogation [1]. |
Advanced Techniques and Orthogonal Methods
When PDA-based peak purity analysis is inconclusive or when a higher level of confidence is required, advanced and orthogonal techniques are employed.
- Liquid Chromatography-Mass Spectrometry (LC-MS): This is the most powerful orthogonal technique for peak purity assessment. It identifies coelution based on mass differences rather than UV spectral shape, making it highly effective for detecting impurities with similar UV spectra but different molecular weights [2].
- 2D-LC (Two-Dimensional Liquid Chromatography): This technique offers a robust solution for complex separations where coelution cannot be resolved in a single chromatographic run. In 2D-LC, fractions from a first separation column are selectively transferred to a second column with different separation mechanics (orthogonal selectivity), physically separating components that coelute in the first dimension [1].
- Method Optimization Software: Utilizing software tools that employ quality-by-design (QbD) principles helps ensure methods are robust from the start. These tools can model the impact of various chromatographic parameters (e.g., pH, temperature, gradient) on critical resolutions, defining a "design space" where the method meets all acceptance criteria [1] [24].
The logical relationship and application of these techniques in a comprehensive purity investigation strategy can be visualized as a decision pathway.
Developing scientifically justified acceptance criteria for purity tests is a multifaceted process that extends beyond simply adopting regulatory guidelines. It requires a deep understanding of the chemical properties of the analyte and its potential impurities, the principles of chromatographic separation, and the capabilities and limitations of detection technologies. A robust purity method is built on a foundation of rigorous forced degradation studies, specificity testing, and systematic peak purity assessment using PDA and/or MS detection. The resulting acceptance criteria must be risk-based, phase-appropriate, and thoroughly documented. By adhering to this science-based approach, researchers and drug development professionals can ensure their HPLC methods are truly stability-indicating, capable of controlling product quality, and ultimately, of safeguarding patient health.
In high-performance liquid chromatography (HPLC) method validation, demonstrating peak purity is essential to prove that the signal for an analyte originates from a single compound and is not compromised by co-eluting impurities [2]. This verification is critical in pharmaceutical quality control, where undetected coelution can lead to inaccurate quantification, potentially masking impurities and compromising drug safety and efficacy [9] [2]. The two most prevalent techniques for this assessment are the Photodiode Array (PDA) detector and Liquid Chromatography-Mass Spectrometry (LC-MS). This whitepaper provides a comparative analysis of these techniques, detailing their fundamental principles, operational methodologies, and respective strengths and limitations within the context of HPLC validation. The objective is to equip researchers and drug development professionals with the knowledge to select and implement the most appropriate purity-control strategy for their analytical methods.
Fundamental Principles and Mechanisms
Photodiode Array (PDA) Detection
The principle of peak purity assessment using a PDA detector is based on the spectral similarity across a chromatographic peak [3] [91]. A PDA detector collects ultraviolet-visible (UV-Vis) spectra at multiple points across the peak—typically at the upslope, apex, and downslope.
- Spectral Comparison: For a pure peak, all normalized spectra collected across the peak should be identical and overlay perfectly [91]. If a co-eluting impurity is present and has a distinct UV spectrum, the spectral shapes at different points of the peak will vary, indicating impurity [3].
- Purity Angle and Threshold: The comparison is quantitatively expressed through algorithms that calculate a purity angle and a purity threshold [3]. The purity angle is a numerical measure of spectral variation across the peak. The purity threshold, derived from baseline noise, defines the maximum allowable variation for a peak to be considered pure. A peak is typically deemed pure if the purity angle is less than the purity threshold [3].
Liquid Chromatography-Mass Spectrometry (LC-MS) Detection
LC-MS assesses peak purity based on mass-to-charge ratios (m/z) rather than spectral shape [2]. It detects coelution by identifying multiple ions with different masses within the same chromatographic peak.
- Mass Spectrometric Detection: A mass spectrometer functions as a mass-selective detector. It can be set to monitor specific ion currents for the analyte and potential impurities [92].
- Detection of Coelution: If a chromatographic peak consists of a single compound, the mass spectra acquired across the peak should show a consistent ion profile. The presence of multiple, distinct mass spectra or ions at different retention times within the same peak provides definitive evidence of coelution [2]. LC-MS is particularly powerful for identifying low-level contaminants that may not have a distinct UV signature [2].
The following diagram illustrates the core decision-making pathway for assessing peak purity using these two techniques.
Comparative Technical Performance
The choice between PDA and LC-MS involves trade-offs across several performance parameters, as summarized in the table below.
Table 1: Technical Comparison of PDA and LC-MS for Peak Purity Assessment
| Parameter | PDA Detection | LC-MS Detection |
|---|---|---|
| Fundamental Principle | Spectral similarity in UV-Vis region [3] | Difference in mass-to-charge (m/z) ratios [2] |
| Primary Purity Metric | Purity Angle vs. Purity Threshold [3] | Presence of multiple ions at same retention time [92] |
| Key Strength | Detects impurities with differing UV spectra | Detects impurities with similar UV spectra but different masses [2] |
| Major Limitation | Cannot distinguish compounds with identical/very similar UV spectra (e.g., isomers) [75] | Cannot distinguish isobaric compounds (same molecular weight) |
| Sensitivity to Impurities | Lower; requires sufficient spectral contrast and concentration | High; can detect very low-level impurities based on mass difference [2] |
| Ideal Use Case | Routine analysis of compounds with distinct UV profiles from potential impurities | Research, method development, and cases where UV detection is insufficient [2] |
Detailed Experimental Protocols
Peak Purity Assessment Using PDA
A robust PDA-based purity method requires careful parameter optimization [91].
Step 1: Method Development and Sample Preparation
- Prepare a standard solution of the target analyte to yield a peak maximum absorbance of less than 1.0 AU to avoid Beer's law deviations that can cause spectral inhomogeneity [91].
- For impurity detection, prepare a sample solution spiked with known or potential impurities at appropriate levels.
Step 2: Critical PDA Instrument Parameters
- Wavelength Range: Set the range to start above the UV cutoff of the mobile phase and end at a wavelength that covers all analyte absorbance areas [91].
- Spectral Resolution: Select a high resolution (e.g., 1.2 nm) for the best possible spectral definition [91].
- Sampling Rate: Configure the rate to acquire at least 12-20 spectra across the narrowest peak of interest to ensure adequate data points for comparison [91].
Step 3: Data Analysis and Interpretation
- Process the data using the HPLC system's software (e.g., Waters Empower, Agilent ChemStation) [3].
- The software will overlay normalized spectra from across the peak and compute the purity angle and purity threshold.
- Interpretation: Visually inspect the spectral overlay. A pure peak is indicated by a purity angle less than the purity threshold and well-overlaid spectra [3]. Never rely on the purity score alone; manual review of spectral plots is essential [2].
Peak Purity Assessment Using LC-MS
LC-MS methods provide orthogonal confirmation and require different optimization strategies [92].
Step 1: Method Development and Sample Preparation
- Prepare analyte and spiked samples similar to the PDA protocol, considering compatibility with MS detection (e.g., use volatile buffers).
Step 2: Critical LC-MS Instrument Parameters
- Ionization Source: Typically, Electrospray Ionization (ESI) is used for polar molecules [92].
- Mass Range and Mode: Select an appropriate mass range to encompass the [M+H]+/[M-H]- ions of the analyte and potential impurities. For targeted analysis, Multiple Reaction Monitoring (MRM) offers high sensitivity [92].
- Sampling Rate: Set to acquire 15-20 spectra across the narrowest peak. Note that the sampling rate is often automatically adjusted based on the selected mass range [91].
Step 3: Data Analysis and Interpretation
- Extract Ion Chromatograms (EICs) for the analyte ion and ions corresponding to potential impurities.
- Examine the mass spectra at different time points across the chromatographic peak.
- Interpretation: A pure peak will show a consistent mass spectrum and a single peak in the EIC for the analyte ion. The appearance of different fragment ions or multiple peaks in different EICs at the same retention time confirms co-elution [2].
The workflow for a comprehensive purity assessment strategy that leverages both techniques is shown below.
Advanced Techniques and Emerging Approaches
Two-Dimensional Correlation Analysis
For complex analyses, advanced chemometric tools can enhance purity assessment. Two-dimensional correlation (2D-corr) analysis can be applied to data from multi-channel detectors, like a coulometric array, to deconvolve co-eluting species [9].
- Methodology: The analysis generates synchronous and asynchronous contour plots from the detector's multi-channel data. The synchronous plot indicates the number of distinct components, while the asynchronous plot reveals their distribution within the peak [9].
- Application: This technique was successfully used to identify three co-eluting compounds (quinic acid, ascorbic acid, and phenylalanine) in a Capsicum chili extract that appeared as a single peak in the chromatogram, with the results confirmed by LC-MS [9].
Statistical and Algorithmic Approaches
Beyond standard software metrics, alternative data processing methods are being developed to improve reliability.
- Ellipsoid Volume Method: One proposed protocol involves normalizing spectra across a peak, performing linear regression on each pair of spectra, and calculating statistical parameters (slope, intercept, correlation coefficient) [14]. The mean and standard deviation of these parameters define an ellipsoid in 3D space. A smaller ellipsoid volume indicates higher spectral homogeneity and thus a purer peak [14].
- Evolving Factor Analysis: This multivariate technique can check peak purity without prior information about the solutes. Its optimal performance requires a data rate of ~1 Hz and that the maximal absorbance be kept below 0.4 AU to minimize the influence of non-constant variance and spectral noise [93].
The Scientist's Toolkit: Essential Reagents and Materials
The following table lists key materials and their functions for conducting reliable peak purity studies.
Table 2: Essential Research Reagents and Materials for Peak Purity Experiments
| Item | Function / Purpose | Example from Literature |
|---|---|---|
| Core-Shell C18 Column | High-efficiency stationary phase for achieving optimal peak separation and resolution. | Ascentis Express C18 or F5 [94], Kinetex C18 [14] [8] |
| Volatile Buffers/Salts | Provides pH control for LC separation while being compatible with MS detection (no ion suppression). | Ammonium Acetate [94] [8], Ammonium Formate |
| HPLC-Grade Solvents | Mobile phase components with low UV cutoff and minimal impurities for consistent baseline and sensitivity. | Acetonitrile, Methanol [94] [8] |
| PDA Detector | Instrument for acquiring full UV-Vis spectra across chromatographic peaks for spectral comparison. | Agilent 1260 DAD [14], Waters ACQUITY PDA [91] |
| Mass Spectrometer | Instrument for definitive identification of co-elution based on mass differences. | Q Exactive Orbitrap [9], LC-MS-IT-TOF [94] |
| Chemical Standards | High-purity reference materials for method development and as system suitability controls. | USP Reference Standards [14] [8] |
Both PDA and LC-MS are indispensable tools for demonstrating peak purity in HPLC method validation, yet they operate on complementary principles. PDA is a robust, cost-effective tool for routine analysis and can efficiently screen for impurities with distinct UV profiles. However, its limitations become apparent with chemically similar impurities and isomers. LC-MS provides definitive, orthogonal confirmation of purity with superior sensitivity and specificity based on mass difference, making it ideal for method development, research, and resolving ambiguous PDA results. A strategic approach often involves using PDA for initial method development and routine monitoring, while reserving LC-MS for troubleshooting, confirmation, and analyzing compounds where UV detection is inadequate. Ultimately, a thorough purity assessment should not rely on a single software metric but on a holistic strategy that may include both techniques, optimized separation conditions, and careful manual data review to ensure the accuracy and reliability of analytical results in drug development.
Documentation and Reporting Best Practices for Regulatory Audits
In High-Performance Liquid Chromatography (HPLC) validation research, comprehensive documentation and robust reporting practices are not merely administrative tasks—they form the foundational evidence required to demonstrate method validity, particularly for critical attributes like peak purity. Regulatory audits from agencies such as the FDA, EMA, and other global bodies scrutinize this documentation to verify that analytical methods are fit for purpose and generate reliable, reproducible data. Within this framework, proving peak purity—the demonstration that a chromatographic peak represents a single analyte without co-eluting impurities—becomes paramount for method specificity and overall product quality assurance.
Peak purity assessment provides essential evidence that analytical methods can accurately distinguish the target analyte from potential interferences, including impurities, degradation products, or matrix components. This technical guide outlines the documentation and reporting best practices necessary to withstand regulatory scrutiny during audits, with a specific focus on how these practices substantiate peak purity claims within a validated HPLC method.
Regulatory Framework and Core Documentation Requirements
Governing Guidelines and Principles
HPLC method validation and documentation practices must adhere to established international regulatory guidelines. The International Council for Harmonisation (ICH) guideline Q2(R1) provides the primary framework for validation parameters and their documentation requirements [95]. Furthermore, compliance with principles outlined by the FDA, EMA, and pharmacopeial standards (USP/BP) is mandatory for regulatory approval [96] [97].
Data integrity must be maintained according to the ALCOA+ principles, ensuring all analytical data is Attributable, Legible, Contemporaneous, Original, and Accurate, plus Complete, Consistent, Enduring, and Available [98]. These principles require tracking not just final results but every step of data processing, every manual integration decision, and every system modification with tamper-proof electronic records.
Essential Documents for Regulatory Audits
A complete documentation package for an HPLC method validation must include the following core documents:
- Validation Plan: Overview of the method, analyte, validation strategy, and predefined acceptance criteria [95] [96]
- Method Development Report: Records of optimization experiments, column selection, mobile phase composition, and detection parameters [96]
- Standard Operating Procedures (SOPs): Detailed instructions for routine method execution, sample preparation, and instrument operation [96]
- Validation Report: Comprehensive summary of validation results with raw data attachments, chromatograms, calculations, and conclusions against acceptance criteria [95] [96]
- System Suitability Test Records: Documentation demonstrating the system performed adequately before and during validation experiments [96] [97]
- Electronic Data and Audit Trails: Tamper-proof raw data files with complete audit trails of all processing steps and changes [98]
Table: Core Documentation Requirements for HPLC Method Validation Audits
| Document Type | Primary Purpose | Key Contents | Regulatory Reference |
|---|---|---|---|
| Master Validation Plan | Defines overall validation strategy | Scope, acceptance criteria, risk assessment | ICH Q2(R1), ICH Q9 |
| Method Development Report | Records method optimization history | Column selection, mobile phase optimization, detection parameters | FDA Guidance on Method Validation |
| Validation Protocol | Details experimental approach | Specific procedures for testing each validation parameter | ICH Q2(R1) |
| Validation Report | Summarizes validation outcomes | Results, statistical analysis, deviation reports, final conclusion | ICH Q2(R1), USP <1225> |
| System Suitability Records | Demonstrates instrument readiness | Resolution, tailing factor, precision, retention time reproducibility | USP <621> |
Documenting Peak Purity Assessment
Method Specificity and Peak Purity Protocols
Peak purity confirmation is a critical component of method specificity, requiring documented evidence that the method can unequivocally distinguish the analyte from potential interferences. The documentation must include specific experimental protocols designed to challenge method specificity under various conditions [95] [96].
Forced Degradation Studies: Stress samples should be prepared under controlled conditions including acid, base, oxidation, thermal, and photolytic stress to generate potential degradation products [96]. The protocol must document:
- Specific stress conditions (concentration, temperature, duration)
- Sample preparation procedures
- Chromatographic conditions used for analysis
- Results demonstrating separation of the analyte peak from degradation products
Specificity Challenges: Documentation should include chromatographic comparisons of blank matrix, placebo formulations, and spiked samples to confirm absence of interfering peaks at the retention time of the target analyte [95].
Peak Purity Assessment Techniques: For diode array detector (DAD) data, documentation should include:
- Spectral comparison across the peak at upslope, apex, and downslope positions
- Purity factor calculations or match angle results
- Overlay of normalized spectra demonstrating homogeneity
Table: Peak Purity Assessment Techniques and Documentation Requirements
| Assessment Technique | Experimental Protocol | Required Documentation | Acceptance Criteria |
|---|---|---|---|
| Diode Array Detector (DAD) Spectral Analysis | Collect spectra across the peak (up-slope, apex, down-slope) | Overlaid normalized spectra, purity angle/ threshold plots, instrument software reports | Purity angle less than purity threshold; spectral homogeneity |
| Forced Degradation Studies | Stress samples (acid, base, oxidation, heat, light); analyze stressed samples | Chromatograms showing separation of analyte from degradation products; mass balance calculations | Baseline resolution between analyte and nearest degradant; mass balance ~100% |
| Orthogonal Method Comparison | Analyze samples using different chromatographic conditions (column, pH, etc.) | Comparative chromatograms from different methods; co-elution testing | Consistent potency results across methods; no peak splitting |
| Mass Spectrometry Detection | Use LC-MS to monitor specific ions across the peak | Extracted ion chromatograms; mass spectra at different peak points | Single mass spectrum across the peak; consistent ratio of qualifier/quantifier ions |
Workflow for Peak Purity Documentation
The following diagram illustrates the comprehensive workflow for establishing and documenting peak purity evidence:
Structured Reporting for Validation Parameters
Quantitative Data Presentation
Structured reporting of validation parameters requires clear presentation of quantitative data with predefined acceptance criteria. The following tables represent standardized formats for reporting key validation parameters that support method validity, including peak purity.
Table: Validation Parameters Reporting Template with Acceptance Criteria
| Validation Parameter | Experimental Procedure | Results | Acceptance Criteria | Conclusion |
|---|---|---|---|---|
| Specificity/Peak Purity | Inject blank, placebo, standard, sample; forced degradation studies | No interference observed; peak purity angle < threshold | Resolution > 2.0 between analyte and closest eluting peak; peak purity factor ≥ 990 | Pass/Fail |
| Linearity | Prepare minimum of 5 concentrations (80-120% of target); inject in triplicate | R² = 0.999; y-intercept not significantly different from zero | R² ≥ 0.998; %RSD of response factors ≤ 2.0% | Pass/Fail |
| Accuracy | Spike analyte at 80%, 100%, 120% levels; minimum n=3 per level | Mean recovery 99.5-101.2% across levels | Recovery 98-102% at each level | Pass/Fail |
| Precision | ||||
| - Repeatability | Inject 6 replicates of homogeneous sample | %RSD = 0.17% | %RSD ≤ 1.0% | Pass/Fail |
| - Intermediate Precision | Different analyst, day, instrument | %RSD = 0.52% between setups | %RSD ≤ 2.0% between setups | Pass/Fail |
| Robustness | Deliberate variations in flow rate, temperature, mobile phase composition | %RSD < 1.0% across all variations | System suitability criteria met in all conditions | Pass/Fail |
Table: System Suitability Testing Requirements
| Parameter | Procedure | Acceptance Criteria | Documentation |
|---|---|---|---|
| Resolution | Measure between critical peak pairs | ≥ 2.0 between analyte and closest potential interferent | Chromatogram with marked peak pairs and calculated resolution |
| Tailing Factor | Calculate at 5% peak height | ≤ 2.0 | Instrument software report with calculated values |
| Theoretical Plates | Calculate for analyte peak | ≥ 2000 | Instrument software report with calculated values |
| Relative Standard Deviation (RSD) | Inject 6 replicate standard preparations | ≤ 1.0% for retention time; ≤ 2.0% for peak area | Tabulated results with calculated %RSD |
The Scientist's Toolkit: Essential Research Reagent Solutions
Table: Essential Materials and Reagents for HPLC Method Validation
| Item | Function | Specification Requirements | Documentation Needs |
|---|---|---|---|
| HPLC Column | Stationary phase for chromatographic separation | L3 silica column (250mm × 4.6mm, 5µm) or equivalent; specified chemistry and dimensions | Certificate of analysis; column performance history; use log |
| Reference Standards | Quantification and identification reference | Certified purity ≥ 98%; traceable to primary reference standard | Certificate of analysis; storage conditions; expiration date |
| Mobile Phase Components | Liquid carrier for analyte separation | HPLC-grade solvents (n-hexane, ethyl acetate, etc.); specified ratio (85:15 v/v) [97] | Lot numbers; preparation records; expiration dates; filtration documentation |
| Sample Preparation Solvents | Dissolving and extracting analytes | Appropriate purity for intended use; compatibility with method | Lot numbers; preparation records; expiration dates |
| System Suitability Standards | Verify system performance before analysis | Known composition and concentration to test critical parameters | Preparation records; acceptance criteria; results documentation |
Electronic Data Management and Compliance
Data Integrity and Audit Trail Requirements
Modern HPLC systems generate extensive electronic data that must be managed with strict integrity controls. Regulatory compliance requires complete data lifecycle management from acquisition through archival [98].
Chromatography Data Systems (CDS) must be configured to capture all raw data files with associated metadata. The system should automatically record [95] [98]:
- User identification with time-stamped login/logout
- All data processing steps, including integration parameters and manual changes
- Sequence of injections with method parameters
- Audit trails that track every modification without overwriting original data
Electronic Signatures must comply with 21 CFR Part 11 requirements, including non-repudiation and binding of signature to respective records [96].
Data Migration and Long-term Archival
HPLC data must be retained for the entire product lifecycle, which may extend decades. Documentation should include [98]:
- Defined archival procedures with regular verification of data retrievability
- Migration strategies that preserve data integrity during technology changes
- Vendor-neutral formats to prevent obsolescence of proprietary data formats
- Regular testing of data recovery procedures to ensure continued accessibility
Preparation for Regulatory Audits
Pre-Audit Preparation Checklist
Effective preparation for regulatory audits involves systematic review and organization of all method validation documentation:
- Document Organization: Compile complete validation package with clear version control and cross-referencing between documents
- Data Verification: Perform spot-check verification of reported results against raw data to ensure consistency
- Personnel Preparation: Ensure all team members understand their roles, the validation methodology, and the location of supporting documents
- Electronic System Readiness: Verify accessibility of electronic records and functionality of audit trail review tools
Common Audit Findings and Mitigation Strategies
Common deficiencies in HPLC method validation documentation include:
- Incomplete Forced Degradation Studies: Ensure stress conditions are sufficiently rigorous to generate meaningful degradation products
- Inadequate Peak Purity Evidence: Include multiple assessment techniques (DAD, MS, orthogonal methods) for comprehensive peak purity demonstration
- Poorly Documented Integration Changes: Maintain complete records of all manual integration events with scientific justification for each change
- Insufficient System Suitability Documentation: Include system suitability test results for every analytical run with out-of-specification investigations when applicable
Comprehensive documentation and structured reporting are fundamental to demonstrating HPLC method validity and withstanding regulatory scrutiny during audits. By implementing the practices outlined in this guide—with particular emphasis on robust peak purity assessment—scientists can generate defensible evidence that their methods produce reliable, accurate, and reproducible results. In an increasingly regulated environment, thorough documentation practices not only facilitate successful regulatory audits but also strengthen the scientific foundation of pharmaceutical development and quality control.
Conclusion
Demonstrating peak purity is not a standalone test but a fundamental, integrated component of HPLC method validation that underpins drug safety and efficacy. A successful strategy combines a deep understanding of foundational principles with the practical application of PDA and orthogonal techniques like LC-MS, all while anticipating and troubleshooting common pitfalls. Ultimately, confidence in peak purity is achieved by correlating spectral data with robust chromatographic separation, comprehensive forced degradation studies, and mass balance. As analytical challenges grow more complex with new drug modalities, the continued adoption of advanced deconvolution software and two-dimensional LC will be crucial for future-proofing analytical methods and ensuring patient safety in an evolving pharmaceutical landscape.
References
- 1. Peak Purity in Liquid Chromatography, Part I [https://www.chromatographyonline.com/view/peak-purity-liquid-chromatography-part-i-basic-concepts-commercial-software-and-limitations]
- 2. Peak Purity in HPLC: Assessment, Troubleshooting, and ... [https://www.sepscience.com/peak-purity-in-hplc-assessment-troubleshooting-and-best-practices-11506]
- 3. Calculation of Peak Purity in HPLC - Industrial Pharmacist [https://industrialpharmacist.com/2025/01/calculation-of-peak-purity-in-hplc/]
- 4. Peak Purity Parameters for PDA Data - Tip255 - Waters [https://support.waters.com/KB_Inf/Empower_Tips_of_the_Week/WKB224471_Peak_Purity_Parameters_for_PDA_Data]
- 5. Empower 3 PDA: What is Purity 1 Angle, Purity 1 Threshold ... [https://support.waters.com/KB_Inf/Empower_Breeze/WKB85832_Empower_3_PDA_What_is_Purity_1_Angle_Purity_1_Threshold_How_is_the_peak_purity_determined]
- 6. Empower TIp: Peak Purity - Waters Help Center [https://help.waters.com/help/en/product-support/empower-chromatography-data-system-support/empower-tips/tip-255.html]
- 7. Peak Purity Analysis [https://www.elementlabsolutions.com/uk/chromatography-blog/post/peak-purity-analysis]
- 8. Simultaneous Development and Validation of an HPLC ... [https://pmc.ncbi.nlm.nih.gov/articles/PMC12526389/]
- 9. Determination of Peak Purity in HPLC by Coupling ... [https://pmc.ncbi.nlm.nih.gov/articles/PMC8914781/]
- 10. Design and validation of a robust stability-indicating reversed ... [https://pmc.ncbi.nlm.nih.gov/articles/PMC12619242/]
- 11. Q3B(R) Impurities in New Drug Products (Revision 3) [https://www.fda.gov/regulatory-information/search-fda-guidance-documents/q3br-impurities-new-drug-products-revision-3]
- 12. Elemental impurities testing and specification limits - ICH ... [https://www.europeanpharmaceuticalreview.com/article/82507/elemental-impurities-update-ichq3d/]
- 13. Elemental Impurities in Drug Products Guidance for Industry [https://www.fda.gov/regulatory-information/search-fda-guidance-documents/elemental-impurities-drug-products-guidance-industry]
- 14. Peak Spectral Homogeneity in LC/DAD [https://www.mdpi.com/2227-9717/12/12/2887]
- 15. DAD : spectral homogeneity [http://www.chromforum.org/viewtopic.php?t=3200]
- 16. Effect of spectral resolution, detector linearity and ... [https://www.sciencedirect.com/science/article/pii/S002196739489096X]
- 17. Separation of Chromatographic Co-Eluted Compounds by ... [https://pmc.ncbi.nlm.nih.gov/articles/PMC8065729/]
- 18. Co-Elution: How to Detect and Fix Overlapping Peaks. [https://axionlabs.com/chromatography-training/co-elution-in-chromatography/]
- 19. Advances in Impurity Profiling of Pharmaceutical ... [https://biomedres.us/fulltexts/BJSTR.MS.ID.009393.php]
- 20. The Hidden Risks in Analytical Method Validation - [https://pharmuni.com/2025/05/16/the-hidden-risks-in-analytical-method-validation/]
- 21. A new RP-HPLC approach for estimation of potential ... [https://pmc.ncbi.nlm.nih.gov/articles/PMC11907861/]
- 22. Analytical Method Transfer Between Laboratories [https://www.labmanager.com/method-transfer-between-laboratories-challenges-and-solutions-34250]
- 23. Development and validation of a RP-HPLC method for ... [https://www.nature.com/articles/s41598-025-09904-0]
- 24. Validation of Stability-Indicating HPLC Methods for ... [https://www.chromatographyonline.com/view/validation-of-stability-indicating-hplc-methods-for-pharmaceuticals-overview-methodologies-and-case-studies]
- 25. Development and Validation of Stability-indicating HPLC ... [https://pmc.ncbi.nlm.nih.gov/articles/PMC4293685/]
- 26. Peak purity determination with principal component ... [https://pubmed.ncbi.nlm.nih.gov/15032344/]
- 27. How to Identify Peaks in a Chromatogram, Assign Correct ... [https://www.sorbtech.com/2025/07/how-to-identify-peaks-in-a-chromatogram/]
- 28. Diode Array Detector HPLC | DAD [https://scioninstruments.com/us/blog/diode-array-detector-hplc/]
- 29. Photodiode Array Detection in Clinical Applications [https://www.intechopen.com/chapters/18835]
- 30. Photodiode Array - an overview [https://www.sciencedirect.com/topics/engineering/photodiode-array]
- 31. Photodiode Arrays: Technical Overview and Comparative ... [https://lontenoe.com/photodiode-arrays-technical-overview-and-comparative-product-analysis/]
- 32. Development and Validation of an HPLC-PDA Method for ... [https://pubmed.ncbi.nlm.nih.gov/40283917/]
- 33. Validation of a High-Performance Liquid Chromatography ... [https://pubmed.ncbi.nlm.nih.gov/35164366/]
- 34. A High-Performance Liquid Chromatography with ... [https://www.mdpi.com/2072-6643/15/18/4061]
- 35. Development and Validation of a HPLC–PDA Method for ... [https://www.mdpi.com/2076-3417/10/16/5482]
- 36. Empower Tip: Review Window and the Processing Method [https://help.waters.com/help/en/product-support/empower-chromatography-data-system-support/empower-tips/tip-136.html]
- 37. Peak purity: purity angle < purity th. Versus Purity plot [http://www.chromforum.org/viewtopic.php?t=23379]
- 38. DAD Peak Purity Analysis in OpenLab CDS - Articles [https://community.agilent.com/knowledge/chromatography-software-portal/kmp/chromatography-software-articles/kp1181.dad-peak-purity-analysis-in-openlab-cds]
- 39. Optimization and Validation of an HPLC Method ... [https://pmc.ncbi.nlm.nih.gov/articles/PMC12409534/]
- 40. Spectral and chromatographic overall analysis: An insight ... [https://www.sciencedirect.com/science/article/abs/pii/S0021967319309501]
- 41. Utilizing Spectral Analysis in HPLC Diode Array to ... [https://www.pharmtech.com/view/utilizing-spectral-analysis-hplc-diode-array-discover-impurities]
- 42. Liquid chromatography–tandem mass spectrometry for ... [https://pmc.ncbi.nlm.nih.gov/articles/PMC9735147/]
- 43. 8 Essential Characteristics of LC-MS/MS Method Validation [https://www.resolian.com/bioanalytics/8-essential-characteristics-of-lc-ms-ms-method-validation/]
- 44. Development and Validation of a Novel LC-MS/MS Method for ... [https://pmc.ncbi.nlm.nih.gov/articles/PMC9953620/]
- 45. HPLC Method Development and Validation for ... [https://www.pharmtech.com/view/hplc-method-development-and-validation-pharmaceutical-analysis]
- 46. Tutorial review on validation of liquid chromatography ... [https://www.sciencedirect.com/science/article/abs/pii/S0003267015001944]
- 47. Anvisa RDC 964/2025: What You Need To Know About ... [https://www.lhasalimited.org/blog/anvisa-rdc-964-2025/]
- 48. The LCGC Blog: HPLC Diagnostic Skills III [https://www.chromatographyonline.com/view/lcgc-blog-hplc-diagnostic-skills-iii-systematic-investigation-selectivity-changes]
- 49. The Role of Selectivity in Liquid Chromatography Method ... [https://www.restek.com/articles/the-role-of-selectivity-in-liquid-chromatography-method-development?srsltid=AfmBOoo_5Wz0wnLrEEZD_4uQ0_Gn7Qqhh79SGSGszUdAaMt015soZ4NZ]
- 50. Design and validation of a robust stability-indicating ... [https://pubmed.ncbi.nlm.nih.gov/41241756/]
- 51. Robust RP-HPLC method with forced degradation studies ... [https://link.springer.com/article/10.1007/s44371-025-00276-y]
- 52. A challenging multi-purpose HPLC-DAD concurrent ... [https://www.sciencedirect.com/science/article/abs/pii/S0026265X25016960]
- 53. A Standardized 2D-LC Screening Platform for Peak Purity ... [https://www.chromatographyonline.com/view/a-standardized-2d-lc-screening-platform-for-peak-purity-determination-in-pharmaceutical-analysis]
- 54. Peak Purity in Liquid Chromatography, Part III: Using Two- ... [https://www.chromatographyonline.com/view/peak-purity-liquid-chromatography-part-iii-using-two-dimensional-liquid-chromatography]
- 55. Selection of columns and mobile phases [https://pubmed.ncbi.nlm.nih.gov/36841023/]
- 56. Optimizing 2D-LC method development for QC test methods [https://www.selectscience.net/article/optimizing-2d-lc-method-development-for-qc-test-methods]
- 57. Two-Dimensional Liquid Chromatography Method for the ... [https://pmc.ncbi.nlm.nih.gov/articles/PMC9498109/]
- 58. HPLC Content Determination Method Validation [https://www.welch-us.com/blogs/knowleage-base/hplc-content-determination-method-validation-a-comprehensive-guide]
- 59. Method validation - spike recoveries [http://www.chromforum.org/viewtopic.php?t=6019]
- 60. A critical view on spike recovery for accuracy evaluation ... [https://www.sciencedirect.com/science/article/abs/pii/S0731708511007412]
- 61. HPLC 2025 Preview: Prioritization Strategies in Non-Target ... [https://www.chromatographyonline.com/view/hplc-2025-preview-prioritization-strategies-in-non-target-screening-of-environmental-samples-by-chromatography-with-high-resolution-mass-spectrometry]
- 62. HPLC Troubleshooting Guide [https://www.thermofisher.com/us/en/home/industrial/chromatography/chromatography-learning-center/high-performance-liquid-chromatography-hplc-support/hplc-troubleshooting.html]
- 63. correcting detection and quantitation bias in extractables ... [https://link.springer.com/article/10.1007/s00216-025-05946-5]
- 64. Methods for Changing Peak Resolution in HPLC [https://www.chromatographyonline.com/view/methods-changing-peak-resolution-hplc-advantages-and-limitations]
- 65. 26.4: Optimization and Column Performance [https://chem.libretexts.org/Bookshelves/Analytical_Chemistry/Instrumental_Analysis_(LibreTexts)/26%3A_Introduction_to_Chromatographic_Separations/26.04%3A_Optimization_and_Column_Performance]
- 66. Real Solutions to Improve Your HPLC Peak Resolution [https://www.thermofisher.com/blog/analyteguru/real-solutions-to-improve-your-hplc-peak-resolution/]
- 67. Validation of the High-Performance Liquid ... [https://pmc.ncbi.nlm.nih.gov/articles/PMC11699575/]
- 68. HPLC Method Development Steps [https://www.thermofisher.com/us/en/home/industrial/chromatography/chromatography-learning-center/liquid-chromatography-information/hplc-method-development-steps.html]
- 69. How to Troubleshoot Baseline Noise in HPLC [https://uhplcs.com/how-to-troubleshoot-baseline-noise-in-hplc/]
- 70. Why Signal-to-Noise Ratio Determines Limit of Detection [https://www.thermofisher.com/blog/analyteguru/hplc-troubleshooting-tips-why-signal-to-noise-ratio-determines/]
- 71. The LCGC Blog: HPLC Diagnostic Skills—Noisy Baselines [https://www.chromatographyonline.com/view/lcgc-blog-hplc-diagnostic-skills-noisy-baselines-1]
- 72. From Detector to Decision, Part IV: Demystifying Peak ... [https://www.chromatographyonline.com/view/from-detector-to-decision-part-iv-demystifying-peak-integration]
- 73. Confirming Peak Integration [https://www.shimadzu.com/an/service-support/technical-support/analysis-basics/tips/confirming.html]
- 74. Playing with Selectivity for Optimal Chiral Separation [https://www.chromatographyonline.com/view/playing-with-selectivity-for-optimal-chiral-separation]
- 75. in Peak : Enhancing Analysis Accuracy Purity Chromatography [https://www.sepscience.com/hplc-solutions-84-peak-purity-6917]
- 76. What Is The Difference Between HILIC Columns VS ... [https://uhplcs.com/what-is-the-difference-between-hilic-columns-vs-normal-reverse-columns/]
- 77. HILIC and Aqueous Normal Phase Chromatography [https://www.chromatographyonline.com/view/comparison-two-separation-modes-hilic-and-aqueous-normal-phase-chromatography]
- 78. Innovations in Liquid Chromatography: 2025 HPLC ... [https://www.chromatographyonline.com/view/innovations-in-liquid-chromatography-2025-hplc-column-and-accessories-review]
- 79. Isomer separation by CPC chromatography [https://hub.rotachrom.com/app-isomer-separation]
- 80. Liquid Chromatographic Peak Purity Assessments in ... [https://www.chromatographyonline.com/view/liquid-chromatographic-peak-purity-assessments-in-forced-degradation-studies---an-industry-perspective]
- 81. Development and validation of a stability-indicating HPLC ... [https://www.nature.com/articles/s41598-024-84849-4]
- 82. Q2(R2) Validation of Analytical Procedures March 2024 [https://www.fda.gov/regulatory-information/search-fda-guidance-documents/q2r2-validation-analytical-procedures]
- 83. ICH Q2(R2) Validation of analytical procedures [https://www.ema.europa.eu/en/ich-q2r2-validation-analytical-procedures-scientific-guideline]
- 84. [June 2024] Implementing ICH Q2(R2) Validation of ... [https://insider.thefdagroup.com/p/june-2024-implementing-ich-q2r2-validation]
- 85. Steps for HPLC Method Validation [https://www.pharmaguideline.com/2017/12/hplc-method-validation.html]
- 86. Validation of the HPLC Analytical Method for ... [https://pmc.ncbi.nlm.nih.gov/articles/PMC10171759/]
- 87. Adjusting Conditions for a Routine Reversed-Phase HPLC ... [https://www.chromatographyonline.com/view/adjusting-conditions-routine-reversed-phase-hplc-assay-part-ii-changing-separation-conditions]
- 88. System suitability Requirements for a USP HPLC Method [https://www.mtc-usa.com/kb-article/aa-03965]
- 89. Analytical Method Validation Acceptance Criteria [http://www.chromforum.org/viewtopic.php?t=88905]
- 90. Management of validation of HPLC method for ... [https://www.nature.com/articles/s41598-021-99269-x]
- 91. Considerations for Collecting Data Suitable for Peak Purity ... [https://support.waters.com/KB_Inf/Empower_Tips_of_the_Week/WKB222744_Considerations_for_Collecting_Data_Suitable_for_Peak_Purity_Determination]
- 92. A Simple LC-MS/MS Method for the Quantification of PDA- ... [https://pmc.ncbi.nlm.nih.gov/articles/PMC8840185/]
- 93. Efficiency of an automatic peak purity control procedure in ... [https://www.sciencedirect.com/science/article/abs/pii/0169743993890153]
- 94. LC-MS/MS and LC-PDA Methods for Robust Determination of ... [https://pmc.ncbi.nlm.nih.gov/articles/PMC12060053/]
- 95. HPLC Method Validation: Ensuring Accuracy and Regulatory ... [https://www.mastelf.com/hplc-method-validation-ensuring-accuracy-and-regulatory-compliance/]
- 96. Creating an Effective HPLC Validation Protocol With a Step ... [https://altabrisagroup.com/hplc-validation-protocol-example/]
- 97. Development and Validation of Novel HPLC Methods for ... [https://pmc.ncbi.nlm.nih.gov/articles/PMC11054345/]
- 98. HPLC Data Interpretation and Management [https://www.scispot.com/blog/hplc-data-interpretation-and-management-tools-techniques-and-compliance]