Assay vs. Impurity Method Validation: A Guide to ICH Q2(R2) Compliance and Lifecycle Management
This article provides a comprehensive guide for researchers and drug development professionals on the distinct validation requirements for assay and impurity methods.
Assay vs. Impurity Method Validation: A Guide to ICH Q2(R2) Compliance and Lifecycle Management
Abstract
This article provides a comprehensive guide for researchers and drug development professionals on the distinct validation requirements for assay and impurity methods. Aligned with the latest ICH Q2(R2) and FDA guidelines, it covers foundational principles, methodological applications, and troubleshooting strategies. Readers will gain a clear understanding of how to apply a science- and risk-based approach to method validation, from setting an Analytical Target Profile (ATP) to managing the entire method lifecycle, ensuring regulatory compliance, product quality, and patient safety.
Understanding the Core Principles and Regulatory Landscape of Method Validation
Defining Analytical Method Validation (AMV) and Its Role in GMP and Product Quality
Analytical Method Validation (AMV) is the process of proving that an analytical method is acceptable for its intended purpose, providing documented evidence that the method consistently produces reliable and accurate results during routine use [1] [2]. In the context of Good Manufacturing Practice (GMP), AMV is not merely a scientific exercise but a federal requirement essential for ensuring the identity, potency, quality, and purity of drug substances and products [3]. A well-validated method provides the assurance that every future measurement in routine analysis will be close enough to the unknown true value for the content of the analyte in the sample, thereby directly safeguarding product quality and patient safety [1].
The validity of an analytical method is deeply intertwined with the specific guideline and performance criteria selected, as numerous international standards exist with differences in terminology, experimental procedure, and acceptance criteria [1]. This guide will objectively compare the validation requirements for two critical analytical applications: assay methods and impurity methods, highlighting the distinct performance benchmarks for each.
Key Performance Characteristics in Method Validation
The performance characteristics, or validation parameters, collectively provide a comprehensive picture of a method's reliability. The requirements for these parameters, however, differ significantly based on the method's intended use.
The table below summarizes the core performance characteristics and their fundamental definitions [4] [2].
Table 1: Core Performance Characteristics of Analytical Method Validation
| Performance Characteristic | Definition |
|---|---|
| Accuracy | The closeness of agreement between a measured value and an accepted reference or true value [4] [2]. |
| Precision | The closeness of agreement (degree of scatter) between a series of measurements from multiple sampling of the same homogeneous sample [4]. This is evaluated at three levels: repeatability, intermediate precision, and reproducibility [4] [2]. |
| Specificity | The ability to measure the analyte accurately and specifically in the presence of other components that may be expected to be present in the sample (e.g., impurities, degradants, excipients) [2]. |
| Linearity | The ability of the method to obtain test results that are directly proportional to the analyte concentration within a given range [2]. |
| Range | The interval between the upper and lower concentrations of analyte that have been demonstrated to be determined with suitable precision, accuracy, and linearity [4] [2]. |
| Detection Limit (LOD) | The lowest amount of analyte in a sample that can be detected, but not necessarily quantified, under the stated experimental conditions [4] [2]. |
| Quantitation Limit (LOQ) | The lowest amount of analyte in a sample that can be quantitatively determined with acceptable precision and accuracy [4] [2]. |
| Robustness | A measure of the method's capacity to remain unaffected by small, deliberate variations in method parameters (e.g., flow rate, temperature, mobile phase pH) [2]. |
Comparative Validation: Assay vs. Impurity Methods
The extent and acceptance criteria for validating performance characteristics are driven by the method's purpose. Assay methods are designed to measure the main active component, while impurity methods must detect and quantify minor components, often at very low levels, making their validation more stringent in specific areas.
The table below provides a detailed comparison of experimental protocols and acceptance criteria for assay and impurity methods, based on ICH and other regulatory guidelines [4] [3].
Table 2: Validation Protocol Comparison: Assay vs. Impurity Methods
| Validation Parameter | Assay Method Protocol & Acceptance | Impurity Method Protocol & Acceptance |
|---|---|---|
| Accuracy | Protocol: Compare results to a standard reference material or by spiking drug product placebo with known amounts of analyte [4] [2]. Minimum of 9 determinations over 3 concentration levels [2].Acceptance: Typically 98-102% recovery for drug substance [4]. | Protocol: Assess by spiking drug substance/product with known amounts of impurities. If unavailable, compare to a second well-characterized procedure [2] [3].Acceptance: 90-110% for impurities at 0.5-1.0%; wider ranges (e.g., 80-120%) may be acceptable for lower levels [3]. |
| Precision (Repeatability) | Protocol: Minimum of 6 determinations at 100% of test concentration or 9 determinations over the specified range [4] [2].Acceptance: Low %RSD (e.g., <1%) is expected [4]. | Protocol: Analyze six samples of drug substance/product containing impurities [3].Acceptance: %RSD is highly dependent on impurity level; higher %RSD (e.g., 10-20%) may be acceptable at very low levels near the LOQ [3]. |
| Specificity | Protocol: Demonstrate that the assay is unaffected by the presence of excipients or impurities. For chromatography, use peak purity tests (e.g., DAD or MS) [2].Acceptance: No interference from blank; resolution of critical pairs [2]. | Protocol: Requires rigorous forced degradation studies (acid, base, oxidation, thermal, photolytic) to demonstrate separation of all potential degradation products from each other and the main peak [3].Acceptance: Resolution between all peaks, typically NLT 1.0-1.5; successful peak purity assessment [3]. |
| Linearity & Range | Protocol: Minimum of 5 concentration levels [4] [2].Range: Typically 80-120% of the test concentration [4].Acceptance: Coefficient of determination (R²) typically >0.95-0.99 [4] [3]. | Protocol: Minimum of 5 concentration levels for each impurity [3].Range: From LOQ to 120-150% of the specification limit for the impurity [4] [3].Acceptance: R² >0.95 may be acceptable for one-point calibration, but higher linearity is preferred [3]. |
| LOD/LOQ | Protocol & Acceptance: Often less critical for the main assay. Can be determined via signal-to-noise (S/N: 3:1 for LOD, 10:1 for LOQ) or based on standard deviation of the response and slope of the calibration curve [4] [2]. | Protocol & Acceptance: Critical parameter. Must be sufficiently low to detect and quantify impurities at reporting thresholds. LOQ should be at or below the reporting threshold (e.g., 0.1-0.05%) [3]. S/N of 10:1 is standard for LOQ [4] [2]. |
| Robustness | Protocol: Deliberate, small changes in operational parameters (e.g., flow rate ±0.02 mL/min, mobile phase composition ±2%, temperature ±2°C) [3].Acceptance: Method remains unaffected with comparable results to the original conditions [3]. | Protocol & Acceptance: More critical due to the potential for co-elution. Test parameters that could affect the separation of impurities (e.g., pH of mobile phase, column temperature, different columns). Acceptance is tied to maintaining system suitability and resolution [3]. |
| System Suitability | Protocol: A set of checks (e.g., precision, tailing factor, theoretical plates) to ensure the system is functioning correctly at the time of the test [2]. | Protocol & Acceptance: Extremely critical. Often includes testing with a stressed sample to demonstrate that the method can still separate critical impurity pairs before every run, preventing out-of-specification (OOS) results due to system variability [3]. |
Experimental Workflow for Analytical Method Validation
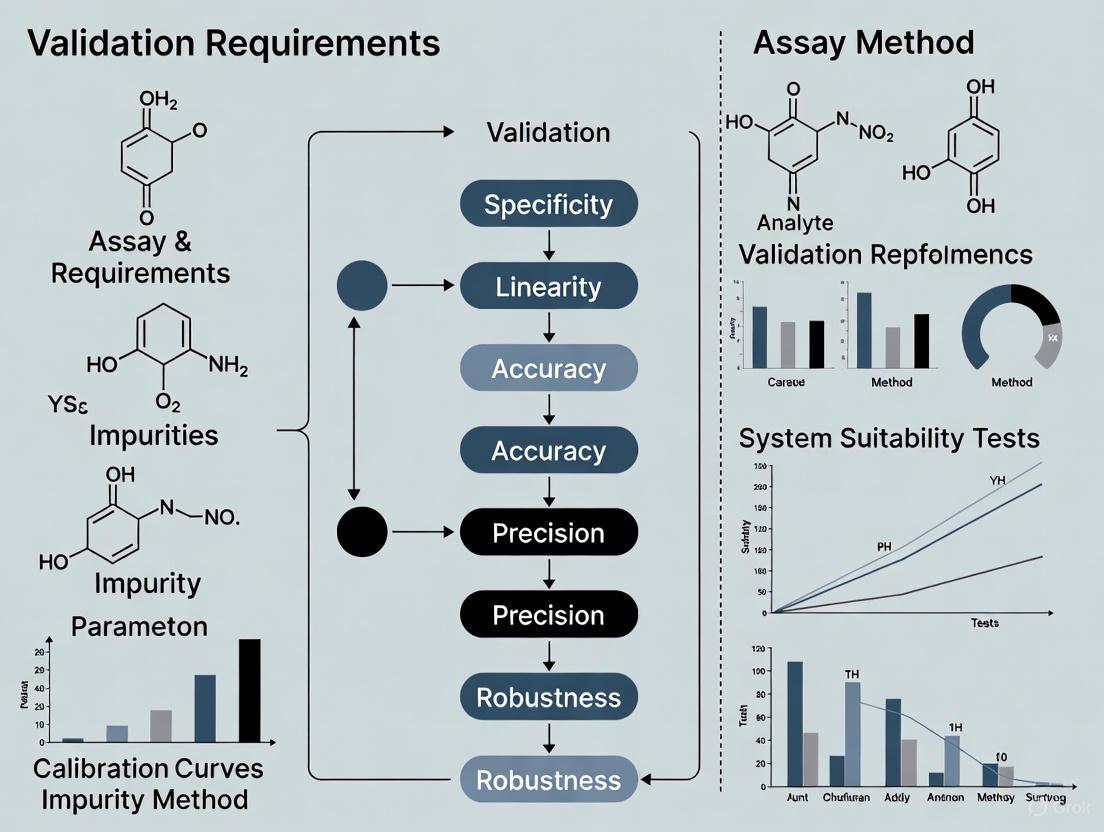
The following diagram illustrates the logical progression of a comprehensive method validation study, from initial planning to final assessment of acceptability, integrating the key performance characteristics.
The Scientist's Toolkit: Essential Reagents and Materials
Successful method validation relies on high-quality, well-characterized materials. The table below lists key research reagent solutions and their critical functions in the validation process, particularly for chromatographic methods.
Table 3: Essential Research Reagent Solutions for Method Validation
| Reagent / Material | Function in Validation |
|---|---|
| Drug Substance (Reference Standard) | Serves as the primary benchmark of known purity and identity for establishing accuracy, linearity, and precision for assay methods. It may also be used as a surrogate for impurities when they are unavailable [4] [3]. |
| Known Impurity Standards | Pure, well-characterized impurities are essential for validating impurity methods. They are used to spike samples for accuracy, precision, specificity, and to establish LOD/LOQ [2] [3]. |
| Placebo/Excipient Mixture | A synthetic mixture containing all components of the drug product except the active analyte. It is used in specificity testing to demonstrate no interference and in accuracy studies for drug products by spiking with the analyte [4]. |
| Stressed Samples (Forced Degradation) | Samples of the drug substance or product that have been intentionally degraded under various stress conditions (e.g., acid, base, oxidation, heat, light). These are critical for demonstrating the specificity and stability-indicating properties of a method [3]. |
| High-Purity Solvents & Mobile Phases | Essential for preparing samples and mobile phases. Their purity is critical to avoid introducing artifacts, elevated baselines, or noise that can interfere with the analysis, particularly for LOD/LOQ determination [4] [2]. |
| Characterized Chromatographic Columns | Columns from different lots or manufacturers are used during robustness and intermediate precision testing to ensure the method's performance is not overly sensitive to the specific column used [3]. |
Within the framework of GMP, Analytical Method Validation is a foundational element that directly underpins product quality. As demonstrated, a one-size-fits-all approach is not applicable. The validation strategy must be meticulously tailored to the method's purpose. Assay methods focus on accurately and precisely quantifying the major active component over a relatively narrow range around the target concentration. In contrast, impurity methods demand a more rigorous approach, with an emphasis on specificity through forced degradation, superior detection sensitivity (LOD/LOQ), and a wider linear range to ensure the reliable quantification of trace-level components that could impact drug safety and efficacy. Understanding these distinctions is paramount for researchers and drug development professionals to design validation protocols that are both compliant and scientifically sound, ensuring the delivery of high-quality medicines to patients.
The International Council for Harmonisation (ICH) provides globally recognized guidelines to ensure the quality, safety, and efficacy of pharmaceuticals. For researchers and drug development professionals, understanding the interplay between ICH Q2(R2) on analytical procedure validation, ICH Q14 on analytical procedure development, and subsequent U.S. Food and Drug Administration (FDA) adoption is crucial for successful regulatory submissions [5]. Issued in March 2024, these documents represent a significant modernization from previous versions, moving from a prescriptive "check-the-box" approach to a more scientific, risk-based, and lifecycle-oriented model [5]. This framework is designed to ensure that a method validated in one region is recognized and trusted worldwide, thereby streamlining the path from development to market [5].
This guide objectively compares the application of these guidelines, focusing specifically on validation requirements for two critical analytical procedures: assay methods and impurity methods. The core thesis is that while the fundamental validation principles apply to both, the specific performance criteria, experimental protocols, and control strategies differ substantially based on the analytical procedure's intended purpose and the associated risk to product quality and patient safety.
Comparative Analysis of ICH Q2(R2), ICH Q14, and FDA Guidance
Scope and Focus
The following table summarizes the distinct yet complementary roles of these key guidelines.
| Guideline | Primary Focus | Key Introductions/Emphases | Regulatory Status |
|---|---|---|---|
| ICH Q2(R2) | Validation of Analytical Procedures [6] | Provides a general framework for validation principles, including modern techniques like spectroscopy and multivariate analysis [6] [5]. | Final guideline, adopted by the FDA (March 2024) [6]. |
| ICH Q14 | Analytical Procedure Development [6] | Introduces Analytical Target Profile (ATP), enhanced development approach, and lifecycle management [5] [7]. | Final guideline, adopted by the FDA (March 2024) [6]. |
| FDA Guidance | Implementation in the US | Adopts and implements ICH Q2(R2) and Q14, making them critical for NDAs and ANDAs [5]. | The FDA considers these guidances the current standard for regulatory evaluations [6]. |
Core Validation Parameters from ICH Q2(R2)
ICH Q2(R2) outlines the fundamental performance characteristics required to demonstrate an analytical procedure is fit for purpose [5]. The application and acceptance criteria for these parameters vary significantly between assay and impurity methods, as detailed in the table below.
| Validation Parameter | Definition | Application in Assay/Potency Methods | Application in Impurity Methods |
|---|---|---|---|
| Accuracy | Closeness of test results to the true value [5]. | Demonstrated across the specification range, typically using a placebo spike or reference standard [5]. | Critical for quantifying specific identified impurities at or near the specification threshold (e.g., reporting threshold, qualification threshold) [5]. |
| Precision | Degree of agreement among individual test results [5]. | Repeatability: Required with multiple sample preparations of a homogeneous sample. Intermediate Precision: Essential to demonstrate lab/analyst robustness [5]. | Repeatability: Crucial at low impurity levels. Intermediate Precision: Required, as variability can significantly impact quantification near limits [5]. |
| Specificity | Ability to assess the analyte unequivocally in the presence of other components [5]. | Must demonstrate separation from known and potential impurities, excipients, or matrix components [5]. | Highest Priority: Must demonstrate baseline separation of all potential impurities from each other and from the main analyte peak [5]. |
| Linearity & Range | Linearity: Ability to obtain results proportional to analyte concentration. Range: The interval where linearity, accuracy, and precision are demonstrated [5]. | Range typically from 80-120% of the test concentration for drug substance/product assay [5]. | Range should cover from the reporting threshold (e.g., 0.05%) to at least 120% of the specification limit for the impurity [5]. |
| Limit of Detection (LOD) / Quantitation (LOQ) | LOD: Lowest detectable amount. LOQ: Lowest quantifiable amount with accuracy and precision [5]. | Generally not required for the main analyte in assay methods. | Fundamental Requirement: LOQ must be established and validated to be at or below the reporting threshold [5]. |
Experimental Protocols for Method Validation
A robust validation study begins with a protocol derived from the ATP and a thorough risk assessment [5]. The workflow below illustrates the complete lifecycle of an analytical procedure, integrating both development and validation stages.
Defining the Analytical Target Profile (ATP) and Risk Assessment
The ATP is a prospective summary of the analytical procedure's required performance characteristics, defining what the method must achieve [5] [7]. For an impurity method, the ATP would explicitly define the LOQ (e.g., ≤ 0.05%) and required specificity to separate all known potential degradants. For an assay method, the ATP would focus on accuracy (e.g., 98-102%) and precision (e.g., RSD ≤ 1.0%) at the 100% concentration level.
A subsequent risk assessment using tools like Failure Mode and Effects Analysis (FMEA) systematically identifies and ranks factors that could impact the ATP [8]. This assessment directly informs the design of both the method development and validation studies. High-risk factors, such as chromatographic parameters (e.g., pH, gradient) in an HPLC impurity method, become the focus of robustness testing during development and are tightly controlled in the final procedure.
Protocol for a Comparative Accuracy Study
This experiment is fundamental for both assay and impurity methods but is executed differently.
- Objective: To demonstrate the closeness of agreement between the measured value and a accepted reference value [5].
- Materials: Drug substance/product, known impurities, placebo (if applicable), reference standards, and all relevant reagents and solvents.
- Methodology for Assay: Analyze a minimum of 9 determinations over a minimum of 3 concentration levels covering the specified range (e.g., 80%, 100%, 120%). The sample can be a synthetic mixture of the analyte with placebo components spiked with a known quantity of reference standard [5].
- Methodology for Impurities: Spike the drug substance/product with known impurities at various levels, especially at the specification limit (e.g., 0.1%, 0.2%) and the LOQ. The recovery of each impurity is calculated.
- Data Analysis: Report the percent recovery for each level or the difference between the mean and the accepted true value along with confidence intervals [5].
Protocol for a Specificity Study Forced Degradation
This study is critical, especially for stability-indicating methods, to demonstrate the method's ability to measure the analyte amidst degradation products.
- Objective: To prove that the method can unequivocally quantify the analyte (for assay) or detect impurities in the presence of other components [5].
- Materials: Stressed samples (acid, base, oxidative, thermal, photolytic) of the drug substance and product.
- Methodology: Subject samples to various forced degradation conditions to generate ~5-20% degradation. Analyze the stressed samples and demonstrate that the method can:
- For Assay: Resolve all degradation products from the main peak and provide an unbiased assay of the active ingredient.
- For Impurities: Resolve all degradation products from each other (peak purity) and be able to quantify them.
- Data Analysis: Provide chromatograms demonstrating separation and peak purity tools (e.g., from a PDA detector) to demonstrate homogeneity of the analyte peak.
The Scientist's Toolkit: Essential Research Reagent Solutions
The following table lists key materials and solutions required for developing and validating analytical methods, particularly for chromatographic analyses of small molecules and biologics.
| Item / Reagent | Function / Role in Experimentation |
|---|---|
| Reference Standards | Highly characterized substance used as a benchmark for quantitative analysis (e.g., calculating assay content or impurity amount) [8]. |
| System Suitability Solutions | A mixture of key analytes used to verify that the chromatographic system is performing adequately before and during the analysis (e.g., resolution, tailing factor) [8]. |
| Known Impurity Standards | Isolated and characterized impurities used to confirm specificity, establish relative retention times, and calibrate the method for quantitative impurity determination. |
| Placebo/Matrix Formulation | The formulation without the active ingredient. Used in specificity studies to demonstrate no interference and in accuracy studies for spiking experiments [5]. |
| Stability Samples | Samples stored under long-term and accelerated conditions. Used to validate the method's ability to monitor stability and generate degradation profiles [7]. |
| High-Quality Solvents & Reagents | Essential for achieving the required sensitivity (low UV absorbance), specificity, and robust performance. Variations can significantly impact robustness, especially for impurity methods [8]. |
The integrated ICH Q2(R2) and Q14 guidelines, as adopted by the FDA, provide a modern, flexible framework for analytical procedures. The key differentiator in validation requirements for assay versus impurity methods lies in the risk-based application of core validation parameters. Assay methods prioritize accuracy and precision at the 100% level within a narrow range, while impurity methods demand extreme sensitivity (LOQ) and high specificity over a wider dynamic range to control low-level components that impact patient safety.
Success in regulatory compliance hinges on a deep, scientifically justified understanding of the method's purpose, captured prospectively in the Analytical Target Profile, and verified through tailored experimental protocols. This science- and risk-based lifecycle approach not only meets regulatory requirements but also builds more efficient, reliable, and trustworthy analytical procedures, ultimately ensuring product quality and patient safety.
In pharmaceutical development, assay methods for potency and impurity methods for safety represent two distinct analytical pillars that serve fundamentally different purposes in ensuring drug quality. Potency assays are quantitative methods designed to measure the biological activity of an active pharmaceutical ingredient (API) and its ability to elicit a specific therapeutic effect [9]. These functional analyses confirm that a drug possesses the intended pharmacological activity at the declared concentration. In contrast, impurity methods are qualitative and quantitative procedures that identify and measure unwanted components in drug substances or products, serving primarily to ensure patient safety by controlling potentially harmful contaminants [10] [3].
The regulatory framework mandates both types of methods throughout the drug development lifecycle, with potency testing fulfilling requirements for demonstrating effectiveness under 21 CFR 211.165(a) and 21 CFR 600.3(kk), while impurity control addresses safety requirements outlined in various FDA guidances, including those specifically addressing nitrosamine impurities [11] [12] [13]. This article provides a comprehensive comparison of these critical analytical approaches, examining their distinct purposes, methodological requirements, and validation parameters within the context of pharmaceutical quality control.
Purpose and Regulatory Significance
Potency Methods: Demonstrating Therapeutic Efficacy
The primary purpose of potency assays is to provide quantitative measurement of a drug's biological activity and functional integrity, directly confirming its therapeutic capability [13]. Potency methods must be mechanism-reflective, meaning they should measure biological responses that mirror the drug's known mechanism of action (MoA) in vivo [13]. For biopharmaceuticals particularly, potency assays serve as critical quality attributes (CQAs) that ensure batch-to-batch consistency throughout the product lifecycle, from development through commercial manufacturing [13].
Regulatory agencies require potency testing for all licensed biological products under Section 351 of the Public Health Service Act, mandating that manufacturers demonstrate safety, purity, and potency for BLA approval [13]. The FDA requires quantitative functional assays for product release, with some flexibility allowed for complex modalities where surrogate assays may be acceptable to the EMA in certain cases [13]. These requirements underscore the critical role of potency assays in confirming that each drug batch contains the specified strength of active ingredient to deliver the intended therapeutic effect.
Impurity Methods: Ensuring Patient Safety
Impurity methods serve the fundamentally different purpose of identifying and quantifying unwanted components that may pose safety risks to patients [11] [3]. These methods focus on detecting and measuring various impurity categories, including organic impurities (such as nitrosamines), inorganic impurities, and residual solvents [9]. The safety focus is particularly evident in FDA's detailed guidance on nitrosamine impurities, which establishes strict Acceptable Intake (AI) limits based on carcinogenic potency categorization to ensure patient safety [11].
The regulatory framework for impurity control establishes permissible limits based on toxicological data and maximum daily dose considerations [9]. Impurity methods must be capable of detecting contaminants at thresholds specified in ICH guidelines (Q3A, Q3B, Q3C), with particularly stringent requirements for mutagenic impurities following the ICH M7 framework [9]. The primary objective is risk mitigation through rigorous monitoring and control of potentially harmful substances that may form during synthesis, emerge from degradation, or originate from raw materials or packaging components [11] [3].
Table 1: Comparative Analysis of Primary Purposes
| Aspect | Potency Methods | Impurity Methods |
|---|---|---|
| Primary Purpose | Measure biological activity and therapeutic strength [9] [13] | Identify and quantify safety-critical contaminants [11] [3] |
| Regulatory Focus | Confirming efficacy and batch consistency [13] | Ensuring patient safety through impurity control [11] |
| Key Guidance | 21 CFR 600.3(kk); FDA Guidance on Potency Tests [13] | ICH Q3A-Q3C; FDA Nitrosamine Guidance [11] [9] |
| Critical Outcome | Quantitative potency value for release testing [13] | Verification against Acceptable Intake limits [11] |
Methodological Approaches and Techniques
Analytical Techniques for Potency Assessment
Potency determination employs biofunctional assays that measure the drug's specific biological activity through mechanism-relevant systems. For GLP-1 therapeutics and similar biologics, this typically involves cell-based assays measuring downstream signaling events such as cyclic AMP (cAMP) accumulation in cells expressing human target receptors [9]. These complex biological systems account for factors like serum binding effects and provide clinically predictive potency measurements [9].
The industry employs a progressive implementation approach where simpler techniques like ELISA or ligand-binding assays may suffice during early development, advancing to more complex, MoA-reflective cell-based or kinetic assays for later stages and commercial release [13]. Chromatographic techniques such as reversed-phase HPLC/UPLC may support potency assessment when they provide stability-indicating data, but they serve merely as complementary analyses unless they demonstrate direct correlation with biological activity [9].
Diagram 1: Potency assay workflow showing parallel approaches for cell-based and receptor binding assays
Analytical Techniques for Impurity Profiling
Impurity analysis relies primarily on separation techniques coupled with sensitive detection methods. High-performance liquid chromatography (HPLC) is the cornerstone technique for impurity assessment, particularly using reversed-phase methodology for separating drug substances from related impurities [10] [3]. These chromatographic methods are valued for their specificity and selectivity in distinguishing the primary active compound from structurally similar impurities [10].
For comprehensive impurity characterization, HPLC is typically coupled with mass spectrometry (MS) to provide structural identification of unknown impurities and degradants [9]. The technical requirements for impurity methods emphasize sensitivity with limits of detection often at the 0.05-0.1% level relative to the drug substance, and specificity to resolve multiple impurities from each other and from the main API peak [3]. Forced degradation studies are integral to impurity method development, intentionally exposing drugs to acid, base, oxidation, light, and heat to generate potential degradants and verify the method's stability-indicating capability [3].
Table 2: Core Analytical Techniques Comparison
| Technique | Potency Applications | Impurity Applications |
|---|---|---|
| HPLC/UPLC | Supporting technique when correlated with activity [9] | Primary technique for separation and quantification [10] [3] |
| Mass Spectrometry | Limited utility for potency assessment | Structural identification of impurities [9] |
| Cell-Based Assays | Primary method for biofunctional assessment [9] [13] | Generally not applicable |
| Ligand Binding | Alternative method for binding assays [13] | Limited utility |
| Forced Degradation | Not required for potency methods | Required for validation [3] |
Validation Parameters and Requirements
Validation of Potency Assays
Potency assay validation follows ICH Q2(R1) and biological assay guidelines from USP (1033, 1034), with specific adaptations for functional bioassays [13]. The validation parameters reflect the biological nature of these methods and their use in quantifying relative potency rather than absolute concentration:
- Accuracy and Precision: Must demonstrate reliable measurement with acceptable variability through replicate measurements and control samples. Biological systems inherently show higher variability, requiring statistical rigor in validation [13].
- Linearity and Range: Defined differently than for chemical assays; demonstrates linear relationship between predicted and measured relative potencies within a verified reportable range (typically 50% to 150%) [13].
- Specificity: Confirms the assay exclusively measures the intended biological activity without interference from matrix components, impurities, or degradants [13].
- Robustness: Establishes reliability under varied conditions involving different analysts, equipment, or environmental factors [9] [13].
System suitability criteria are particularly critical for potency assays, employing control charts and predefined thresholds to monitor assay performance throughout testing [9] [13].
Validation of Impurity Methods
Impurity method validation follows ICH Q2(R1) requirements with specific acceptance criteria tailored to impurity quantification [3]. The validation parameters address the need for sensitive detection and accurate quantification of minor components:
- Specificity/Forced Degradation: Must demonstrate separation of all potential impurities from each other and the main peak, typically with resolution NLT 1.0. Forced degradation studies under acid, base, oxidation, and photolytic conditions verify the method can detect degradants [3].
- Accuracy: Determined through spike recovery studies (90-110% for 0.5-1.0% impurities; 80-120% for <0.5% impurities). At identification threshold levels (LOQ), recovery of 50-150% may be acceptable [3].
- Precision: Evaluated through repeatability (intra-day) and intermediate precision (inter-day, different analysts) with %RSD acceptance criteria varying based on impurity level [3].
- LOD/LOQ: LOQ should be at or below the reporting threshold (typically 0.1%), with signal-to-noise ratio of 10:1 for LOQ and 3:1 for LOD [3].
Diagram 2: Key validation parameters for potency versus impurity methods
Experimental Protocols and Research Reagents
Detailed Methodologies for Core Applications
Protocol 1: Cell-Based Potency Assay for GLP-1 Therapeutics
This protocol outlines a mechanism-reflective potency assay for GLP-1 receptor agonists using cAMP response measurement [9].
- Cell Preparation: Culture HEK-293 cells stably expressing human GLP-1 receptor in appropriate growth medium. Harvest cells during logarithmic growth phase and prepare suspension at 1×10^6 cells/mL in assay buffer.
- Reference Standard and Sample Preparation: Prepare serial dilutions of reference standard and test samples in assay buffer across the range of 50-150% of expected potency. Include system suitability controls.
- Stimulation and Incubation: Aliquot cell suspension into 96-well plates. Add reference and test sample dilutions to designated wells. Incubate for 60 minutes at 37°C, 5% CO₂ to allow cAMP accumulation.
- cAMP Detection: Lyse cells and quantify intracellular cAMP using competitive immunoassay detection systems according to manufacturer specifications.
- Data Analysis: Generate dose-response curves for reference and test samples. Calculate relative potency using parallel line analysis or four-parameter logistic fit in validated software (e.g., SoftMax Pro). Apply outlier analysis (e.g., Rosner Extreme Studentized Deviate Test) and assess parallelism [13].
Protocol 2: HPLC Impurity Method Validation for Nitrosamine Detection
This protocol describes the validation of an impurity method for specific nitrosamine detection per FDA guidance requirements [11] [3].
Specificity/Forced Degradation:
- Prepare samples under stress conditions: 0.1N HCl (acid), 0.1N NaOH (base), 0.3% H₂O₂ (oxidation), and light exposure (photolytic).
- Inject stressed samples and demonstrate resolution NLT 1.0 between all degradant peaks and the main API peak.
- Perform peak purity assessment using PDA detection to ensure main peak homogeneity.
Accuracy and Precision:
- Spike placebo with known impurities at LOQ, 100%, and 150% of specification level (based on AI limits, e.g., 26.5-1500 ng/day depending on nitrosamine potency category) [11].
- Prepare six samples at each level and analyze against calibrated standards.
- Calculate % recovery (80-120% acceptable for ≤0.5% impurities) and %RSD.
LOD/LOQ Determination:
- Prepare serial dilutions of impurity standards from 0.05% to 0.15% relative to API concentration.
- Inject and determine signal-to-noise ratios of 3:1 for LOD and 10:1 for LOQ.
- Verify LOQ precision with %RSD ≤20% and accuracy 80-120%.
Table 3: Essential Research Reagent Solutions
| Reagent/Material | Function in Potency Assays | Function in Impurity Methods |
|---|---|---|
| Reference Standard | Biological activity calibration [13] | Retention time and response factor determination [3] |
| Cell Lines | GLP-1 receptor expressing for mechanism reflection [9] | Generally not applicable |
| cAMP Detection Kit | Quantifying functional response [9] | Not applicable |
| Impurity Standards | Limited utility | Identification and quantification calibration [3] |
| HPLC Columns | Limited use in potency | Primary separation mechanism [10] [3] |
| Mass Spectrometer | Not typically used | Structural identification of unknown impurities [9] |
Regulatory Frameworks and Compliance Requirements
Distinct Regulatory Expectations
The regulatory frameworks governing potency and impurity methods reflect their different purposes in drug quality assessment. Potency methods for biological products must comply with 21 CFR 600.3(kk), which defines potency as "the specific ability or capacity of the product... to effect a given result" [13]. Release testing must provide quantitative data that meets pre-defined acceptance criteria as specified in 21 CFR 211.165(d) and 21 CFR 610.1 [13].
Impurity methods operate under a different regulatory framework, primarily following ICH Q3A-Q3C guidelines for qualification thresholds, with additional specific guidance for carcinogenic impurities like nitrosamines [11] [9]. The FDA's nitrosamine guidance establishes Acceptable Intake (AI) limits based on carcinogenic potency categorization, with strict limits such as 26.5 ng/day for high-potency category 1 nitrosamines like N-nitroso-benzathine, and 1500 ng/day for lower-potency category 4-5 nitrosamines [11].
Implementation Timelines and Compliance
Regulatory agencies provide updated implementation timelines for impurity control strategies, with recent FDA documents updating recommended timelines through June 2025 [11]. Manufacturers must adhere to these timelines while developing and validating appropriate methods. For both potency and impurity methods, the fundamental requirement is that they must be suitable for their intended use and provide reliable, meaningful data to ensure drugs are safe and effective throughout their shelf life.
Assay methods for potency and impurity analysis serve fundamentally different yet complementary roles in pharmaceutical quality assurance. Potency methods focus on confirming therapeutic activity through mechanism-reflective bioassays, while impurity methods prioritize patient safety through sensitive detection and control of harmful contaminants. The methodological approaches, validation parameters, and regulatory frameworks for each reflect their distinct purposes, with potency assays emphasizing biological relevance and functional assessment, and impurity methods prioritizing separation power and sensitive detection.
Both methodologies are essential components of a comprehensive quality system, providing the critical data needed to ensure that pharmaceutical products are both efficacious and safe for patient use. As regulatory expectations evolve, particularly for challenging impurities like nitrosamines, the continued development and refinement of both potency and impurity methods remains essential for advancing drug quality and patient safety.
The Evolving Regulatory and Scientific Landscape
The development and validation of analytical procedures are undergoing a significant transformation, shifting from a discrete, linear process to an integrated, holistic lifecycle approach. This evolution is driven by the need for more robust, reliable, and fit-for-purpose methods in pharmaceutical analysis, especially when comparing the distinct validation requirements for assay methods versus impurity methods [14].
The traditional view of analytical procedures emphasized a rapid development phase followed by validation and operational use. Changes were difficult to implement, often requiring revalidation or redevelopment. In contrast, the Analytical Procedure Lifecycle Management (APLM) framework introduces a more dynamic, science-based paradigm. This modern approach is championed by regulatory and pharmacopeial bodies, including the U.S. Pharmacopeia (USP), which has drafted a new general chapter, <1220>, to formalize this methodology [14]. The core principle of APLM is that a procedure should be maintained in a state of control throughout its entire lifespan—from initial design through routine use—facilitating continuous improvement and adaptation based on accumulated data [15].
This lifecycle model is particularly crucial when framing a thesis on the validation requirements for assay versus impurity methods. Assay methods, which measure the main active component, typically operate over a wide range (e.g., 70-130% of label claim) and prioritize accuracy and precision. Impurity methods, designed to quantify or qualify trace-level components, demand far greater sensitivity and selectivity, with validation heavily focused on limits of detection (LOD) and quantification (LOQ). The lifecycle approach provides a structured framework for understanding and applying these distinct validation criteria from the outset [14].
The Three Stages of the Analytical Procedure Lifecycle
The APLM framework, as proposed in the draft USP <1220>, consists of three iterative stages that ensure a procedure remains fit for its intended purpose over its entire use. The model incorporates feedback loops for continuous improvement, a critical aspect for maintaining method robustness for both assay and impurity determinations [14]. The workflow and key objectives of this lifecycle are illustrated below.
Stage 1: Procedure Design and Development
The foundation of the lifecycle is the Analytical Target Profile (ATP), a predefined objective that articulates the procedure's requirements for its intended use. The ATP is essentially a "performance specification" that defines the Critical Quality Attributes (CQAs) the method must measure, the required level of accuracy and precision, and the range over which it must operate [14]. For an assay method, the ATP might specify an accuracy of 98-102% and precision of ≤2% RSD. For an impurity method, the ATP would define the required LOQ, often as a low percentage of the drug substance (e.g., 0.05%), and the necessary selectivity to resolve impurities from the main peak and from each other.
Method development then proceeds using Quality-by-Design (QbD) principles. This involves:
- Risk Assessment: Identifying factors (e.g., chromatographic conditions, sample preparation) that could impact method performance.
- Design of Experiments (DoE): Systematically evaluating these factors to understand their interactive effects and establish a Method Operational Design Range (MODR)—the multidimensional space where the method delivers consistent, reliable quality [15]. This structured development is far more likely to yield a robust method suitable for its intended use, whether for assay or impurity profiling.
Stage 2: Procedure Performance Qualification
This stage aligns with the traditional concept of method validation but is conducted with a deeper, data-informed understanding from Stage 1. The goal is to demonstrate that the procedure, as developed, is capable of consistently meeting the criteria defined in the ATP [14]. The validation parameters assessed will differ in emphasis for assay and impurity methods, as detailed in the table below.
Table 1: Key Validation Parameters for Assay vs. Impurity Methods
| Validation Parameter | Assay Method Focus | Impurity Method Focus |
|---|---|---|
| Accuracy (Trueness) | High priority; recovery expected near 100% | Critical for quantification; may be assessed at specific low levels |
| Precision (Repeatability) | High priority; very low RSD expected | Crucial at the LOQ level and reporting threshold |
| Specificity/Selectivity | Must demonstrate no interference from excipients | Must demonstrate baseline separation from all known and potential impurities |
| Linearity & Range | Over a wide range (e.g., 50-150%) around the target concentration | Over a narrow range from the reporting threshold to at least 120% of the specification |
| Limit of Detection (LOD) | Often not critical for main component | Extremely critical; must be sufficient to detect impurities at or below the reporting threshold |
| Limit of Quantification (LOQ) | Often not critical for main component | Extremely critical; must be sufficient to quantify impurities at the reporting threshold with acceptable precision and accuracy |
| Robustness | Should be evaluated against deliberate variations in method parameters | Highly critical; small variations must not impact the separation and quantification of impurities |
Stage 3: Continued Procedure Performance Verification
The lifecycle does not end with validation. Stage 3 involves the ongoing monitoring of the procedure's performance during routine use to ensure it remains in a state of control. This is achieved through strategies like system suitability tests (SST) and tracking of control charts with pre-defined alert and action limits [14]. If data trends indicate a drift in performance, this triggers a feedback loop, prompting investigation and potential method improvement (a return to Stage 1 or 2), thus closing the lifecycle loop.
Modern Tools for Lifecycle Management: RAPI and BAGI
The industry is developing advanced tools to support the quantitative assessment of methods within the APLM framework. A significant recent advancement is the Red Analytical Performance Index (RAPI), a tool designed to standardize the evaluation of the "red" dimension—analytical performance [16] [17].
RAPI provides a structured, semi-quantitative scoring system based on ten key analytical parameters derived from ICH and other regulatory guidelines, including repeatability, intermediate precision, trueness, LOQ, working range, linearity, robustness, and selectivity [17]. Each parameter is scored from 0 to 10, resulting in a final composite score between 0 and 100. This score is visually represented in a radial pictogram, offering an immediate, transparent overview of a method's strengths and weaknesses [16]. RAPI is complemented by its "sister" tool, the Blue Applicability Grade Index (BAGI), which assesses practical and economic aspects ("blue" dimension). Together, they form a comprehensive evaluation system under the White Analytical Chemistry (WAC) model, which integrates performance (red), sustainability (green), and practicality (blue) [17].
Table 2: The Scientist's Toolkit for Analytical Procedure Lifecycle Management
| Tool / Solution | Category | Primary Function in APLM |
|---|---|---|
| Analytical Target Profile (ATP) | Strategic Document | Defines the objective and performance standards for the analytical procedure [14]. |
| Design of Experiments (DoE) | Statistical Framework | Optimizes method conditions efficiently and defines the Method Operational Design Range (MODR) [15]. |
| Red Analytical Performance Index (RAPI) | Assessment Software | Quantifies and visualizes analytical performance for objective comparison and lifecycle monitoring [16] [17]. |
| High-Resolution Mass Spectrometry (HRMS) | Instrumentation | Provides unmatched sensitivity and selectivity for characterizing complex molecules and impurities [15]. |
| Process Analytical Technology (PAT) | Monitoring System | Enables real-time in-process testing and control, supporting Real-Time Release Testing (RTRT) [15]. |
| Cloud-Based LIMS (Laboratory Information Management System) | Data Management | Enables real-time data sharing and collaboration across global sites, underpinning data integrity (ALCOA+) [15]. |
Experimental Protocol for a Comparative Lifecycle Study
To illustrate the application of the APLM concept in a research context, the following is a generalized experimental protocol for a study comparing two analytical procedures—for example, a traditional HPLC method versus a modern UHPLC method for drug assay and impurity profiling.
1. Define the ATP: The study begins by defining a precise ATP. For example: "The procedure must quantify the active pharmaceutical ingredient (API) with an accuracy of 98.0-102.0% and a precision of ≤1.5% RSD, and must simultaneously identify and quantify specified impurities at a level of 0.10% with an accuracy of 90-110% and a precision of ≤5.0% RSD."
2. Method Development via DoE: Both methods are developed using a DoE approach. Critical factors (e.g., column temperature, mobile phase gradient, and pH) are varied within a predefined range. Responses such as peak resolution, tailing factor, and runtime are measured to establish the MODR for each method [15].
3. Procedure Performance Qualification: A full validation is conducted for both methods against the parameters in Table 1, with specific emphasis as dictated by the ATP (e.g., LOQ for impurities).
4. Holistic Assessment with RAPI and BAGI: The validation data from both methods are input into the RAPI software to generate a quantitative performance score and visual pictogram [17]. The methods are also assessed using the BAGI tool to compare practicality (e.g., cost, time, safety).
5. Data Analysis and Lifecycle Selection: The results are synthesized. A hypothetical outcome is summarized below, demonstrating how the lifecycle approach facilitates an objective, multi-faceted comparison.
Table 3: Hypothetical Comparative Data for Two Chromatographic Methods
| Assessment Criteria | Traditional HPLC Method | Modern UHPLC Method | Inference for Lifecycle Management |
|---|---|---|---|
| Analytical Performance (RAPI Score) | 75 / 100 | 88 / 100 | UHPLC demonstrates superior overall performance and robustness. |
| Accuracy (API Assay) | 99.5% | 100.2% | Both methods meet ATP criteria for the main assay. |
| LOQ for Key Impurity | 0.15% | 0.05% | UHPLC method better fulfills the impurity ATP requirement (0.10%). |
| Run Time per Sample | 20 minutes | 5 minutes | UHPLC offers significant throughput advantages for routine use. |
| Organic Solvent Consumption | 12 mL/sample | 3 mL/sample | UHPLC is more environmentally sustainable ("green"). |
| Practicality (BAGI Score) | 65 / 100 | 82 / 100 | UHPLC is more practical and cost-effective over the procedure's lifecycle. |
Conclusion: Based on the holistic data, the UHPLC method, while potentially having a higher initial investment, is more fit-for-purpose according to the ATP, more sustainable, and more practical for long-term lifecycle management. This structured, data-driven comparison supports a sound scientific and business case for its selection and adoption.
When is Validation Required? New Methods, Transfers, and Significant Changes
In pharmaceutical research and development, the reliability of analytical data is the cornerstone of correct scientific interpretation and decision-making. Unreliable results can lead to the over- or underestimation of effects, false interpretations, and unwarranted conclusions, which in a regulatory context, can compromise patient safety and drug efficacy [18]. Validation is the formal process of establishing, through laboratory studies, that the performance characteristics of an analytical method are suitable for its intended analytical purpose [19]. This guide objectively compares validation requirements across three critical scenarios: the introduction of new methods, the transfer of existing methods, and the management of significant changes to validated methods, framed within the specific contexts of assay and impurity methods research.
Part 1: Validation for New Analytical Methods
Core Principles and Regulatory Definitions
Before a new analytical method is used in a regulatory-decision context, its relevance, reliability, and fitness for purpose must be established. According to the Organisation for Economic Co-operation and Development (OECD), validation is “the process by which the reliability and relevance of a particular approach, method, process or assessment is established for a defined purpose” [19]. In plain language, this process assures developers and users that an assay is ready and acceptable for its intended use [19].
- Reliability refers to the reproducibility of the method within and between laboratories over time when performed using the same protocol.
- Relevance ensures the scientific underpinning of the test and that the outcome it measures is meaningful and useful for a particular purpose [19].
This process is supported by agencies like the Interagency Coordinating Committee on the Validation of Alternative Methods (ICCVAM), which evaluates and recommends alternative test methods for regulatory use [19].
Key Validation Parameters: Assay vs. Impurity Methods
The core parameters required for validating a new method are well-established, but the acceptance criteria and relative importance of each parameter can differ significantly between assay and impurity methods. The following table summarizes these parameters and their typical emphasis.
Table 1: Key Validation Parameters for New Assay and Impurity Methods
| Validation Parameter | Brief Description & Purpose | Relative Emphasis for Assay Methods (Quantitative) | Relative Emphasis for Impurity Methods (Quantitative) |
|---|---|---|---|
| Accuracy | Closeness of measured value to true value | High. Critical to demonstrate the method correctly measures the main analyte. | High. Critical for quantifying impurity levels against a reference standard. |
| Precision (Repeatability, Intermediate Precision) | Closeness of agreement between a series of measurements | High. Essential for demonstrating consistency of the main component result. | Very High. Impurities are often at low levels, making precision challenging and critical. |
| Specificity | Ability to assess the analyte unequivocally in the presence of other components | High. Must prove excipients, degradants, or other impurities do not interfere. | Highest. Must separate and quantify multiple impurities from each other and the main analyte. |
| Linearity & Range | The ability to obtain results proportional to analyte concentration, within a specified range | High. A linear response across the expected product strength is required. | High. Must be linear at the low end, covering from reporting threshold to specification limit. |
| Limit of Detection (LOD) | Lowest amount of analyte that can be detected | Low. Not a primary concern for the main component present at high levels. | High. Must be established to know when an impurity is detectable. |
| Limit of Quantification (LOQ) | Lowest amount of analyte that can be quantified with acceptable accuracy and precision | Low. Not a primary concern for the main component. | Very High. Must be established to know when an impurity can be reliably quantified. |
| Robustness | Capacity to remain unaffected by small, deliberate variations in method parameters | Medium-High. Important for method reliability during routine use. | Very High. Small variations can significantly impact the separation and quantification of impurities. |
Experimental Protocol for a New Method Validation Study
A typical validation protocol for a new HPLC method for an impurity procedure would involve the following detailed steps [18]:
Solution Preparation: Prepare a stock solution of the drug substance and its known impurities. From this, prepare a series of solutions for the validation study:
- Accuracy/Recovery Solutions: Spiked samples at multiple concentration levels (e.g., 50%, 100%, 150% of the specification level) in the presence of the drug product matrix.
- Precision Solutions: A minimum of six independent preparations at the 100% level of the specification.
- Linearity Solutions: A minimum of five concentrations spanning from the LOQ to 150-200% of the specification limit.
- Specificity Solutions: Individual solutions of the main analyte, each impurity, and placebos of the sample matrix to demonstrate separation and lack of interference.
Instrumentation and Data Acquisition: Analyses are performed using a qualified HPLC system with a diode array detector (DAD). The chromatographic conditions (column, mobile phase, gradient, temperature, flow rate) are set as per the method. Data on peak area, retention time, and resolution are recorded.
Data Analysis and Calculation:
- Accuracy: Calculate the mean percentage recovery for the analyte at each level. The mean recovery should be within 98-102%.
- Precision: Calculate the %Relative Standard Deviation (%RSD) of the peak areas for the six preparations. An %RSD of not more than 5.0% is typically acceptable for impurities.
- Linearity: Plot the peak area against the concentration and perform linear regression analysis. The correlation coefficient (r) should be greater than 0.999.
- LOD/LOQ: Determine based on a signal-to-noise ratio of 3:1 for LOD and 10:1 for LOQ, confirmed by injecting standards at those levels with acceptable accuracy and precision.
Part 2: Validation During Method Transfer
The Purpose of Transfer Validation
Method transfer is the process of qualifying a receiving laboratory (RL) to execute a validated analytical method that was developed and validated in a transferring laboratory (TL). The goal is to ensure the method performs in the RL as reliably as it does in the TL, ensuring data consistency across sites.
Comparative Study Designs for Method Transfer
The core of a method transfer is a comparison study. The design of this study depends on the goal and the nature of the methods being compared [20].
Table 2: Quantitative Comparison Approaches in Method Transfer
| Comparison Approach | Description & Formula | Best Suited For |
|---|---|---|
| Mean Difference (Constant Bias) | Calculates the average difference between results from the RL and TL.Formula: ( \text{Mean Difference} = \frac{\sum{i=1}^{n} (Ri - Ti)}{n} ) Where ( Ri ) = Receiving Lab result, ( T_i ) = Transferring Lab result. | Comparing parallel instruments or labs running the exact same method. Assumes any difference is constant across the concentration range [20]. |
| Bias as a Function of Concentration (Regression) | Uses linear regression (e.g., Passing-Bablok) to model the relationship and estimate bias across the measuring range. | Situations where the RL uses different instrumentation or a slightly modified method, and bias is expected to vary with concentration [20]. |
| Sample-Specific Differences | Examines the difference for each sample individually. The overview report shows the smallest and largest difference. | Small-scale transfers with a limited number of samples (e.g., <10), or when ensuring every sample result is within pre-set bias goals [20]. |
Experimental Protocol for a Method Transfer Study
A standard protocol for an inter-laboratory method transfer is as follows [20]:
Pre-Transfer Agreement: The TL and RL agree on the transfer protocol, which includes the number of samples (typically a minimum of 3 lots analyzed in triplicate each), acceptance criteria (e.g., %RSD <2.0%, mean difference ±2.0%), and the responsibilities of each lab.
Sample Selection: The TL provides the RL with homogeneous samples of known concentration, including drug substance and finished product batches, which cover the expected range.
Execution: Analysts at the RL, who have been trained on the method, perform the analysis independently following the written method procedure.
Data Analysis: Both labs perform statistical analysis on the collected data. The RL's results are compared against the TL's results or the known reference values. A statistical test like the t-test is often used to compare the means of the two data sets, with a significance level of p > 0.05 indicating no statistically significant difference.
Part 3: Validation for Significant Changes
Defining a "Significant Change"
In the context of maintaining validated systems, a significant change is any modification that could reasonably be expected to affect the safety or effectiveness of a product or the performance of an analytical method [21]. This is a crucial concept in regulated manufacturing and laboratory environments. The guiding principle is that implementing change in a validated system is a critical time for ensuring it remains controlled [22].
Categorizing Changes and Required Re-validation
Not all changes are equal. They can be categorized to determine the appropriate level of re-validation effort [22].
Table 3: Categories of Change and Corresponding Re-validation Actions
| Change Category | Description & Examples | Typical Re-validation Action |
|---|---|---|
| Minor | A change with minimal impact and low risk. *Examples: *Changing a supplier for a equivalent solvent. Software update for a bug fix with no functionality change. | Minimal testing. Limited re-validation focused only on the specific element changed. Testing is confined to the directly affected component [22]. |
| Major | A change with a notable, direct impact on the method or system.Examples: Changing a column from one manufacturer to another (same chemistry claimed). Changing the wavelength of a detector. Modifying a mobile phase pH by ±0.1 units. | Wide-ranging testing. Requires re-validation of areas both directly and indirectly impacted. A full suite of validation parameters (e.g., Specificity, Precision, Accuracy) may need to be partially or fully re-executed to prove the change did not adversely affect the method [22]. |
| Critical | A change with a substantial, system-wide impact and high risk.Examples: Changing the core analytical technique (e.g., from HPLC to UPLC). Extending the method to a new matrix. Changing the active pharmaceutical ingredient (API) synthesis route. | Full re-validation. Typically requires re-validating the entire method as if it were new. All key parameters must be re-evaluated to establish that the method remains suitable for its intended use [22]. |
The Change Management and Re-validation Workflow
A structured change management process is essential for handling modifications to validated systems [22].
Experimental Protocol for Assessing a Significant Change
The evaluation of a significant change, such as a major modification to an HPLC method, follows a rigorous process [22] [21]:
Change Request and Impact Assessment: A formal change request is submitted, detailing the proposed change (e.g., "Replace Column A with Column B"). The impact on the method's performance, the product's quality attributes, and the patient is assessed.
Risk Assessment: A risk assessment is conducted to identify potential new hazards or shifts in existing risks. It estimates the probability and severity of harm and determines the acceptability of the residual risk. This assessment is crucial for justifying the extent of re-validation [21].
Re-validation Testing Protocol: Based on the categorization (e.g., Major), a targeted re-validation protocol is written. For a column change, this would typically require re-evaluating:
- System Suitability: Ensuring it still meets criteria with the new column.
- Specificity: Demonstrating that resolution between the main peak and impurities is maintained.
- Precision: Performing a minimum of six injections of a standard to confirm repeatability. The tests are performed in a controlled, non-production "sandbox" environment if possible [22].
Documentation and Implementation: The results are documented, and if successful, the change is implemented in the live environment. The validation documentation is updated to reflect the new method conditions, ensuring the system remains in a validated state [22].
The Scientist's Toolkit: Essential Reagents and Materials for Validation
The following table details key materials used in a typical bioanalytical method validation study, such as for quantifying a drug and its metabolites in plasma [18].
Table 4: Key Research Reagent Solutions for Bioanalytical Validation
| Item | Function in Validation |
|---|---|
| Analyte of Interest (Drug Substance) | The primary target molecule for quantification. Serves as the reference standard for preparing calibration curves and quality control samples. |
| Stable Isotope-Labeled Internal Standard (IS) | A chemically identical version of the analyte with atoms replaced by stable isotopes (e.g., ²H, ¹³C). Added to all samples to correct for variability in sample preparation and instrument response [18]. |
| Control Blank Matrix | The biological fluid (e.g., human plasma) free of the analyte. Used to prepare calibration standards and quality control (QC) samples and to demonstrate specificity by showing no interfering peaks. |
| Certified Reference Standards for Metabolites/Impurities | Highly purified and well-characterized materials used to identify and quantify degradation products or metabolites. Critical for validating impurity methods. |
| Quality Control (QC) Samples | Samples spiked with known concentrations of the analyte (Low, Mid, High) in the control matrix. These are treated as unknown during analysis to assess the accuracy and precision of the run. |
| Matrix Effect Evaluation Solutions | Solutions used to investigate ion suppression or enhancement in mass spectrometry. Often involve post-column infusion of the analyte while injecting a blank matrix extract [18]. |
Validation is not a one-time event but an ongoing commitment to data quality and integrity throughout the lifecycle of an analytical method. The rigor and scope of validation are dictated by the specific trigger: new method development demands a comprehensive, parameter-based approach; method transfer relies on comparative statistical studies to ensure consistency; and the management of significant changes requires a risk-based assessment to determine the appropriate level of re-validation. For researchers in drug development, a deep understanding of these requirements, particularly the nuanced differences between assay and impurity methods, is not merely a regulatory hurdle but a fundamental scientific practice that ensures the safety and efficacy of medicinal products.
Applying Validation Parameters: A Practical Guide for Assay and Impurity Methods
In the highly regulated world of pharmaceutical development, demonstrating that an analytical method is "fit for purpose" is a fundamental requirement. The Analytical Target Profile (ATP) has emerged as the foundational concept to formally define this fitness, providing a prospective summary of the performance requirements an analytical procedure must meet to reliably report on a product's critical quality attributes (CQAs) [23]. This guide compares how the ATP is applied to two critical analytical procedures: assay methods and impurity methods, highlighting their distinct performance requirements and validation strategies.
The Analytical Target Profile: A Strategic Foundation
The ATP is a strategic tool that defines the quality of the reportable value needed from an analytical procedure, ensuring it is suitable for its intended use and capable of supporting key decisions about product quality and compliance [24]. It is the analytical equivalent of the Quality Target Product Profile (QTPP) for a drug product [23].
The lifecycle of an analytical procedure, guided by the ATP, is a continuous process from definition through post-approval change management. The following diagram illustrates this workflow and the role of the ATP within it.
Comparative Analysis: Assay vs. Impurity Methods
While the ATP framework is consistent, the specific performance criteria it defines vary significantly depending on the procedure's purpose. The table below summarizes the key distinctions in how ATP requirements are applied to assay methods versus impurity methods.
Table 1: ATP and Validation Requirements Comparison: Assay vs. Impurity Methods
| Characteristic | Assay/Potency Methods | Impurity Methods |
|---|---|---|
| Primary ATP Focus | Accuracy and precision of the main component measurement [8]. | Specificity, sensitivity, and ability to separate and quantify minor components [3]. |
| Key Validation Parameters | Accuracy, Precision, Linearity, Range [25]. | Specificity/Forced Degradation, LOD/LOQ, Range [3] [25]. |
| Accuracy & Precision Acceptable Ranges | Typically tighter ranges (e.g., 98-102%) for the main analyte [8]. | Wider, level-dependent ranges (e.g., 90-110% at 0.5-1.0%; 80-120% for levels <0.5%) [3]. |
| Specificity & Forced Degradation | Must demonstrate no interference from excipients or impurities [25]. | Critical to demonstrate separation of all potential impurities from each other and the main peak. Requires stress studies to predict future impurities [3]. |
| Linearity & Range | Typically 80-120% of the test concentration [25]. | From LOQ (e.g., 0.05%) to at least 1.5x the specification limit [3]. |
| System Suitability | Ensures system performance is adequate for the intended assay measurement. | Often includes a degraded sample to demonstrate ongoing separation capability for critical impurity pairs [3]. |
Experimental Protocols for Method Validation
The validation experiments conducted are direct implementations of the criteria established in the ATP. The protocols below are typical for demonstrating key ATP requirements.
Protocol 1: Establishing Specificity for an Impurity Method via Forced Degradation
For impurity methods, specificity is paramount and is rigorously demonstrated through forced degradation studies [3].
- Objective: To demonstrate the method can separate and quantify known and potential degradation products from the active pharmaceutical ingredient (API) and from each other.
- Sample Preparation: The drug substance or product is stressed under various conditions including acid, base, oxidation, thermal, and photolytic stress. The conditions should be "realistic and practical" [3]. For example, for a drug product stable at pH 3-5, acid degradation should be studied in more detail than base degradation.
- Data Analysis:
- Peak Purity: Use a diode array detector (DAD) to ensure the main peak is pure and not hiding any co-eluting impurities. Note that peak purity can be misleading if an impurity has a similar spectrum, so the method should be challenged with different chromatographic parameters (e.g., new column lot) [3].
- Mass Balance: An attempt is made to account for all degradation products and the remaining API. While a mass balance of 100% is ideal, values as low as 80% can be acceptable with proper justification (e.g., non-UV absorbing degradants, difference in response factors) [3].
Protocol 2: Determining Accuracy and Precision for an Assay Method
For an assay method, the ATP requires a high degree of confidence in the reportable value for the main component [24] [8].
- Objective: To prove the method can recover the API from the sample matrix with high accuracy and precision.
- Sample Preparation: A placebo blend representative of the drug product formulation is spiked with known quantities of the API at multiple concentration levels, typically 80%, 100%, and 120% of the target concentration. For drug substance, the API is simply dissolved at the target concentration.
- Data Analysis:
- Accuracy: Calculated as the percentage recovery of the known, added amount of API. Results should typically be within 98-102% [8].
- Precision (Repeatability): Expressed as the relative standard deviation (%RSD) of multiple (e.g., six) injections of a single homogeneous sample. The %RSD should be low (e.g., <1-2%) and the total measurement error, incorporating both accuracy and precision, should be evaluated against the product specification to ensure it is fit for purpose [24] [8].
Essential Research Reagent Solutions
The following table details key materials and instruments required to develop and validate methods based on a predefined ATP.
Table 2: Essential Research Reagents and Tools for ATP-Driven Analytical Development
| Item | Function/Purpose |
|---|---|
| Chemical Reference Standards | Highly purified substances used to confirm the identity, potency, and purity of the API and known impurities. Essential for specificity, accuracy, and linearity experiments. |
| Forced Degradation Reagents | Acids (e.g., HCl), bases (e.g., NaOH), oxidizers (e.g., H₂O₂) used in stress studies to challenge method specificity and robustness [3]. |
| HPLC/UPLC System with DAD | The core instrumentation for chromatographic separation and detection. A Diode Array Detector (DAD) is critical for assessing peak purity during forced degradation [3]. |
| Chromatography Data System (CDS) | Software for instrument control, data acquisition, and analysis. Modern systems may integrate AI for autonomous method optimization [26]. |
| Validated Method Protocol | A detailed, step-by-step documented procedure that has been verified to meet all ATP criteria, ensuring consistency and compliance during transfer and routine use [27] [8]. |
Defining fitness-for-purpose through a well-constructed ATP is not merely a regulatory checkbox but a strategic imperative for efficient and compliant analytical practices. As shown, the application of the ATP is highly specific: assay methods demand high accuracy and precision for the main component, while impurity methods prioritize extreme specificity, sensitivity, and separation power. Adopting this ATP-focused, lifecycle approach, as championed by ICH Q14 and Q2(R2), ensures analytical methods remain scientifically sound and suitable for their intended purpose, ultimately safeguarding product quality and patient safety from development through commercial production.
In pharmaceutical development, analytical method validation is a critical, documented process that proves a testing procedure is reliable and suitable for its intended purpose [28]. It confirms that an analytical method consistently produces accurate, precise, and reproducible results, thereby underpinning the credibility of scientific data and ensuring drug product quality, safety, and efficacy [4] [29]. Guidelines from the International Council for Harmonisation (ICH), particularly ICH Q2(R1) and its updated revision ICH Q2(R2), provide the globally recognized framework for validating these procedures [30] [31]. The core parameters—Specificity, Accuracy, Precision, Linearity, and Range—form the foundation for assessing any analytical method's performance [4] [32]. Understanding these parameters is essential for researchers, scientists, and drug development professionals, especially when comparing validation requirements for different method types, such as assay methods versus impurity methods, as the context of use dictates the stringency and approach to validation [33].
Core Validation Parameters and Regulatory Definitions
The validation of analytical procedures for pharmaceutical substances and products is guided by harmonized principles outlined in ICH guidelines. The following core parameters are essential for demonstrating that a method is fit-for-purpose.
Specificity
Specificity is the ability of a method to assess unequivocally the analyte of interest in the presence of other components that may be expected to be present in the sample matrix [31] [29]. This includes impurities, degradation products, excipients, or other matrix components. A specific method yields results for the target analyte, and the target analyte only, free from any interference [32]. For assay methods, this typically means demonstrating that the excipients in a drug product do not interfere with the measurement of the Active Pharmaceutical Ingredient (API). For impurity methods, specificity is even more critical; it must be demonstrated that the method can resolve and accurately quantify each impurity individually, as well as from the main API peak [4].
Accuracy
The accuracy of an analytical procedure expresses the closeness of agreement between the value found and a value accepted as either a conventional true value or an accepted reference value [4] [32]. It is a measure of the trueness of the method, often demonstrated through recovery experiments where a known amount of the analyte is added to the sample matrix, and the measured value is compared to the theoretical value [29]. Accuracy is usually reported as a percentage recovery.
Precision
Precision expresses the closeness of agreement (degree of scatter) between a series of measurements obtained from multiple sampling of the same homogeneous sample under the prescribed conditions [4]. It is generally considered at three levels:
- Repeatability: Precision under the same operating conditions over a short interval of time (e.g., same analyst, same equipment).
- Intermediate Precision: Variations within the same laboratory, such as different days, different analysts, or different equipment.
- Reproducibility: Precision between different laboratories, which is often assessed during collaborative studies [4] [29]. Precision is typically expressed as standard deviation, relative standard deviation (RSD), or confidence interval [4].
Linearity
Linearity of an analytical procedure is its ability (within a given range) to obtain test results that are directly proportional to the concentration (amount) of analyte in the sample [4] [32]. It is demonstrated by preparing and analyzing a series of samples with analyte concentrations across the expected range. The data is usually evaluated by plotting the signal response against the concentration and calculating a regression line, often by the least-squares method [4]. The correlation coefficient (R²) is a common metric, with a value of ≥ 0.999 often expected for assay methods [29].
Range
The range of an analytical procedure is the interval between the upper and lower concentrations (amounts) of analyte in the sample for which it has been demonstrated that the procedure has a suitable level of precision, accuracy, and linearity [4] [32]. The specific range is derived from linearity studies and depends entirely on the intended application of the method. For instance, the range for an assay of a drug substance or product is typically 80% to 120% of the test concentration, whereas for content uniformity, it is 70% to 130% [4].
Comparative Analysis: Assay vs. Impurity Methods
The application and acceptance criteria for validation parameters differ significantly between assay methods (intended to measure the main active component) and impurity methods (intended to identify and quantify minor components). The table below provides a detailed, parameter-by-parameter comparison of validation requirements.
Table 1: Comparison of Validation Parameters for Assay vs. Impurity Methods
| Validation Parameter | Typical Requirement for Assay Methods | Typical Requirement for Impurity Methods |
|---|---|---|
| Specificity | Must demonstrate no interference from excipients, degradation products, or matrix [29]. The API peak should be pure and baseline-resolved. | Must demonstrate resolution between all potential impurities and from the API. Must be able to detect and identify individual impurities unequivocally [4]. |
| Accuracy (Recovery %) | Typically assessed by comparing measured value to a known reference standard or by spiking the API into the placebo. Recovery often expected to be 98–102% [29]. | Assessed by spiking known amounts of impurities into the drug substance or product. Recovery expectations are wider, e.g., 80–120% depending on the impurity level, due to the challenges of measuring low concentrations [4]. |
| Precision (Repeatability) | Expressed as %RSD. Very stringent criteria, often ≤ 1.0–2.0% for the API [31]. | Criteria are less stringent than for assay due to lower concentration levels. %RSD for impurities might be acceptable at 5-10% or higher near the quantitation limit [4]. |
| Linearity | High correlation coefficient required, typically R² ≥ 0.999 over the specified range (e.g., 80-120%) [29]. | Demonstrated from the reporting threshold (Quantitation Limit) to 120% of the impurity specification. A slightly lower R² may be acceptable (e.g., ≥ 0.99) [4]. |
| Range | Derived from linearity. For drug substance/product assay: 80% to 120% of the test concentration [4]. | From the reporting level (Quantitation Limit) to 120% of the impurity specification. For toxic impurities, the QL must be commensurate with the control level [4]. |
| Quantitation Limit (QL) | Not a primary parameter for assay methods, as the analyte is a major component. | A critical parameter. Defined as the lowest amount that can be quantified with acceptable accuracy and precision. Often determined via signal-to-noise (10:1) or based on standard deviation and slope of the calibration curve [4]. |
| Detection Limit (DL) | Not a primary parameter for assay methods. | A critical parameter. Defined as the lowest amount that can be detected. Often determined via signal-to-noise (3:1) [4]. |
This comparison highlights a fundamental principle in analytical validation: the "fit-for-purpose" approach [33]. The validation strategy and acceptance criteria are dictated by the method's context of use. Assay methods, which measure the primary active component responsible for therapeutic effect, require high stringency for accuracy and precision. In contrast, impurity methods, which deal with trace-level components, prioritize sensitivity (QL/DL) and specificity to ensure all potential impurities are detected and resolved.
Table 2: Summary of Key Experimental Protocols for Validation
| Parameter | Recommended Experimental Protocol |
|---|---|
| Specificity | Inject blank (matrix without analyte), placebo (with excipients), standard, and stressed samples (e.g., forced degradation by heat, light, acid, base). Demonstrate peak purity and resolution in all cases [29]. |
| Accuracy | Prepare a minimum of 3 concentration levels covering the range (e.g., 80%, 100%, 120%) with 3 replicates each (n=9 total). For assay, spike API into placebo. For impurities, spike impurities into drug substance/product. Report mean recovery (%) and confidence intervals [4]. |
| Precision (Repeatability) | Analyze a minimum of 6 determinations at 100% of the test concentration or a minimum of 9 determinations covering the specified range (e.g., 3 concentrations/3 replicates). Report %RSD [4]. |
| Linearity | Prepare and analyze a minimum of 5 concentration levels appropriately distributed across the range. Evaluate using a least-squares linear regression analysis. Report the correlation coefficient (R²), slope, and y-intercept [4] [29]. |
| QL/DL Estimation | Signal-to-Noise: Compare measured signals from samples with known low concentrations of analyte with those of blank samples. Establish QL at S/N ≥ 10:1 and DL at S/N ≥ 3:1 [4].Standard Deviation/Slope: QL = (10σ)/S; DL = (3.3σ)/S, where σ is the standard deviation of the response and S is the slope of the calibration curve [4]. |
Experimental Protocols and Data Interpretation
Workflow for a Validation Study
The following diagram illustrates the logical workflow and key decision points in a typical analytical method validation study.
Relationships Between Core Validation Parameters
This diagram visualizes how the core validation parameters interconnect to define a method's overall performance and suitability.
The Scientist's Toolkit: Essential Research Reagent Solutions
The successful execution of a validation study relies on high-quality, well-characterized materials. The following table details key reagents and their critical functions.
Table 3: Essential Research Reagents for Method Validation
| Reagent / Material | Critical Function in Validation |
|---|---|
| Certified Reference Standard | Serves as the benchmark for establishing accuracy and calibrating the analytical procedure. Its known purity and characterization are fundamental for all quantitative measurements [4]. |
| Well-Characterized Impurities | Essential for validating impurity methods. Used to demonstrate specificity (resolution), establish QL/DL, and determine accuracy and linearity for impurity quantitation [4]. |
| Placebo Formulation (without API) | Used in specificity testing to confirm the absence of interference from excipients. Also used in accuracy (recovery) studies for drug products by spiking with the API [4]. |
| High-Purity Solvents & Mobile Phase Components | Critical for achieving a stable baseline, desired chromatographic separation, and preventing false positives or negatives. Their quality directly impacts sensitivity, precision, and robustness [29]. |
| System Suitability Test (SST) Mixtures | A preparation containing the analyte and critical impurities used to verify that the analytical system is performing adequately at the start of, during, and at the end of a validation sequence [30] [31]. |
The rigorous validation of assay methods using the core parameters of specificity, accuracy, precision, linearity, and range is a non-negotiable pillar of pharmaceutical development and quality control. As demonstrated, the application and acceptance criteria for these parameters are highly dependent on the method's purpose, with clear and scientifically justified differences existing between assay and impurity methods. A deep understanding of these differences, guided by ICH and other regulatory frameworks and supported by robust experimental data, is essential for generating reliable and defensible results. This ensures not only regulatory compliance but also the ultimate goal of delivering safe and effective medicines to patients. The evolving regulatory landscape, including the recent ICH Q2(R2) and Q14 guidelines, continues to emphasize a science- and risk-based lifecycle approach to analytical procedures, making this knowledge ever more critical for drug development professionals [15] [31].
The validation of analytical methods is a cornerstone of drug development, ensuring that the procedures used to measure the identity, quality, and purity of pharmaceutical substances are reliable and fit for their intended purpose. Within this framework, the analysis of impurities presents unique challenges that demand a more expanded and rigorous validation approach compared to standard assay methods. Impurity methods must detect and quantify trace-level compounds that can significantly impact drug safety and efficacy, even at very low concentrations. The International Conference on Harmonisation (ICH) guidelines Q2(R1) outlines the key validation parameters required for analytical procedures, but their application and acceptance criteria differ substantially between assay and impurity methods [34]. For impurity methods, parameters such as the Limit of Detection (LOD), Limit of Quantitation (LOQ), and Specificity take on heightened importance as they define the method's ability to reliably identify and measure low-level components that could represent potential patient risks.
The fundamental distinction between assay and impurity validation lies in their analytical targets. While assay methods focus on accurately quantifying the major active component, often at or near 100% concentration, impurity methods must be optimized to detect and quantify minor components that may be present at levels as low as 0.05-0.1% [35]. This concentration difference necessitates superior method sensitivity and demands rigorous demonstration that the method can distinguish the analyte of interest from closely related structures and matrix components. Furthermore, impurity methods must address both known, identified impurities with available reference standards and unknown impurities that may appear during stability studies or manufacturing process changes, each requiring distinct validation strategies [34] [35]. This guide provides a comprehensive comparison of validation approaches for impurity methods, with particular focus on LOD, LOQ, and specificity requirements for both known and unknown impurities.
Theoretical Framework: LOD, LOQ, and Specificity in Regulatory Context
Defining Key Validation Parameters
Understanding the precise definitions and statistical foundations of LOD, LOQ, and specificity is essential for proper method validation. The Limit of Blank (LOB) represents the highest apparent analyte concentration expected to be found when replicates of a blank sample containing no analyte are tested. It is defined statistically as LOB = Meanblank + 1.645(SDblank) (assuming a one-sided 95% confidence interval) and helps clarify the analytical error when the analyte is not present in the solution [36] [37]. The Limit of Detection (LOD) is the lowest analyte concentration that can be reliably distinguished from the LOB, but not necessarily quantified as an exact value. The ICH Q2(R1) guideline defines LOD as "the lowest amount of analyte in a sample which can be detected but not necessarily quantitated as an exact value" [36]. For impurity methods, this represents the threshold at which an impurity can be first observed above the method background noise.
The Limit of Quantitation (LOQ) is the lowest concentration at which the analyte can not only be reliably detected but also quantified with acceptable precision and accuracy under stated experimental conditions [37] [38]. The LOQ is particularly critical for impurity methods as it defines the reporting threshold—the level at which impurities must be identified and reported. According to ICH guidelines, the specified range for impurity determination extends "from the reporting level of an impurity to 120% of the specification" [35]. It's important to note that the LOQ may be equivalent to the LOD or at a much higher concentration, depending on the predefined goals for bias and imprecision [37].
Specificity is the ability of the method to measure the analyte accurately and specifically in the presence of other components that may be expected to be present in the sample matrix, such as impurities, degradation products, or excipients [34]. For impurity methods, specificity must be demonstrated through the resolution of the analyte from closely related compounds and the absence of interference from the sample matrix. The terms selectivity and specificity are often used interchangeably, though IUPAC considers "specificity" as the ultimate of selectivity, representing the ideal situation where a method produces a response for a single analyte only [34].
Regulatory Requirements for Impurity Methods
Regulatory guidelines establish clear expectations for impurity method validation, though different authorities may emphasize slightly different parameters. The ICH Q2(R1) guideline represents the harmonized standard for the United States, European Union, and Japan, requiring accuracy, precision, specificity, detection limit, quantitation limit, linearity, and range for impurity methods [34]. The FDA guidance adds requirements for reproducibility, sample solution stability, and system suitability testing, while European guidelines focus on the core parameters without additional elements [34].
For impurity quantification, the ICH Q2B document specifies that the validation range should extend "from the reporting level of an impurity to 120% of the specification" [35]. This is particularly important for impurities known to be unusually potent or to produce toxic or unexpected pharmacological effects, where the detection/quantitation limit should be commensurate with the level at which the impurities must be controlled. When assay and purity are performed together as one test using only a 100% standard, the linearity should cover the range from the reporting level of the impurities to 120% of the assay specification [35].
Comparative Analysis of LOD and LOQ Determination Methods
Multiple approaches exist for determining LOD and LOQ, each with distinct advantages, limitations, and applicability to different analytical techniques. The ICH Q2(R1) guideline suggests several methods including visual evaluation, signal-to-noise ratio, standard deviation of the blank, and standard deviation of the response and the slope [36] [38]. The appropriate choice depends on whether the method is instrumental or non-instrumental and the nature of the analytical technique being validated.
Table 1: Comparison of LOD and LOQ Determination Methods
| Method | Basis | Typical Applications | LOD Calculation | LOQ Calculation | Advantages | Limitations |
|---|---|---|---|---|---|---|
| Visual Evaluation | Direct observation by analyst | Non-instrumental methods (e.g., TLC, titration) | Minimum concentration detectable by analyst | Minimum concentration quantifiable by analyst | Simple, practical | Subjective, dependent on analyst skill |
| Signal-to-Noise Ratio | Instrument response comparison | Chromatographic methods (HPLC, GC) | S/N = 2:1 or 3:1 | S/N = 10:1 | Instrument-specific, widely accepted | Requires baseline noise, equipment-dependent |
| Standard Deviation of Blank | Statistical analysis of blank samples | Methods with negligible background noise | Meanblank + 3.3(SDblank) | Meanblank + 10(SDblank) | Direct measurement of background | Does not evaluate analyte response |
| Standard Deviation of Response and Slope | Calibration curve statistics | Instrumental methods with linear response | 3.3σ/S | 10σ/S | Uses actual analyte response, statistical basis | Assumes linearity, requires multiple curves |
For impurity methods in pharmaceutical analysis, the signal-to-noise ratio and standard deviation of response/slope approaches are most commonly applied, particularly for chromatographic methods such as HPLC [38] [39]. The visual evaluation method may be suitable for non-instrumental procedures or as a confirmatory approach.
Experimental Protocols for LOD and LOQ Determination
Signal-to-Noise Ratio Protocol: For HPLC-based impurity methods, the signal-to-noise ratio approach is widely implemented. The experimental procedure involves:
- Prepare a blank sample (without analyte) and a low-concentration sample near the expected LOQ using the same biological matrix or placebo formulation.
- Inject the blank sample and measure the baseline noise (N) over a region where the analyte peak is expected. The noise can be measured as peak-to-peak or as root mean square (RMS) noise.
- Inject the low-concentration sample and measure the height of the analyte peak (S).
- Calculate the signal-to-noise ratio: S/N.
- For LOD, the concentration that yields S/N = 2:1 or 3:1 is accepted. For LOQ, S/N = 10:1 is generally required [38] [40].
- Confirm the determined LOD/LOQ by analyzing multiple replicates (typically n=5-6) at the proposed limit concentrations to verify that they meet the precision and accuracy criteria.
Standard Deviation of Response and Slope Protocol: This statistical approach requires more extensive experimentation but provides a more rigorous determination:
- Prepare a calibration curve using samples with analyte concentrations in the range of the expected LOD/LOQ. A minimum of five concentrations is recommended, with six or more determinations at each concentration [36].
- Analyze all samples and record the responses.
- Calculate the calibration curve using linear regression, obtaining the slope (S) and the standard deviation of the response (σ).
- The standard deviation (σ) can be estimated as:
- The residual standard deviation of the regression line (sy/x), or
- The standard deviation of the y-intercepts of regression lines from multiple calibration curves [38].
- Calculate LOD = 3.3 × σ / S
- Calculate LOQ = 10 × σ / S [36] [38].
- Verify the calculated LOD and LOQ by analyzing multiple replicates at these concentrations to ensure they meet the required performance criteria.
Accuracy Profile Approach: Recent research has introduced the accuracy profile as a comprehensive graphical tool for determining LOQ. This approach:
- Involves the analysis of validation standards at different concentration levels across the expected range.
- Computes β-content tolerance intervals for each concentration level.
- Plots the tolerance intervals against the acceptance limits.
- Defines the LOQ as the lowest concentration where the uncertainty limits (tolerance intervals) are fully included within the acceptability limits [41]. Studies comparing these approaches have found that graphical strategies like the uncertainty profile and accuracy profile provide more realistic assessments of LOD and LOQ compared to classical statistical methods, which may yield underestimated values [41].
Comparative Performance Data
Research comparing different LOD/LOQ calculation methods demonstrates significant variability in results depending on the approach used. A study comparing approaches for an HPLC-UV method for analyzing carbamazepine and phenytoin found that the signal-to-noise ratio method provided the lowest LOD and LOQ values for both drugs, while the standard deviation of the response and slope method resulted in the highest values [39]. This highlights the methodological variability and its impact on reported sensitivity parameters.
Table 2: Experimental Comparison of LOD and LOQ Values by Different Methods for Carbamazepine and Phenytoin Analysis
| Analyte | Determination Method | LOD Value | LOQ Value | Notes |
|---|---|---|---|---|
| Carbamazepine | Signal-to-Noise Ratio | Lowest value | Lowest value | Most conservative sensitivity estimate |
| Carbamazepine | Standard Deviation of Response/Slope | Highest value | Highest value | Least conservative sensitivity estimate |
| Phenytoin | Signal-to-Noise Ratio | Lowest value | Lowest value | Most conservative sensitivity estimate |
| Phenytoin | Standard Deviation of Response/Slope | Highest value | Highest value | Least conservative sensitivity estimate |
These findings emphasize the importance of specifying the calculation method when reporting LOD and LOQ values, as the numerical results can vary significantly [39]. For regulatory submissions, consistency with established guidelines and previous submissions is crucial.
Specificity and Specificity for Known vs. Unknown Impurities
Demonstration of Specificity
Specificity is the ability to assess unequivocally the analyte in the presence of components that may be expected to be present, such as impurities, degradation products, and matrix components [34]. For impurity methods, specificity must be rigorously demonstrated through several experimental approaches:
For Known Impurities (when reference standards are available):
- Spike the drug substance or drug product with appropriate levels of impurities (typically at the specification level) and demonstrate separation from each other and from the main analyte.
- Demonstrate peak homogeneity using techniques such as diode array detection (peak purity) or mass spectrometry to confirm that the analyte chromatographic peak is not attributable to more than one component [34].
- For chromatographic methods, critical separations should be investigated, with specificity demonstrated by the resolution of the two components that elute closest to each other. A resolution (Rs) greater than 1.5 is generally required for precise and rugged quantitative analysis [34].
For Unknown Impurities (when reference standards are unavailable):
- Stress the drug substance or drug product under relevant conditions (light, heat, humidity, acid/base hydrolysis, and oxidation) to generate degradation products.
- Compare the test results to a well-characterized procedure (e.g., pharmacopoeial method or other validated analytical procedure) to demonstrate that the method can detect and separate degradation products [34].
- Demonstrate that the method can distinguish the analyte from matrix components by analyzing placebo formulations or biological matrices without the analyte.
For impurity methods, specificity is typically demonstrated by showing that the procedure is unaffected by the presence of other components at the levels expected in the sample. This includes demonstrating no interference from excipients in drug products or from process impurities in drug substances [34].
Strategic Approaches for Unknown Impurities
The validation of methods for unknown impurities presents particular challenges due to the absence of reference standards. Practical approaches include:
Relative Response Factor (RRF) Determination: For known impurities, determine a Relative Response Factor at the specification level: RRF = (Impurity Response/Main Analyte Response) × (Impurity Concentration/Main Analyte Concentration). This decimal number can be used in method calculations to convert observed impurity response to concentration without an external impurity standard, using the main analyte standard response and concentration [35].
Area Percent Specification Approach: When impurity reference standards are unavailable, use RRF determination during validation to establish what concentration of impurity produces the upper specification Area%. This can then be correlated to different validation requirements such as accuracy and linearity [35]. For accuracy determination for an impurity, it is generally evaluated at three different levels spanning 50% - 120% of the specification. Since the concentration that produces 100% of specification is known, accuracy solutions can be formulated accordingly.
For methods that must quantify both known and unknown impurities against the main analyte peak, some laboratories perform linearity of the main compound at the concentration level of the unknowns to prove that the main compound can be used as an external standard at that level [35]. This approach validates that the main analyte response is linear at the low concentrations corresponding to impurity levels.
Experimental Design and Workflow Strategies
The validation of impurity methods requires careful experimental design to efficiently address all necessary parameters while minimizing resource utilization. The following workflow represents a systematic approach to impurity method validation:
Figure 1: Impurity Method Validation Workflow
Key Experimental Considerations
For Specificity Demonstration:
- For known impurities, spike the drug substance or product with appropriate levels of impurities and demonstrate separation from the main analyte and from each other.
- For unknown impurities, employ forced degradation studies under relevant stress conditions (acid, base, oxidation, thermal, photolytic) to generate potential degradation products.
- Use peak purity tests (e.g., photodiode array detection, mass spectrometry) to demonstrate chromatographic homogeneity of the analyte peak.
- For chromatographic methods, document resolution between the analyte and the closest eluting impurity, with Rs > 1.5 typically required [34].
For LOD/LOQ Determination:
- Select the appropriate determination method based on the analytical technique (e.g., S/N for chromatographic methods, visual evaluation for non-instrumental methods).
- Prepare samples at concentrations near the expected limits using the same matrix as actual samples.
- Analyze sufficient replicates (typically n ≥ 6) to obtain statistically meaningful results.
- Verify determined limits by analyzing samples at the LOD/LOQ concentrations to confirm they meet the required precision and accuracy criteria.
- For LOQ, ensure that both precision (typically %RSD ≤ 20%) and accuracy (typically within 20% of nominal concentration) meet acceptance criteria [40].
Range Establishment:
- For impurity methods, the range should extend from the reporting threshold (typically the LOQ) to at least 120% of the specification level [35].
- When assay and impurity tests are performed together using the same method, the range should cover from the LOQ for impurities to 120% of the assay specification.
Essential Research Reagents and Materials
The successful validation of impurity methods requires specific high-quality materials and reagents to ensure accurate and reproducible results. The following table outlines key solutions and materials essential for impurity method validation:
Table 3: Essential Research Reagent Solutions for Impurity Method Validation
| Reagent/Material | Specification Requirements | Application in Validation | Critical Quality Attributes |
|---|---|---|---|
| Drug Substance Reference Standard | Certified, high purity (>99%) | Primary standard for assay and impurity quantification | Purity, identity, stability, well-characterized impurities |
| Known Impurity Reference Standards | Certified, quantified | Specificity, LOD/LOQ, linearity, accuracy for known impurities | Purity, identity, stability |
| Placebo Formulation | Representative of final product composition, without API | Specificity demonstration, matrix interference assessment | Composition matching, homogeneity, stability |
| Forced Degradation Samples | Stressed under controlled conditions (acid, base, oxidation, thermal, light) | Specificity for unknown impurities, stability-indicating capability | Appropriate degradation level (typically 5-20%) |
| Mobile Phase Components | HPLC or LC-MS grade | Chromatographic separation | Purity, low UV absorbance, LC-MS compatibility |
| Sample Preparation Solvents | Appropriate grade for methodology | Extraction and dissolution of samples | Purity, compatibility with analyte and matrix |
The quality and characterization of these materials directly impact the reliability of validation results. Particularly for impurity methods, the use of well-characterized impurity standards is essential for accurate method validation [35]. When impurity standards are unavailable, comprehensive forced degradation studies become increasingly important to demonstrate method specificity for unknown impurities.
The expanded validation of impurity methods demands a more rigorous approach compared to standard assay methods, with particular emphasis on LOD, LOQ, and specificity parameters. The comparative analysis presented in this guide demonstrates that methodological choices in LOD/LOQ determination significantly impact the reported sensitivity values, underscoring the need for consistent application of validated approaches. Furthermore, the distinction between validation strategies for known versus unknown impurities highlights the need for flexible yet comprehensive experimental designs that address real-world analytical challenges.
For researchers and drug development professionals, the implementation of systematic validation workflows incorporating both classical and innovative approaches like accuracy profiles provides the most robust framework for demonstrating method suitability. As regulatory expectations continue to evolve, particularly for potentially genotoxic impurities and highly potent compounds, the principles outlined in this guide offer a foundation for developing impurity methods that are not only compliant but also scientifically sound and fit for their intended purpose in ensuring drug safety and quality.
In pharmaceutical development, stability-indicating high-performance liquid chromatography (HPLC) methods are essential analytical tools that provide critical data on drug substance and product stability. These methods must accurately quantify the active pharmaceutical ingredient (API) while simultaneously separating, identifying, and quantifying impurities and degradation products that may form under various storage conditions [42]. The International Council for Harmonisation (ICH) guidelines mandate that analytical procedures used in regulated stability testing must demonstrate specificity, accuracy, and reproducibility [42].
This case study examines the distinct validation requirements for assay methods, which measure the main active component, versus impurity methods, which quantify related substances at significantly lower concentrations. While a single reversed-phase HPLC method often serves both purposes simultaneously [42], the validation approaches differ substantially in their acceptance criteria, concentration ranges, and performance characteristics. Understanding these differences is crucial for researchers and drug development professionals implementing regulatory-compliant methods that ensure product safety, efficacy, and quality throughout the product lifecycle.
Method Validation Parameters: Assay vs. Impurity Methods
Comparative Validation Requirements
Table 1: Key Validation Parameters for Assay versus Impurity Methods
| Validation Parameter | Assay Method Requirements | Impurity Method Requirements |
|---|---|---|
| Concentration Range | Typically 80-120% of target concentration [42] | From reporting threshold to at least 120% of specification limit [42] |
| Accuracy (Recovery) | 98-102% typical for API [42] | Sliding scale allowing higher ranges for low-level impurities [42] |
| Precision (Repeatability) | RSD < 2.0% for peak area [42] | Varies with impurity level; stricter for specified impurities |
| Specificity | Separation of API from impurities and excipients [42] | Baseline resolution of all potential impurities from each other and API [42] |
| Detection/Quantification Limits | Not typically required | LOD/LOQ must be established with S/N of 3:1 and 10:1 respectively [43] |
| System Suitability | System precision, tailing factor, plate count [42] | Includes system sensitivity (S/N) for impurities [43] |
The fundamental distinction between assay and impurity method validation lies in their concentration ranges and corresponding accuracy expectations. Assay methods focus on the API at high concentration (typically 0.1-1.0 mg/mL), while impurity methods must detect and quantify related substances at significantly lower levels (often 0.05-1.0% of API concentration) [44]. This concentration difference drives variations in validation approaches, particularly regarding sensitivity requirements and acceptance criteria.
For impurity methods, system sensitivity becomes a critical system suitability parameter measured through signal-to-noise (S/N) ratio. The updated USP <621> chapter, effective May 2025, explicitly states that system sensitivity must be demonstrated when measuring impurities, with the limit of quantification (LOQ) based on a S/N of 10:1 [43]. This requirement ensures the chromatography system can reliably detect and quantify impurities at or near their reporting thresholds during routine analysis.
Case Study: Dual Concentration Validation Approach
In practice, many laboratories implement a dual-concentration approach to address the significant concentration differences between API and impurities. As demonstrated in one case study, a method for chromatographic purity determination utilized different sample concentrations: approximately 1 mg/mL for impurity detection and 0.1 mg/mL for API assay [44]. This approach acknowledges the practical limitations of analyzing both high-concentration APIs and low-concentration impurities simultaneously at a single concentration level.
Another research group faced similar challenges when developing a method for a DNA topoisomerase inhibitor, LMP776. They validated their method for specificity, linearity across 0.25-0.75 mg/mL range, accuracy (recovery 98.6-100.4%), precision (RSD ≤ 1.4%), and sensitivity (LOD 0.13 μg/mL) [45]. The sensitivity parameter was particularly critical for this impurity method, as it needed to detect potentially genotoxic impurities at low levels.
Experimental Protocol: Method Development and Validation
Method Development Workflow
The development of a stability-indicating method begins with careful selection of chromatographic conditions. Researchers typically employ reversed-phase HPLC with C18 or specialized columns, optimizing mobile phase composition, pH, and gradient profiles to achieve baseline separation of all components [46] [45]. For instance, in the development of a method for trans-resveratrol, researchers evaluated multiple columns including Agilent Zorbax SB-C18, Waters Symmetry C18, and Phenomenex Luna C18 before selecting the Waters Symmetry C18 column (4.6 × 75 mm, 3.5 μm) with a mobile phase of 10 mM ammonium formate (pH=4)/acetonitrile (70:30 v/v) [47].
Forced degradation studies represent a critical component of method development, physically challenging the method to demonstrate its stability-indicating capabilities. These studies subject the drug substance to various stress conditions including acidic, alkaline, oxidative, thermal, and photolytic degradation [48]. The goal is to achieve 5-20% degradation, which generates sufficient degradation products to verify method specificity without creating excessive degradation that would be unrealistic [48]. For cenobamate, forced degradation revealed particular susceptibility to basic conditions, leading to a comprehensive kinetic study of its alkaline degradation behavior [48].
Detailed Validation Methodology
Table 2: Experimental Protocols for Key Validation Parameters
| Parameter | Experimental Protocol | Acceptance Criteria |
|---|---|---|
| Specificity | Forced degradation studies; peak purity assessment using PDA or MS detection; resolution from closest eluting impurity [42] | Baseline separation (resolution >1.5); peak purity index >0.999; no interference from blank [42] |
| Linearity | Minimum of 5 concentrations covering specified range; triplicate injections [47] [45] | Correlation coefficient (r) >0.999 for API; >0.99 for impurities [47] [45] |
| Accuracy | 9 determinations over 3 concentration levels; spike recovery in placebo or matrix [42] | 98-102% for API; sliding scale for impurities based on level [42] |
| Precision | 6 replicate preparations of homogeneous sample; multiple injections [42] | RSD <2.0% for API; varies for impurities based on concentration [42] |
| Robustness | Deliberate variations in pH, temperature, flow rate, mobile phase composition [47] | System suitability criteria met despite variations; consistent retention times and resolution [47] |
Accuracy studies for impurity methods present unique challenges, particularly for new chemical entities where impurity reference standards may be unavailable. In early-phase development, impurities may be monitored using area percent and identified using relative retention times (RRT) [42]. As projects advance to later phases, impurities should be quantified as weight/weight percent of the active, with accuracy demonstrated using authentic substances when available [42]. For unspecified impurities, surrogate reference materials with closely related structures or absorbance characteristics may be used for quantitation.
The validation of methods for low-level impurities requires special consideration of detection and quantification capabilities. For the LMP776 method, researchers established a limit of detection (LOD) of 0.13 μg/mL, demonstrating adequate sensitivity for potential impurities [45]. Similarly, the trans-resveratrol method validation established a LOD of 0.058 μg/mL and LOQ of 0.176 μg/mL, ensuring capability to detect and quantify low-level degradation products [47].
The Scientist's Toolkit: Essential Research Reagents and Materials
Table 3: Essential Research Reagents and Materials for HPLC Method Development
| Item Category | Specific Examples | Function/Purpose |
|---|---|---|
| HPLC System Components | Quaternary pump, autosampler, PDA detector, column oven [47] [45] | Precise mobile phase delivery, sample introduction, detection, and temperature control |
| Chromatographic Columns | C18 (Waters Symmetry, Phenomenex Luna), F5 (Supelco Discovery HS), HILIC, ion exchange [47] [45] | Stationary phases with different selectivity for method development |
| Mobile Phase Components | Acetonitrile, methanol, ammonium formate, trifluoroacetic acid, formic acid [47] [45] | Solvent strength and selectivity adjustment; pH control; ion pairing |
| Reference Standards | API reference standard, impurity standards, degradation markers [42] [43] | System suitability testing; identification and quantification of analytes |
| Sample Preparation | Solvents (ACN, MeOH, water), filtration units (0.45 μm), volumetric glassware [45] [48] | Sample dissolution, extraction, and clarification before injection |
| Forced Degradation Reagents | HCl, NaOH, H₂O₂, buffers [45] [48] | Generation of degradation products for specificity demonstration |
Advanced detection techniques play an increasingly important role in modern impurity method development. Photo-diode array (PDA) detectors enable peak purity assessment by collecting spectral data throughout the peak [42]. Mass spectrometry (MS) provides definitive structural information for impurity identification and characterization [45]. As noted in validation guidelines, "the best secondary 'orthogonal' technique generally does not use a totally different separation mechanism, but rather uses another RPLC method with different selectivity" [42].
The selection of appropriate columns and mobile phases represents one of the primary challenges in HPLC method development for impurity identification [46]. Different impurities may exhibit varying chemical properties and polarities, requiring different separation mechanisms. Method developers must consider factors such as pH sensitivity, stability under stress conditions, and compatibility with detection systems when selecting chromatographic conditions.
Regulatory Framework and Compliance
System Suitability Testing Requirements
System suitability testing (SST) provides a critical quality control check before analytical runs, verifying that the complete chromatographic system performs adequately for its intended purpose. The updated USP <621> chapter, effective May 2025, introduces important changes to SST requirements, particularly for impurity methods [43]. These include new requirements for system sensitivity (signal-to-noise ratio) and revised definitions for peak symmetry [43].
For impurity methods, system sensitivity becomes a mandatory SST parameter, with measurements performed using pharmacopoeial reference standards—never samples—to ensure the chromatography system can reliably quantify impurities at or near their limits of quantification [43]. This point-of-use measurement ensures fitness for purpose on the day of analysis, accounting for variances due to instrument, column, mobile phase preparation, or other factors [43].
Lifecycle Management of Validated Methods
Method validation is not a one-time event but rather an ongoing process throughout the product lifecycle. The validation process encompasses three main steps: method design, method validation, and method maintenance (continued verification) [42]. As a product progresses through development phases, validation requirements evolve from cursory verification of "scientific soundness" in Phase 1 to full validation complying with ICH guidelines in Phase 3 [42].
After product launch, changes to validated methods must be managed through a formal change control program, with prior approval from regulatory agencies potentially required based on ICH Q10 [42]. This lifecycle approach ensures that methods remain validated and fit-for-purpose despite inevitable changes in manufacturing processes, raw materials, or analytical technologies.
This case study demonstrates that while a single stability-indicating HPLC method often serves dual purposes for assay and impurity determination, the validation approaches for these applications differ significantly in their concentration ranges, acceptance criteria, and performance characteristics. Successful method development requires careful attention to specificity through forced degradation studies, sensitivity adequate for low-level impurities, and validation protocols that address the distinct requirements of both assay and impurity quantification.
The evolving regulatory landscape, including updated USP <621> requirements effective May 2025, continues to shape validation practices, particularly regarding system suitability testing for impurity methods [43]. Pharmaceutical scientists must maintain awareness of these changes while implementing science-based, risk-based approaches throughout the method lifecycle. By understanding the distinct validation requirements for assay versus impurity methods, drug development professionals can ensure the quality, safety, and efficacy of pharmaceutical products while maintaining regulatory compliance.
The development and validation of analytical methods for Highly Potent Active Pharmaceutical Ingredients (HPAPIs) represent a critical challenge in modern pharmaceutical sciences, particularly within the context of oncology and targeted therapies. HPAPIs are characterized by their exceptional biological activity at low doses (typically below 10 mg/day) and require stringent handling due to low occupational exposure limits (OELs <10 µg/m³) [49]. The global HPAPI market is expanding rapidly, projected to grow from approximately $25 billion in 2024 to over $50 billion by 2033, driven significantly by targeted oncology treatments and antibody-drug conjugates (ADCs) [49]. This growth underscores the necessity for robust, validated analytical methods that ensure both product quality and operator safety.
Within the broader thesis on validation requirements for pharmaceutical methods, a fundamental distinction exists between assay validation and impurity method validation. Assay methods primarily quantify the main active component, while impurity methods must detect and quantify closely related substances at trace levels, often requiring greater sensitivity and specificity. For HPAPIs, this distinction becomes even more critical due to their inherent toxicity and the narrow therapeutic windows of the resulting drug products. This case study examines the development and validation of a specific UPLC method for an HPAPI, comparing its performance against standard API analytical approaches and highlighting the specialized considerations required for these potent compounds.
Case Study: UPLC Method for HPAPI Analysis
Analytical Challenge and Solution Strategy
A specific development challenge involved a complex method requiring simultaneous determination of assay, purity, and impurities in an HPAPI for a Phase I-III project [50]. The complexity arose from two specified process-generated impurities with divergent solubility profiles: while the HPAPI and one impurity were soluble in concentrated inorganic acid, the other specified impurity required a fluorinated organic acid for dissolution [50]. This incompatibility necessitated a strategic approach to diluent selection.
The analytical team addressed this through a systematic method development process:
- Stock Solution Preparation: Prepared separately in respective solvents based on solubility profiles.
- Common Diluent Establishment: Identified 0.3M HCl as a common diluent suitable for further method development after initial diluent mixtures showed peak splitting in chromatograms [50].
- Containment Protocols: Implemented special handling through powered air purifying respirators, gowning, and de-gowning strategies due to the highly potent nature of both the API and its impurities [50].
Chromatographic Parameters and Conditions
The developed method employed the following specific parameters to achieve the required separation and sensitivity:
Table 1: Chromatographic Method Parameters
| Parameter | Specification |
|---|---|
| Technique | Ultra-Performance Liquid Chromatography (UPLC) |
| Mobile Phase | 50 mM ammonium phosphate buffer with methanol gradient |
| Diluent | 0.3M HCl |
| Primary Goal | Resolution and quantification of two specified impurities with different solubility profiles |
| Handling Requirements | Powered air purifying respirators, specialized gowning procedures |
The method successfully resolved the challenge of peak splitting observed with initial diluent mixtures, enabling the required chromatography to demonstrate method sensitivity, complete peak resolution, and impurity levels well below specification limits [50].
Comparative Analysis: HPAPI vs. Conventional API Method Validation
Validating analytical methods for HPAPIs requires addressing several additional complexities compared to conventional APIs. The table below summarizes key comparative aspects based on the case study and industry standards:
Table 2: Method Validation Comparison: HPAPI vs. Conventional API
| Validation Parameter | HPAPI Requirements | Conventional API Requirements |
|---|---|---|
| Safety & Containment | Mandatory specialized handling (PAPRs, containment isolators) [50] [51] | Standard laboratory practices typically sufficient |
| Sensitivity | Often required at nanogram levels due to high potency [52] | Standard levels appropriate for therapeutic dose |
| Specificity | Must resolve multiple impurities with potentially divergent properties [50] | Standard resolution of expected impurities |
| Cleaning Validation | Extremely stringent limits requiring specialized detection methods [51] | Established based on standard therapeutic doses |
| Facility Design | Dedicated areas, negative pressure cascades, HEPA filtration [49] [51] | Standard GMP facilities typically adequate |
The comparison reveals that HPAPI method validation incorporates all standard validation parameters but with elevated stringency across multiple dimensions, particularly regarding safety considerations, sensitivity requirements, and facility controls.
Regulatory Framework and Guidelines
HPAPI method validation occurs within a complex regulatory landscape that includes:
- Current Good Manufacturing Practice (CGMP) Regulations (21 CFR Parts 210 and 211) requiring avoidance of cross-contamination through facility design and validated cleaning procedures [12].
- ICH Guidelines (Q7, Q9, Q10) addressing handling of potent compounds and emphasizing risk-based approaches to manufacturing and quality control [49].
- Occupational Safety Regulations (OSHA, COSHH) requiring limitation of worker exposure to toxic compounds, often below 10 µg/m³ for highly potent substances [49].
- International Standards (ISO 14644 for cleanrooms, ISO 13408 for aseptic processing) providing additional framework for containment and handling [51].
Experimental Protocols for HPAPI Method Validation
Method Comparison Protocol
For HPAPI methods, establishing method comparability requires careful experimental design beyond conventional approaches. The recommended protocol includes:
- Sample Selection: Minimum of 40 patient/sample specimens carefully selected to cover the entire clinically meaningful measurement range, with preference for 100 specimens to identify unexpected errors from interferences or sample matrix effects [53] [54].
- Measurement Protocol: Duplicate measurements for both current and new methods to minimize random variation effects, with randomization of sample sequence to avoid carry-over effect [53].
- Timeframe: Analysis over multiple days (minimum 5) and multiple runs to mimic real-world situations and account for day-to-day variability [53] [54].
- Sample Stability: Analysis within established stability periods (preferably within 2 hours for unstable analytes), typically on the day of sampling [53].
Statistical Analysis Approach
The case study employed appropriate statistical measures for method evaluation:
- Initial Graphical Analysis: Difference plots (Bland-Altman) and scatter plots to visually inspect data for outliers, extreme values, and general agreement patterns before statistical testing [53].
- Regression Analysis: Linear regression statistics (slope, y-intercept, standard deviation of points about the line) to estimate systematic error at medical decision concentrations and understand constant/proportional error nature [54].
- Precision Assessment: System precision evaluation through repeated measurements meeting acceptance criteria for relative standard deviation [50].
- Alternative to Correlation: Avoidance of correlation coefficient (r) as sole acceptability measure, as it indicates relationship but not necessarily agreement between methods [53].
The following workflow diagram illustrates the key decision points in the HPAPI method validation process:
HPAPI Method Validation Workflow
Validation Parameters and Acceptance Criteria
The case study method was validated according to ICH guidelines for late-phase assay and impurities methods, with the following parameters and results:
Table 3: Method Validation Parameters and Results
| Validation Parameter | Experimental Approach | Acceptance Criteria |
|---|---|---|
| Linearity | Series of concentrations across specification range | Correlation coefficient ≥0.99 |
| Accuracy & Precision | Spiking impurities at different percentages of nominal API concentration | Well within pre-defined acceptance criteria |
| LOD & LOQ | Successive dilutions to establish detection and quantification limits | Meets ICH requirements with sufficient margin |
| Specificity | Resolution of all specified impurities and peak purity | Baseline separation of all critical pairs |
| Robustness | Deliberate variations in method parameters | Method performance maintained |
| Intermediate Precision | Different analysts, instruments, days | RSD within acceptable range |
The validation work met all acceptance criteria parameters, proving the developed method was sensitive, selective, and robust for its intended purpose [50]. The percentage of individually specified and total impurities in the HPAPI was also well below the specification criteria provided by the customer [50].
The Scientist's Toolkit: Essential Research Reagent Solutions
Successful HPAPI method development and validation requires specialized materials and equipment to address both analytical and safety challenges:
Table 4: Essential Research Reagents and Equipment for HPAPI Analysis
| Item | Function | HPAPI-Specific Considerations |
|---|---|---|
| UPLC System with Containment | High-resolution separation and quantification | Closed systems for sample introduction to minimize exposure [51] |
| Powered Air Purifying Respirators (PAPR) | Operator protection during sample handling | Required for OEB levels 4-5 [50] [51] |
| Specialized Diluents (0.3M HCl) | Sample dissolution while maintaining stability | Critical for compounds with divergent solubility profiles [50] |
| Containment Isolators/Gloveboxes | Primary engineering control for potent material handling | OEB4-OEB5 containment with HEPA filtration [49] [51] |
| Mass Spectrometry Detection | Enhanced sensitivity for trace impurity detection | Essential for accurate quantification at nanogram levels [52] |
| Single-Use Disposable Equipment | Prevention of cross-contamination | Eliminates challenging cleaning validation for ultra-potent compounds [51] |
This case study demonstrates that successful validation of analytical methods for HPAPIs requires not only addressing standard validation parameters but also incorporating specialized safety protocols, enhanced containment strategies, and heightened sensitivity requirements. The comparative analysis reveals that while conventional API method validation provides the foundational framework, HPAPI validation demands additional layers of control and verification to ensure both product quality and operator safety.
The future of HPAPI analysis will likely be shaped by several emerging trends, including the increased use of biological HPAPIs such as antibody-drug conjugates (ADCs), integration of artificial intelligence for method optimization, development of more sophisticated drug delivery systems, and adaptation of regulatory frameworks to address unique HPAPI challenges [52]. Furthermore, the lack of standardization in HPAPI classification and containment across the pharmaceutical industry necessitates continuous reassessment of strategies to ensure approaches remain robust throughout the product lifecycle [52]. As the market for high-potency therapeutics continues to expand, the development and validation of reliable, sensitive, and safe analytical methods will remain crucial for bringing these targeted therapies to patients in need.
Solving Common Challenges and Optimizing Method Robustness
Specificity is the guardian of data integrity in chromatographic analysis, ensuring your method can unequivocally assess the analyte in the presence of potential interferents like impurities, degradation products, or matrix components [55]. Within the framework of validation requirements for assay versus impurity methods, the demonstration of specificity takes on distinct nuances. For assay methods, the primary focus is on demonstrating that excipients and degradants do not interfere with the accurate quantification of the main active ingredient [56]. For impurity methods, the emphasis shifts towards proving the method can detect, separate, and accurately quantify potentially very similar chemical structures, often at very low levels, from the parent drug and from each other [56]. This foundational capability prevents false positives, inaccurate quantification, and ultimately, unreliable data that could compromise product quality and patient safety [55]. Regulatory bodies like the FDA, EMA, and ICH mandate robust specificity testing as a cornerstone of method validation, requiring documented evidence that analytical procedures are suitable for their intended use, whether for release testing or stability assessment [55] [56].
Systematic Approaches for Specificity Enhancement
A Structured Workflow for Troubleshooting
When faced with inadequate specificity, a systematic, step-by-step approach is paramount. The following workflow provides a logical sequence for diagnosing and resolving issues related to co-elution and interference.
Figure 1: A logical workflow for systematically troubleshooting and resolving specificity issues in chromatographic methods.
Critical Parameters for Method Optimization
The first line of defense in resolving specificity issues involves methodically adjusting fundamental chromatographic parameters. These factors directly influence retention, selectivity, and peak shape, which are critical for achieving baseline separation.
Mobile Phase Composition: The choice of organic modifier, buffer concentration, and pH are powerful tools for manipulating selectivity [57] [55]. For ionizable compounds, even minor pH adjustments (e.g., ±0.2 units) can yield dramatic selectivity changes by altering the ionization state of the analyte and potential interferents [55]. Systematic optimization using design of experiments (DoE) can efficiently identify the optimal composition that maximizes resolution between critical peak pairs [55].
Chromatographic Conditions: Fine-tuning the flow rate and column temperature can significantly impact resolution [57]. In most cases, lowering the flow rate will decrease the retention factor at the column outlet, making all peaks narrower and improving response [57]. Similarly, lower column temperatures often allow for higher retention, which can improve peak resolution, albeit at the cost of longer analysis times [57].
Column Selectivity: Selecting the appropriate stationary phase is a primary tool for enhancing method specificity [55]. Different column chemistries (e.g., C18, phenyl, polar-embedded) provide distinct separation mechanisms and interaction opportunities with analytes [55]. Key column factors to consider include carbon load, surface area, end-capping status, and particle morphology (totally porous vs. core-shell) [55]. Columns packed with smaller particles and/or solid-core particles can further increase efficiency and resolution [57].
Advanced Techniques for Peak Purity Assessment
When optimization of chromatographic conditions is insufficient to confirm specificity, advanced detection and orthogonal techniques are required.
PDA-Facilitated Peak Purity Assessment (PPA): This is the most common approach for demonstrating spectral homogeneity across a chromatographic peak [58]. The technique works by comparing UV absorbance spectra at different points across the peak (e.g., at the peak front, apex, and tail) to the spectrum at the apex [58]. Commercial software calculates a purity angle and a purity threshold; a peak is considered spectrally pure when the purity angle is less than the threshold [58]. However, PDA has limitations, including potential for false negatives (e.g., when co-eluting impurities have nearly identical UV spectra) and false positives (e.g., due to significant baseline shifts or suboptimal data processing) [58].
Mass Spectrometry (MS) Detection: LC-MS provides a higher level of confidence for peak purity assessment [58]. PPA by MS is performed by demonstrating the presence of the same precursor ions, product ions, and/or adducts across the peak attributed to the parent compound in the total ion chromatogram (TIC) or extracted ion chromatogram (EIC) [58]. This is particularly powerful for detecting co-eluting species with different mass-to-charge ratios, even if they have identical UV spectra.
Table 1: Comparison of Peak Purity Assessment Techniques
| Technique | Principle of Operation | Key Strengths | Inherent Limitations |
|---|---|---|---|
| PDA/UV Spectral PPA | Compares UV spectral shape across a chromatographic peak [58]. | Efficient, robust, widely available and understood; no extra time or resource cost [58]. | Cannot distinguish co-eluting compounds with identical/similar UV spectra; prone to false results due to baseline shifts or noise [58]. |
| Mass Spectrometry (MS) | Detects co-elution based on differences in mass-to-charge (m/z) ratios [58]. | High specificity and confidence; can identify impurities; works for non-chromophoric compounds [58]. | Higher instrument cost and complexity; may require specialized expertise; not universally available [58]. |
| Orthogonal Chromatography | Re-analyses sample under different separation conditions (e.g., different column chemistry or mode) [58]. | Confirms purity without specialized detectors; can resolve co-eluters that one-dimensional LC cannot [58]. | Requires additional method development; increases analysis time [58]. |
| Spiking with Impurity Markers | Spikes sample with known impurities/degradants to confirm resolution from main peak [58]. | Direct and conclusive for known, available impurities. | Limited to known and available compounds; does not prove absence of unknown interferents [58]. |
Experimental Protocols for Specificity Demonstration
Forced Degradation Studies
Forced degradation studies, also known as stress testing, are a regulatory expectation for validating stability-indicating methods [58] [56]. The goal is to intentionally degrade the drug substance or product to demonstrate that the analytical method can adequately resolve the analyte from its degradation products [55].
Detailed Methodology:
- Stress Conditions: Subject the sample to a range of stress conditions to simulate potential degradation pathways. Typical stressors include:
- Acid and Base Hydrolysis: Treat with 0.1-1 N HCl or NaOH at ambient or elevated temperatures (e.g., 50-80°C) for predetermined time points (e.g., 0, 24, 48, 72 hours) [55].
- Oxidative Stress: Expose to hydrogen peroxide (e.g., 0.1%-3%) at ambient temperature [55].
- Thermal Stress: Heat solid samples or solutions at elevated temperatures (e.g., 50-80°C) [55].
- Photolytic Stress: Expose to UV light (e.g., 254-366 nm) [55].
- Degradation Level: Aim for approximately 5-20% degradation of the main active ingredient. This is sufficient to generate meaningful levels of degradants without causing complete destruction of the sample [55].
- Analysis: Analyze stressed samples alongside unstressed controls and blank solutions. The method should demonstrate clear resolution between the parent compound and all degradation products, and peak purity assessments (e.g., via PDA or MS) should confirm the homogeneity of the main peak [58].
- Mass Balance: An important aspect of a well-designed study is assessing mass balance, which is the process of adding the assay value of the parent drug and the amounts of degradation products to see if it correlates with the initial drug content [58].
Interference and Selectivity Testing
This protocol is designed to challenge the method's ability to distinguish the analyte from other components that are likely to be present in a real sample.
Detailed Methodology:
- Sample Preparation: Prepare and analyze the following samples:
- Analyte Standard: A solution of the pure analyte.
- Placebo/Matrix Blank: The formulation placebo (for drug products) or the biological matrix (for bioanalytical methods) processed without the analyte.
- Synthetic Mixture: The analyte spiked into the placebo or matrix at the target concentration.
- Impurity/Interference Spike: The analyte spiked with known impurities, degradants, or structurally similar compounds.
- Chromatographic Analysis: Inject all samples and compare the chromatograms.
- Acceptance Criteria:
- The chromatogram of the placebo/matrix blank should show no interfering peaks at the retention time of the analyte or any known impurities [55].
- The analyte peak in all spiked samples should be resolved from all other peaks. Resolution (Rs) between the analyte and the closest eluting interference should typically be ≥ 2.0 [55].
- Peak purity tests (PDA or MS) should confirm that the analyte peak is spectrally or mass pure, indicating no co-elution [58].
Table 2: Typical Acceptance Criteria for Specificity Validation
| Validation Aspect | Typical Acceptance Criteria | Critical For |
|---|---|---|
| Resolution | Resolution (Rs) ≥ 2.0 between analyte and closest eluting interferent [55]. | Demonstrating baseline separation for accurate quantification. |
| Peak Purity | Purity angle < purity threshold (PDA); or consistent mass spectrum across the peak (MS) [58]. | Confirming no co-elution, even with undetected or unknown impurities. |
| Selectivity Factor | α > 1.0 [55]. | Differentiating between similar compounds. |
| Interference from Blank | No interfering peaks at the retention time of the analyte in blank/placebo samples [55]. | Confirming the method's specificity in the sample matrix. |
Essential Research Reagent Solutions
The following reagents and materials are critical for developing and validating specific chromatographic methods.
Table 3: Key Reagents and Materials for Specificity Troubleshooting
| Item | Function & Importance | Application Notes |
|---|---|---|
| HPLC/UHPLC Column Suite | Different stationary phases (C18, phenyl, cyano, HILIC, etc.) are the primary tool for manipulating selectivity and resolving challenging peak pairs [57] [55]. | Essential for column screening during method development. Columns with smaller or solid-core particles can enhance efficiency and resolution [57]. |
| High-Purity Mobile Phase Modifiers | Buffers (e.g., phosphate, acetate) and pH adjusters control ionization, which dramatically impacts retention and selectivity for ionizable compounds [57] [55]. | Use HPLC-grade reagents to minimize baseline noise and ghost peaks. Precisely control pH (±0.05 units) for robustness. |
| Chemical Stress Reagents | Acids (HCl), bases (NaOH), and oxidants (H₂O₂) are used in forced degradation studies to generate relevant impurities and prove method stability-indicating capability [55]. | Use analytical-grade reagents. Concentrations and exposure times should be justified to achieve 5-20% degradation [55]. |
| Certified Reference Standards | Highly pure characterized samples of the analyte and its known impurities/degradants are required for spiking studies to confirm identity and resolution [58]. | Critical for validating specificity against known interferents. Serves as a basis for peak identification (e.g., via retention time matching). |
| Diode Array Detector (PDA) | Enables collection of full UV spectra during peak elution for peak purity assessment, confirming spectral homogeneity [58]. | Standard tool for specificity confirmation. Settings like wavelength range, spectrum acquisition rate, and slit width must be optimized. |
| Mass Spectrometer Detector | Provides definitive confirmation of peak identity and purity based on mass, and can identify unknown interferents [58]. | Used when UV-PPA is inconclusive or for methods requiring high confidence (e.g., impurity methods). |
Logical Decision-Making for Peak Purity Analysis
Effectively interpreting peak purity data is crucial for making correct conclusions about method specificity. The following diagram outlines a decision tree for analyzing and acting on peak purity results.
Figure 2: A decision tree for interpreting peak purity assessment results and determining the subsequent course of action.
In pharmaceutical development, the accurate quantification of potent impurities represents a significant analytical challenge, directly impacting drug safety and regulatory compliance. The establishment of a robust Limit of Detection (LOD) and Limit of Quantification (LOQ) is particularly crucial for impurities with high potency, such as genotoxic nitrosamine drug substance-related impurities (NDSRIs), where acceptable intake levels can be as low as 8-18 ng/day [59]. The validation of impurity methods demands more stringent sensitivity requirements compared to standard assay methods, as impurities must be detected at trace levels—often as low as 0.05% to 0.10% of the active pharmaceutical ingredient (API) concentration—while maintaining precision, accuracy, and reliability [8] [60].
This guide compares two primary technical approaches for achieving low LOD/LOQ values: conventional High-Performance Liquid Chromatography (HPLC) with ultraviolet (UV) detection and advanced Liquid Chromatography-Tandem Mass Spectrometry (LC-MS/MS). By examining experimental data and validation parameters from recent studies, we provide a structured framework for selecting the appropriate methodology based on specific impurity profiling requirements.
Technical Comparison: HPLC-UV versus LC-MS/MS for Impurity Analysis
The selection of an appropriate analytical technique is fundamental to addressing sensitivity challenges in impurity quantification. The table below compares the core technical characteristics of HPLC-UV and LC-MS/MS approaches:
| Parameter | HPLC-UV | LC-MS/MS |
|---|---|---|
| Typical LOD/LOQ Range | ~1 ppm (e.g., 0.5-1.5 ppm for Fosamprenavir impurities) [61] | ~0.02-0.125 ppm (e.g., 20 ng/g for NNORT, 125 ng/g for NSERT) [59] |
| Selectivity Mechanism | Retention time, UV spectrum | Mass-to-charge ratio (m/z), fragmentation pattern |
| Optimal Application Scope | Routine impurity monitoring at >0.1% levels | Genotoxic impurities, potent NDSRIs, trace-level degradation products |
| Key Sensitivity Limitations | Detector linearity, analyte chromophores | Ionization efficiency, matrix effects |
| Method Development Complexity | Moderate | High |
| Instrument Cost | Lower | Significantly higher |
Experimental Protocols and Performance Data
RP-HPLC Method for Fosamprenavir Impurities
A reversed-phase HPLC method was developed for quantifying five potential impurities in Fosamprenavir using a Zobrax C18 column (100 × 4.6 mm, 5 μm) with gradient elution. The mobile phase consisted of 0.1% V/V orthophosphoric acid in water and acetonitrile at a flow rate of 1 mL/min, with detection at 264 nm [61].
Key Experimental Parameters:
- Column Temperature: 30°C
- Injection Volume: 10 μL
- Diluent: 1:1 ratio of water and acetonitrile
- Gradient Program: Varied acetonitrile concentration from 10% to 90% over 10 minutes
Performance Characteristics for Fosamprenavir Impurities [61]:
| Analyte | Retention Time (min) | LOD (ppm) | LOQ (ppm) | Linearity (R²) | Precision (% RSD) |
|---|---|---|---|---|---|
| Amino Impurity | 2.3 | 0.15 | 0.5 | >0.999 | 0.5-1.7 |
| Propyl Impurity | 4.3 | 0.18 | 0.6 | >0.999 | 0.5-1.7 |
| Isomer Impurity | 4.7 | 0.21 | 0.7 | >0.999 | 0.5-1.7 |
| Fosamprenavir | 5.3 | 0.25 | 0.8 | >0.999 | 0.5-1.7 |
| Nitro Impurity | 8.1 | 0.16 | 0.5 | >0.999 | 0.5-1.7 |
| Amprenavir | 8.6 | 0.20 | 0.6 | >0.999 | 0.5-1.7 |
The method demonstrated excellent sensitivity for all impurities with LOD values ranging from 0.15-0.21 ppm and LOQ values between 0.5-0.8 ppm, sufficient for routine quality control of non-genotoxic impurities [61].
LC-MS/MS Method for Nitrosamine Impurities (NDSRIs)
For the highly potent NDSRIs N-nitroso-nortriptyline (NNORT) and N-nitroso-sertraline (NSERT), an LC-MS/MS method was developed using a phenyl-hexyl column (100 × 2.1 mm, 2.7 μm) with gradient elution of 0.1% formic acid in water and 0.1% formic acid in acetonitrile [59].
Mass Spectrometry Conditions:
- Ionization Mode: Positive electrospray ionization (ESI+)
- Detection Mode: Multiple reaction monitoring (MRM)
- Ion Transitions: m/z 293→233 for NNORT, m/z 357→327 for NSERT
- Collision Energy: Optimized for each transition
Sensitivity and Validation Data [59]:
| Parameter | NNORT | NSERT |
|---|---|---|
| LOQ | 20 ng/g | 125 ng/g |
| LOD | 6 ng/g | 37.5 ng/g |
| Linearity (R²) | 0.998 | 0.998 |
| Accuracy (% Recovery) | 96.6-99.4% | 98.6-99.4% |
| Precision (% RSD) | <3.9% | <1.9% |
The phenyl-hexyl column demonstrated superior separation efficiency compared to a general-purpose C18 column, particularly critical for distinguishing trace-level NDSRIs from their parent APIs at massive concentration differences [59].
Method Selection Workflow
The following workflow provides a systematic approach for selecting the appropriate analytical technique based on impurity characteristics and regulatory requirements:
The Scientist's Toolkit: Essential Research Reagent Solutions
Successful method development for low LOD/LOQ requires careful selection of reagents and materials. The following table outlines essential components and their functions:
| Reagent/Material | Function | Application Examples |
|---|---|---|
| Phenyl-hexyl HPLC Column | Enhanced separation of aromatic compounds via π-π interactions | NDSRI analysis, chiral separations [59] |
| Zobrax C18 Column | Conventional reversed-phase separation | Standard impurity profiling [61] |
| Ammonium Formate/Formic Acid | Mobile phase modifiers for improved ionization | LC-MS/MS compatibility [59] |
| Orthophosphoric Acid | Mobile phase pH modifier for HPLC-UV | Retention time control [61] |
| Reference Standards | Accurate identification and quantification | Method validation, system suitability [61] [59] |
| Mass Spectrometry Reference Compounds | Optimization of MRM transitions | Fragment pattern identification [59] |
Validation Requirements: Impurity Methods vs. Assay Methods
The validation of impurity methods demands more rigorous sensitivity requirements compared to standard assay methods. According to ICH Q2(R1) guidelines, key parameters must be carefully evaluated for impurity quantification methods [60]:
- Specificity: Must demonstrate resolution between structurally similar impurities and the API, particularly critical at trace levels [59]
- Accuracy and Precision: Required at the LOQ level, not just at target concentration [61]
- Linearity: Must be demonstrated across a wider range, from LOQ to 120-150% of specification limit [61] [60]
- Robustness: Particularly crucial for low-level impurities where small parameter variations significantly impact results [62] [61]
Achieving low LOD/LOQ for potent impurities requires a systematic approach to method development and validation. For routine impurity monitoring at concentrations above 0.1%, well-optimized HPLC-UV methods provide sufficient sensitivity with greater accessibility and lower operational costs. However, for highly potent impurities such as NDSRIs with acceptable intake limits in the nanogram per day range, LC-MS/MS with specialized stationary phases represents the only viable option for achieving the required sensitivity. The selection between these approaches should be guided by impurity potency, regulatory requirements, and available instrumentation, always ensuring proper validation according to ICH guidelines to guarantee reliable quantification at trace levels.
In the pharmaceutical industry, the reliability of analytical methods is paramount for ensuring drug safety and efficacy. Robustness testing is a critical validation parameter that measures an analytical method's capacity to remain unaffected by small, deliberate variations in method parameters, providing an indication of its reliability during normal usage [63] [64]. According to ICH Q2(R2) guidelines, robustness should be considered during the development phase and demonstrates a method's resilience under a variety of conditions [63]. This systematic evaluation is particularly crucial within the context of validation requirements for assay versus impurity methods, as these two method types often have fundamentally different objectives and acceptance criteria.
Assay methods primarily focus on accurately quantifying the active pharmaceutical ingredient (API) in a drug product, while impurity methods are designed to detect and quantify trace-level impurities that may affect product safety [8]. This fundamental difference dictates distinct approaches to robustness testing for each method type. For assay methods, the emphasis remains on the precision and accuracy of the main component quantification, whereas for impurity methods, the focus shifts toward sensitivity and specificity at low concentration levels, often near the limits of detection and quantitation [8] [65]. Understanding these distinctions helps researchers design appropriate robustness testing protocols that address the unique challenges presented by each method type.
Core Principles and Regulatory Significance
Definitions and Distinctions
Robustness testing is formally defined as "a measure of an analytical method's capacity to remain unaffected by small but deliberate variations in method parameters, providing an indication of its reliability during normal usage" [63] [64]. It is an intra-laboratory study performed during method development and validation stages where small, premeditated variations are introduced to method parameters to identify which parameters are most sensitive to change [64]. This differs from ruggedness testing, which measures the reproducibility of results under a variety of real-world conditions, such as different analysts, instruments, laboratories, or days [64]. While robustness focuses on internal method parameters, ruggedness assesses the method's performance against broader environmental factors that might be encountered during method transfer or routine application across multiple sites [64].
Regulatory Importance and Compliance Drivers
Robustness testing has become a regulatory expectation, explicitly required by ICH Q2(R2), which states that robustness testing "provides an indication of the method's reliability under normal usage" and should be considered during method development [63]. Demonstrating robustness is a key component of regulatory submissions and is critical for drug approval. The August 2025 FDA deadline for nitrosamine drug substance-related impurities (NDSRIs) compliance has further highlighted the importance of robust analytical methods, particularly for impurity detection and quantification [65]. Regulatory agencies now require method validation that includes specificity for target compounds, detection limits significantly below acceptable intake thresholds (typically 30% of AI or lower), and demonstrated linearity, precision, and accuracy across various matrices [65].
Table 1: Key Regulatory Requirements Impacting Robustness Testing
| Regulatory Guideline | Focus Area | Robustness Requirement |
|---|---|---|
| ICH Q2(R2) | Analytical Procedure Validation | Consideration during development phase |
| FDA NDSRI Guidance (2025) | Nitrosamine Impurities | Detection at 1 ppb or lower; method specificity |
| ICH Q8(R2) | Pharmaceutical Development | Linkage to Critical Quality Attributes |
| ICH Q9 | Quality Risk Management | Risk-based approach to parameter selection |
Experimental Design for Robustness Assessment
Systematic Approach to Parameter Selection
The first critical step in robustness testing involves selecting appropriate factors and their levels for evaluation. Factors should be chosen based on their potential influence on method performance and can include parameters related to the analytical procedure itself or environmental conditions [66]. For chromatography methods, typical factors include mobile phase pH, column temperature, flow rate, detection wavelength, and mobile phase composition [66]. Qualitative factors such as column manufacturer or reagent batch may also be included. The extreme levels for each factor are generally chosen symmetrically around the nominal level described in the operating procedure, with the interval representative of variations expected during method transfer between laboratories or instruments [66].
The selection of factor levels should be scientifically justified. According to established protocols, extreme levels can be defined as "nominal level ± k * uncertainty" where 2 ≤ k ≤ 10, with the uncertainty based on the largest absolute error for setting a factor level [66]. The parameter k serves two purposes: to include error sources not initially considered and to exaggerate factor variability expected during method transfer. In some cases, asymmetric intervals around the nominal level may be more appropriate, particularly when symmetric intervals might hide response changes or when the response does not continuously increase or decrease as a function of factor levels [66].
Design of Experiments (DoE) Implementation
The application of Quality by Design (QbD) principles and Design of Experiments (DoE) represents a systematic statistical methodology for identifying test method parameters that influence method performance [67]. Screening designs such as fractional factorial (FF) or Plackett-Burman (PB) designs are commonly employed, allowing the examination of f factors in minimally f+1 experiments [66]. The selection of appropriate experimental design depends on the number of factors being examined and considerations related to the subsequent statistical interpretation of factor effects.
For robustness testing with multiple factors, a full factorial or response surface design may be implemented to systematically evaluate and enhance the test method [67]. The refinement of test methods is carried out by adjusting influential factors to achieve optimal performance, ensuring the method is robust and reliable. The number of experiments required depends on the complexity of the analytical method, with more complex methods potentially requiring more extensive experimental designs to adequately assess all potential interactions between factors [67] [66].
Table 2: Common Experimental Designs for Robustness Testing
| Design Type | Number of Factors | Experiment Count | Key Applications |
|---|---|---|---|
| Plackett-Burman | Up to N-1 | Multiple of 4 | Initial screening of multiple factors |
| Full Factorial | 2-5 (typically) | 2^k | Complete evaluation of factors and interactions |
| Fractional Factorial | 5+ | 2^(k-p) | Efficient screening with many factors |
| Response Surface | 2-4 | Varies (e.g., 13 for CCD) | Optimization studies |
Experimental Protocol and Execution
The execution of robustness tests requires careful planning of the experimental sequence. While random execution is often recommended to minimize uncontrolled influences, this approach may not address drift or time effects [66]. When such effects are anticipated, alternative sequences should be considered. One approach involves using an anti-drift sequence where design experiments are arranged so that time effects are mainly confounded with less critical factors, such as dummy factors in PB designs [66]. Another method involves adding replicated experiments at nominal levels performed at regular intervals before, during, and after design experiments, allowing for mathematical correction of observed drifts [66].
For practical reasons, experiments may be blocked by certain factors. For example, when evaluating column manufacturer as a factor, it may be more efficient to perform all experiments on one column before switching to the alternative [66]. The solutions measured in each design experiment should include representative samples and standards that account for concentration intervals and sample matrices expected during routine method application [66].
Analytical Techniques and Research Reagent Solutions
Essential Research Reagent Solutions
The reliability of robustness testing depends heavily on the quality and consistency of research reagents and materials used throughout the experimental process. The following table details key reagent solutions essential for conducting comprehensive robustness studies in pharmaceutical analysis.
Table 3: Essential Research Reagent Solutions for Robustness Testing
| Reagent/Material | Function in Robustness Testing | Application Examples |
|---|---|---|
| Reference Standards | Evaluate method performance across variations | System suitability testing; quantification |
| HPLC/UPLC Columns | Assess separation performance under variations | Different lots, manufacturers, aging |
| Mobile Phase Components | Evaluate impact of composition and pH | Buffer strength, pH, organic modifier ratio |
| Sample Preparation Reagents | Test extraction and digestion efficiency | Different batches of enzymes, solvents |
| Chromatographic Derivatization Agents | Assess reaction completeness | Different reagent lots, reaction times |
Technique-Specific Robustness Considerations
Different analytical techniques require unique approaches to robustness testing. For chromatographic methods commonly used in pharmaceutical analysis, specific parameters must be evaluated. For stability-indicating methods for antibody drug products, techniques including CE-SDS (reduced and non-reduced), iCiEF/cIEF, SEC, CEX, HIC, and HILIC require particular attention to parameter variations [67]. The development of platform methods that minimize variety in mobile phases, columns, and reagents can enhance robustness and facilitate smoother method transfers across affiliates [67].
For impurity methods, particularly those targeting nitrosamines (NDSRIs), robustness testing must demonstrate reliable detection at very low levels (1 ppb or lower) despite matrix interference [65]. Advanced sample preparation techniques including solid-phase extraction (SPE) and liquid-liquid extraction (LLE) are increasingly employed to overcome these challenges [65]. The detection of non-standard NDSRIs requires customized approaches, including development of reference standards for unknown nitrosamines and implementation of high-resolution mass spectrometry for structural identification [65].
Comparative Data Analysis and Interpretation
Statistical Analysis of Factor Effects
The analysis of robustness test data involves estimating the effect of each factor on relevant responses. The effect of factor X on response Y (E_x) is calculated as the difference between the average responses when factor X was at high level and the average responses when it was at low level [66]. Statistical and graphical methods are then used to determine the significance of these effects. Normal probability plots or half-normal probability plots can visually identify factors with significant effects that deviate from the expected linear arrangement of non-significant effects [66].
More sophisticated statistical approaches may be employed for robustness comparison. Recent studies have compared statistical methods for robustness evaluation, including Algorithm A (an implementation of Huber's M-estimator), Q/Hampel method (combining Q-method for standard deviation with Hampel's M-estimator), and NDA method (used in WEPAL/Quasimeme proficiency testing schemes) [68]. Research indicates that NDA consistently produces mean estimates closest to true values and demonstrates higher robustness to asymmetry, particularly in smaller samples, though with lower efficiency (~78%) compared to Q/Hampel and Algorithm A (both ~96%) [68]. This illustrates the typical robustness versus efficiency trade-off inherent in statistical methods.
Acceptance Criteria and Interpretation
The establishment of appropriate acceptance criteria is essential for meaningful interpretation of robustness test results. According to ICH guidelines, acceptance criteria should be defined for accuracy, precision, linearity, specificity, detection and quantification limits, and the test method range [67] [8]. These criteria are crucial for ensuring the method's robustness and reliability. The number of experiments and effort required depend on the validation stage (Stage 1 or Stage 2), with each stage having specific requirements that must be met to ensure method validity [67].
For assay methods, the primary focus is on precision and accuracy of the main component, with acceptance criteria typically requiring demonstrated consistency in quantification despite parameter variations. For impurity methods, the emphasis shifts to sensitivity and specificity, with particular attention to maintaining detection and quantification capabilities at low levels despite intentional parameter modifications [8] [65]. The recent FDA guidance on NDSRIs emphasizes the need for detection limits significantly below acceptable intake thresholds (typically 30% of AI or lower) and demonstrated robustness across various matrices and formulations [65].
Workflow Visualization and Decision Pathways
Robustness Testing Workflow
The following diagram illustrates the systematic workflow for planning, executing, and interpreting robustness tests, highlighting critical decision points and methodological considerations.
Robustness Testing Methodology Workflow illustrates the systematic process for evaluating method resilience, from initial planning through refinement decisions.
Decision Pathway for Factor Significance
This diagram outlines the decision process for determining the significance of factor effects identified during robustness testing and establishing appropriate control strategies.
Factor Significance Decision Pathway shows the evaluation process for determining which tested parameters require controlled operating ranges.
Comparative Analysis: Assay vs. Impurity Methods
Method-Specific Validation Requirements
Assay and impurity methods have distinct validation requirements that directly impact their robustness testing approaches. The table below highlights key differences in validation priorities and their implications for robustness study design.
Table 4: Robustness Testing Priorities for Assay vs. Impurity Methods
| Validation Parameter | Assay Methods | Impurity Methods |
|---|---|---|
| Primary Focus | Accurate API quantification | Detection and quantification of trace impurities |
| Critical Parameters | Precision, accuracy, linearity | Specificity, LOD, LOQ, precision at low levels |
| Robustness Priority | Consistency in main component measurement | Sensitivity maintenance despite variations |
| Typical Acceptance Criteria | Tight precision limits (e.g., RSD <2%) | Detection at 30% of AI or lower for NDSRIs |
| Matrix Considerations | Consistent recovery across variations | Selective detection despite interference |
Regulatory and Compliance Implications
The regulatory landscape for robustness testing continues to evolve, particularly for impurity methods. The upcoming 2025 FDA deadline for nitrosamine drug substance-related impurities (NDSRIs) compliance has created heightened scrutiny of impurity method robustness [65]. Manufacturers must now demonstrate thorough root cause analysis when NDSRIs are detected, including identification of formation mechanisms, evaluation of raw material quality, and assessment of processing conditions that may promote nitrosation [65]. This represents a significant expansion beyond traditional robustness testing requirements and necessitates more comprehensive experimental designs that incorporate potential formation pathways.
For assay methods, the regulatory focus remains on ensuring consistent product quality through reliable potency measurements. The application of Quality by Design (QbD) principles and Design of Experiments (DoE) represents a systematic approach to identifying critical method parameters that influence method performance [67]. The development of platform methods that minimize variety in mobile phases, columns, and reagents can enhance robustness and facilitate smoother method transfers across affiliates [67]. This approach reduces investigation times following out-of-specification (OOS) or out-of-trend (OOT) results and offers regulatory flexibility through demonstrated method understanding [67].
Robustness testing represents a critical component of analytical method validation, providing essential information about a method's resilience to minor variations in operational parameters. The systematic approach to robustness evaluation outlined in this article—incorporating careful factor selection, appropriate experimental design, statistical analysis of effects, and science-based interpretation—ensures methods remain reliable under the slight variations expected during routine use and transfer between laboratories. The distinction between assay and impurity methods remains crucial, with each requiring tailored approaches to robustness testing based on their fundamentally different objectives and validation requirements.
The future of robustness testing will likely involve increased integration of Quality by Design principles, with more sophisticated experimental designs and statistical analyses becoming standard practice. The growing regulatory focus on impurities, particularly nitrosamines (NDSRIs), will continue to drive advancements in robustness testing for trace-level detection methods. Furthermore, the development of platform methods that minimize methodological variations across different products and laboratories represents a promising approach to enhancing robustness while improving efficiency. As the pharmaceutical landscape evolves, robustness testing will remain essential for ensuring analytical methods generate reliable data that protects patient safety and product quality throughout the drug product lifecycle.
Overcoming Solvent and Sample Preparation Issues for Complex Matrices
In pharmaceutical analysis, the journey from a raw sample to a reliable data point is fraught with challenges, particularly when dealing with complex biological or formulation matrices. Sample preparation is the critical preliminary step in the analytical process where samples are processed to a state suitable for analysis, serving to isolate and concentrate analytes of interest while removing interfering matrix components [69]. The efficacy of this process directly determines the success or failure of subsequent chromatographic separations and detection systems, ultimately impacting the validity of analytical results.
Within pharmaceutical development, the validation requirements for assay versus impurity methods present distinct challenges for sample preparation. Assay methods, which quantify the main active pharmaceutical ingredient, demand exceptional accuracy and precision, while impurity methods, which identify and quantify trace-level degradants or process-related substances, require superior sensitivity and selectivity to resolve minor components from the main analyte and matrix interference [70]. This guide objectively compares contemporary sample preparation techniques through the lens of these validation requirements, providing experimental data and protocols to inform selection for methods dealing with complex matrices.
Comparative Analysis of Sample Preparation Techniques
Selecting an appropriate sample preparation technique requires careful consideration of the analytical goals, sample matrix, and target analytes. Solid-phase extraction (SPE) operates by passing a liquid sample through a solid adsorbent material that retains target compounds, which are later eluted with a suitable solvent [71]. Liquid-liquid extraction (LLE) separates compounds based on their relative solubilities in two immiscible liquids, typically water and an organic solvent [72]. QuEChERS (Quick, Easy, Cheap, Effective, Rugged, and Safe) employs a two-step process involving solvent extraction with acetonitrile followed by a dispersive solid-phase extraction (dSPE) cleanup [73]. Supported liquid extraction (SLE) represents a miniaturized form of LLE, using a diatomaceous earth support to facilitate partitioning between aqueous samples and water-immiscible organic solvents [73].
The selection of a specific technique must align with the analytical method's purpose. For impurity methods, where detecting trace-level components is paramount, techniques with high concentrating capability and superior cleanup efficiency are essential. For assay methods, which focus on the primary active component, maintaining the stability and recovery of the main compound while removing potentially interfering matrix components becomes the priority.
Performance Comparison for Validation Parameters
Table 1: Technique Performance for Key Validation Parameters
| Technique | Recovery (%) | Precision (%RSD) | Matrix Removal Efficiency | Sensitivity Enhancement | Throughput (samples/hour) |
|---|---|---|---|---|---|
| SPE | 85-105 [71] | 3-8 [71] | High (selective sorbents) [73] | 10-100x (preconcentration) [71] | 5-20 (manual); 40-60 (automated) [73] |
| LLE | 75-98 [72] | 5-12 [72] | Moderate (partitioning-based) [72] | 5-20x (evaporation) [72] | 10-15 (manual) |
| QuEChERS | 80-110 [73] | 4-10 [73] | High (dual cleanup mechanism) [73] | 5-25x (depends on matrix) [73] | 15-30 (manual) |
| SLE | 90-102 [73] | 3-7 [73] | Moderate (effective for polar interferences) [73] | 5-15x (minimal dilution) [73] | 15-25 (manual) |
Table 2: Validation Parameter Performance for Assay vs. Impurity Applications
| Technique | Assay Method Suitability | Impurity Method Suitability | Key Advantages | Primary Limitations |
|---|---|---|---|---|
| SPE | High (excellent precision and recovery) [71] | High (superior concentration and cleanup) [71] | High selectivity, automatable, low solvent consumption [71] [73] | Sorbent cost, method development complexity [72] |
| LLE | Moderate (adequate for main component) [72] | Low to Moderate (limited sensitivity) [72] | Simple, cost-effective, widely applicable [72] | Emulsification issues, large solvent volumes [72] |
| QuEChERS | Moderate (rugged for varied matrices) [73] | High (effective for multiclass impurities) [73] | Rapid, effective for complex matrices, minimal glassware [73] | Limited to specific solvent systems, less selective [73] |
| SLE | High (excellent recovery for APIs) [73] | Moderate (good for semi-volatile impurities) [73] | High recovery, no emulsification, easy method transfer [73] | Less efficient for nonpolar matrices, limited sorbent options [73] |
Experimental Protocols for Key Techniques
Solid-Phase Extraction for Impurity Enrichment
Objective: To extract and concentrate trace-level pharmaceutical impurities from a formulation matrix while removing excipient interference.
Materials: C18 SPE cartridges (500 mg/6 mL), vacuum manifold, water, methanol, acetonitrile, ammonium acetate buffer (10 mM, pH 4.5) [73].
Protocol:
- Conditioning: Sequentially condition the SPE cartridge with 5 mL methanol followed by 5 mL water.
- Loading: Load 1 mL of sample solution (formulation dissolved in ammonium acetate buffer) onto the cartridge at a flow rate of 1-2 mL/min.
- Washing: Wash with 5 mL of 5% methanol in water to remove weakly retained matrix components.
- Elution: Elute impurities with 5 mL of 80:20 acetonitrile:methanol solution.
- Concentration: Evaporate the eluent to dryness under nitrogen at 40°C and reconstitute in 100 µL of mobile phase for injection [73].
Validation Data: This protocol typically achieves 85-105% recovery for most impurity compounds with RSDs of 3-8%. Sensitivity enhancement of 10-fold is routinely achieved through preconcentration, essential for quantifying impurities at 0.1% levels relative to the API [71].
QuEChERS for Multiclass Impurity Profiling
Objective: Simultaneous extraction of multiple impurity classes from complex biological matrices.
Materials: QuEChERS extraction salts (4 g MgSO4, 1 g NaCl, 1 g sodium citrate, 0.5 g disodium hydrogen citrate), dSPE cleanup tubes (150 mg MgSO4, 25 mg PSA, 25 mg C18), acetonitrile, 1% acetic acid solution [73].
Protocol:
- Homogenization: Homogenize 2 g of tissue sample with 10 mL acetonitrile containing 1% acetic acid.
- Extraction: Add extraction salts to the homogenate, shake vigorously for 1 minute, and centrifuge at 4000 rpm for 5 minutes.
- Cleanup: Transfer 1 mL of the supernatant to dSPE cleanup tubes, vortex for 30 seconds, and centrifuge at 4000 rpm for 5 minutes.
- Analysis: Transfer the purified supernatant to an autosampler vial for LC-MS/MS analysis [73].
Validation Data: This method demonstrates 80-110% recovery for over 200 pharmaceutical impurities with RSDs below 15%. The efficient removal of phospholipids and other matrix components reduces ion suppression in MS detection by 60-80% compared to simple protein precipitation [73].
Analytical Workflows for Method Validation
The sample preparation workflow is critical for generating consistent and reliable results. The following diagram illustrates the decision-making process for selecting and optimizing sample preparation techniques based on analytical goals and matrix considerations.
Essential Research Reagent Solutions
Table 3: Key Research Reagents for Sample Preparation
| Reagent/Sorbent | Primary Function | Application Examples | Selection Considerations |
|---|---|---|---|
| C18 Bonded Silica | Reversed-phase retention of nonpolar compounds | Extraction of non-polar APIs and impurities from biological fluids [73] | Carbon chain length (C18 more retentive than C8); suitable for compounds with clear polarity distinction [73] |
| Primary/Secondary Amine (PSA) | Multifunctional sorbent for polar compounds and anions | QuEChERS cleanup of food matrices; removal of fatty acids and sugars [73] | Higher ion-exchange capacity than amino phases; less retention of polar compounds [73] |
| Diatomaceous Earth | Inert support for liquid-liquid partitioning | Supported Liquid Extraction (SLE) of APIs from plasma and serum [73] | High surface area support; eliminates emulsification issues in traditional LLE [73] |
| Buffered QuEChERS Salts | pH-controlled partitioning during extraction | Multiclass impurity profiling in tissue and plant matrices [73] | AOAC salts (pH ~5) vs. EN salts (pH 5-5.5); selection based on analyte stability [73] |
| Molecular Sieves | Solvent drying and purification | Removal of water from organic solvents for moisture-sensitive applications [74] | Pore size selection (3A, 4A, 5A) based on molecular dimensions; regeneration possible [74] |
Method Validation Considerations for Assay vs. Impurity Applications
Addressing Matrix Effects in Impurity Methods
Matrix effects represent a significant challenge in impurity method validation, particularly when using mass spectrometric detection. Matrix components can suppress or enhance analyte ionization, leading to inaccurate quantification [70]. The use of stable isotopically labeled internal standards is recommended to correct for these fluctuations, as they experience nearly identical ionization effects as the target analytes [70]. Notably, nitrogen-15 (15N) and carbon-13 (13C) labeled standards are often preferred over deuterated standards due to minimized chromatographic isotope effects that can cause retention time shifts [70].
For assay methods, where the primary component is typically present at much higher concentrations, matrix effects can often be mitigated through dilution or selective extraction. However, for impurity methods detecting compounds at 0.1% levels or lower, comprehensive matrix effect studies are essential. Sample preparation techniques like SPE and QuEChERS provide superior matrix removal, reducing ion suppression by 60-80% compared to simpler techniques like protein precipitation [73].
Recovery and Selectivity Requirements
The validation requirements for recovery differ substantially between assay and impurity methods. For assay methods, the focus is on achieving consistent, high recovery (typically 98-102%) of the main active ingredient [71]. For impurity methods, the priority shifts to ensuring detectable recovery of all potential impurities, which may have diverse chemical properties. While absolute recovery may vary (70-120% is often acceptable for trace levels), the precision of recovery becomes paramount for accurate quantification [71].
Technique selection must also consider selectivity—the ability to accurately measure the analyte in the presence of potentially interfering components. For impurity methods, this requires separation of structurally similar degradants and process-related compounds that may co-elute with the main peak or with each other. The enhanced selectivity of modern sorbents, including mixed-mode and selective phases, provides improved resolution of these challenging separations [73].
The selection and optimization of sample preparation techniques for complex matrices must be guided by the distinct validation requirements of assay versus impurity methods. As demonstrated in this comparison, modern techniques like SPE, QuEChERS, and SLE offer significant advantages for specific applications, with SPE providing superior selectivity for impurity methods, and SLE delivering excellent recovery for assay applications. The continuing evolution of sorbent chemistries, automation capabilities, and green chemistry approaches will further enhance our ability to address solvent and sample preparation challenges in pharmaceutical analysis. Through strategic technique selection based on systematic evaluation of validation parameters, researchers can develop robust methods that withstand regulatory scrutiny while generating scientifically defensible data.
The control of nitrosamine impurities represents one of the most significant challenges in modern pharmaceutical quality control. Since the initial recalls of angiotensin II receptor blockers (sartans) in 2018, regulatory expectations have evolved into a comprehensive framework requiring rigorous risk assessment, detection, and control of these genotoxic impurities. Nitrosamines are classified into two structural classes: small-molecule nitrosamines (e.g., NDMA, NDEA) that do not share structural similarity with the active pharmaceutical ingredient (API), and nitrosamine drug substance-related impurities (NDSRIs) that form from the API itself or its fragments [11]. The regulatory landscape is dynamic, with the FDA, EMA, and other global authorities establishing strict acceptable intake (AI) limits, often in the nanogram per day range, and setting definitive deadlines for compliance, recently extended to allow detailed progress reports by August 2025 [11] [65].
This article situates nitrosamine analysis within the broader context of validation requirements for assay versus impurity methods. While assay methods focus on quantifying the main drug component, impurity methods must identify and quantify numerous trace-level compounds, demanding far greater specificity, sensitivity, and robustness. The analytical procedures for nitrosamines, particularly the choice between various chromatographic and mass spectrometric techniques, must be validated to demonstrate they are suitable for this specific, challenging purpose [75] [76].
Analytical Method Comparison: Techniques for Nitrosamine Quantification
The analysis of nitrosamines in pharmaceuticals presents a unique challenge due to their low AI limits and the absence of distinct chromophores in their structure, making traditional HPLC-UV methods insufficient for most compounds [76]. The table below compares the primary analytical techniques and their performance characteristics for nitrosamine analysis.
Table 1: Comparison of Analytical Techniques for Nitrosamine Impurity Analysis
| Analytical Technique | Typical Instrumentation | Key Advantages | Limitations/Challenges | Reported LOQ/LOD | Suitable For |
|---|---|---|---|---|---|
| HPLC-MS/MS (Triple Quadrupole) | Agilent 6460 Triple Quad with APCI [76] | High sensitivity and selectivity; robust quantitative performance; can achieve sub-ppb LOQs | Method development can be complex; requires optimization of MRM transitions; potential for matrix effects | LOQ: 0.2-1.1 ng/mL for NDMA, NDEA, NMBA, NEIPA [76] | Routine quality control; targeted analysis of specific nitrosamines |
| LC-HRMS (High-Resolution MS) | Not specified in results, but referenced as FDA method [76] | Untargeted screening capability; accurate mass measurement for structural elucidation | Higher instrument cost and operational complexity; may be excessive for routine targeted QC | Sufficient for regulatory limits [76] | Research and identification of unknown NDSRIs; confirmatory analysis |
| GC-MS | Referenced in inter-laboratory study [77] | Well-established technique for volatile nitrosamines | Limited to volatile and thermally stable compounds; may require derivatization | Data from inter-lab studies [77] | Volatile nitrosamines (e.g., NDMA, NDEA) |
The choice of technique is driven by the specific regulatory requirements and the nature of the nitrosamines. For the routine analysis of a defined set of nitrosamines in sartans, HPLC-MS/MS has proven to be a robust and sensitive solution, effectively overcoming the lack of chromophores and achieving the necessary low detection limits [76]. In contrast, for unknown NDSRIs or broad screening, LC-HRMS offers the required flexibility, albeit at a higher cost and complexity [76] [65].
Experimental Protocols: Detailed Workflows for Nitrosamine Testing
HPLC-MS/MS Protocol for Sartans (Valsartan, Losartan, Irbesartan)
A validated method for determining four nitrosamine impurities (NDMA, NDEA, NMBA, NEIPA) exemplifies a targeted approach [76].
Chromatographic Conditions:
- Column: Agilent InfinityLab Poroshell 120 EC-C18 (50 mm × 3.0 mm, 2.7 µm)
- Mobile Phase A: 10 mM Ammonium formate in water
- Mobile Phase B: 10 mM Ammonium formate in methanol
- Gradient Elution: Linear gradient from 5% B to 95% B over 7 minutes
- Flow Rate: 0.4 mL/min
- Injection Volume: 5 µL
- Column Temperature: 30°C
Mass Spectrometric Detection:
- Ionization Source: Atmospheric Pressure Chemical Ionization (APCI)
- Mode: Positive ion mode
- Detection: Multiple Reaction Monitoring (MRM)
- Specific MRM Transitions: Optimized for each nitrosamine (e.g., NDMA: 75.1→43.1, 75.1→58.1)
Sample Preparation:
- A sample equivalent to the maximum daily dose of the API (e.g., 320 mg for Valsartan) is placed in a centrifuge tube.
- 5 mL of calibration standard is added, followed by vortex mixing for 1 minute and sonication (100W, 35kHz) for 5 minutes.
- An additional 5 mL of solvent is added, followed by further mixing and sonication.
- The mixture is centrifuged at 2,050 g for 7 minutes.
- The supernatant is filtered through a 0.45 µm filter before injection [76].
This protocol's use of APCI ionization was noted for maximizing sensitivity and helping to mitigate matrix effects, a common challenge in nitrosamine analysis [76] [65].
UHPLC-UV Protocol for Multi-Component Assay and Impurities
For method development contexts, including robustness studies, a UHPLC-UV method for diphenhydramine and phenylephrine oral solution illustrates separations of multiple components [75].
- Chromatographic Conditions:
- Column: 2.1 × 150 mm with 1.7 µm Kinetex C8 core-shell particles
- Mobile Phase A: 60 mM Potassium perchlorate aqueous solution, pH-adjusted with 0.6 mL/L of 70% perchloric acid
- Mobile Phase B: 45:55 mixture of 60 mM Potassium perchlorate and acetonitrile, also acidified
- Gradient Elution: Complex multi-step gradient over 74 minutes (0-100% B)
- Flow Rate: 0.3 mL/min
- Column Temperature: 15°C
- Detection Wavelength: 210 nm
- Injection Volume: 5 µL for impurities, 4 µL for assay [75]
This method highlights the extensive development often required to separate APIs, their related impurities, and excipients, achieving robustness against small changes in flow rate, temperature, and gradient [75].
Validation Requirements: Assay vs. Impurity Methods
The validation of analytical procedures must conform to ICH Q2(R1) guidelines, but the performance criteria differ significantly between assay and impurity methods [75]. The table below contrasts these requirements, using data from nitrosamine and other impurity method validations.
Table 2: Comparison of Validation Requirements for Assay vs. Impurity Methods
| Validation Parameter | Typical Requirement for Assay Methods | Typical Requirement for Impurity Methods (e.g., Nitrosamines) | Example from Literature |
|---|---|---|---|
| Specificity | Resolve API from excipients and degradation products. | Resolve all known and potential impurities from each other and the API. Critical for early-eluting impurities and excipients [75]. | A UHPLC method demonstrated resolution of 11 related organic impurities from two drug compounds in oral solutions [75]. |
| Accuracy/Recovery | High accuracy (e.g., 98-102%) at the target concentration. | Demonstrated at low levels, spiked around the specification limit. | Nitrosamine method showed good accuracy across multiple compounds in different sartan matrices [76]. |
| Precision | High precision (RSD < 2%) for assay of the main component. | Requires precision at the low end of the calibration curve, near the LOQ. | |
| Linearity | Linear over a narrow range (e.g., 80-120% of target). | Linear over a wider range, from LOQ to well above the specification limit. | A linearity R² > 0.99 was demonstrated for 9 impurities in Trimetazidine HCl [78]. |
| Range | 80-120% of the test concentration. | From LOQ to 120-150% of the specification limit. | |
| LOQ/LOD | Not a primary focus, as the API is a major component. | A critical parameter; LOQ must be sufficiently low to confirm safety. | LOQ of 0.2 ng/mL achieved for four nitrosamines via HPLC-MS/MS, which is below the required level based on AI limits [76]. |
The core distinction lies in the required sensitivity and specificity. An assay method must accurately quantify a single, high-concentration component, whereas an impurity method must reliably detect and quantify multiple trace-level analytes in the presence of a high-concentration API and complex excipients. For nitrosamines, the Limit of Quantitation (LOQ) is paramount, often needing to be at or below 30% of the AI limit, pushing the boundaries of analytical technology [65].
The Scientist's Toolkit: Essential Reagents and Materials
Successful development and execution of nitrosamine methods depend on specific, high-quality reagents and materials.
Table 3: Essential Research Reagent Solutions for Nitrosamine Analysis
| Item | Function/Description | Example from Protocols |
|---|---|---|
| HPLC-MS Grade Solvents | High-purity acetonitrile and methanol to minimize background noise and contamination in mass spectrometry. | Acetonitrile (gradient grade, ≥99.9%) and Methanol used for mobile phase and sample prep [76]. |
| Volatile Buffers/Additives | MS-compatible buffers for mobile phases to control pH and improve ionization without causing signal suppression. | 10 mM Ammonium formate in water and methanol [76]. |
| Certified Nitrosamine Standards | High-purity reference materials for method development, calibration, and validation. | Certified reference materials for NDMA, NDEA, etc. [76]. |
| API-Specific NDSRI Standards | Custom-synthesized standards for nitrosamines unique to a specific API, required for NDSRI analysis. | Not commercially available for all; requires synthesis. |
| Solid-Phase Extraction (SPE) Cartridges | For sample clean-up to reduce matrix interference and pre-concentrate analytes for lower detection limits. | Not used in [76] but noted as an advanced technique to overcome matrix challenges [65]. |
| Sub-2µm UHPLC Columns | Columns with small particle sizes for high-resolution separation of complex mixtures. | Kinetex C8 column (1.7 µm) [75]; Poroshell EC-C18 (2.7 µm) [76]. |
Logical Workflow and Signaling Pathways
The process of ensuring drug product safety regarding nitrosamines follows a logical, multi-step workflow from risk assessment to regulatory compliance. The following diagram visualizes this process and the critical decision points.
Diagram 1: NDSRI Risk Assessment and Testing Workflow. This flowchart outlines the logical sequence from initial risk assessment to regulatory compliance, highlighting the iterative nature of method development and mitigation if nitrosamines are detected above Acceptable Intake (AI) limits.
The technical process of analyzing a sample, from preparation to data interpretation, is summarized in the following experimental workflow diagram.
Diagram 2: Nitrosamine Analytical Experimental Workflow. This diagram details the key steps in the sample preparation and analysis protocol for nitrosamine determination using HPLC-MS/MS, as adapted from published methods [76].
The analysis of nitrosamine impurities sits at the intersection of advanced analytical science and stringent regulatory compliance. As this comparison demonstrates, techniques like HPLC-MS/MS have become the benchmark for targeted analysis due to their superior sensitivity and selectivity, while LC-HRMS offers a powerful tool for investigating unknown NDSRIs. The validation of these methods demands a focus on parameters far exceeding those for standard assay procedures, with particular emphasis on achieving low LOQs and demonstrating robustness in complex matrices.
With regulatory deadlines firmly in place, the pharmaceutical industry must continue to rely on and advance these sophisticated analytical techniques. The methodologies and validation frameworks discussed provide a roadmap for ensuring drug safety and navigating the complex challenge of nitrosamine impurities now and in the future.
A Comparative Analysis and Lifecycle Management of Validated Methods
In pharmaceutical analysis, the validation of an analytical procedure provides documented evidence that the method is fit for its intended purpose [2]. The "intended purpose" is the critical differentiator that dictates which validation parameters require the most rigorous assessment. Two of the most common analytical procedures in drug development and quality control are the assay method (a quantitative test to measure the main active ingredient in a drug substance or product) and the impurity method (used to detect and quantify unwanted components, such as by-products or degradation products) [34]. The analytical target profile, which defines the method's goals and acceptance criteria, must be established early on, as it directly governs the validation strategy [79].
A one-size-fits-all approach to validation is not scientifically sound. The performance characteristics that must be demonstrated for a method to be considered validated depend entirely on the type of analytical procedure in question [34]. This guide provides a head-to-head comparison of validation requirements for assay versus impurity methods, synthesizing information from major regulatory guidelines including those from the ICH, FDA, and USP [80] [34]. Understanding these distinctions is fundamental for researchers, scientists, and drug development professionals to ensure regulatory compliance, data integrity, and ultimately, patient safety.
The table below provides a consolidated overview of the typical validation requirements and their relative focus for assay and impurity methods, based on international regulatory guidelines.
Table 1: Validation Parameter Focus for Assay vs. Impurity Methods
| Validation Parameter | Assay Method Focus | Impurity Method Focus | Key Regulatory References |
|---|---|---|---|
| Accuracy | High focus on demonstrating closeness to the true value of the major analyte. | Crucial for quantifying impurities at low levels; often assessed via spiking studies. | ICH, FDA, USP [34] |
| Precision (Repeatability) | Essential for the major component measurement. | Critical for reliable quantification of impurities, especially at low levels. | ICH, FDA, USP [34] |
| Specificity/Selectivity | Must demonstrate that the method can unequivocally assess the analyte in the presence of excipients or impurities. | Paramount. Must demonstrate baseline separation of all impurities from each other and the main peak. | ICH, FDA [2] [34] |
| Linearity | Required across the claimed range of the assay (e.g., 80-120% of target concentration). | Required, but the range is defined from the LOQ to a level above the specified impurity limit. | ICH [34] |
| Range | The interval from 80% to 120% of the test concentration is typical. | The interval from the LOQ to a level above the specified impurity limit (e.g., 120% of specification). | ICH [34] |
| Limit of Detection (LOD) | Not typically required for the main component assay. | High Focus. Essential for limit tests and for confirming an impurity is below a reporting threshold. | ICH, FDA [2] [34] |
| Limit of Quantitation (LOQ) | Not typically required for the main component assay. | High Focus. Required for any quantitative impurity test. Must demonstrate acceptable precision and accuracy at the LOQ. | ICH, FDA [2] [34] |
| Robustness | Should be investigated for both types of methods during development. | Should be investigated for both types of methods during development. | ICH [81] [2] |
Detailed Experimental Protocols for Key Parameters
The following sections outline standard experimental methodologies used to generate the validation data summarized above.
Protocol for Accuracy and Precision
Objective: To demonstrate that the method yields results that are both close to the true value (accuracy) and reproducible (precision) [2].
Assay Method Protocol:
- Sample Preparation: Prepare a minimum of nine determinations over a minimum of three concentration levels (e.g., 80%, 100%, 120% of the target concentration) covering the specified range. Each level should include three replicates [2].
- Comparison: For drug substances, compare results to the analysis of a standard reference material. For drug products, use synthetic mixtures of the product placebo spiked with known quantities of the active component [2] [34].
- Data Reporting: Report accuracy as the percent recovery of the known, added amount, or as the difference between the mean and the true value along with confidence intervals (e.g., ±1 standard deviation) [2].
Impurity Method Protocol (when impurities are available):
- Sample Preparation: Spike the drug substance or drug product with known amounts of impurities at various levels, typically covering a range from the LOQ to at least 120% of the expected or specified limit [34].
- Analysis: Analyze the spiked samples and calculate the recovery of each impurity.
- Data Reporting: Report recovery for each impurity and the relative standard deviation (RSD) of replicate measurements to demonstrate precision at the relevant levels [34].
Protocol for Specificity/Selectivity
Objective: To prove the method can reliably measure the analyte of interest without interference from other components [2] [34].
Assay Method Protocol:
- Interference Check: Analyze individually: the blank (excipients or solvent), the placebo (formulation without active ingredient), and a standard of the active ingredient.
- Forced Degradation: Stress the drug substance or product under various conditions (e.g., acid/base hydrolysis, oxidation, thermal, photolytic) to induce degradation [34].
- Assessment: Demonstrate that the assay result for the active ingredient is unaffected by the presence of degradation products and excipients, and that the analyte peak is homogenous and free from co-eluting peaks. Peak purity tests using diode array detection (DAD) or mass spectrometry (MS) are strongly recommended [2].
Impurity Method Protocol:
- Forced Degradation: As above, subject the sample to stress conditions to generate degradation products.
- Chromatographic Separation: Inject the stressed sample and demonstrate that all impurity and degradation product peaks are resolved from the main analyte peak and from each other.
- Assessment: Critical separations should be investigated at an appropriate level. Specificity is demonstrated by the resolution of the two most closely eluting compounds, which are often the active ingredient and a closely eluting impurity [34]. Peak purity assessment is critical.
Protocol for Limit of Detection (LOD) and Quantitation (LOQ)
Objective: To determine the lowest levels of an analyte that can be detected and quantitatively measured with acceptable accuracy and precision [2].
Standard Procedure (Signal-to-Noise):
- Preparation: Prepare and analyze samples with known, low concentrations of the impurity.
- LOD Calculation: The LOD is generally determined as the concentration for which the signal-to-noise ratio (S/N) is approximately 3:1 [2].
- LOQ Calculation: The LOQ is generally determined as the concentration for which the signal-to-noise ratio (S/N) is approximately 10:1 [2].
- LOQ Verification: The LOQ must be validated by analyzing replicate samples at that concentration and demonstrating an acceptable precision (e.g., %RSD) and accuracy (% Recovery) [2].
Alternative Procedure (Based on Standard Deviation): LOD or LOQ can also be calculated using the formula:
LOD/LOQ = K(SD/S), where K is a constant (3 for LOD, 10 for LOQ), SD is the standard deviation of the response, and S is the slope of the calibration curve [2].
The Scientist's Toolkit: Essential Research Reagents & Materials
Table 2: Key Reagents and Materials for Validation Studies
| Item | Function in Validation |
|---|---|
| Drug Substance Standard (High Purity) | Serves as the primary reference material for both assay and impurity method development and validation. |
| Well-Characterized Impurity Standards | Critical for specificity, accuracy, LOD/LOQ, and linearity studies for impurity methods. |
| Placebo Formulation | Contains all excipients of the drug product except the active ingredient; used to demonstrate specificity and selectivity by confirming no interference with the analyte peak. |
| Certified Reference Material (CRM) | An accepted reference value used to demonstrate the trueness (accuracy) of an analytical method [81]. |
| Stressed Samples (Forced Degradation) | Samples subjected to heat, light, acid/base, and oxidation to generate degradation products; used to validate the stability-indicating properties of a method, particularly specificity. |
| Appropriate Chromatographic Columns & Reagents | Specific columns, high-purity solvents, and mobile phase additives are essential for achieving the required selectivity, sensitivity, and robustness. |
Method Validation Workflow and Regulatory Context
The following diagram illustrates the logical workflow for approaching method validation, from defining the purpose to ongoing verification, emphasizing the critical decision points between assay and impurity methods.
The validation of analytical methods is not a checkbox exercise but a scientifically rigorous process tailored to the method's purpose. As this guide demonstrates, the validation strategies for assay and impurity methods, while sharing common parameters, have distinct and critical differences in focus. Assay methods are optimized and validated for accurate and precise quantification of the major active component, with parameters like accuracy, precision, and linearity over a narrow range around 100% taking precedence. In contrast, impurity methods are validated to be highly selective and sensitive, with paramount importance placed on specificity, LOD, and LOQ to ensure that trace-level components are reliably detected and measured.
A successful validation strategy adopts a fit-for-purpose and risk-based approach, aligned with the analytical lifecycle concept [79]. This ensures that methods are not only compliant with global regulatory standards from the FDA, ICH, and USP [80] [34] but are also robust and reliable tools that provide confidence in the quality, safety, and efficacy of pharmaceutical products throughout their lifecycle.
The development and validation of analytical procedures are fundamental to ensuring the identity, strength, quality, purity, and potency of pharmaceutical products. Traditionally, the "minimal" or "traditional" approach to analytical procedure development has focused on meeting predefined, often generic, acceptance criteria with limited emphasis on understanding the underlying causes of variability [82]. This approach, while straightforward, creates a rigid regulatory framework that can restrict necessary optimizations during a product's lifecycle [83]. In response, a paradigm shift is occurring, moving from a static, one-time validation model toward a dynamic, science- and risk-based Analytical Procedure Lifecycle Management (APLM) framework [82] [84]. This enhanced approach, systematically outlined in guidelines like ICH Q14, prioritizes deep method understanding to build a more flexible and robust control strategy, ultimately enhancing drug product quality and facilitating more efficient post-approval changes [83] [85].
This guide objectively compares the minimal and enhanced approaches, focusing on their application within the specific context of validation requirements for assay and impurity methods. We will explore the foundational concepts, provide experimental data, and detail the protocols that enable a more predictive and agile control strategy.
Comparative Analysis: Minimal vs. Enhanced Approach
The core difference between the two approaches lies in their fundamental objectives: the minimal approach aims to prove a method is fit-for-purpose at a single point in time, whereas the enhanced approach seeks to understand the method's behavior throughout its entire lifecycle to proactively manage performance and change.
The following table summarizes the key distinctions:
| Feature | Minimal Approach | Enhanced Approach |
|---|---|---|
| Philosophy | Compliant, one-time verification [82] | Science-based, continuous learning [82] |
| Development | Iterative, univariate; focuses on set points [84] | Systematic, multivariate; uses Risk Assessment & DoE [82] [85] |
| Knowledge Foundation | Limited, often tacit [86] | Structured and documented; uses an Analytical Target Profile (ATP) [82] [85] |
| Control Strategy | Fixed parameters; rigid [83] | Flexible, with Proven Acceptable Ranges (PARs) or a Method Operable Design Region (MODR) [83] [82] |
| Lifecycle Management | Changes often require prior regulatory approval [84] | Changes within MODR can be managed with lower reporting categories [85] [84] |
| Validation | A one-time event [82] | An ongoing process integrated with monitoring [84] |
A critical tool of the enhanced approach is the Analytical Target Profile (ATP), which is a prospective summary of the required performance characteristics of an analytical procedure [82] [85]. The ATP, derived from the Quality Target Product Profile (QTPP), defines what the method needs to measure (e.g., quantify an impurity at 0.1%) but not how to do it. This guides all subsequent development, validation, and lifecycle activities.
Application in Assay and Impurity Method Validation
The principles of the enhanced approach apply universally, but the specific validation requirements and focus areas differ significantly between assay and impurity methods, as detailed in the updated ICH Q2(R2) guideline [87].
Comparative Validation Requirements
The table below summarizes the typical validation parameters and their acceptance criteria for assay and impurity methods, highlighting where the enhanced approach provides deeper understanding.
| Validation Parameter | Assay Method (Typical Criteria) | Impurity Method (Typical Criteria) | Enhanced Approach Value |
|---|---|---|---|
| Accuracy/Precision | Accuracy: 98.0-102.0% [2]. Precision (RSD): ≤ 2.0% [88] | Accuracy: 50-150% of spec [2]. Precision (RSD): ≤ 10% at QL [88] | DoE provides a holistic view of accuracy/precision across the MODR, not just at set points. |
| Specificity | Demonstrate no interference from excipients, degradants [2] | Resolve all known and potential impurities from each other and the main peak [2] | Uses peak purity tests (DAD/MS) to unequivocally demonstrate specificity for unknown degradants [2]. |
| Range | 80-120% of test concentration [87] | Reporting level to 120% of specification [2] | Systematically establishes the true operable range, often broader than the minimum. |
| Linearity | R² > 0.998 [88] | R² > 0.990 (near QL) [88] | Models linear and non-linear responses, crucial for impurity methods at low levels [87]. |
| LOQ/LOD | Not always required | Critical: S/N ≥ 10 for LOQ [2] | Risk assessment identifies needs; DoE establishes robust LOQ/LOD as part of the ATP. |
| Robustness | Evaluated during development [87] | Extensively evaluated during development [87] | Formally defined via DoE, creating a MODR that inherently manages variability [85]. |
For impurity methods, the enhanced approach is particularly transformative. The heightened focus on specificity and robustness ensures that methods can not only separate and accurately quantify known impurities but are also resilient enough to handle unexpected variability in sample matrix or analytical conditions without generating out-of-specification (OOS) results [84]. Establishing a MODR for an impurity method provides confidence that the method will reliably control product quality throughout its lifecycle.
Experimental Protocol: Implementing the Enhanced Approach
The following workflow provides a detailed protocol for developing an analytical procedure using the enhanced approach, based on a case study for a drug product's impurity method [85].
Workflow for Enhanced Analytical Development
Step-by-Step Methodology
Define the Analytical Target Profile (ATP):
- Objective: To create a quality-based foundation for method development.
- Protocol: The ATP is defined from the CQAs in the QTPP. For an impurity method, the ATP would state: "The procedure must be capable of quantifying all specified impurities in DP-Y at a reporting threshold of 0.10% and a specification limit of 0.50%, with an accuracy of 50-150% and a precision of RSD ≤ 10.0% at the quantitation limit" [85].
Select Analytical Technology:
- Objective: To choose a platform capable of meeting the ATP.
- Protocol: Based on the ATP, a technology (e.g., UPLC-UV) is selected. Preliminary scouting runs are performed to confirm basic feasibility, such as separating all known impurities and the active ingredient [85].
Perform Risk Assessment:
- Objective: To identify high-risk method parameters that significantly impact performance.
- Protocol: A systematic tool like Failure Mode and Effects Analysis (FMEA) is used. Parameters (e.g., column temperature, mobile phase pH, gradient slope) are scored for their potential impact, probability, and detectability on critical responses (e.g., resolution between two critical impurities, signal-to-noise). High-risk parameters (e.g., a risk priority number > 40) are selected for further study [85] [84].
Execute Design of Experiments (DoE):
- Objective: To systematically understand the relationship between critical method parameters and performance responses.
- Protocol: A multivariate DoE (e.g., a Full or Partial Factorial design) is executed. The high-risk parameters from Step 3 are the "factors," varied over a predefined range. The critical method performance characteristics (e.g., resolution, retention time, tailing factor) are the "responses." The data is analyzed using statistical software to generate a model that predicts method performance across the multi-dimensional parameter space [85].
Establish the Method Operable Design Region (MODR):
- Objective: To define the multidimensional combination of analytical parameter ranges where the method meets ATP criteria.
- Protocol: Using the model from the DoE, an MODR is established. For example, the MODR could define that the method meets all resolution and precision criteria when column temperature is between 38-42°C and mobile phase pH is between 5.8-6.2. Operating anywhere within this MODR ensures robust performance [82] [85].
Define the Control Strategy and Established Conditions (ECs):
- Objective: To formalize the controls for routine use and define the regulatory framework for post-approval changes.
- Protocol: The control strategy includes system suitability tests (SSTs) derived from the ATP to ensure the method is functioning correctly each day it is used [84]. Established Conditions (ECs) are defined as the legally binding parameters necessary to assure product quality. With an MODR, the ECs can be the ranges themselves, allowing for movement within the MODR without a regulatory submission. Without an MODR, specific set points become rigid ECs [85] [84].
The Scientist's Toolkit: Essential Research Reagent Solutions
Successful implementation of the enhanced approach relies on specific tools and materials. The following table details key solutions used in the featured experiments.
| Tool/Solution | Function in Enhanced Development |
|---|---|
| UPLC-UV System | Provides high-resolution separation and quantitative detection for chromatographic methods, essential for assessing specificity and sensitivity per the ATP [85]. |
| Design of Experiments (DoE) Software | Enables the statistical design of multivariate experiments and the modeling of data to establish MODRs and understand parameter interactions [85]. |
| Risk Assessment Tools (e.g., FMEA) | Provides a structured framework for identifying and prioritizing critical method parameters (CMPs) that require experimental investigation [85] [84]. |
| Pharmaceutical Quality System (PQS) | The overarching system, per ICH Q10, that governs knowledge management, quality risk management, and change management throughout the product lifecycle [86]. |
| Method Operable Design Region (MODR) | The core output of enhanced development; the established combination of analytical parameter ranges within which changes do not impact method performance [82] [85]. |
The enhanced approach to analytical procedure development represents a fundamental shift from a reactive, compliance-driven mindset to a proactive, science-based framework for building quality into methods. By leveraging deep method understanding through tools like the ATP, risk assessment, and DoE, scientists can establish a flexible control strategy centered on the MODR. This strategy offers significant advantages in method robustness and regulatory flexibility, which is especially critical for complex impurity methods. As the industry continues to adopt ICH Q14 and Q2(R2), the enhanced approach will become the standard for efficiently ensuring drug product quality and safety throughout the entire product lifecycle.
In pharmaceutical development, the concept of validation is not a one-time event but a comprehensive lifecycle approach that extends from initial method development through commercial production. This lifecycle management framework ensures that analytical methods and manufacturing processes remain in a state of control, consistently producing results and products that meet predetermined quality standards. The validation requirements differ significantly between analytical techniques, particularly when comparing assay methods against impurity methods, each with distinct validation parameters and continuous verification strategies.
Within the current regulatory landscape, authorities expect a process validation life cycle approach, where ongoing verification replaces routine revalidation, particularly in non-sterile manufacturing [89]. This article provides a structured comparison of validation lifecycle approaches, presenting experimental data and protocols to guide researchers, scientists, and drug development professionals in implementing robust validation strategies for both assay and impurity methods.
Comparative Framework: Assay vs. Impurity Methods
The validation of analytical methods requires different approaches based on the method's purpose and technical requirements. Assay methods primarily quantify the major analyte component in a sample, while impurity methods detect and quantify low-level components that may affect product quality, safety, or efficacy. The table below summarizes the key validation parameters and their relative importance for each method type:
| Validation Parameter | Assay Methods | Impurity Methods |
|---|---|---|
| Accuracy | High importance | High importance |
| Precision | High importance | High importance |
| Specificity | Medium importance | Critical importance |
| Linearity & Range | 80-120% of target concentration | 50-120% of specification level |
| Quantitation Limit | Not typically required | Critical parameter |
| Detection Limit | Not typically required | Critical parameter |
| Robustness | Medium importance | High importance |
This differential emphasis stems from the distinct technical challenges each method addresses. Impurity methods demand exceptional specificity and sensitivity to reliably separate, detect, and quantify minor components that may be structurally similar to the main analyte. In contrast, assay methods prioritize accuracy and precision in quantifying the primary active component, typically at substantially higher concentration levels.
Experimental Protocols for Method Validation
Plate Uniformity and Signal Variability Assessment
For High-Throughput Screening (HTS) assays, a plate uniformity study is essential to validate assay performance. This assessment evaluates signal consistency across the entire microtiter plate and determines the assay window's suitability for detecting active compounds. The protocol requires testing over multiple days (3 days for new assays, 2 days for transferred assays) using the DMSO concentration intended for screening [90].
The experiment measures three critical signal types [90]:
- "Max" signal: The maximum system response.
- "Min" signal: The background or minimum system response.
- "Mid" signal: The intermediate response, typically using an EC50 or IC50 concentration of a reference compound.
Two plate formats are recommended [90]:
- Interleaved-Signal Format: All signals ("Max", "Min", "Mid") are distributed across each plate in a predefined pattern. This design uses fewer plates and is statistically robust for detecting spatial biases.
- Concentration-Response Curve (CRC) Format: Closely mimics the production assay process, often including a reference compound tested at multiple concentrations alongside control wells.
Reagent Stability and Robustness Testing
Comprehensive reagent stability studies form the foundation of reliable method validation. These studies ensure that reagents perform consistently throughout their intended use period. The experimental protocol includes [90]:
- Storage Stability: Testing reagent activity after storage under proposed conditions.
- Freeze-Thaw Stability: Assessing stability after multiple freeze-thaw cycles if applicable.
- In-Assay Stability: Determining reagent stability during daily operations, including using daily leftover reagents.
- DMSO Compatibility: Testing the assay's tolerance to DMSO concentrations spanning expected levels (typically 0-10%), with a recommendation to keep final concentrations under 1% for cell-based assays unless specifically validated.
The Lifecycle Approach: Continued Process Verification
With the adoption of the process validation life cycle, ongoing/continued process verification has become a crucial element for maintaining validation status. As European GMP inspector Dr. Franz Schönfeld emphasizes, "Your validation is only as good as your last batch" [89]. This phase involves continuous monitoring to detect anomalies during commercial manufacturing that might affect product quality.
Key elements of an effective continued process verification program include [89]:
- An approved plan describing the process scope, verification frequency, and methods.
- Use of statistical tools for trend analysis and data evaluation.
- Rolling reviews to identify trends and assess control status.
- Regular verification reports that determine if a process remains in a controlled state.
This approach is particularly valuable for detecting subtle changes that might otherwise go unnoticed, such as personnel changes, equipment maintenance impacts, gradual trends in analytical results, or regulatory changes [89].
Visualizing the Validation Lifecycle
The following diagram illustrates the integrated nature of the validation lifecycle, incorporating the PDAC (Plan-Do-Check-Act) cycle and ongoing verification elements:
Validation Lifecycle with Continued Process Verification
Experimental Workflow for Assay Validation
The experimental workflow for validating a new High-Throughput Screening (HTS) assay follows a structured approach to ensure robust performance:
HTS Assay Validation Workflow
The Scientist's Toolkit: Essential Research Reagent Solutions
Successful method validation and continuous verification depend on properly characterized reagents and materials. The following table details essential research reagent solutions and their functions in validation studies:
| Reagent/Material | Function in Validation | Critical Characterization Parameters |
|---|---|---|
| Reference Standards | Quantification of analytes and impurities | Purity, storage stability, solution stability |
| Critical Biological Reagents | Target engagement (enzymes, receptors, cells) | Binding affinity, functional activity, freeze-thaw stability |
| Detection Reagents | Signal generation and measurement | Specificity, dynamic range, signal-to-background ratio |
| Solvents & Buffers | Reaction medium maintenance | pH stability, osmolality, DMSO tolerance |
| Positive/Negative Controls | System suitability monitoring | Consistent response, stability, defined acceptance criteria |
Proper management of these reagents requires establishing stability profiles under both storage and assay conditions, defining acceptable freeze-thaw cycles for sensitive reagents, and implementing procedures for qualifying new reagent lots through bridging studies [90].
Effective lifecycle management from validation through post-approval changes to continuous verification represents a fundamental shift in pharmaceutical quality systems. While assay and impurity methods require different validation approaches, both benefit from a comprehensive lifecycle strategy that incorporates ongoing verification as a means of maintaining validated status. The experimental protocols and comparative data presented provide a framework for implementing these principles, emphasizing the importance of robust initial validation coupled with continuous monitoring to ensure sustained method and process performance throughout the product lifecycle.
In pharmaceutical development, analytical methods are not static; they must evolve with changing equipment, processes, and regulations [91]. Revalidation confirms that a previously validated analytical method continues to perform reliably after changes in conditions, ensuring it remains accurate, precise, specific, and robust [91]. This process is particularly critical when framed within validation requirements for assay versus impurity methods research, as these method categories face distinct technical challenges and regulatory scrutiny.
For assay methods, the primary focus is accurately quantifying the major component, while impurity methods must reliably detect and measure trace components often at very low concentration levels [92]. The revalidation strategies for these method types consequently differ in their parameter emphasis and acceptance criteria. Within the validation lifecycle, revalidation serves as a crucial mechanism for maintaining data integrity across the entire product lifecycle, ensuring continued compliance with regulatory guidelines from agencies like the FDA and EMA, and safeguarding product quality and patient safety [91] [92].
When to Revalidate: Triggers and Regulatory Framework
Revalidation is not required routinely but is triggered by specific changes or events that could potentially compromise method performance [91] [93]. Understanding these triggers is essential for maintaining regulatory compliance and ensuring data reliability.
Categorizing Revalidation Triggers
Revalidation activities can be broadly categorized into three main types, each with distinct drivers and requirements:
- Periodic Revalidation: Conducted at scheduled intervals (e.g., every 1-3 years) to confirm that no unintended changes or degradation have occurred over time, even in the absence of significant changes [94] [93].
- Change-Control Revalidation: Triggered by planned changes in process, equipment, raw materials, or software that could impact product quality or method performance [93].
- Deviation-Based Revalidation: Initiated after a deviation, out-of-specification (OOS) result, or failure that may indicate a loss of process control or method performance [93].
Specific Triggers for Analytical Method Revalidation
Multiple specific scenarios necessitate revalidation of analytical methods. The most common triggers include:
- Changes in Analytical Method: Modifications in sample preparation, adjustments in chromatographic conditions (e.g., column, mobile phase), or changes to detection wavelength or instrument settings [91].
- Change in Equipment: New analytical instruments, software upgrades affecting data processing, or use of different column or detector types [91].
- Change in Sample Composition or Matrix: Reformulation of drug product, new source or supplier of raw materials, or different dosage forms [91].
- Transfer of Method: Method transferred to a new laboratory or site, or outsourcing of testing to a contract lab [91].
- Out-of-Specification (OOS) or Trending Issues: Unexplained OOS results, deviation in system suitability criteria, or inconsistent trends in analytical data [91].
- Regulatory or Periodic Review: Regulatory audits or inspections, product lifecycle reviews, or data trending revealing method performance drift [91].
The following decision pathway illustrates the logical relationship between revalidation triggers and appropriate responses:
Regulatory Evolution: From Fixed Intervals to Lifecycle Approach
Regulatory perspectives on revalidation have evolved significantly. While traditional approaches often mandated fixed periodic revalidation intervals, modern regulatory thinking, as reflected in the FDA Process Validation Guidance, emphasizes a lifecycle approach with continued process verification potentially reducing the reliance on strict periodic revalidation when robust continuous monitoring and change control systems are in place [94] [95]. However, this approach requires comprehensive data collection and analysis to demonstrate maintained method validity.
How to Revalidate: Strategic Approaches and Experimental Design
The revalidation process requires a structured, scientifically rigorous approach that aligns with the scope and impact of the triggering event. The extent of revalidation—whether full or partial—should be determined through systematic risk assessment.
Determining Revalidation Scope: Risk-Based Approach
Not all changes require full revalidation; a risk-based assessment should be performed to determine the impact of the change on method performance [91] [96]. The risk assessment evaluates factors such as the criticality of the method, the extent of the change, historical method performance data, and the potential impact on product quality or patient safety [97]. For minor changes that demonstrably do not affect method performance, revalidation may not be necessary, though proper documentation and justification remain essential [91].
Revalidation Protocol and Parameters
Revalidation generally follows the same principles as initial method validation but with a focused scope based on the specific change or trigger [91]. The typical revalidation process includes these key stages:
- Risk Assessment: Evaluate the impact of change on method performance [91] [97].
- Define Scope: Identify which validation parameters need to be reassessed [91].
- Prepare Protocol: Develop a detailed revalidation protocol [91] [97].
- Perform Experiments: Conduct the necessary validation studies [91].
- Analyze & Document: Compare results against predefined acceptance criteria [91].
- Report Results: Prepare a revalidation report with conclusions and recommendations [91].
- Regulatory Compliance: Update relevant regulatory filings or internal documents if required [91].
The specific validation parameters requiring evaluation depend on the nature of the change and the method's intended use. The table below summarizes key validation parameters and their relevance in different revalidation scenarios:
Table: Analytical Validation Parameters for Revalidation
| Validation Parameter | Definition | Relevance in Assay Methods | Relevance in Impurity Methods | Common Revalidation Triggers |
|---|---|---|---|---|
| Accuracy | How close results are to true values [92] | Critical for major component quantification | Essential for impurity quantification | Change in sample matrix, equipment |
| Precision | Consistency of measurements [92] | Essential for repeatability of results | Critical for reproducibility at low levels | Method transfer, instrument change |
| Specificity | Ability to measure only analyte without interference [92] | Important for separating from excipients | Crucial for separating impurities from each other and API | Column change, mobile phase modification |
| Detection Limit (DL) | Lowest concentration reliably detected [92] | Less critical for major component | Extremely critical for trace analysis | Detection system changes |
| Quantitation Limit (QL) | Lowest concentration reliably measured [92] | Not typically critical for assays | Essential for impurity reporting | Sample preparation changes |
| Linearity & Range | Response proportional to concentration across working range [92] | Important across specified range | Critical, especially at lower end | Method range extension, detector changes |
| Robustness | Capacity to remain unaffected by small parameter variations [91] | Important for method transfer | Critical for reliable impurity detection | Method transfer, column lot changes |
Experimental Design for Different Revalidation Scenarios
The experimental approach for revalidation varies significantly based on the type of change implemented. The following examples illustrate appropriate experimental designs for common revalidation scenarios:
Chromatographic System Changes
Changes to chromatographic systems represent frequent triggers for revalidation. The experimental design must address the specific parameters most likely to be affected:
Column Change (Packed to Capillary): This represents a major change requiring comprehensive revalidation [98]. Experimental protocols should assess resolution (potential elution order changes), sensitivity (LOD/LOQ), and system suitability [98]. For example, when switching from packed to capillary columns, researchers should conduct complete method revalidation including specificity, accuracy, precision, and linearity due to potential changes in retention time, resolution, increased sensitivity, and possible elution order changes [98].
Carrier Gas Change (Helium to Hydrogen): This significant change requires substantial revalidation [98]. Experiments should focus on resolution, retention time stability, sensitivity, and potential elution order changes [98]. Method robustness should be thoroughly evaluated under the new carrier gas conditions.
Makeup Gas Change (Helium to Nitrogen): This change typically requires limited revalidation focused on detection limit, quantitation limit, and linearity [98]. Experiments should verify that the change doesn't adversely affect sensitivity or linearity, particularly for impurity methods where detection capabilities are critical [98].
Sample Preparation and Matrix Changes
Modifications to sample composition or matrix require targeted revalidation experiments:
Sample Matrix Changes: When reformulating drug products or changing raw material sources, experimental designs should focus on specificity (potential interference), accuracy (through spike recovery studies), and precision [91] [99]. Recovery studies should compare method results against reference standards under both old and new matrix conditions [92].
Sample Preparation Modifications: Changes in extraction methods, filtration techniques, or dilution schemes require experiments assessing accuracy (through recovery studies at multiple concentration levels), precision (repeatability under modified preparation), and robustness (deliberate variations in preparation parameters) [91].
The following workflow diagrams the experimental approach for managing method changes:
Comparative Analysis: Revalidation for Assay vs. Impurity Methods
The revalidation approach differs significantly between assay methods (focused on quantifying the active pharmaceutical ingredient) and impurity methods (focused on identifying and quantifying trace components). Understanding these distinctions is crucial for efficient resource allocation and regulatory compliance.
Key Distinctions in Revalidation Requirements
Assay and impurity methods have fundamentally different analytical targets and acceptance criteria, leading to varied emphasis during revalidation:
- Parameter Criticality: For assay methods, accuracy and precision for the major component are paramount, while impurity methods place greater emphasis on detection limit, quantitation limit, and specificity for trace components [92].
- Acceptance Criteria: Assay methods typically have tighter acceptance criteria for accuracy and precision (often ≤2% for finished products) compared to impurity methods (which may accept ≤5% for raw materials or higher variability at trace levels) [92].
- Impact of Changes: Chromatographic modifications often affect impurity methods more significantly due to their reliance on precise separation at low levels [98]. For example, a carrier gas change that minimally affects assay quantification might dramatically impact impurity detection capabilities.
- System Suitability Requirements: Impurity methods generally require more rigorous system suitability testing with specific resolution and sensitivity criteria between closely-eluting impurities and the main peak [91].
Experimental Data Comparison
The table below summarizes experimental data from representative revalidation studies, highlighting the differential impact of changes on assay versus impurity methods:
Table: Comparative Revalidation Data for Assay vs. Impurity Methods
| Change Type | Parameter | Assay Method Impact | Impurity Method Impact | Regulatory Assessment |
|---|---|---|---|---|
| Column Change (Packed to Capillary) [98] | Resolution | Moderate (≥2.0) | Severe (may require complete revalidation) | Full revalidation typically required |
| Sensitivity | Minimal change | Significant (LOD/LOQ may improve) | Requires demonstration | |
| Elution Order | Typically unchanged | Potential for critical changes | Must be reestablished | |
| Carrier Gas Switch (He to H₂) [98] | Retention Time | Moderate shift (±10%) | Significant shift (±15-20%) | Requires system suitability verification |
| Linearity | R² ≥0.998 (similar) | R² ≥0.995 (may be affected) | Partial revalidation | |
| Precision | RSD ≤1.5% (maintained) | RSD ≤5.0% (may be affected at low levels) | Requires demonstration | |
| Sample Prep Change | Recovery | 98-102% (tight range) | 90-110% (wider range acceptable for traces) | Accuracy demonstration required |
| Precision | RSD ≤2.0% | RSD ≤10.0% at QL | Method capability assessment | |
| Detection Wavelength Change | Sensitivity | Minimal impact if adjusted properly | Major impact on S/N for impurities | Requires LOD/LOQ reestablishment |
Regulatory Emphasis and Documentation
Regulatory expectations for revalidation documentation remain consistent between method types, but the technical focus differs:
- Assay Methods: Documentation should emphasize accuracy and precision for the active ingredient, particularly following changes to instrumentation or sample preparation [92]. The linkage between method performance and dosage form uniformity is particularly scrutinized.
- Impurity Methods: Documentation must thoroughly demonstrate specificity and sensitivity, especially after chromatographic modifications [92]. The ability to separate and quantify all potentially relevant impurities must be maintained or improved.
- Change Justification: All revalidation activities require scientific rationale linking the change to the parameters selected for revalidation [91] [95]. The FDA has criticized "blind reliance" on existing methods without demonstrated continued capability [95].
Essential Research Reagent Solutions for Revalidation Studies
Revalidation studies require specific reagents and materials to ensure comprehensive assessment of method performance. The following table details key research reagent solutions and their functions in revalidation experiments:
Table: Essential Research Reagent Solutions for Revalidation Studies
| Reagent/Material | Function in Revalidation | Application Examples | Critical Quality Attributes |
|---|---|---|---|
| Reference Standards | Accuracy determination through recovery studies [92] | Spike recovery experiments, calibration curve verification | Certified purity, stability, proper storage conditions |
| System Suitability Mixtures | Verify chromatographic performance pre- and post-change [91] | Resolution testing, retention time reproducibility, peak symmetry | Stability, representative of actual sample components |
| Forced Degradation Samples | Establish specificity under changed conditions [92] | Demonstrate separation of degradants from analytes | Controlled degradation conditions, well-characterized profiles |
| Placebo/Blank Matrix | Assess interference and specificity [92] | Blank injection analysis, selectivity verification | Representative composition, analyte-free |
| Quality Control Samples | Evaluate precision and accuracy [92] | Intermediate precision studies, analyst-to-analyst variation | Known concentration, stability throughout study duration |
Revalidation represents more than just a regulatory requirement—it is a fundamental scientific practice that ensures analytical methods remain fit-for-purpose throughout their lifecycle [91]. The strategic approach to revalidation must balance regulatory compliance with scientific efficiency, focusing resources on the most critical parameters affected by specific changes.
For researchers managing both assay and impurity methods, understanding the distinct revalidation requirements for each method type is essential. While assay methods demand unwavering accuracy and precision for major component quantification, impurity methods require exceptional sensitivity and specificity for trace analysis. These fundamental differences dictate unique revalidation strategies, experimental designs, and acceptance criteria for each method category.
In today's evolving regulatory landscape, where continuous verification may supplement traditional periodic revalidation, pharmaceutical scientists must maintain rigorous assessment of method performance [94] [95]. By implementing risk-based revalidation strategies tailored to specific method types and changes, organizations can ensure ongoing method reliability while optimizing resource utilization—ultimately protecting product quality and patient safety through scientifically-defensible analytical practices.
In the pharmaceutical and biologics development landscape, robust documentation and protocols are the bedrock of product quality, regulatory compliance, and ultimately, patient safety. The foundation of any reliable analytical procedure lies in its validation, a process that provides documented evidence that the method is consistently capable of delivering accurate and precise results for its intended purpose. This guide objectively compares the validation approaches and performance characteristics for two fundamental categories of analytical methods: potency assays and impurity methods.
The validation requirements for these methods are not uniform; they are dictated by the specific role each method plays in the quality control strategy. Potency assays, which measure the biological activity of a drug product, are inherently variable due to their reliance on complex biological systems. In contrast, impurity methods, which quantify unwanted chemical entities, are typically expected to exhibit greater precision as they often employ more stable physicochemical techniques. Framing content within this context of comparative validation requirements is essential for researchers, scientists, and drug development professionals who must design protocols that ensure both consistency in daily operations and readiness for rigorous regulatory audits. The subsequent sections will provide a detailed comparison, supported by experimental data and standardized protocols, to guide these critical activities.
Comparative Analysis: Assay vs. Impurity Methods
The core distinction in validation strategy arises from the different nature and purpose of potency assays versus impurity methods. The table below summarizes the key performance characteristics and their typical validation targets for each method category.
Table 1: Comparison of Key Validation Characteristics for Potency and Impurity Methods
| Validation Characteristic | Potency Assays (Bioassays) | Impurity Methods (e.g., LC-MS/MS) |
|---|---|---|
| Primary Purpose | Quantify biological activity (% Relative Potency) | Identify and quantify unwanted chemical entities |
| Typical Variability | Higher (due to biological systems) [100] | Lower (physicochemical techniques) |
| Key Performance Metrics | Z' factor (preferred for screening) [101], precision (run-to-run variability) | Selectivity, accuracy, limit of detection (LOD), limit of quantification (LOQ) |
| Data Analysis Focus | Parallelism, relative potency, non-linear regression (e.g., 4PL), control of system suitability criteria [100] | Linear regression, signal-to-noise ratios, specificity against the main analyte |
| System Suitability | Critical for run validity; includes parallelism testing [100] | Confirms instrument performance before sample analysis |
This dichotomy in performance expectations directly influences experimental design. For potency assays, the comparison of methods experiment is critical for assessing systematic error, where a new method is compared against a reference method using a minimum of 40 different patient specimens to cover the entire working range [54]. For impurity methods, the focus shifts toward demonstrating the method's ability to detect and accurately quantify trace-level analytes amidst the main component, often requiring robust LC-MS/MS techniques to achieve the necessary sensitivity and selectivity [102].
Experimental Protocols for Key Validation Activities
Protocol for Potency Assay Comparison Study
The following protocol outlines the key steps for conducting a comparison of methods experiment, which is fundamental for validating a new potency assay against a established comparative method [54].
Table 2: Key Research Reagent Solutions for Potency Assay Comparison
| Reagent/Material | Function |
|---|---|
| Reference Standard (RS) | A well-characterized drug lot of known potency; serves as the benchmark for calculating Relative Potency (%RP) [100]. |
| Test Samples | Patient specimens selected to cover the entire analytical range and represent the spectrum of expected diseases. |
| Cell Lines / Biological Reagents | Essential for functional bioassays (e.g., reporter gene assays); their viability and responsiveness are critical for system suitability [100]. |
| Assay Control | A well-characterized material of known potency used to validate each assay run against predefined acceptance criteria [100]. |
Experimental Design:
- Specimen Selection: A minimum of 40 patient specimens should be tested. The quality of specimens, covering a wide analytical range, is more critical than a very large number [54].
- Replication: Analyze each specimen singly by both the test and comparative methods. While duplicates are advantageous for identifying errors, single measurements are common practice [54].
- Timeframe: Conduct the study over a minimum of 5 different days to account for inter-day variability and ensure robustness [54].
Procedure:
- Analyze test samples and the reference standard using both the test and comparative methods. The experimental design often involves multiple dilution series within a single run to improve the precision of the model fit [100].
- For each valid run, derive a % Relative Potency (%RP) value by performing a pairwise comparison of the dose-response curves of the test sample and the reference standard, typically using a model like the 4-parameter logistic (4PL) fit [100].
- The assay run is considered valid only if all system suitability criteria and test sample acceptance criteria (including parallelism testing) are met [100].
Data Analysis:
- Graphical Inspection: Create a difference plot (test result minus comparative result vs. comparative result) to visually identify discrepant results and potential systematic errors [54].
- Statistical Calculation: For data covering a wide range, use linear regression analysis to calculate the slope, y-intercept, and standard error of the estimate (s~y/x~). The systematic error (SE) at a critical medical decision concentration (X~c~) is calculated as:
Yc = a + bXcfollowed bySE = Yc - Xc[54]. - Performance Assessment: The Z' factor is a recommended measure for assessing the performance of screening assays, as it takes into account both the dynamic range of the assay and the data variation [101].
Protocol for Impurity Method Validation (LC-MS/MS)
This protocol provides a framework for validating a selective impurity method, such as the quantification of nitrosamine impurities in a drug substance using advanced LC-MS/MS [102].
Method Setup:
- Chromatography: Optimize the liquid chromatography (LC) conditions to achieve baseline separation of the impurity peaks from the main drug component and from each other.
- Mass Spectrometry: Utilize multiple reaction monitoring (MRM) mode on the triple quadrupole mass spectrometer for highly selective and sensitive detection.
Validation Procedure:
- Specificity: Demonstrate that the method can unequivocally quantify the impurity in the presence of other components, such as the drug substance, excipients, and degradation products.
- Linearity and Range: Prepare and analyze impurity standards at a minimum of five concentration levels across the specified range. The method should demonstrate a linear response with a correlation coefficient (r) of >0.99.
- Accuracy (Recovery): Spike known amounts of the impurity into the drug substance matrix at multiple levels (e.g., 50%, 100%, 150% of the specification level) and calculate the percentage recovery.
- Precision: Determine repeatability (intra-day precision) by analyzing multiple replicates at 100% of the specification level. Intermediate precision (inter-day, different analyst) should also be assessed.
- Limit of Detection (LOD) and Quantification (LOQ): Establish LOD and LOQ based on signal-to-noise ratios (typically 3:1 for LOD and 10:1 for LOQ) or using statistical methods.
Diagram 1: Impurity Method Validation Workflow.
Performance Data and Comparison
The quantitative performance of these methods differs significantly, as reflected in their respective validation data and acceptance criteria.
Table 3: Quantitative Performance Data Comparison
| Performance Measure | Potency Assay (Cell-Based) | Impurity Method (LC-MS/MS) |
|---|---|---|
| Precision (Repeatability) | Higher variability; RSD often >10% | Tight variability; RSD typically <5% |
| Reportable Result | Often the average of multiple runs (e.g., 2-3) to reduce variability impact on the Out-of-Specification (OOS) rate [100] | Typically a single determination or average of replicates from a single run |
| Data Model | Non-linear (4PL) for Relative Potency [100] | Linear regression for quantification |
| Key Figure of Merit | Z' factor > 0.5 indicates a robust assay [101] | Signal-to-Noise > 10 for LOQ |
The difference in precision directly impacts how a "reportable result" is derived. For potency assays, a single value is often insufficient. The reportable value is frequently an average of %RP values from multiple, independent assay runs (e.g., two or three) to reduce the impact of individual run variability on the final result and to control the probability of an OOS result [100]. This practice is less common for impurity methods, where the high precision often allows the result from a single valid run to be used directly.
Diagram 2: Potency Assay Result Reporting Pathway.
Documentation for Audit-Readiness
Maintaining audit-ready documentation requires a systematic approach that spans the entire method lifecycle. Key documents should be meticulously managed and readily available.
- Method Development Report: Documents the Analytical Quality by Design (AQbD) approach, including risk assessments and design of experiments (DoE) used to optimize method parameters [100].
- Validation Protocol and Report: The protocol pre-defines all acceptance criteria. The report provides raw data, statistical analysis, and a definitive conclusion on each validation characteristic.
- Standard Operating Procedure (SOP): The detailed, step-by-step instruction for executing the method, including precise preparation of reagents, system suitability checks, and data processing rules [100].
- Specification Document: Defines the acceptance criteria for the product quality attribute (e.g., potency between 70%-130% RP; impurity not more than 0.1%).
- Change Control Records: Documents any deviations from or modifications to the validated method, with justification and data supporting the continued validity of the method.
For potency assays, specific documentation such as parallelism testing results and the rationale for the number of runs used for the reportable value is critical [100]. For all methods, a clear data trail from the raw output (e.g., chromatograms, plate reader data) through processed results to the final reportable value is non-negotiable for a successful audit.
Conclusion
The successful validation of analytical methods is not a one-time event but a science-driven, risk-managed lifecycle. A clear understanding of the distinct requirements for assay and impurity methods is fundamental to this process. Assay methods demand high accuracy and precision for potency determination, while impurity methods require exceptional specificity and sensitivity to ensure patient safety. By adopting the modern principles of ICH Q2(R2) and Q14—starting with a well-defined ATP and implementing a proactive lifecycle management strategy—scientists can develop robust, compliant methods. This rigorous approach is crucial for navigating complex challenges, such as nitrosamine analysis, and ultimately guarantees the quality, safety, and efficacy of pharmaceutical products for patients worldwide.
References
- 1. Performance parameters for analytical method validation [https://www.sciencedirect.com/science/article/pii/S0165993620301424]
- 2. Analytical Method Validation: Back to Basics, Part II [https://www.chromatographyonline.com/view/analytical-method-validation-back-basics-part-ii]
- 3. Guidelines for Method Validation for Impurity Methods [https://www.linkedin.com/pulse/guidelines-method-validation-impurity-methods-biju-alex]
- 4. Performance Characteristics In Analytical Method Validation [https://gmpinsiders.com/performance-characteristics-method-validation/]
- 5. ICH and FDA Guidelines for Analytical Method Validation [https://www.labmanager.com/ich-and-fda-guidelines-for-analytical-method-validation-34252]
- 6. Q2(R2) Validation of Analytical Procedures March 2024 [https://www.fda.gov/regulatory-information/search-fda-guidance-documents/q2r2-validation-analytical-procedures]
- 7. ICH Q2 and ICH Q14 revisions clarify analytical methods ... [https://www.pharmalex.com/thought-leadership/blogs/ich-q2-and-ich-q14-revisions-clarify-analytical-methods-for-biologics/]
- 8. Assay Development and Method Validation Essentials [https://www.biopharminternational.com/view/assay-development-and-method-validation-essentials]
- 9. Ensuring GLP potency and purity [https://www.pharmko.com/blog/ensuring-glp-potency-and-purity]
- 10. What Is Difference Between Potency and Purity in ... [https://pharmaguru.co/what-is-difference-between-potency-and-purity/]
- 11. CDER Nitrosamine Impurity Acceptable Intake Limits [https://www.fda.gov/regulatory-information/search-fda-guidance-documents/cder-nitrosamine-impurity-acceptable-intake-limits]
- 12. Current Good Manufacturing Practice (CGMP) Regulations [https://www.fda.gov/drugs/pharmaceutical-quality-resources/current-good-manufacturing-practice-cgmp-regulations]
- 13. Potency Assays: Development & Regulatory ... [https://abzena.com/articles/blog/potency-assays-development-regulatory-considerations/]
- 14. Understanding the Lifecycle Approach for Analytical ... [https://www.chromatographyonline.com/view/understanding-lifecycle-approach-analytical-procedures]
- 15. 2025 Trends In Pharmaceutical Analytical Methods ... [https://agnopharma.com/blog/trends-in-pharmaceutical-analytical-methods-development-validation/]
- 16. Red analytical performance index (RAPI) and software [https://pubs.rsc.org/en/content/articlehtml/2025/gc/d4gc05298f]
- 17. The Red Component of Analytical Chemistry: Assessing ... [https://www.chromatographyonline.com/view/the-red-component-of-analytical-chemistry-assessing-the-performance-of-analytical-methods]
- 18. Validation of new methods [https://www.sciencedirect.com/science/article/pii/S0379073806003239]
- 19. Model and Assay Validation and Acceptance - NCBI - NIH [https://www.ncbi.nlm.nih.gov/books/NBK424977/]
- 20. A step by step guide to quantitative comparisons in ... [https://finbiosoft.com/a-step-by-step-guide-to-quantitative-comparisons-in-validation-manager/]
- 21. Draft guidance on how to interpret 'significant change' of a ... [https://www.canada.ca/en/health-canada/services/drugs-health-products/medical-devices/application-information/guidance-documents/interpret-significant-change-medical-device/general-principles.html]
- 22. The Importance of Change Management in Validated ... [https://www.nnit.com/insights/articles/importance-change-management-validated-systems]
- 23. Applying ICH Q14 in Pharmaceuticals Part 1 [https://premier-research.com/perspectives/applying-ich-q14-in-pharmaceuticals-part-1-the-application-of-analytical-target-profile-in-analytical-method-development/]
- 24. Are Your Methods Fit for Purpose? [https://www.lachmanconsultants.com/2024/10/are-your-methods-fit-for-purpose/]
- 25. ICH Q2(R2) Validation of analytical procedures [https://www.ema.europa.eu/en/ich-q2r2-validation-analytical-procedures-scientific-guideline]
- 26. HPLC 2025 Day 1: Automating The Analytical Laboratory [https://www.chromatographyonline.com/view/hplc-2025-day-1-automation]
- 27. A New Era for Analytical Procedure Lifecycle Management [https://synergbiopharma.com/navigating-analytical-method-comparability-and-equivalency-under-ich-q14-a-new-era-for-analytical-procedure-lifecycle-management/]
- 28. Method Validation vs Method Verification: Which is Better ... [https://www.labmanager.com/method-validation-vs-method-verification-which-is-better-for-use-in-laboratories-33982]
- 29. Introduction to Analytical Method Development and ... [https://www.labmanager.com/introduction-to-analytical-method-development-and-validation-33922]
- 30. A Review: Comparison of ICH Guidelines on Analytical ... [https://www.linkedin.com/pulse/review-comparison-ich-guidelines-analytical-method-usp-shaikh-wzfjc]
- 31. ICH Guidelines for Analytical Method Validation Explained [https://amsbiopharma.com/ich-guidelines-analytical-method/]
- 32. The 6 Key Aspects of Analytical Method Validation [https://www.elementlabsolutions.com/uk/chromatography-blog/post/6-key-aspects-of-analytical-method-validation]
- 33. Why is Biomarker Assay Validation Different from that of ... [https://link.springer.com/article/10.1208/s12248-025-01135-5]
- 34. Validation of Analytical Methods: A Review [https://www.gavinpublishers.com/article/view/validation-of-analytical-methods-a-review]
- 35. Validation [http://www.chromforum.org/viewtopic.php?t=1342]
- 36. Method Validation Essentials, Limit of Blank, Limit of Detection, and Limit of Quantitation | BioPharm International [https://www.biopharminternational.com/view/method-validation-essentials-limit-blank-limit-detection-and-limit-quantitation]
- 37. Limit of Blank, Limit of Detection and Limit of Quantitation - PMC [https://pmc.ncbi.nlm.nih.gov/articles/PMC2556583/]
- 38. What is meant by the limit of detection and quantification (LOD / LOQ)? [https://mpl.loesungsfabrik.de/en/english-blog/method-validation/limit-of-detection-quantifcation]
- 39. Comparison of Different Approaches for Calculating LOD ... [https://ps.tbzmed.ac.ir/Article/ps-40452]
- 40. Limit of Quantitation - an overview | ScienceDirect Topics [https://www.sciencedirect.com/topics/nursing-and-health-professions/limit-of-quantitation]
- 41. Comparison of approaches for assessing detection and ... [https://www.nature.com/articles/s41598-024-83474-5]
- 42. Validation of Stability-Indicating HPLC Methods for ... [https://www.chromatographyonline.com/view/validation-of-stability-indicating-hplc-methods-for-pharmaceuticals-overview-methodologies-and-case-studies]
- 43. Are You Sure You Understand USP <621>? [https://www.chromatographyonline.com/view/are-you-sure-you-understand-usp-621-]
- 44. method validation for low (assay) and high load (impurities) [http://www.chromforum.org/viewtopic.php?t=3782]
- 45. HPLC method development, validation, and impurity ... [https://pmc.ncbi.nlm.nih.gov/articles/PMC4828960/]
- 46. Overcoming HPLC Challenges for Impurity Identification [https://synthinkchemicals.com/challenges-in-hplc-method-development-for-impurity-identification/]
- 47. Development and Validation of a Stability-Indicating HPLC ... [https://pmc.ncbi.nlm.nih.gov/articles/PMC8605923/]
- 48. Development of a stability indicating high-performance liquid ... [https://bmcchem.biomedcentral.com/articles/10.1186/s13065-024-01177-4]
- 49. HPAPI Sourcing & Handling: What Tablet Manufacturers ... [https://www.linkedin.com/pulse/hpapi-sourcing-handling-what-tablet-manufacturers-need-mendpara-mpuuc]
- 50. Determination of assay, purity and impurities in a HPAPI for ... [https://www.sterlingpharmasolutions.com/knowledge-hub/technologies/hpapi/determination-of-assay-purity-and-impurities-in-a-hpapi/]
- 51. The rules on HPAPI containment in high potent ... [https://www.pharmaceutical-technology.com/sponsored/understanding-the-rules-on-hpapi-containment-in-high-potent-manufacturing/]
- 52. Understanding the HPAPI sector [https://pharmaceuticalmanufacturer.media/pharmaceutical-industry-insights/pharma-explained/understanding-the-hpapi-sector/]
- 53. Statistical analysis in method comparison studies part one [https://acutecaretesting.org/en/articles/statistical-analysis-in-method-comparison-studies-part-one]
- 54. The Comparison of Methods Experiment [https://www.westgard.com/lessons/basic-method-validation/lesson23.html]
- 55. HPLC Specificity Testing: Importance Explained [https://altabrisagroup.com/hplc-specificity-testing/]
- 56. Choices of chromatographic methods as stability indicating ... [https://pmc.ncbi.nlm.nih.gov/articles/PMC8027279/]
- 57. Real Solutions to Improve Your HPLC Peak Resolution [https://www.thermofisher.com/blog/analyteguru/real-solutions-to-improve-your-hplc-peak-resolution/]
- 58. Liquid Chromatographic Peak Purity Assessments in ... [https://www.chromatographyonline.com/view/liquid-chromatographic-peak-purity-assessments-in-forced-degradation-studies---an-industry-perspective]
- 59. Determination of Nitrosamine Drug Substance-Related ... [https://www.mdpi.com/1424-8247/18/11/1673]
- 60. Analytical Method Validation: Key Parameters for ... [https://www.linkedin.com/posts/tonmoy-sarker-tomal_analytical-method-validation-updates-2025-activity-7375894681567760384-8JR5]
- 61. A new RP-HPLC approach for estimation of potential ... [https://bmcpharmacoltoxicol.biomedcentral.com/articles/10.1186/s40360-025-00892-5]
- 62. Optimization and Validation of an HPLC Method ... [https://pmc.ncbi.nlm.nih.gov/articles/PMC12409534/]
- 63. WHY ANALYTICAL METHOD SHOULD BE ROBUST? [https://www.linkedin.com/pulse/why-analytical-method-should-robust-jairus-fernandes-mb7rf]
- 64. Robustness and Ruggedness Testing in Analytical Chemistry [https://www.labmanager.com/robustness-and-ruggedness-testing-in-analytical-chemistry-34247]
- 65. 2025 and Beyond: Another Look at Upcoming NDSRI ... [https://www.skpharmteco.com/news-insights/blog/2025-and-beyond-another-look-at-upcoming-ndsri-regulations/]
- 66. Robustness Tests [https://www.chromatographyonline.com/view/robustness-tests]
- 67. 10 Important Tips to Develop a Robust Test Method ... [https://app.scientist.com/blog/2025/05/22/10-important-tips-to-develop-a-robust-test-method-for-gmp-testing-of-biopharmaceuticals]
- 68. Robustness comparison of three statistical methods ... [https://link.springer.com/article/10.1007/s00769-025-01669-3]
- 69. Sample Preparation: A Comprehensive Guide [https://www.organomation.com/sample-preparation-a-comprehensive-guide]
- 70. Overview of Methods and Considerations for Handling ... [https://www.chromatographyonline.com/view/overview-methods-and-considerations-handling-complex-samples]
- 71. Sample preparation techniques in chromatography [https://www.thermofisher.com/us/en/home/industrial/chromatography/chromatography-learning-center/chromatography-consumables/sample-prep.html]
- 72. Solvent Extraction Techniques [https://www.organomation.com/solvent-extraction-techniques]
- 73. Sample Preparation Product Guide: Find Effective ... [https://www.restek.com/articles/sample-preparation-product-guide-find-effective-solutions-fast?srsltid=AfmBOooXey9SZSVKpAUlgjxTJh8P5XwZ5Lh1Qr7ojv1cI_EsDEt68TV6]
- 74. Methods for Purification of Commonly Used Solvents [https://www.alfa-chemistry.com/resources/methods-for-purification-of-commonly-used-solvents.htm]
- 75. UHPLC assay and impurity methods for diphenhydramine ... [https://pmc.ncbi.nlm.nih.gov/articles/PMC7029815/]
- 76. Development and Validation of four Nitrosamine Impurities ... [https://pmc.ncbi.nlm.nih.gov/articles/PMC8653666/]
- 77. Performance Characteristics of Mass Spectrometry-Based ... [https://www.sciencedirect.com/science/article/pii/S0022354923002988]
- 78. Applying Multi-Impurity Assay Based on Monolinear ... [https://papers.ssrn.com/sol3/papers.cfm?abstract_id=4600133]
- 79. Points to Consider in Quality Control Method Validation ... [https://www.bioprocessintl.com/qa-qc/points-to-consider-in-quality-control-method-validation-and-transfer]
- 80. Comparing Method Validation Guidelines: What You Need ... [https://www.linkedin.com/pulse/comparing-method-validation-guidelines-what-you-need-know-pharcell-z5zrf]
- 81. A Practical Guide to Immunoassay Method Validation - PMC [https://pmc.ncbi.nlm.nih.gov/articles/PMC4541289/]
- 82. ICH Q14: Analytical Procedure Lifecycle Management - BioQC [https://bio-qc.com/ich-q14-guideline-overview-for-analytical-procedure-lifecycle-management/]
- 83. Applying ICH Q14 in Pharmaceuticals Part 2: The Benefits ... [https://premier-research.com/perspectives/applying-ich-q14-in-pharmaceuticals-part-2-the-benefits-of-an-enhanced-approach-in-the-lifecycle-management-and-post-approval-changes-of-analytical-procedures/]
- 84. Challenges in Developing Analytical Procedures with the ... [https://www.pharmoutsourcing.com/Featured-Articles/621016-Challenges-in-Developing-Analytical-Procedures-with-the-New-ICH-Q14-Guideline/]
- 85. The Role of Enhanced Analytical Procedure Development ... [https://link.springer.com/article/10.1208/s12248-025-01037-6]
- 86. Control Strategy enabled by structured Knowledge [https://www.a3p.org/en/efficient-control-strategy/]
- 87. Highlights from FDA's Analytical Test Method Validation ... [https://www.propharmagroup.com/thought-leadership/fda-analytical-test-method-validation-guidance]
- 88. Bioanalytical method validation: An updated review - PMC [https://pmc.ncbi.nlm.nih.gov/articles/PMC3658022/]
- 89. Ongoing/Continued Process Verification - The Perspective ... [https://www.gmp-compliance.org/gmp-news/ongoing-continued-process-verification-the-perspective-of-an-european-gmp-inspector]
- 90. HTS Assay Validation - NCBI [https://www.ncbi.nlm.nih.gov/books/NBK83783/]
- 91. Revalidation of Analytical Method: What It Is, How & When ... [https://pharmaguru.co/revalidation-of-an-analytical-method/]
- 92. What Is FDA Method Validation Guidance and Its ... [https://altabrisagroup.com/fda-method-validation-guidance/]
- 93. Revalidation of Pharmaceutical Processes Explained [https://pharmuni.com/glossary/revalidation/]
- 94. Revalidation and Periodic Review in Pharmaceutical ... [https://www.linkedin.com/posts/mitesh-panchal-08899715_revalidation-and-periodic-review-revalidation-activity-7319969963740426240-MBGy]
- 95. Revalidation - the FDA Perspective [https://www.gmp-compliance.org/gmp-news/revalidation-the-fda-perspective]
- 96. Revalidation requirements: Medical device process ... [https://medicaldevicehq.com/articles/revalidation-requirements-medical-device-process-validation/]
- 97. The Vital Role of Periodic Cleaning Revalidation [https://pharmallies.com/ensuring-safety-and-compliance-the-vital-role-of-periodic-cleaning-revalidation/]
- 98. Method Revalidation? [http://www.chromforum.org/viewtopic.php?t=21682]
- 99. Revalidation of Pharmaceutical Processes [https://www.pharmaguideline.com/2014/07/revalidation-of-pharmaceutical-processes.html]
- 100. Potency Assay Variability Estimation in Practice - PMC [https://pmc.ncbi.nlm.nih.gov/articles/PMC11788244/]
- 101. Articles A Comparison of Assay Performance Measures in ... [https://www.sciencedirect.com/science/article/pii/S247255522208460X]
- 102. Advanced LC-MS/MS method for selective quantification of ... [https://www.sciencedirect.com/science/article/pii/S2666831925000190]