Beyond Trial and Error: A Systematic Approach to Optimization with Simplex and DoE vs. OFAT in Pharmaceutical Development
This article provides a comprehensive comparison of systematic optimization methods, such as the Simplex method and Design of Experiments (DoE), against the traditional One-Factor-at-a-Time (OFAT) approach.
Beyond Trial and Error: A Systematic Approach to Optimization with Simplex and DoE vs. OFAT in Pharmaceutical Development
Abstract
This article provides a comprehensive comparison of systematic optimization methods, such as the Simplex method and Design of Experiments (DoE), against the traditional One-Factor-at-a-Time (OFAT) approach. Tailored for researchers, scientists, and drug development professionals, it explores the foundational principles, practical applications, and comparative advantages of these methodologies. Readers will gain insights into how modern systematic approaches can efficiently identify critical factors, capture interaction effects, and lead to more robust, optimized processes in pharmaceutical development and biomedical research, ultimately saving time and resources while improving product quality.
From Traditional Guesswork to Systematic Search: Understanding OFAT and Modern Optimization Paradigms
In the rigorous fields of pharmaceutical development and scientific research, the path to process optimization is paved by structured experimentation. Two foundational methodologies dominate this landscape: the traditional One-Factor-at-a-Time (OFAT) approach and the systematic Design of Experiments (DOE). The core distinction between these contenders lies in their fundamental philosophy for probing complex systems. OFAT, a classical and widely taught method, investigates a process by varying a single factor while holding all others constant [1] [2]. In stark contrast, systematic DOE is a structured, statistically-driven methodology that deliberately varies multiple factors simultaneously according to a pre-defined experimental plan to efficiently uncover not just main effects, but also critical interaction effects between factors [1] [3]. This in-depth technical guide explores the core principles of these methodologies, framed within the context of simplex versus one-variable-at-a-time optimization research, providing researchers and drug development professionals with the knowledge to select the most powerful and efficient path to innovation.
Deconstructing the One-Factor-at-a-Time (OFAT) Approach
Core Principles and Historical Context
The OFAT approach, also known as the classical or hold-one-factor-constant method, is rooted in a straightforward, sequential process of inquiry [2]. Its procedure involves selecting a baseline set of conditions for all input factors, then systematically varying the level of one single factor across its range of interest while all other factors are kept rigidly static [2]. After the effect of that factor is observed and recorded, it is returned to its baseline level before the next factor is varied in the same manner. This cycle continues until all factors of interest have been tested independently [2].
Historically, OFAT gained popularity due to its intuitive simplicity and ease of implementation, requiring no complex experimental designs or advanced statistical analysis [2]. It was a practical choice in the early stages of scientific exploration, particularly when experiments were conducted manually and resource constraints were a primary concern. This method allowed researchers to isolate the effect of individual variables without the computational burden of multivariate analysis.
Inherent Limitations and Drawbacks
Despite its historical prevalence, the OFAT method carries severe limitations that render it unsuitable for optimizing complex processes, especially in pharmaceutical development where factor interactions are the rule, not the exception.
- Failure to Capture Interaction Effects: OFAT's most critical flaw is its inherent assumption that factors do not interact. It is incapable of detecting or quantifying synergistic or antagonistic effects between factors, which can lead to profoundly misleading conclusions and a failure to identify true optimal conditions [2]. For instance, the ideal level of an excipient in a formulation might depend entirely on the specific level of a binder used, a relationship completely invisible to an OFAT study.
- Inefficient Resource Utilization: Although seemingly simple, OFAT experiments require a large number of experimental runs to explore the same factor space, leading to an inefficient use of time, materials, and financial resources [1] [2].
- Lack of Optimization Capabilities: The method is primarily focused on understanding individual effects and is not a systematic tool for response optimization. It cannot reliably identify a robust optimum or a design space, as required by modern quality frameworks like Quality by Design (QbD) [2].
- Increased Risk of Misleading Results: By failing to account for interactions and exploring the experimental space along a single path, OFAT increases the risk of both Type I and Type II errors, potentially guiding development down an incorrect or suboptimal path [2].
The Systematic Approach: Design of Experiments (DOE)
Foundational Principles and Philosophical Shift
Design of Experiments (DOE) represents a paradigm shift from OFAT, moving from a sequential, isolated approach to a holistic, systems-based one. DOE is a structured and statistical methodology for simultaneously investigating the effects of multiple input factors on one or more output responses [3]. Its power lies in its ability to efficiently map a process's behavior across the entire experimental region. The methodology is built upon three bedrock statistical principles that ensure the validity and reliability of its findings:
- Randomization: The order of experimental runs is randomized to minimize the impact of lurking variables and systematic biases, thereby enhancing the generalizability of the results [2].
- Replication: Repeating experimental runs under identical conditions allows for the estimation of experimental error, which is essential for assessing the statistical significance of the observed effects [2].
- Blocking: This technique accounts for known sources of nuisance variability (e.g., different batches of raw material, different operators) by grouping experiments into homogenous blocks, thus improving the precision of effect estimation [2].
Key Methodologies in Systematic DOE
Systematic DOE encompasses a family of powerful design strategies, each tailored to specific experimental objectives.
Factorial Designs
Factorial designs form the cornerstone of DOE. In a full factorial design, all possible combinations of the levels of all factors are investigated [2]. For example, a 2-level, 3-factor design (2³) requires 8 experimental runs. This comprehensiveness allows for the unbiased estimation of all main effects and all interaction effects. The analysis is typically performed using Analysis of Variance (ANOVA), a statistical technique that partitions the total variability in the data into components attributable to each main effect, interaction effect, and experimental error, allowing for formal hypothesis testing [2].
Response Surface Methodology (RSM)
When the objective is to optimize a process or product formulation, Response Surface Methodology (RSM) is the tool of choice. RSM uses designed experiments to fit a polynomial model (often a quadratic model) to the experimental data, which can then be used to navigate the design space and locate optimal factor settings [2]. Two common RSM designs are:
- Central Composite Designs (CCD): These consist of a factorial or fractional factorial core, augmented with axial points to estimate curvature and center points to estimate pure error [2].
- Box-Behnken Designs: An alternative to CCDs that are often more efficient, as they use fewer runs for a three-level design by combining two-level factorial blocks [4] [2].
Comparative Analysis: OFAT vs. Systematic DOE
The following tables provide a structured, quantitative and qualitative comparison of the OFAT and systematic DOE approaches, summarizing their core characteristics and performance.
Table 1: Direct Comparison of OFAT and Systematic DOE Characteristics
| Characteristic | OFAT Approach | Systematic DOE Approach |
|---|---|---|
| Experimental Structure | Sequential, one variable varied per experiment | Simultaneous, multiple variables varied per experiment |
| Coverage of Experimental Space | Limited, explores along a single path [1] | Systematic and thorough [1] |
| Ability to Detect Interactions | Fails to identify interactions [1] [2] | Explicitly identifies and quantifies all interactions [2] |
| Resource Efficiency | Inefficient use of resources [1] | Establishes solution with minimal resource [1] |
| Statistical Foundation | Weak, no estimation of experimental error | Strong, built on randomization, replication, and blocking [2] |
| Optimization Capability | May miss the optimal solution [1] | Powerful optimization via RSM [2] |
Table 2: Pros and Cons of OFAT and Systematic DOE
| Methodology | Advantages | Disadvantages |
|---|---|---|
| OFAT | Widely taught and straightforward [1] | Fails to identify interactions [1]; Inefficient [1]; May miss optimum [1] |
| Systematic DOE | Systematic and thorough coverage; Highly efficient [1] | Higher initial learning curve; Requires a minimum entry of ~10 experiments [1]; May involve running anticipated "failed" experiments [1] |
Experimental Protocols and Applications in Drug Development
Protocol for a Factorial Design Study: Excipient Compatibility
Objective: To systematically investigate the main and interaction effects of two critical formulation factors—Disintegrant Concentration (Factor A: 2% and 5%) and Lubricant Mixing Time (Factor B: 5 and 15 minutes)—on the Tablet Dissolution at 30 minutes (Q30) and Tablet Hardness (Response Variables).
Methodology:
- Experimental Design: A full 2² factorial design with 3 center point replicates (total of 7 experimental runs). Center points (Disintegrant 3.5%, Mixing Time 10 min) are included to estimate curvature and pure error.
- Randomization: The run order for the 7 formulations is fully randomized to mitigate the effects of lurking variables.
- Execution:
- Prepare powder blends according to the randomized design matrix.
- Compress tablets under fixed compression force and speed.
- For each formulation, test 6 tablets for hardness and perform dissolution testing on a full vessel (n=6 or 12 per regulatory standards).
- Data Analysis:
- Perform ANOVA for both Q30 and Hardness.
- Construct Main Effects Plots and an Interaction Plot for each response.
- If a significant interaction is found between Disintegrant Concentration and Lubricant Mixing Time for dissolution, it indicates that the effect of the disintegrant depends on how long the lubricant was mixed—a critical insight completely invisible to OFAT.
Protocol for an RSM Study: Crystal Size Distribution Optimization
Objective: To model and optimize an API crystallization process to maximize Crystal Size Uniformity (measured by Span) and Yield.
Methodology:
- Experimental Design: A Central Composite Design (CCD) is selected for two Critical Process Parameters (CPPs): Cooling Rate (Factor X1) and Agitation Rate (Factor X2).
- Execution:
- Execute the crystallization runs as per the CCD matrix, which includes factorial points, axial points, and center points.
- For each run, isolate the crystals and characterize the particle size distribution via laser diffraction to calculate the Span and determine the Yield.
- Data Analysis:
- Fit a second-order polynomial (quadratic) model to the Span and Yield data using multiple regression.
- Use ANOVA to confirm the significance of the model and its terms.
- Generate 2D contour plots and 3D response surface plots for each response.
- Apply a numerical optimization algorithm (e.g., Desirability Function) to identify the combination of Cooling Rate and Agitation Rate that simultaneously minimizes Span (improves uniformity) and maximizes Yield.
The Scientist's Toolkit: Essential Research Reagent Solutions
Table 3: Key Reagents and Materials for Formulation and Process Optimization Studies
| Item | Function in Experimentation |
|---|---|
| Active Pharmaceutical Ingredient (API) | The therapeutically active component whose physical and chemical properties are central to the optimization study. |
| Excipients (e.g., Disintegrants, Binders, Lubricants) | Inert substances formulated alongside the API to confer specific functionalities to the drug product (e.g., stability, dissolution, manufacturability). |
| Solvents (for Crystallization) | The medium in which crystallization occurs; solvent choice and properties critically impact crystal nucleation, growth, and final particle characteristics. |
| Process Analytical Technology (PAT) Tools | Instruments (e.g., in-line particle size analyzers, NIR spectrometers) for real-time monitoring of Critical Quality Attributes (CQAs), enabling Quality by Design (QbD). |
| Cell-Based Assay Kits (for Target Validation) | Used in early-stage discovery to validate that a target is "druggable" and its modulation elicits a desired biological response [5]. |
| Monoclonal Antibodies (as Validation Tools) | Used for target validation due to their exquisite specificity, helping to establish a causal link between target modulation and therapeutic effect [5]. |
Visualizing Methodological Workflows and Interactions
The diagrams below, generated using DOT language, illustrate the core procedural and conceptual differences between OFAT and DOE.
OFAT Sequential Workflow
DOE Systematic Workflow
Concept of Interaction Effects
The contention between OFAT and systematic DOE is decisively settled by the demands of modern scientific and regulatory environments. While OFAT offers an intuitive starting point, its inability to account for factor interactions and its inherent inefficiency make it a high-risk strategy for optimizing complex processes, particularly in pharmaceutical development where the Quality by Design (QbD) paradigm is now prevalent [4]. Systematic DOE, with its robust statistical foundation, provides a powerful framework for efficiently building a deep understanding of a process, accurately modeling its behavior, and reliably navigating its design space. For researchers and drug development professionals committed to rigorous, efficient, and successful innovation, the adoption of systematic DOE is not merely an option—it is an imperative.
The Historical Context and Traditional Use of the OFAT Approach
The One-Factor-at-a-Time (OFAT) approach represents one of the earliest and most intuitive strategies in experimental science. For generations, this methodology served as the cornerstone of empirical investigation across diverse fields, including chemistry, biology, engineering, and manufacturing [2]. Its fundamental principle—varying a single variable while holding all others constant—provided a straightforward framework for isolating cause-and-effect relationships. Historically, OFAT gained widespread adoption due to its conceptual simplicity and ease of implementation, requiring no complex experimental designs or advanced statistical analysis [2]. Researchers could manually control and adjust factor levels sequentially, making it a practical choice during the early stages of scientific exploration or when working with limited resources and physical setups that were difficult to modify [2].
Historical Background and Traditional Use
The OFAT method has a long and established history in scientific experimentation. It was one of the primary strategies employed by researchers studying complex systems with multiple variables before the development of more sophisticated statistical design techniques [2]. Its popularity stemmed from the direct logic of its procedure: an experimenter would select a baseline set of conditions, then systematically vary one input factor of interest across a range of levels while keeping all other factors rigidly fixed at their initial values [2]. After observing the outcome, the adjusted factor would be returned to its starting level before proceeding to investigate the next variable [2]. This cyclical process continued until all factors of interest had been tested individually [2].
In traditional practice, OFAT experiments were often conducted manually. This approach was particularly instrumental in situations where experiments were time-consuming, expensive, or involved physical apparatus that required significant effort to reconfigure [2]. The method provided a clear, step-wise path to building basic comprehension of a system, which was especially valuable when dealing with systems with limited variables or well-understood behaviors [6].
Traditional OFAT Experimental Protocol
The following workflow visually represents the sequential and cyclical nature of the classical OFAT method:
A Concrete Example: OFAT in Lactic Acid Fermentation
A 2020 study on lactic acid production provides a clear, real-world illustration of a traditional OFAT application. The research aimed to optimize fermentation factors to maximize lactic acid yield from beet molasses using the bacterium Enterococcus hirae ds10 [7].
Detailed Experimental Protocol
The researchers employed a sequential OFAT methodology to investigate four key factors, following the protocol below [7]:
- Initial Baseline Setup: The fermentation was first established under standard conditions: molasses sugar concentration at 2% (w/v), inoculum size at 5% (v/v), pH at 7.0, and temperature at 37°C [7].
- Sequential Factor Variation:
- Step 1 - Sugar Concentration: While holding inoculum size (5%), pH (7.0), and temperature (37°C) constant, the molasses sugar concentration was varied (e.g., 2%, 4%, 6% w/v). The optimal level for yield (4% w/v) was identified and fixed for subsequent steps [7].
- Step 2 - Inoculum Size: With sugar concentration now fixed at the new optimum (4%), pH (7.0), and temperature (37°C) constant, the inoculum size was varied (e.g., 5%, 10%, 15% v/v). The best level (10% v/v) was identified and fixed [7].
- Step 3 - pH: With sugar (4%) and inoculum (10%) fixed at their optimal levels, and temperature constant (37°C), the pH was varied (e.g., 6.0, 7.0, 8.0). The optimal pH (8.0) was identified and fixed [7].
- Step 4 - Temperature: Finally, with the first three factors fixed at their optimized levels, temperature was varied (e.g., 35°C, 40°C, 45°C) to find its optimal value (40°C) [7].
- Outcome: This OFAT approach successfully increased lactic acid production to a maximum of 25.4 ± 0.42 g L⁻¹, a significant improvement over the initial yield [7].
Research Reagent Solutions
The following table details key materials and reagents used in this OFAT fermentation experiment and their functions [7].
| Reagent/Material | Function in the Experiment |
|---|---|
| Beet Molasses | Served as the low-cost, primary carbon source (sucrose, glucose, fructose) for bacterial growth and acid production. |
| Enterococcus hirae ds10 | The selected thermotolerant lactic acid bacterium strain responsible for fermenting sugars into lactic acid. |
| MRS Broth Medium | A complex nutrient medium providing essential nitrogen (yeast extract, peptone), vitamins, and minerals for bacterial growth. |
| Ammonium Chloride | An inorganic salt supplemented as an alternative, low-cost nitrogen source. |
| Yeast Extract | A vital source of amino acids, peptides, and vitamins (B-complex) required by fastidious lactic acid bacteria. |
| Sodium Hydroxide (NaOH) / Hydrochloric Acid (HCl) | Used to adjust and maintain the pH of the fermentation medium at the required levels for different experimental runs. |
Limitations of the OFAT Approach
While OFAT provided valuable initial insights in the lactic acid study and countless others, its methodological constraints become apparent in complex systems. The core limitations are summarized in the table below.
| Limitation | Impact on Experimental Outcomes |
|---|---|
| Failure to Capture Interaction Effects [2] [8] | The approach cannot detect instances where the effect of one factor depends on the level of another (synergistic or antagonistic effects), potentially leading to misleading conclusions and suboptimal conditions. |
| Inefficient Resource Use [2] [1] | OFAT requires a large number of experimental runs to explore multiple factors, making it time-consuming, costly, and inefficient compared to modern methods. |
| Lack of Optimization Capabilities [2] | The method is suited for understanding individual effects but provides no systematic framework for finding a true optimum combination of factor levels. |
| Limited Scope of Exploration [2] | OFAT only investigates the experimental space along a single, narrow path, potentially missing better regions of the factor space that exist outside the tested sequence. |
The following diagram contrasts the limited exploration of OFAT with the comprehensive coverage of a modern factorial design, illustrating why OFAT can miss optimal conditions and interaction effects.
The Modern Alternative: Design of Experiments (DOE)
The limitations of OFAT prompted the development of Design of Experiments (DOE), a structured and statistically sound framework for experimental investigation. Unlike OFAT, DOE systematically varies multiple factors simultaneously according to a predefined mathematical plan [2]. This allows for the efficient estimation of both main effects and critical interaction effects between factors [2] [8].
Key principles underpinning DOE include [2]:
- Randomization: Running trials in a random order to minimize the impact of lurking variables and biases.
- Replication: Repeating experimental runs to estimate experimental error and improve precision.
- Blocking: A technique to account for known sources of variability (e.g., different equipment or operators).
In the lactic acid study, when researchers transitioned from OFAT to a Response Surface Methodology (a type of DOE), they achieved a 60% increase in yield, producing 40.69 g L⁻¹ of lactic acid compared to the 25.4 g L⁻¹ found via OFAT [7]. This starkly demonstrates the potential payoff of modern experimental design.
The One-Factor-at-a-Time approach holds a significant place in the history of science as a foundational and intuitive experimental method. Its traditional use provided a critical pathway to initial process understanding, especially in systems with limited variable interactions and resource constraints. However, the inherent limitations of OFAT—particularly its inability to detect factor interactions and its inefficiency—render it unsuitable for optimizing complex, modern processes. The evolution toward sophisticated methodologies like Design of Experiments marks a paradigm shift from sequential, isolated testing to an integrated, systems-based approach capable of uncovering deeper insights and achieving superior optimization. This progression from OFAT to factorial and response surface designs forms the core of the ongoing "simplex vs. one variable at a time" optimization research, underscoring the critical importance of experimental design choice in scientific and industrial advancement.
The One-Factor-at-a-Time (OFAT) experimental method represents one of the most traditional approaches to scientific investigation, characterized by varying a single factor while maintaining all other factors constant. Despite its historical prevalence across chemical, biological, and engineering disciplines, OFAT contains fundamental limitations that render it increasingly inadequate for modern complex systems, particularly in drug discovery and process optimization where factor interactions dominate system behavior [2]. This methodological approach, while intuitively simple and easily implementable, fails to capture the multidimensional relationships that define most contemporary scientific challenges, from fermentation medium optimization to lead compound identification [9].
The persistence of OFAT often stems from its conceptual simplicity and lower mental effort requirements during experimental design phases [10]. Researchers frequently default to this approach without fully considering the statistical and practical consequences, particularly the method's inherent inability to detect factor interactions and its profound inefficiency in resource utilization. As research questions grow more complex and resource constraints intensify, understanding these limitations becomes paramount for scientists seeking to maximize information gain while minimizing experimental expenditure. This paper examines the core deficiencies of the OFAT paradigm, specifically focusing on its inefficiency and neglect of interaction effects, while providing practical guidance for implementing superior methodological approaches that capture system complexity more faithfully.
The Inefficiency Problem: Experimental Resource Limitations
Quantitative Analysis of OFAT's Experimental Burden
The inefficiency of OFAT manifests most visibly in the sheer number of experimental runs required to investigate multiple factors simultaneously. Unlike factorial designs where factors are varied together, OFAT must explore each dimension of the experimental space sequentially, resulting in an exponential growth in experimental requirements as factors increase. This inefficiency becomes particularly problematic in resource-intensive fields like drug discovery where assays, reagents, and researcher time represent significant costs [11].
Table 1: Comparison of Experimental Runs Required: OFAT vs. Factorial Design
| Number of Factors | Levels per Factor | OFAT Runs Required | Full Factorial Runs | Efficiency Ratio |
|---|---|---|---|---|
| 2 | 2 | 4 | 4 | 1:1 |
| 3 | 2 | 8 | 8 | 1:1 |
| 4 | 2 | 16 | 16 | 1:1 |
| 5 | 2 | 32 | 32 | 1:1 |
| 3 | 3 | 27 | 27 | 1:1 |
| 4 | 3 | 81 | 81 | 1:1 |
| 5 | 3 | 243 | 243 | 1:1 |
While Table 1 appears to show parity between OFAT and full factorial designs, this misleading representation only holds when considering the bare minimum runs for main effects estimation. In practice, OFAT's inability to estimate experimental error without replication dramatically increases its true resource requirements [2]. Furthermore, when considering precision of effect estimation, factorial designs provide substantially more information per experimental run, with some modern designs like Plackett-Burman offering greater precision with equivalent runs [10].
Case Study: Fermentation Medium Optimization
A concrete example of OFAT inefficiency emerges from fermentation medium optimization, where researchers must balance numerous nutritional components to maximize metabolite yield. A typical scenario investigating five factors (carbon source, nitrogen source, pH, temperature, and agitation rate) at three levels each would require 243 experimental runs using OFAT methodology [9]. In contrast, a fractional factorial design could extract similar information about main effects with as few as 16-32 runs, representing an 85-93% reduction in experimental burden [9]. This efficiency gain translates directly to reduced resource consumption, shorter development timelines, and ultimately lower research costs—critical considerations in competitive fields like pharmaceutical development.
The inefficiency problem extends beyond mere numbers of experiments to include the risk of experimental error accumulation. With OFAT's extensive sequence of runs, the potential for uncontrolled variability, instrumental drift, and operator fatigue introduces systematic errors that can compromise result validity [2]. Designed experiments incorporating randomization principles mitigate these risks by distributing potential confounding effects evenly across factor combinations.
Figure 1: Experimental Efficiency Comparison Between OFAT and Factorial Designs
The Interaction Effect Blind Spot
Defining Interaction Effects in Experimental Systems
Interaction effects occur when the effect of one factor on a response variable depends on the level of another factor. These interdependent relationships represent a fundamental characteristic of complex biological, chemical, and pharmacological systems, yet remain completely invisible to OFAT methodology [10] [2]. In drug discovery, for example, interactions between pH and temperature can dramatically influence binding affinity, membrane permeability, and metabolic stability—relationships that OFAT systematically fails to detect [11].
The statistical definition of an interaction represents a non-additive effect when factors combine. In practical terms, this means that knowing the individual effects of factors A and B in isolation provides insufficient information to predict their combined effect. OFAT's foundational assumption of effect additivity represents a critical oversimplification that routinely leads researchers to miss optimal factor combinations or misidentify factor significance [10]. This methodological blind spot becomes increasingly problematic as system complexity grows, with higher-order interactions creating emergent behaviors that cannot be predicted from individual factor effects.
Documented Consequences of Ignoring Interactions
The practical consequences of ignoring interaction effects are well-documented across multiple domains. In fermentation optimization, carbon and nitrogen sources frequently interact in their influence on metabolite production [9]. For instance, the effect of a specific carbon source on antibiotic yield may reverse completely depending on the nitrogen source present—a phenomenon OFAT cannot detect and would typically misinterpret as random variability or attribute incorrectly to a single factor [9].
In pharmaceutical development, the failure to detect interactions carries even graver consequences. Drug-target engagement assays like CETSA (Cellular Thermal Shift Assay) have revealed that buffer composition, temperature, and cellular context interact significantly in modulating observed drug-target interactions [11]. OFAT approaches risk mischaracterizing compound potency and mechanism of action by overlooking these critical interdependencies, potentially contributing to the high attrition rates in drug development.
Table 2: Documented Interaction Effects in Pharmaceutical and Bioprocessing Contexts
| System | Interacting Factors | Nature of Interaction | Impact |
|---|---|---|---|
| Antibiotic Production [9] | Carbon source & nitrogen source | Non-additive effect on yield | OFAT misses optimal nutrient combination |
| Penicillin Fermentation [9] | Glucose & lactose | Carbon catabolite repression | OFAT misidentifies glucose as universally inhibitory |
| Drug-Target Engagement (CETSA) [11] | pH & temperature | Cooperative stabilization | OFAT underestimates binding affinity |
| Reaction Optimization [12] | Catalyst & solvent | Synergistic rate enhancement | OFAT fails to identify optimal combination |
| Software Testing [13] | Multiple input parameters | Failure-inducing combinations | OFAT misses corner-case bugs |
Figure 2: Interaction Effects and Their Implications for OFAT Experimental Designs
Methodological Alternatives: Designed Experiments
Fundamental Principles of Design of Experiments (DOE)
Design of Experiments (DOE) provides a statistically rigorous framework that directly addresses OFAT's limitations through three core principles: randomization, replication, and blocking [2]. Randomization ensures that experimental runs are conducted in random order to minimize the impact of lurking variables and systematic biases. Replication involves repeating experimental runs under identical conditions to estimate experimental error and improve effect estimation precision. Blocking accounts for known sources of variability by grouping homogeneous experimental runs, thus isolating nuisance factors from experimental error [2].
These foundational principles enable DOE to efficiently explore multifactor spaces while providing estimates of both main effects and interaction effects. The methodological shift from OFAT to DOE represents a transition from isolated factor examination to system-level understanding, acknowledging the inherent complexity of biological, chemical, and pharmacological systems. This paradigm shift has become increasingly essential as research questions grow more multidimensional and resource constraints intensify.
Factorial Designs: Capturing Interactions Systematically
Full and fractional factorial designs represent the most direct alternative to OFAT, specifically engineered to estimate interaction effects while maintaining computational efficiency [2]. In a two-factor factorial design, researchers simultaneously vary both factors across their levels, creating a matrix of experimental conditions that enables estimation of both individual factor effects (main effects) and their interactive combination (interaction effect) [10].
The mathematical foundation for factorial designs relies on analysis of variance (ANOVA), which partitions total variability in response data into components attributable to main effects, interaction effects, and experimental error [2]. This partitioning enables statistical testing of each effect's significance, providing researchers with objective criteria for factor importance rather than relying on visual interpretation of OFAT data, which frequently misses subtle but important interactions.
Advanced Techniques: Response Surface Methodology and Beyond
For optimization problems where the goal extends beyond understanding to actual performance maximization or minimization, Response Surface Methodology (RSM) provides powerful extensions to basic factorial designs [2]. RSM employs specialized experimental designs like Central Composite Designs (CCD) and Box-Behnken Designs to fit quadratic models that capture curvature in response surfaces—another phenomenon invisible to OFAT [2].
These advanced approaches enable researchers to not only detect interactions but to actually map the complete response landscape, identifying optimal regions and understanding trade-offs between multiple objectives. In drug discovery, this capability proves particularly valuable when balancing potency, selectivity, and pharmacokinetic properties, where multiple competing objectives must be optimized simultaneously [11]. The emergence of machine learning and AI-driven experimental design further extends these capabilities, enabling even more efficient navigation of complex experimental spaces [11] [12].
Experimental Protocols for Interaction Detection
Two-Factor Factorial Design Protocol
Objective: To detect and quantify interaction effects between two factors while estimating their main effects on the response variable.
Materials and Equipment:
- Standard laboratory equipment for response measurement
- Controlled environmental conditions for experimental factors
- Statistical software for data analysis (R, JMP, Minitab, etc.)
Procedure:
- Select two factors of interest (Factor A and Factor B) and define their experimental ranges (low and high levels) based on preliminary knowledge.
- Construct a 2×2 factorial design comprising all possible combinations of factor levels: (Alow, Blow), (Alow, Bhigh), (Ahigh, Blow), (Ahigh, Bhigh).
- Randomize the run order to protect against confounding time-based trends.
- Execute experiments according to the randomized sequence, measuring response variables for each combination.
- Include center points (Amid, Bmid) if curvature detection is desired.
- Replicate the entire design to estimate experimental error (minimum of 2-3 replicates recommended).
Statistical Analysis:
- Perform Two-Way ANOVA with interaction term:
- Response ~ Factor A + Factor B + Factor A × Factor B
- Examine significance of interaction term (p < 0.05 typically indicates statistically significant interaction).
- Create interaction plot by plotting response means for each factor combination.
- If interaction is significant, avoid interpreting main effects in isolation.
Interpretation: Parallel lines in the interaction plot indicate no interaction; non-parallel lines suggest presence of interaction. The significance of the interaction term in ANOVA provides statistical evidence for interaction effect.
Fractional Factorial Screening Protocol
Objective: To efficiently screen multiple factors for important main effects and two-factor interactions when full factorial designs are prohibitively expensive.
Materials and Equipment: Same as Protocol 5.1 plus understanding of design resolution concepts.
Procedure:
- Identify 5-8 potentially important factors for screening.
- Select appropriate fractional factorial design (Resolution IV or higher to avoid confounding main effects with two-factor interactions).
- Generate experimental design using statistical software, maintaining principles of randomization.
- Execute experiments according to generated design.
- Measure response variables with appropriate precision.
Statistical Analysis:
- Fit linear model with all main effects and two-factor interactions.
- Use half-normal probability plots or Pareto charts to identify significant effects.
- Apply model reduction techniques to eliminate nonsignificant terms.
- Validate model assumptions through residual analysis.
Interpretation: Significant two-factor interactions indicate where factor effects depend on other factor levels. Follow-up experiments may be required to de-alias confounded interactions.
The Scientist's Toolkit: Essential Research Reagent Solutions
Table 3: Key Research Reagents and Materials for Advanced Experimental Design
| Reagent/Material | Function | Application Context |
|---|---|---|
| CETSA (Cellular Thermal Shift Assay) Kits | Quantitative measurement of drug-target engagement in intact cells | Confirming target engagement in physiologically relevant systems [11] |
| Statistical Software (JMP, R, Minitab) | Experimental design generation and statistical analysis | Creating and analyzing factorial, fractional factorial, and response surface designs [13] |
| High-Throughput Screening Plates (1536-well) | Miniaturized reaction vessels for efficient experimentation | Enabling rapid testing of multiple factor combinations [12] |
| Artificial Intelligence/Machine Learning Platforms | Predictive modeling for factor optimization | Guiding experimental designs based on existing data [11] |
| Automated Reactor Systems | Self-optimization through iterative experimentation | Implementing design-make-test-analyze cycles without manual intervention [12] |
The fundamental limitations of OFAT—specifically its profound inefficiency and systematic failure to detect interaction effects—render it inadequate for addressing complex research questions in contemporary science. While the method retains value in preliminary investigations or truly additive systems, its application in multidimensional optimization problems consistently leads to suboptimal solutions, missed opportunities, and misleading conclusions [10] [2].
The alternative framework of Designed Experiments, particularly factorial designs and response surface methodology, provides statistically rigorous approaches that directly address OFAT's deficiencies. By varying multiple factors simultaneously, these methods capture interaction effects while dramatically improving experimental efficiency [2]. The incorporation of fundamental principles like randomization, replication, and blocking further enhances result reliability and validity.
For researchers in drug discovery and development, where system complexity and resource constraints continue to intensify, embracing these advanced methodological approaches represents not merely a statistical preference but a practical necessity. As the field moves toward increasingly integrated, cross-disciplinary pipelines, the ability to efficiently detect and quantify factor interactions will separate successful optimization efforts from costly, inconclusive experimentation [11]. The transition beyond OFAT represents an essential evolution in scientific methodology, enabling researchers to properly address the multidimensional challenges that define modern science.
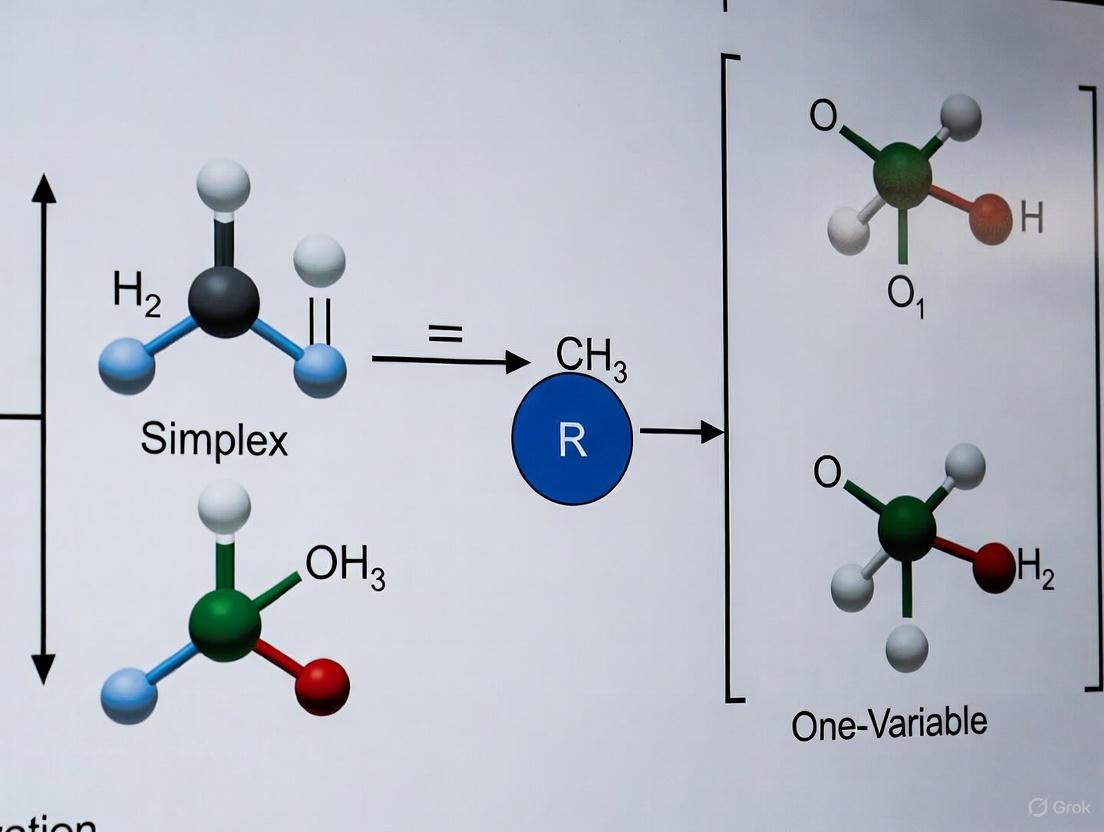
This technical guide provides researchers, scientists, and drug development professionals with a comprehensive analysis of two systematic optimization frameworks: Design of Experiments (DoE) and the Simplex Method. Within the broader context of simplex versus one-variable-at-a-time (OVAT) optimization research, we examine the mathematical foundations, application methodologies, and comparative advantages of these approaches for complex experimental optimization in pharmaceutical development. The guide includes structured data presentation, detailed experimental protocols, and visualization tools to facilitate implementation in research settings.
In chemical process development and pharmaceutical research, optimization strategies aim to improve system performance while minimizing experimental effort [14]. Traditional one-variable-at-a-time (OVAT) approaches, while simple to implement, suffer from critical limitations: they cannot detect interactions between variables, require more experiments, and may miss optimal conditions [14]. Systematic frameworks address these shortcomings through multivariate approaches that simultaneously optimize all parameters.
The comparative efficiency of multidimensional optimization is particularly valuable in pharmaceutical development, where limited resources and time constraints demand maximum information from minimal experiments. This guide examines two powerful systematic approaches: Design of Experiments (DoE), which characterizes experimental space through response surface modeling, and the Simplex Method, an algorithmic approach that iteratively moves toward optimal conditions [14].
Mathematical Foundations
The Simplex Method for Linear Programming
The Simplex Method, developed by George Dantzig in 1947, is an algorithm for solving linear programming problems involving optimization of a linear objective function subject to linear constraints [15] [16]. The method operates on the fundamental principle that the optimal solution to a linear programming problem lies at a vertex of the feasible region, which forms a convex polytope in multidimensional space [15] [17].
The algorithm begins with identification of a basic feasible solution (a corner point of the feasible region) and iteratively moves along the edges of the feasible region to adjacent vertices, improving the objective function at each step until no further improvements can be made [15]. For a problem with n variables and m constraints, the Simplex Method transforms inequality constraints into equalities by introducing slack variables, creating what is known as a "dictionary" or "tableau" representation [18]:
After introducing slack variables s, the constraints become:
The initial dictionary takes the form:
The method proceeds through pivot operations that systematically swap basic and non-basic variables, moving from one vertex to another while continuously improving the objective function [18].
Design of Experiments (DoE) Fundamentals
Design of Experiments constitutes a statistical approach that characterizes a chemical reaction's experimental space through a response surface model [14]. The model is described by a mathematical function with one optimum, derived from multivariate screening of reaction parameters according to a systematic experimental plan [14].
The key advantage of DoE over OVAT approaches is its ability to quantify interaction effects between variables and identify true optimal conditions through structured variation of multiple parameters simultaneously. This methodology aligns with Quality by Design (QbD) principles, providing a systematic approach to drug development that enhances product and process understanding [19].
Comparative Analysis: Capabilities and Applications
Table 1: Comparison of Systematic Optimization Frameworks
| Characteristic | Simplex Method | Design of Experiments (DoE) |
|---|---|---|
| Foundation | Algorithmic optimization [15] | Statistical modeling [14] |
| Approach | Iterative movement toward optimum [17] | Response surface characterization [14] |
| Experimental Requirements | Sequential experiments | Pre-defined experimental matrix |
| Interaction Detection | Limited | Comprehensive [14] |
| Optimum Identification | Converges to local optimum | Maps entire experimental space |
| Implementation in Pharma | Continuous flow processes [14] | Batch and continuous processes [14] |
| Analysis Method | Primarily online analysis [14] | Offline and online analysis [14] |
Table 2: Pharmaceutical Application Domains
| Application Area | Simplex Method | DoE |
|---|---|---|
| Lipid Formulation Development | Limited application | Extensive use in SMEDDS optimization [19] |
| Oral Drug Delivery Systems | Secondary approach | Primary approach for bioavailability enhancement [19] |
| Reaction Optimization | Modified Nelder-Mead implementation [14] | Response surface methodology [14] |
| Process Analytical Technology | Compatible with real-time monitoring [14] | Generally offline analysis [14] |
Experimental Protocols and Methodologies
Protocol for Simplex Method Implementation
The following protocol outlines the implementation of the modified Nelder-Mead Simplex algorithm for chemical reaction optimization, as demonstrated in imine synthesis [14]:
- System Setup: Configure a fully automated microreactor system with real-time monitoring capability (e.g., inline FT-IR spectroscopy)
- Initial Simplex Formation: Generate initial simplex based on the number of optimization parameters (n+1 vertices for n parameters)
- Objective Function Calculation: For each vertex, calculate the objective function (e.g., yield, concentration, or cost function)
- Simplex Transformation:
- Reflection: Replace the worst vertex with its reflection across the centroid of the remaining vertices
- Expansion: If reflected vertex shows improvement, expand further in that direction
- Contraction: If no improvement, contract the simplex toward better vertices
- Termination Check: Continue iterations until the simplex converges to an optimum or reaches maximum iterations
For self-optimizing systems in pharmaceutical applications, the algorithm can be modified to respond in real-time to process disturbances, maintaining optimal performance despite fluctuations in starting materials or environmental conditions [14].
Protocol for DoE Implementation
The implementation of Design of Experiments for pharmaceutical formulation development follows this systematic protocol [19]:
- Factor Selection: Identify critical process parameters (e.g., excipient ratios, processing conditions)
- Experimental Design: Select appropriate design (e.g., factorial, central composite, Box-Behnken) based on factors and desired resolution
- Response Definition: Define critical quality attributes as responses (e.g., droplet size, solubility, bioavailability)
- Experimental Execution: Conduct experiments according to the designed matrix
- Model Development: Fit response surface models to experimental data
- Optimization: Identify optimal factor settings that simultaneously satisfy all response constraints and objectives
- Verification: Conduct confirmation experiments at predicted optimal conditions
In lipid-based formulation development, DoE has been particularly valuable for optimizing self-microemulsifying drug delivery systems (SMEDDS) by balancing ratios of oils, surfactants, and co-surfactants to enhance drug solubility and absorption [19].
Visualization of Methodologies
Simplex Method Workflow
DoE Methodology Flowchart
Comparison of Optimization Approaches
The Scientist's Toolkit: Essential Research Materials
Table 3: Key Reagent Solutions for Optimization Experiments
| Material/Reagent | Function/Purpose | Example Applications |
|---|---|---|
| Medium-Chain Triglycerides (MCT) | Lipid phase component for enhancing drug solubility [19] | SMEDDS formulations [19] |
| Nonionic Surfactants | Stabilize emulsions, reduce interfacial tension [19] | Microemulsion systems [19] |
| Lauroyl Polyoxylglycerides | Hydrophilic surfactant for self-emulsifying systems [19] | Lipid-based drug delivery [19] |
| Inline FT-IR Spectrometer | Real-time reaction monitoring [14] | Continuous flow optimization [14] |
| Microreactor Systems | Enable precise parameter control and automation [14] | Self-optimizing chemical processes [14] |
Recent Advances and Future Directions
Recent theoretical work has addressed long-standing questions about the Simplex Method's efficiency. While worst-case complexity analyses suggested exponential runtimes, Bach and Huiberts (2023) have demonstrated that with appropriate randomization and practical implementation tricks, the method operates efficiently in polynomial time [16] [20]. These theoretical advances complement the method's established practical success.
In pharmaceutical applications, the integration of both Simplex and DoE methodologies with automated experimental platforms and real-time analytics represents the cutting edge of optimization research [14]. Such systems enable fully autonomous experimental optimization while simultaneously collecting kinetic data for enhanced process understanding.
The continued development of these systematic frameworks supports the transition from empirical to mechanistic approaches in pharmaceutical development, aligning with regulatory initiatives promoting Quality by Design principles [19]. Future advancements will likely focus on hybrid approaches that leverage the strengths of both methodologies while integrating machine learning and artificial intelligence for enhanced predictive capability.
In the realm of optimization, particularly within research and development, the choice of methodology can significantly influence the efficiency, cost, and success of projects such as drug development. This guide explores four foundational concepts—Main Effects, Interaction Effects, Feasible Region, and Objective Function—framed within a critical comparison of two optimization approaches: the traditional One-Variable-At-a-Time (OVAT) method and the more sophisticated Simplex Method rooted in Design of Experiments (DoE). Understanding these terminologies and the underlying principles of these methodologies is paramount for researchers and scientists seeking to optimize processes in a resource-conscious and effective manner. The persistent use of OVAT in academic settings, despite its documented limitations, stands in contrast to the powerful, simultaneous factor evaluation enabled by the Simplex Method and linear programming, highlighting a significant opportunity for methodological advancement in fields like synthetic chemistry and pharmaceutical development [2] [21].
Defining the Core Terminology
Objective Function
The Objective Function is a mathematical expression that defines the goal of an optimization problem. It represents the quantity that needs to be maximized (e.g., profit, yield, efficacy) or minimized (e.g., cost, waste, side effects). In the context of this guide, the objective function is what the researcher is ultimately trying to optimize.
- In Linear Programming: It is expressed as ( Z = c1x1 + c2x2 + ... + cnxn ), where ( Z ) is the objective to be optimized, ( ci ) are the coefficients (e.g., unit profit), and ( xi ) are the decision variables (e.g., amount of a drug component to use) [22] [23].
- Example: In a drug development scenario, the objective could be to maximize therapeutic yield while minimizing the cost of raw materials.
Feasible Region
The Feasible Region is the set of all possible points (combinations of decision variables) that satisfy the problem's constraints, including inequalities, equalities, and integer requirements. It represents the "solution space" within which an optimal solution must be found [24].
- Characteristics: The feasible region in a linear programming problem forms a convex polytope, a geometric shape whose boundaries are defined by the constraints [24] [22].
- Optimal Solution: In linear programming, if an optimal solution exists, it can be found at one of the extreme points (vertices) of this feasible region [22].
- Visualization: The diagram below illustrates a feasible region defined by multiple constraints.
Main Effects
A Main Effect describes the isolated, individual impact of a single independent variable (factor) on the response (dependent) variable, disregarding the influence of any other factors in the system [2] [21].
- OVAT Focus: The OVAT method is exclusively designed to identify main effects by varying one factor while holding all others constant [2] [10].
- Interpretation: It represents the average change in the response when a factor is moved from its low to high level.
Interaction Effects
Interaction Effects occur when the effect of one independent variable on the response depends on the level of one or more other variables. They represent the combined, non-additive effect of factors [2] [25].
- Critical Limitation of OVAT: A fundamental weakness of the OVAT approach is its inability to detect interaction effects because it does not vary factors simultaneously [2] [10] [21].
- Modeling: In a statistical model, interaction effects are represented by product terms (e.g., ( β{1,2}x1x_2 )) [25] [21].
- Example: In a chemical reaction, a higher temperature might increase yield only when a specific catalyst is present at a high concentration. Varying temperature alone (OVAT) would miss this crucial dependency.
Experimental Optimization: OVAT vs. Simplex Methodology
One-Variable-At-a-Time (OVAT) Protocol
Principle: This classical method involves sequentially varying a single factor while maintaining all other factors at fixed, constant levels. After testing a range for one factor, the process is repeated for the next factor, using the presumed optimal level of the previous one [2] [10] [21].
- Step-by-Step Workflow:
- Select Baseline: Establish a set of baseline conditions for all variables.
- Vary One Factor: Systematically change one factor across a predefined range.
- Observe Response: Measure the outcome (e.g., yield, purity) for each level of the varied factor.
- Identify "Optimum": Select the factor level that produces the best response.
- Iterate: Fix the first factor at its new "optimal" level and repeat steps 2-4 for the next factor.
- Finalize: The combination of the individually optimal levels is declared the overall optimum.
The following diagram visualizes this sequential, constrained process.
Key Reagents & Solutions: The requirements for OVAT are conceptually simple, as it mirrors traditional controlled experimentation.
Table: Research Reagent Solutions for OVAT
Item Function in Protocol Baseline Condition Setup Serves as the constant experimental environment against which changes to a single variable are measured. High/Mid/Low Levels per Factor Defines the range of investigation for each variable, typically tested in sequence. Fixed Resource Constraints Represents the static limitations (e.g., budget, time, materials) under which the sequential tests are run.
Simplex Method & Design of Experiments (DoE) Protocol
Principle: The Simplex Method is an algorithm for solving linear programming problems. It operates by moving intelligently along the edges of the feasible region polytope from one vertex (extreme point) to an adjacent one, improving the objective function with each step until the optimum is found [22] [16] [26]. In the broader context of optimization, it represents a paradigm shift from OVAT by simultaneously evaluating multiple factors, a core principle of DoE.
Step-by-Step Workflow (Simplex Algorithm):
- Formulate Problem: Define the objective function and constraints in standard form.
- Initialize: Convert inequalities to equations using slack variables to define an initial basic feasible solution (a vertex of the polytope) [22] [26].
- Construct Tableau: Set up the initial simplex tableau, a matrix representation of the linear program [22] [26].
- Optimality Check: If all coefficients in the objective row are non-negative, the current solution is optimal; STOP. Otherwise, continue.
- Pivot Operation: a. Select Pivot Column: Choose a column with the most negative objective row coefficient. b. Select Pivot Row: Calculate quotients of the RHS and the pivot column; choose the row with the smallest non-negative quotient. c. Pivot: Use Gaussian elimination to make the pivot element 1 and all other elements in the pivot column 0, creating a new tableau and a new basic feasible solution [22].
- Iterate: Return to Step 4.
Key Reagents & Solutions (DoE Context): The Simplex Method and DoE require a more structured setup than OVAT.
Table: Research Reagent Solutions for DoE & Simplex
Item Function in Protocol Defined Factor Space Ranges Establishes the upper and lower bounds (the feasible region) for all variables to be explored simultaneously. Experimental Design Matrix The core "reagent" that specifies the exact combination of factor levels for each experimental run. Slack/Surplus Variables Mathematical tools used to convert inequality constraints into equalities, defining the boundaries of the feasible polytope [22] [23]. Statistical Software Essential for generating designs, analyzing results, fitting models, and identifying significant main and interaction effects.
The theoretical and practical differences between OVAT and the Simplex/DoE approach are substantial. The table below summarizes the key distinctions based on the gathered research.
Table: Comparison of OVAT and Simplex/DoE Optimization Methods
| Feature | OVAT (One-Variable-At-a-Time) | Simplex / DoE (Design of Experiments) |
|---|---|---|
| Basic Principle | Sequential, isolated factor testing [2] [10] | Simultaneous factor variation & structured experimentation [2] [21] |
| Interaction Effects | Cannot be detected or estimated [2] [10] [21] | Can be detected, estimated, and quantified [2] [25] [21] |
| Experimental Efficiency | Low; requires many runs for multi-factor problems, leading to resource inefficiency [2] [10] | High; extracts maximum information from minimal runs through structured designs [2] [21] |
| Risk of Misleading Optima | High, as it may miss true optima due to factor interactions [2] [21] | Low, as it explores the response surface more comprehensively [2] [21] |
| Foundational Concept | Based on a series of controlled experiments [10] | Based on statistical principles (randomization, replication, blocking) and linear algebra [2] [22] |
| Problem Scope | Limited to main effects only | Can handle main effects, interactions, and non-linear responses (via RSM) [2] [21] |
| Handling of Constraints | Informal and sequential | Formal and direct via the feasible region and constraint equations [24] [22] |
For researchers, scientists, and drug development professionals, the choice between OVAT and the Simplex/DoE framework is critical. While OVAT offers simplicity and intuitive appeal, its inability to account for interaction effects and its inefficiency in exploring the feasible region pose significant risks of arriving at suboptimal solutions. The Simplex Method, and the DoE philosophy it embodies, provides a robust, mathematically sound approach to optimization. By formally defining the objective function and constraints to map the feasible region, and by systematically probing this space to understand both main effects and crucial interactions, it ensures a more efficient path to a true and reliable optimum. Embracing these advanced methodologies is not merely a technical choice but a strategic imperative for accelerating and de-risking research and development in complex, multi-factorial environments like pharmaceutical science.
Putting Theory into Practice: A Guide to Implementing Simplex and DoE in the Lab
In the realms of operations research, drug development, and chemical formulation, professionals continually face the challenge of making optimal decisions within constraints—whether maximizing therapeutic efficacy, minimizing production costs, or achieving perfect drug release profiles. For decades, two philosophical approaches have dominated this optimization landscape: the sophisticated sequential simplex method that navigates multiple variables simultaneously, and the intuitive but limited one-variable-at-a-time (OVAT) approach. Where OVAT methodologies adjust a single factor while holding others constant, the simplex method operates as a systematic navigation algorithm that traverses the edges of a multidimensional feasible region, constantly moving toward improved solutions by considering the entire variable space concurrently [26] [18].
The mathematical foundation of the simplex method reveals why it outperforms simpler approaches for complex problems. Developed by George Dantzig in 1947, this algorithm solves linear programming problems by moving along the edges of a polytope (the multidimensional feasible region defined by constraints) from one vertex to the next, ensuring each step improves the objective function [22]. In contrast to OVAT which often becomes trapped in local optima or misses crucial variable interactions, the simplex method guarantees finding the global optimum for linear problems—a critical advantage when optimizing pharmaceutical formulations where component interactions significantly impact performance [27]. The method's efficiency stems from its systematic approach: it evaluates only corner-point feasible solutions rather than searching the entire feasible region, making it exceptionally efficient for problems with thousands of variables and constraints [26].
Theoretical Foundation: How the Simplex Method Works
Standard Form and Problem Setup
The simplex algorithm requires linear programs to be expressed in standard form to create a consistent framework for computation. The standard form for a maximization problem consists of:
- An objective function to maximize: ( z = c1x1 + c2x2 + ... + cnxn )
- Constraint equations: ( a{11}x1 + a{12}x2 + ... + a{1n}xn = b_1 )
- Non-negativity restrictions: ( x1, x2, ..., x_n \geq 0 )
For minimization problems, conversion to maximization is straightforward by multiplying the objective function by -1 [28]. The transformation of inequality constraints into equations occurs through the introduction of slack variables (for ≤ constraints) and surplus variables (for ≥ constraints). Each slack variable represents the unused portion of a resource, while surplus variables represent the excess beyond a minimum requirement [22]. This conversion is crucial as it transforms the problem into a system of linear equations that can be manipulated using matrix operations.
The initial basic feasible solution is found by setting the original decision variables to zero and solving for the slack variables. This solution corresponds to the origin of the feasible region, providing a starting point for the algorithm [26]. The simplex method then proceeds through a series of iterations, each moving to an adjacent vertex with an improved objective value, until no further improvement is possible—signaling that the optimal solution has been found [22].
Mathematical Principles and Algorithmic Steps
The simplex method operates through systematic pivot operations that algebraically move from one basic feasible solution to another. Each iteration involves:
Optimality Check: Examining the objective row coefficients to determine if introducing any non-basic variable would improve the objective value. For maximization problems, positive coefficients indicate potential improvement [26].
Entering Variable Selection: Choosing the non-basic variable with the most positive coefficient (in maximization) to enter the basis. This selection strategy, known as the steepest ascent rule, typically provides the greatest objective improvement per unit increase [18].
Leaving Variable Determination: Applying the minimum ratio test to determine which basic variable must leave the basis to maintain feasibility. This test identifies the constraint that would first be violated as the entering variable increases [26].
Pivot Operation: Performing Gaussian elimination to create a new canonical form with the entering variable replacing the leaving variable in the basis [28].
The algorithm terminates when no positive coefficients remain in the objective row (for maximization), indicating that no adjacent vertex provides improvement. At this point, the current basic feasible solution is guaranteed to be optimal [22]. The elegance of the simplex method lies in its finite convergence—though pathological examples exist, the algorithm typically reaches the optimum in a number of steps proportional to the problem dimensions [22].
Step-by-Step Implementation Guide
Problem Formulation and Initial Setup
Consider a pharmaceutical production optimization problem where a company needs to allocate limited resources to maximize profit from two drug formulations. The problem can be formulated as:
Maximize: ( P = 3x + 2y ) (Profit function) Subject to: ( x - y \leq 2 ) (Raw material constraint) ( 3x + y \leq 5 ) (Production capacity) ( 4x + 3y \leq 7 ) (Quality control capacity) ( x, y \geq 0 ) (Non-negativity)
To convert this to standard form, we introduce slack variables ( s1 ), ( s2 ), and ( s_3 ) for each inequality constraint:
Maximize: ( P = 3x + 2y + 0s1 + 0s2 + 0s3 ) Subject to: ( x - y + s1 = 2 ) ( 3x + y + s2 = 5 ) ( 4x + 3y + s3 = 7 ) ( x, y, s1, s2, s_3 \geq 0 )
The initial basic feasible solution is ( x = 0 ), ( y = 0 ), ( s1 = 2 ), ( s2 = 5 ), ( s_3 = 7 ), with an initial profit of ( P = 0 ). The slack variables form the initial basis as they provide the simplest identity matrix [26] [28].
Constructing the Initial Simplex Tableau
The simplex tableau organizes all necessary information into a tabular format that tracks the objective function values, basic variables, and constraint coefficients throughout the iterations. The initial tableau for our example is constructed as:
caption: Initial Simplex Tableau
| Basic Variable | Value | x | y | s₁ | s₂ | s₃ | Ratio |
|---|---|---|---|---|---|---|---|
| s₁ | 2 | 1 | -1 | 1 | 0 | 0 | - |
| s₂ | 5 | 3 | 1 | 0 | 1 | 0 | 5/3 ≈ 1.67 |
| s₃ | 7 | 4 | 3 | 0 | 0 | 1 | 7/4 = 1.75 |
| P | 0 | -3 | -2 | 0 | 0 | 0 | - |
The tableau's bottom row (objective row) shows the reduced costs of the non-basic variables. The negative coefficients (-3 for x and -2 for y) indicate that introducing either variable into the basis will improve the objective value [26] [28]. The "Value" column represents the current values of the basic variables, while the remaining columns contain the coefficients of each variable in the constraints.
Iteration and Pivot Operations
First Iteration:
Select Pivot Column: The most negative coefficient in the objective row is -3 in column x, so x becomes the entering variable [26].
Select Pivot Row: Calculate ratios of the "Value" column to the positive coefficients in the x-column:
- s₁ row: 2/1 = 2
- s₂ row: 5/3 ≈ 1.67
- s₃ row: 7/4 = 1.75
The minimum ratio is 1.67 from the s₂ row, so s₂ becomes the leaving variable [26].
Pivot Operation: The pivot element is 3 at the intersection of the s₂ row and x column. Perform row operations to convert the x-column to [0, 1, 0, 0]ᵀ:
- Divide pivot row by 3: R₂ → R₂/3
- Update other rows: R₁ → R₁ - R₂, R₃ → R₃ - 4R₂, R₄ → R₄ + 3R₂
caption: Tableau After First Iteration
| Basic Variable | Value | x | y | s₁ | s₂ | s₃ | Ratio |
|---|---|---|---|---|---|---|---|
| s₁ | 1 | 0 | -4/3 | 1 | -1/3 | 0 | - |
| x | 5/3 | 1 | 1/3 | 0 | 1/3 | 0 | 5 |
| s₃ | 1/3 | 0 | 5/3 | 0 | -4/3 | 1 | 1/5 = 0.2 |
| P | 5 | 0 | -1 | 0 | 1 | 0 | - |
Second Iteration:
Select Pivot Column: The most negative coefficient in the objective row is -1 in column y.
Select Pivot Row: Calculate ratios for the y-column:
- s₁ row: negative coefficient, skip
- x row: (5/3)/(1/3) = 5
- s₃ row: (1/3)/(5/3) = 1/5 = 0.2
The minimum ratio is 0.2 from the s₃ row, so s₃ becomes the leaving variable.
Pivot Operation: The pivot element is 5/3. Perform row operations to convert the y-column to [0, 0, 1, 0]ᵀ:
- Divide pivot row by 5/3: R₃ → 3R₃/5
- Update other rows accordingly
caption: Final Optimal Tableau
| Basic Variable | Value | x | y | s₁ | s₂ | s₃ |
|---|---|---|---|---|---|---|
| s₁ | 1.4 | 0 | 0 | 1 | -1.4 | 0.8 |
| x | 1.6 | 1 | 0 | 0 | 0.6 | -0.2 |
| y | 0.2 | 0 | 1 | 0 | -0.8 | 0.6 |
| P | 5.2 | 0 | 0 | 0 | 0.2 | 0.6 |
The final tableau shows no negative coefficients in the objective row, indicating optimality. The optimal solution is ( x = 1.6 ), ( y = 0.2 ), with maximum profit ( P = 5.2 ). The slack variables indicate that the first constraint is binding (s₁ = 1.4 > 0), while the other resources are fully utilized [26] [28].
Visualization of the Simplex Method Workflow
The following diagram illustrates the complete simplex algorithm workflow, from problem formulation through optimal solution, including the key decision points and operations:
caption: Simplex Algorithm Workflow
Application in Drug Development: A Case Study
Formulation Optimization Using the Simplex Method
In pharmaceutical development, the simplex method provides a powerful framework for optimizing complex drug formulations where multiple components interact to influence critical quality attributes. A recent study on glipizide sustained-release tablets demonstrates this application effectively [27]. Researchers aimed to optimize five excipient components—HPMC K4M (X1), HPMC K100LV (X2), MgO (X3), lactose (X4), and anhydrous CaHPO4 (X5)—to achieve target drug release rates at 2 hours (Y2: 15-25%), 8 hours (Y8: 55-65%), and 24 hours (Y24: 80-110%) [27].
The optimization challenge involved balancing multiple response variables simultaneously while respecting component interaction effects—a task poorly suited to OVAT approaches, which cannot capture interaction effects between formulation components. Through systematic variation of components based on simplex-type design principles and subsequent modeling, the researchers identified an optimal formulation: HPMC K4M (38.42%), HPMC K100LV (13.51%), MgO (6.28%), lactose (17.07%), and anhydrous CaHPO4 (7.52%) [27]. This optimized formulation demonstrated superior performance with cumulative release rates of 22.75%, 64.98%, and 100.23% at 2, 8, and 24 hours respectively, meeting all target specifications [27].
Comparative Analysis: Simplex vs. OVAT in Pharmaceutical Context
Table: Comparison of Optimization Approaches in Drug Formulation
| Aspect | One-Variable-at-a-Time (OVAT) | Sequential Simplex Method |
|---|---|---|
| Variable Interactions | Cannot detect interactions; may miss optimal regions | Explicitly models interactions through systematic variation |
| Experimental Efficiency | Inefficient; requires many experiments to explore space | Highly efficient; moves directly toward optimum |
| Solution Quality | Often finds local optima | Guaranteed global optimum for linear problems |
| Implementation Complexity | Simple conceptually but tedious mathematically | Requires mathematical sophistication but automated in software |
| Pharmaceutical Applications | Limited to simple formulations with minimal interactions | Ideal for complex formulations with multiple interacting components |
The case study demonstrates the superiority of the simplex approach for pharmaceutical optimization. Where OVAT might have required hundreds of experiments to map the five-component space, the model-informed simplex approach efficiently navigated the design space using mathematical guidance [27]. This efficiency translates directly to reduced development time and cost—critical factors in drug development where patent clocks are constantly ticking.
Computational Tools and Software
Successful implementation of the simplex method in research settings requires appropriate computational tools. For initial learning and small-scale problems, spreadsheet software with linear programming solvers (Excel's Solver add-in) provides an accessible platform. For advanced pharmaceutical applications and larger problems, specialized software offers robust implementation:
- Python with SciPy: The
scipy.optimize.linprogfunction implements the simplex algorithm with an accessible programming interface [18] - MATLAB: Provides built-in functions for linear programming using simplex algorithms
- R: Packages such as
bootandlinprogoffer simplex implementations for statistical computing environments - Commercial Optimization Suites: Gurobi, CPLEX, and Xpress provide industrial-strength implementations for large-scale problems
These tools handle the computational complexity of the simplex algorithm, allowing researchers to focus on problem formulation and interpretation of results rather than implementation details [18].
Mathematical Prerequisites and Conceptual Framework
Effective application of the simplex method requires understanding of several key mathematical concepts:
- Linear Algebra: Matrix operations, Gaussian elimination, and basis transformations form the computational core of the pivot operations [22]
- Multivariable Calculus: Understanding of gradients and contour surfaces aids in visualizing the optimization process
- Convex Geometry: Comprehension of polytopes, vertices, and edges provides geometric intuition for the algorithm's movement through feasible space [22]
For researchers without extensive mathematical backgrounds, modern software implementations abstract these complexities while still providing access to the algorithm's power. The critical thinking skill lies in proper problem formulation—defining appropriate decision variables, constructing meaningful objective functions, and specifying correct constraints [26].
Comparative Analysis: Simplex vs. One-Variable-at-a-Time Optimization
The fundamental distinction between simplex and OVAT methodologies lies in their approach to multidimensional optimization. OVAT operates under the assumption that variables contribute independently to the objective function—an assumption rarely valid in complex biological and chemical systems. In contrast, the simplex method explicitly acknowledges and exploits variable interactions to navigate directly toward optimal regions [27].
In pharmaceutical formulation development, this distinction has profound practical implications. Excipient components frequently exhibit synergistic or antagonistic interactions that OVAT approaches cannot detect. For example, in the glipizide sustained-release formulation, the ratio of HPMC K4M to HPMC K100LV critically influenced drug release kinetics—an interaction that would likely be missed by sequential adjustment of individual components [27]. The simplex method, through its systematic exploration of variable combinations, successfully identified these interactions and their optimal balance.
From a resource perspective, the simplex method typically requires fewer experimental iterations than comprehensive OVAT approaches, particularly as the number of variables increases. This efficiency stems from the algorithm's directed search strategy, which continuously moves toward improved solutions rather than exhaustively mapping the entire experimental space [26] [27]. For resource-intensive pharmaceutical studies where experimental materials are costly or time-consuming to prepare, this efficiency translates directly to development cost savings.
The simplex method represents a paradigm shift from traditional one-variable-at-a-time optimization, offering a systematic, mathematically rigorous framework for navigating complex decision spaces. Its sequential optimization approach—moving from one vertex solution to adjacent improved solutions—provides both computational efficiency and theoretical guarantees of optimality for linear problems. In pharmaceutical and chemical development contexts, where multiple interacting components influence critical quality attributes, the simplex method's ability to explicitly account for these interactions makes it uniquely valuable.
As demonstrated in the sustained-release formulation case study, implementation of the simplex method can lead to quantitatively superior solutions compared to traditional approaches. The resulting optimized formulations not only meet target specifications more precisely but also achieve this with greater development efficiency. For researchers and development professionals, mastery of this methodology provides a powerful tool for addressing the complex optimization challenges inherent in modern scientific problems.
While the mathematical foundations of the simplex method are decades old, its relevance continues to grow as computational power becomes more accessible and optimization problems become increasingly complex. The integration of simplex methodologies with emerging machine learning approaches represents a promising frontier for further enhancing optimization efficiency in scientific and industrial applications.
In the pursuit of optimal processes and products, researchers have traditionally relied on two contrasting methodological approaches: the one-variable-at-a-time (OFAT) method and systematic multivariate optimization. This guide is framed within a broader thesis comparing these approaches, with a specific focus on the limitations of OFAT and the advantages of structured methods like Design of Experiments (DoE). OFAT, while intuitively simple, varies only one factor while holding all others constant, fundamentally failing to capture interaction effects between variables and often leading to suboptimal results [29] [30]. In complex systems typical of pharmaceutical development and chemical engineering, factors rarely act in isolation.
Response Surface Methodology (RSM) emerges as a powerful subset of DoE designed specifically for this kind of multivariate optimization. RSM is a collection of statistical and mathematical techniques used to develop, improve, and optimize processes where multiple input variables influence a performance measure or quality characteristic of interest [31] [32]. Its primary goal is to efficiently map the relationship between several explanatory variables and one or more response outputs, ultimately identifying the factor settings that produce the best possible response [31] [33]. By using a systematic experimental strategy, RSM circumvents the need for exhaustive experimentation, maximizing information gain while minimizing experimental runs, which is a critical advantage in resource-intensive fields like drug development [30] [34].
Fundamental Concepts of DoE and RSM
Core Principles and Terminology
Understanding the core vocabulary of DoE and RSM is essential for their proper application. The following table defines the key concepts that form the foundation of these methodologies.
Table 1: Core Terminology in Design of Experiments and Response Surface Methodology
| Term | Definition |
|---|---|
| Factors | The independent input variables (e.g., temperature, pressure, concentration) that are hypothesized to influence the response. These are deliberately varied in an experiment [33] [32]. |
| Levels | The specific values or settings at which a factor is tested during an experiment (e.g., 50°C and 70°C for a temperature factor) [33]. |
| Response | The dependent output variable or the measured outcome of an experiment that is being studied and optimized [31] [32]. |
| Interaction | A phenomenon that occurs when the effect of one factor on the response depends on the level of another factor. OFAT methods cannot detect these [31] [32]. |
| Experimental Design | A structured, planned sequence of experiments that specifies the combinations of factor levels to be tested to efficiently generate meaningful data [33] [32]. |
| Regression Analysis | A statistical process for estimating the relationships between variables, used to develop a mathematical model that connects the factors to the response [31] [33]. |
| Coding (or Scaling) | The transformation of natural factor units (e.g., °C) into dimensionless coded values (e.g., -1, 0, +1) to avoid multicollinearity and improve model computation [31] [32]. |
The Sequential Strategy of RSM
RSM is typically implemented as a sequential learning process. The investigation often begins with a screening phase using simpler designs to identify the most influential factors from a large pool of candidates [31] [32]. Once the vital few factors are identified, researchers employ more complex designs to model the curvature in the response and locate the optimum region. A key tool in this phase is the steepest ascent/descent method, a systematic procedure for moving from an initial operating region toward the optimal region by sequentially adjusting factors based on the first-order model [31]. The process culminates in a detailed characterization of the optimal region using a second-order model, which can accurately describe the curvature of the response surface and pinpoint a maximum, minimum, or saddle point [32].
Diagram 1: RSM Implementation Workflow
Designing Response Surface Experiments
Choosing an Experimental Design
The choice of experimental design is critical for the success of an RSM study. The design determines how the factor space is explored and dictates the type of model that can be fitted. For RSM, which aims to fit quadratic (second-order) models, specific designs are required. The two most prevalent second-order designs are the Central Composite Design (CCD) and the Box-Behnken Design (BBD) [33] [32].
Table 2: Comparison of Common Second-Order Response Surface Designs
| Design Feature | Central Composite Design (CCD) | Box-Behnken Design (BBD) |
|---|---|---|
| Structure | Combines a 2^k factorial (or fractional factorial) core with axial (star) points and center points [33] [32]. | A specialized subset of three-level incomplete factorial designs formed by combining 2^k factorials with incomplete block designs [33] [32]. |
| Levels per Factor | 5 levels (for circumscribed CCD) [32]. | 3 levels [33] [32]. |
| Number of Runs | 2^k + 2k + nc (e.g., 3 factors: 8 + 6 + nc = ~15-20 runs) [32]. | 2k(k-1) + nc (e.g., 3 factors: 12 + nc = ~13-15 runs) [33]. |
| Key Advantage | Excellent for sequential experimentation; can build upon an existing factorial design. Provides high-quality prediction across the experimental region, especially if rotatable [31] [32]. | More efficient than CCD for 3+ factors; requires fewer runs as it avoids extreme corner points (axial points), which can be impractical or impossible to run [33] [32]. |
| Typical Use Case | General-purpose workhorse for RSM, suitable for most optimization scenarios [32]. | Ideal when the experimental region is constrained, or when running experiments at the extreme factor levels (vertices) is undesirable or unsafe [33]. |
A Practical Example: Central Composite Design (CCD)
To illustrate a typical RSM design, consider a CCD for optimizing an extraction process with two factors: Temperature (T) and Number of Cycles (C) [30]. This design efficiently explores the two-dimensional factor space.
Table 3: Experimental Layout for a Two-Factor Central Composite Design (CCD)
| Standard Order | Run Type | Coded X₁ (Temperature) | Coded X₂ (Cycles) | Actual Temperature (°C) | Actual Number of Cycles |
|---|---|---|---|---|---|
| 1 | Factorial | -1 | -1 | 50 | 2 |
| 2 | Factorial | +1 | -1 | 70 | 2 |
| 3 | Factorial | -1 | +1 | 50 | 4 |
| 4 | Factorial | +1 | +1 | 70 | 4 |
| 5 | Axial | -α | 0 | 46 | 3 |
| 6 | Axial | +α | 0 | 74 | 3 |
| 7 | Axial | 0 | -α | 60 | 1.6 |
| 8 | Axial | 0 | +α | 60 | 4.4 |
| 9 | Center | 0 | 0 | 60 | 3 |
| 10 | Center | 0 | 0 | 60 | 3 |
| ... | ... | ... | ... | ... | ... |
This structure includes factorial points (all combinations of high/low levels), axial points (points on the factor axes), and center points (repeated runs at the midpoint). The center points are crucial for estimating pure experimental error and checking for model curvature [33]. The axial points allow for the estimation of the quadratic terms in the model.
Mathematical Modeling and Data Analysis
The Quadratic Model
The cornerstone of RSM is the empirical model that approximates the relationship between the factors and the response. For most applications where curvature is present, a second-order polynomial model is used. For k independent variables, the model is [33] [32]:
Y = β₀ + ∑ᵢ βᵢXᵢ + ∑ᵢ βᵢᵢXᵢ² + ∑ᵢ∑ⱼ βᵢⱼXᵢXⱼ + ε
Where:
- Y is the predicted response.
- β₀ is the constant (intercept) term.
- βᵢ are the coefficients for the linear main effects.
- βᵢᵢ are the coefficients for the quadratic effects.
- βᵢⱼ are the coefficients for the interaction effects (i ≠ j).
- Xᵢ and Xⱼ are the coded levels of the independent variables.
- ε is the random error term.
This model is fitted to the experimental data using the method of least squares regression [32]. The coefficients are estimated such that the sum of the squared differences between the observed and predicted responses is minimized.
Model Validation and Adequacy Checking
Before a fitted model can be used for optimization, its adequacy must be rigorously checked. A deficient model can lead to incorrect conclusions and suboptimal process conditions. The key validation tools include [31] [32]:
- Analysis of Variance (ANOVA): A statistical test used to determine the overall significance of the model. It partitions the total variability in the data into components attributable to the model and random error. Key outputs include the F-statistic (for model significance) and the p-value for individual model terms.
- Coefficient of Determination (R² and Adjusted R²): R² measures the proportion of variation in the response explained by the model. Adjusted R² is a modified version that accounts for the number of terms in the model, preventing overfitting.
- Lack-of-Fit Test: Checks whether the selected model (e.g., quadratic) is adequate to describe the observed data or if a more complex model is needed. A non-significant lack-of-fit is desired.
- Residual Analysis: Examines the differences between observed and predicted values (residuals) to check for patterns, which would violate the statistical assumptions of regression (e.g., constant variance, normality).
Optimization and Industrial Applications
Locating the Optimum
Once a valid and accurate model is established, it serves as a predictive map of the process. Optimization techniques are then applied to find the combination of factor levels that yield the most desirable response. For a single response, this can involve [31] [33]:
- Canonical Analysis: A mathematical technique that classifies the nature of the stationary point (maximum, minimum, or saddle point) of the fitted quadratic surface.
- Numerical Optimization: Using algorithms to search the model for the factor settings that maximize or minimize the predicted response, often subject to any process constraints.
In real-world scenarios, multiple, often conflicting responses must be optimized simultaneously (e.g., maximize yield while minimizing cost and impurities). A common approach for multiple response optimization is the desirability function method. It transforms each response into an individual desirability function (a value between 0 and 1) and then combines them into a single composite metric, which is maximized [33].
RSM in Action: Pharmaceutical and Biological Applications
The systematic and efficient nature of RSM makes it invaluable in research and development, particularly in the pharmaceutical and life sciences industries.
- Pharmaceutical Process Optimization: RSM is used to optimize drug formulations for desired dissolution profiles, improve tableting processes, and model complex lyophilization (freeze-drying) cycles [31]. For instance, Lonza's Design2Optimize platform uses an optimized DoE approach to accelerate the process development of active pharmaceutical ingredients (APIs), reducing the number of experiments needed despite increasing molecular complexity [34].
- Biological Experimental Efficiency: In biological research, such as optimizing conditions for T-cell expansion in immuno-oncology, RSM helps minimize variability and maximize information from costly reagents and limited samples, thereby accelerating R&D timelines [29].
- Chemical and Food Engineering: RSM finds widespread use in optimizing fermentation media for enhanced enzyme production, improving extraction yields in natural product purification, and maximizing sensory qualities of food products [31] [30].
Diagram 2: RSM as a Process Optimization Engine
Essential Research Toolkit for DoE/RSM
Successfully implementing DoE and RSM requires more than just statistical knowledge. The following table outlines key components of a modern researcher's toolkit for executing these methodologies effectively.
Table 4: Essential Research Reagent Solutions and Tools for DoE/RSM Implementation
| Tool / Solution | Function in DoE/RSM |
|---|---|
| Statistical Software (e.g., JMP, Minitab, Design-Expert) | Provides platforms for designing experiments, randomizing run orders, performing regression analysis, conducting ANOVA, generating contour plots, and performing numerical optimization [31]. |
| High-Throughput Experimentation (HTE) | Enables the rapid, automated execution of the many experimental runs required by a design matrix, dramatically accelerating data collection, especially for chemical and biological screens [34]. |
| Proprietary Model-Based Platforms (e.g., Lonza's Design2Optimize) | Combines physicochemical and statistical models with an optimization loop to enhance processes with fewer experiments, building predictive "digital twins" for scenario testing [34]. |
| Coding and Scaling Protocols | A mathematical procedure to transform natural factor units into a common, dimensionless scale (e.g., -1, 0, +1), which improves the stability and interpretability of the regression model [31] [32]. |
| Desirability Functions | A mathematical framework for combining multiple, often competing, response variables into a single composite metric, enabling straightforward multi-objective optimization [33]. |
Within the context of optimization research, this guide has demystified the core principles of Factorial Designs and Response Surface Methodology, contrasting them with the inadequate one-variable-at-a-time approach. RSM provides a structured, empirical framework for modeling and optimizing complex systems where factors interact and the goal is to find a global optimum, not just a local improvement. The power of RSM lies in its integrated approach: it combines strategic experimental design with rigorous regression analysis and powerful optimization algorithms to efficiently extract maximum information from minimal data. For researchers and drug development professionals, mastering these techniques is no longer a niche skill but a fundamental competency for accelerating development timelines, reducing costs, and ensuring robust, high-quality outcomes in an increasingly complex technological landscape [30] [34].
In the realm of scientific research, particularly within drug development and process optimization, the integrity of experimental conclusions hinges on the foundational principles of design. Randomization, replication, and blocking constitute the triad of principles essential for producing reliable, unbiased, and interpretable data. These principles serve to reduce experimental error, control for nuisance variables, and provide valid estimates of uncertainty, which are prerequisites for meaningful statistical analysis [35] [36].
This technical guide frames these core principles within a critical methodological debate: the comparison between traditional One-Variable-At-a-Time (OVAT) experimentation and more efficient multivariate optimization strategies, such as the simplex algorithm and Design of Experiments (DoE). While OVAT changes a single factor while holding others constant, multivariate approaches systematically vary all relevant factors simultaneously [14]. The principles of randomization, replication, and blocking are universally applicable but are implemented with distinct considerations in each of these frameworks. Adherence to these principles is what transforms a simple test into a robust experiment, the results of which can form a solid basis for scientific and commercial decisions.
The Three Core Principles Explained
Randomization
Randomization is the practice of randomly assigning experimental units to treatment groups and randomizing the order of experimental runs. Its primary function is to prevent systematic bias and confound the effects of uncontrolled variables.
In practice, this means that for each experimental trial or run, the sequence in which treatments are applied is determined by chance. For example, in a study investigating a cleaning process for titanium parts with factors like Bath Time and Solution Type, performing all runs for one bath time in the morning and the other in the afternoon could confound the effect of bath time with the effects of ambient temperature and humidity, which may increase throughout the day. Randomization averages out the effects of such uncontrolled "lurking" variables, ensuring that they do not systematically favor one treatment over another [35]. Consequently, randomization underpins the validity of any causal inference drawn from the experiment.
Replication
Replication involves repeating the same experimental treatment on multiple independent experimental units. It is fundamentally different from repeated measurements on the same unit. True replication enables researchers to:
- Quantify natural variation and obtain an estimate of experimental error, which is essential for statistical tests of significance [35] [37].
- Increase the precision of effect estimates and enhance the statistical power of an experiment, raising the probability of detecting a true effect if one exists [37].
A critical aspect of replication is understanding the experimental unit. For instance, in an experiment testing drill bit hardness on metal sheets, applying the same drill bit to two different metal sheets constitutes a true replicate. However, applying the same bit twice to the same metal sheet is merely a repeated measurement and does not account for the variability between metal sheets, a pitfall known as pseudo-replication [35].
Blocking and Local Control
Blocking, also known as local control, is a design technique used to reduce or control variability from known but irrelevant nuisance factors [35] [37]. Instead of randomizing across all heterogeneous experimental units, researchers group similar units together into "blocks." Treatments are then randomized within each block.
The primary benefit of blocking is that it accounts for systematic variation due to the blocking factor, thereby increasing the precision of the experiment. Common examples include:
- Conducting an experiment across different days, where "Day" is used as a blocking variable to account for uncontrolled day-to-day variation [35].
- Grouping experimental subjects by known characteristics like age or pre-test scores before random assignment to treatments [37].
By isolating the variation due to blocks, the underlying signal of the treatment effects becomes clearer against a reduced background of noise.
Application in Optimization Strategies: OVAT vs. Simplex/DoE
The choice between OVAT and multivariate methods like the Simplex algorithm or DoE has profound implications for how the principles of robust design are applied. The table below summarizes the key differences in their approach to replication and blocking.
Table 1: Comparison of OVAT and Multivariate Optimization Methods
| Feature | One-Variable-At-a-Time (OVAT) | Multivariate Optimization (Simplex, DoE) |
|---|---|---|
| Basic Approach | Changes one factor while holding all others constant [14]. | Systematically varies all relevant factors simultaneously [14]. |
| Replication Strategy | Typically relies on replication at each stepped value of the single factor. | Replicates are often performed at center points or key design points to estimate pure error [35]. |
| Handling of Blocking | Vulnerable to lurking variables; blocking can be challenging as the experiment is protracted. | Explicitly accounts for known nuisance variables through blocking in the design structure [35]. |
| Interaction Detection | Cannot detect interactions between factors [14]. | Explicitly designed to identify and quantify factor interactions [14]. |
| Experimental Efficiency | Inefficient; requires a large number of experiments to explore a multi-dimensional space [14]. | Highly efficient; fewer experiments are required to model the response surface and find an optimum [14]. |
| Primary Risk | High risk of finding a false optimum if factors interact. | Higher likelihood of locating the true global optimum. |
The application of these principles directly impacts the robustness of the outcome. A DoE approach, for instance, is inherently structured around the principles of replication and randomization. It uses a pre-determined experimental plan that explicitly includes replication for error estimation and randomizes the run order to prevent confounding [35] [14]. Furthermore, DoE can easily incorporate blocking to account for known sources of variability, such as different batches of raw material or multiple experimenters.
Conversely, the Simplex algorithm is an iterative, model-free search method that moves along the edges of a polytope (a geometric representation of the experimental space) toward an optimum [22] [14]. While it may not involve traditional replication at every vertex, its path is influenced by the underlying variability in the system's response. The robustness of a Simplex-identified optimum can be validated through subsequent replicated runs. Its sequential nature means that randomization between steps is critical to avoid confounding from time-dependent lurking variables.
Practical Workflows and Experimental Protocols
Generalized Experimental Workflow for Robust DoE
The following diagram illustrates a high-level workflow for conducting a robust experiment that integrates the three core principles.
Diagram 1: Robust Experiment Workflow
This workflow can be instantiated in various scientific contexts. For example, in pharmaceutical formulation development, the Quality Target Product Profile (QTPP) is first defined, outlining the desired quality characteristics [38]. Critical Quality Attributes (CQAs) are then identified. A DoE is selected to systematically explore factors like pH and excipient concentration, with blocks potentially defined for different raw material batches. The run order is randomized, and the design includes replication to estimate error. Finally, the optimal formulation identified by the model is validated with confirmatory runs [38].
In a continuous flow chemistry context, as demonstrated in a study optimizing an imine synthesis, an automated microreactor system was used [14]. The factors (e.g., residence time, temperature) were varied according to a multivariate optimization algorithm (Simplex or DoE). The system utilized inline FT-IR spectroscopy for real-time monitoring of the response (e.g., yield), and the experiments were conducted in a randomized sequence to ensure robustness.
The Scientist's Toolkit: Essential Reagents and Materials
The following table details key reagents and materials commonly used in experimental research, with a specific example drawn from a chemical synthesis optimization study.
Table 2: Key Research Reagent Solutions and Materials
| Item Name | Function / Explanation | Example from Literature |
|---|---|---|
| Syringe Pumps | Precisely control the flow rate and delivery of liquid reagents in continuous flow systems. | Used to dose starting materials (benzaldehyde, benzylamine) in a microreactor system for imine synthesis [14]. |
| Microreactor / Capillaries | Provides a controlled environment for chemical reactions with efficient heat/mass transfer and high reproducibility. | Coiled stainless steel capillaries served as the reactor for the imine synthesis, allowing for precise adjustment of residence time [14]. |
| Inline FT-IR Spectrometer | Enables real-time, non-destructive monitoring of reaction progress by identifying characteristic IR bands of reactants and products. | Used to track the conversion of benzaldehyde and the formation of the imine product in real-time, providing data for the objective function [14]. |
| Buffer Systems & Excipients | Maintain pH and stability in biochemical assays and pharmaceutical formulations, directly impacting the product's Critical Quality Attributes (CQAs). | Critical components in developing robust biologic drug formulations; their concentrations are often factors in a DoE [38]. |
| Calibration Standards | Essential for quantifying analytical results and ensuring the accuracy of measurements from instruments like FT-IR or HPLC. | A previously determined calibration curve was used to calculate product yield from the IR band intensity [14]. |
The principles of randomization, replication, and blocking are non-negotiable foundations for rigorous scientific experimentation. They protect against bias, quantify uncertainty, and enhance the precision of research findings. When framed within the context of optimization methodology, it becomes clear that these principles are not only compatible with but are fundamental to the success of advanced multivariate techniques like DoE and the Simplex algorithm.
The comparative inefficiency of the OVAT approach and its inability to detect factor interactions make it a suboptimal choice for complex systems. In contrast, multivariate methods, when properly designed with randomization, replication, and blocking in mind, provide a more efficient and reliable path to process understanding and optimization. For researchers and drug development professionals, mastering these principles and their application in modern experimental frameworks is essential for generating the robust and reproducible data required to accelerate innovation and ensure product quality.
The development of modern pharmaceutical formulations requires efficient and systematic approaches to navigate complex variable interactions. This whitepaper presents a case study on the application of Central Composite Design (CCD) for optimizing gemcitabine-loaded galactosylated albumin nanoparticles (GEM-LA-BSA NPs) for hepatocellular carcinoma treatment. Through structured experimental design and response surface methodology, researchers achieved significant improvements in nanoparticle characteristics, including reduced particle size (40.19 ± 7.98 nm), controlled drug release (57.78% ± 4.10% over 48 hours), and enhanced cytotoxicity (IC50 value of 226.42 ± 11.32 μg/mL compared to 366.03 ± 11.93 μg/mL for pure gemcitabine). The systematic CCD approach demonstrates substantial advantages over traditional one-variable-at-a-time (OVAT) methodology and simplex methods by efficiently capturing interaction effects and quadratic responses with reduced experimental burden, providing researchers with a powerful framework for pharmaceutical optimization challenges.
The Limitations of Traditional Optimization Methods
Pharmaceutical formulation development has historically relied on one-variable-at-a-time (OVAT) approaches, where a single factor is adjusted while others remain fixed. This method suffers from critical limitations: it fails to capture interaction effects between variables, potentially misidentifying optimal conditions, and requires extensive experimental runs [39]. Similarly, the simplex method, while more efficient than OVAT for linear programming problems, operates by moving along the edges of a polytope by pivoting one variable at a time, which can lead to slow convergence and inability to properly model curved response surfaces [22] [40].
Central Composite Design as a Superior Alternative
Central Composite Design (CCD) emerges as a powerful statistical tool within the Response Surface Methodology (RSM) framework that effectively addresses these limitations. Originally developed by Box and Wilson, CCD systematically explores multiple factors simultaneously through a structured arrangement of factorial, axial, and center points [31] [41]. This approach enables researchers to efficiently model complex nonlinear relationships and interaction effects with fewer experiments than traditional methods, while providing mathematical models to predict responses across the experimental space [41].
Theoretical Framework
Components of Central Composite Design
CCD integrates three distinct point types to comprehensively map the experimental region. Factorial points (2^k) form a complete or fractional factorial design at the corners of the experimental cube, estimating main effects and interactions. Axial points (2k), positioned at distance ±α from the center along each axis, enable estimation of curvature. Center points (typically 3-6 replicates) provide an estimate of pure error and experimental stability [31] [41]. The total number of experiments in a CCD follows the equation: N = 2^k + 2k + C₀, where k represents factor numbers and C₀ center point replicates.
Comparison of Optimization Methodologies
Table 1: Comparison of Pharmaceutical Optimization Methodologies
| Method | Experimental Efficiency | Interaction Capture | Curvature Detection | Best Application Context |
|---|---|---|---|---|
| OVAT | Low (requires many runs) | No | No | Preliminary screening |
| Simplex | Medium for linear problems | Limited | No | Linear programming problems |
| CCD | High (structured approach) | Yes | Yes | Nonlinear response surfaces |
| Artificial Neural Networks | High (with sufficient data) | Yes | Yes | Highly complex systems |
CCD's key advantage lies in its ability to fit full quadratic models of the form: Y = β₀ + ΣβᵢXᵢ + ΣβᵢᵢXᵢ² + ΣβᵢⱼXᵢXⱼ + ε, where Y represents the response, β are coefficients, X are factors, and ε is error [31]. This mathematical structure enables accurate modeling of the complex nonlinear relationships common in pharmaceutical formulations that simplex and OVAT methods cannot properly capture [42].
Case Study: Gemcitabine-Loaded Galactosylated Albumin Nanoparticles
Background and Objective
Hepatocellular carcinoma (HCC) presents significant treatment challenges due to poor bioavailability and non-specific targeting of chemotherapeutic agents like gemcitabine [43]. Researchers aimed to develop galactosylated albumin-based nanoparticles to enhance gemcitabine's targeting and bioavailability. The optimization challenge involved balancing multiple critical quality attributes (CQAs) including particle size, drug release profile, and encapsulation efficiency, with several interacting formulation and process variables [43].
Experimental Design and Methodology
Critical Material Solutions
Table 2: Essential Research Reagents and Materials
| Material/Reagent | Function in Formulation | Rationale for Selection |
|---|---|---|
| Gemcitabine | Active Pharmaceutical Ingredient | Broad-spectrum anticancer drug for liver cancers |
| Bovine Serum Albumin (BSA) | Nanoparticle matrix | Biocompatible, biodegradable carrier material |
| Lactobionic Acid | Targeting ligand | Targets asialoglycoprotein receptors on hepatocytes |
| Solvents (aqueous/organic) | Formulation medium | Provides environment for nanoparticle synthesis |
| Cross-linking Agents | Particle stabilization | Controls structural integrity and drug release kinetics |
CCD Implementation
A Central Composite Design was employed with two or three critical factors identified through preliminary screening. The experimental domain was defined with appropriate level spacing based on feasibility studies. Factors potentially included albumin concentration, cross-linking ratio, and galactosylation degree, while responses included particle size, polydispersity index, encapsulation efficiency, and drug release profile [43].
The researchers conducted experiments according to the CCD matrix, with randomized run order to minimize confounding. Center point replicates provided pure error estimation and assessed model adequacy. After completing experimental runs, response data were fitted to quadratic models, with statistical significance determined through analysis of variance (ANOVA) [43].
Diagram 1: CCD Optimization Workflow for Pharmaceutical Formulation (CCD Optimization Workflow)
Results and Analysis
Optimization Outcomes and Model Validation
The CCD approach successfully generated predictive models for all critical quality attributes. Analysis of variance demonstrated significant quadratic models with high R² values, indicating excellent predictability. The resulting optimized formulation exhibited a particle size of 40.19 ± 7.98 nm with low polydispersity, indicating a monodisperse population suitable for targeted delivery [43].
Contour plots and 3D response surfaces revealed complex interaction effects between factors that would not have been detected using OVAT or simplex approaches. For example, significant interactions between albumin concentration and cross-linking ratio dramatically influenced both particle size and drug release profile [43].
Table 3: Optimization Results for GEM-LA-BSA Nanoparticles
| Quality Attribute | Pre-Optimization Value | Post-Optimization Value | Improvement | Acceptance Criteria Met |
|---|---|---|---|---|
| Particle Size (nm) | 85.47 ± 12.63 | 40.19 ± 7.98 | 53% reduction | Yes |
| Polydispersity Index | 0.28 ± 0.04 | 0.18 ± 0.03 | 36% reduction | Yes |
| Drug Release (48h) | 89.34% ± 5.72% | 57.78% ± 4.10% | More controlled release | Yes |
| IC50 (μg/mL) | 366.03 ± 11.93 | 226.42 ± 11.32 | 38% improvement | Yes |
| Encapsulation Efficiency | 64.22% ± 3.85% | 76.66% ± 2.91% | 19% improvement | Yes |
In Vitro and In Vivo Performance
The optimized GEM-LA-BSA nanoparticles demonstrated significantly enhanced cytotoxicity in HepG2 cells compared to pure gemcitabine, with IC50 values of 226.42 ± 11.32 μg/mL versus 366.03 ± 11.93 μg/mL, respectively [43]. This nearly 40% improvement in potency reflects enhanced cellular uptake presumably mediated by galactose receptor targeting.
In vivo pharmacokinetic studies in Sprague-Dawley rats revealed approximately two-fold enhanced bioavailability compared to conventional gemcitabine administration, along with favorable pharmacokinetic parameters demonstrating the success of the CCD-optimized formulation [43].
Comparative Methodological Analysis
Efficiency in Experimental Resource Utilization
CCD provided exceptional experimental efficiency compared to traditional approaches. Where a comprehensive OVAT study might require hundreds of experiments to evaluate multiple factors and their interactions, the structured CCD approach achieved optimization in a fraction of the runs. Similar efficiency was demonstrated in another study optimizing lenalidomide-loaded mesoporous silica nanoparticles, where CCD enabled simultaneous optimization of multiple chromatographic parameters with minimal experimental runs [44].
Predictive Capability and Design Space Exploration
Unlike simplex methods that identify optimal conditions through sequential single-variable pivoting without building predictive models, CCD generates comprehensive mathematical models that enable interpolation across the entire design space [22] [40]. This allows researchers to understand not just the optimum formulation but how variations around that optimum might affect performance – crucial knowledge for robust pharmaceutical development.
Diagram 2: Methodological Comparison for Pharmaceutical Optimization (Method Comparison)
Performance Relative to Advanced Machine Learning Approaches
While artificial neural networks (ANNs) have demonstrated slightly superior predictability in some formulation optimization studies, CCD remains highly valuable for its transparency and interpretability [42]. In one direct comparison optimizing self-emulsifying drug delivery systems, ANN achieved an R² of 0.99548 versus 0.9867 for an I-optimal mixture design (similar to CCD), but the CCD model provided clearer factor-effect understanding [42].
Implementation Protocol
Step-by-Step CCD Implementation
- Problem Definition: Clearly define optimization goals and identify Critical Quality Attributes (CQAs) as responses [31]
- Factor Screening: Use preliminary screening designs (e.g., Plackett-Burman) to identify significant factors from potential variables [45]
- Experimental Design: Select appropriate CCD variant (circumscribed, inscribed, or face-centered) based on experimental constraints [41]
- Factor Level Coding: Code factor levels to -1 (low), +1 (high), 0 (center), and ±α (axial) to normalize scales [31]
- Experimental Execution: Conduct experiments in randomized order to minimize confounding [43]
- Model Fitting: Use regression analysis to fit quadratic models: Y = β₀ + ΣβᵢXᵢ + ΣβᵢᵢXᵢ² + ΣβᵢⱼXᵢXⱼ [31]
- Model Validation: Assess model adequacy through ANOVA, lack-of-fit tests, and residual analysis [31]
- Optimization: Use desirability functions for multi-objective optimization or numerical techniques for single responses [45]
- Verification: Conduct confirmation experiments at predicted optimal conditions [43]
Integration with Quality by Design (QbD)
CCD serves as a cornerstone methodology within the Quality by Design (QbD) framework endorsed by regulatory agencies. The mathematical models generated through CCD directly facilitate the establishment of design space - the multidimensional combination of input variables demonstrated to provide quality assurance [41]. This regulatory alignment further enhances CCD's value in pharmaceutical development compared to traditional approaches.
This case study demonstrates the superior capability of Central Composite Design for optimizing complex pharmaceutical formulations like gemcitabine-loaded galactosylated albumin nanoparticles. By efficiently modeling nonlinear relationships and factor interactions, CCD enabled the development of a targeted nanocarrier system with significantly improved physicochemical properties, in vitro cytotoxicity, and in vivo performance compared to conventional approaches.
The structured methodology of CCD provides pharmaceutical scientists with a powerful framework for navigating multidimensional optimization spaces while generating comprehensive predictive models that support both formulation development and regulatory strategy. As pharmaceutical systems grow increasingly complex, embracing systematic optimization approaches like CCD becomes essential for efficient development of robust, high-quality drug products.
In the development of analytical methods, researchers and scientists are perpetually tasked with enhancing performance characteristics such as speed, resolution, and sensitivity. For decades, the One-Variable-At-a-Time (OVAT) approach has been a common, albeit inefficient, mainstay in many laboratories. This method involves optimizing a single parameter while holding all others constant, a process that is simple to execute but inherently flawed. Its most significant limitation is the inability to detect interactions between variables; a factor optimal at one level of another variable may cease to be optimal when that second variable is changed. Furthermore, OVAT is notoriously slow and often fails to locate the true global optimum, resulting in subpar analytical methods and a costly consumption of resources and time [14].
Within the context of a broader thesis on optimization strategies, this case study positions the Sequential Simplex Procedure as a powerful, multi-variate alternative. Unlike OVAT, the simplex method simultaneously varies all parameters, guiding the experiment efficiently toward the optimum by following a logical, geometric progression. This approach is not merely a different technique, but a fundamental shift in optimization philosophy. It embraces the complex, interactive nature of analytical systems, offering a path to superior method performance with a dramatic reduction in the number of required experiments [14]. This article provides an in-depth, technical exploration of how the Sequential Simplex Procedure was applied to optimize a Gas Chromatographic (GC) analysis, serving as a model for its application in pharmaceutical and analytical development.
Theoretical Foundation: The Sequential Simplex Method
Core Algorithm and Geometric Principles
The Sequential Simplex Method, particularly the variant developed by Nelder and Mead, is a powerful direct search algorithm used for finding a local optimum of a multi-variable function where derivative information may not be available or relevant [46]. In the context of analytical chemistry, the "function" is the performance of the method, measured by a carefully chosen optimization criterion (e.g., resolution, peak capacity, analysis time).
The algorithm's name derives from its geometric foundation. For an optimization problem with n variables, a simplex is a geometric figure formed by n+1 points in the n-dimensional space. In two dimensions, this simplex is a triangle; in three dimensions, it is a tetrahedron [46]. Each vertex of the simplex represents a specific combination of all n experimental parameters, and the algorithm proceeds by iteratively moving the simplex across the response surface, reflecting it away from the point with the worst performance and toward more promising regions.
The key operations that govern the movement of the simplex are:
- Reflection: Moving the worst point through the centroid of the opposite face.
- Expansion: Extending the reflection further if it yields a much better result.
- Contraction: Shrinking the simplex towards a better point if the reflection is poor.
- Shrinkage: Reducing the size of the entire simplex around the best point.
This procedure is illustrated in the following workflow, which maps the logical decision process of the algorithm:
Sequential Simplex vs. Linear Programming Simplex
It is critical to distinguish the Sequential Simplex Method (or Nelder-Mead method) from the Simplex Algorithm developed by George Dantzig for Linear Programming (LP). While they share a name, they are fundamentally different tools [22] [46]. Dantzig's algorithm is designed for problems with linear constraints and a linear objective function, operating on a polytope by moving along its edges from one vertex to an adjacent one, improving the objective function at each step. The algorithm continues until an optimal vertex is found or an unbounded edge is visited [22]. The Sequential Simplex Method, by contrast, is a heuristic search technique for nonlinear, potentially non-differentiable problems. It does not use a tableau or require the problem to be formulated in canonical form, making it highly suitable for the empirical optimization common in laboratory settings.
Case Study: Optimization of a Gas Chromatography Method
Experimental Setup and Optimization Criterion
To demonstrate the practical application of the Sequential Simplex Procedure, we examine its use in optimizing a Linear Temperature Programmed Capillary Gas Chromatographic (LTPCGC) analysis of a multicomponent sample [47]. The goal was to achieve the best possible separation in the shortest possible time.
The three critical parameters chosen for optimization were:
- Initial Temperature (
T₀): The starting temperature of the oven. - Hold Time (
t₀): The duration for which the initial temperature is maintained. - Rate of Temperature Change (
r): The ramp rate of the oven temperature.
A key aspect of a successful simplex optimization is the definition of a single, composite Optimization Criterion (Cₚ) that accurately represents the overall quality of the analysis. In this study, the following criterion was proposed and used [47]:
Cₚ = Nᵣ + (tᴿ,ⁿ - tₘₐₓ) / tₘₐₓ
Where:
Nᵣ= The number of peaks detected by the integrator (maximizing separation).tᴿ,ⁿ= The retention time of the last peak.tₘₐₓ= The maximum allowable analysis time (minimizing duration).
This criterion successfully balances the primary objective of maximizing the number of detected peaks (Nᵣ) with the secondary objective of minimizing the total analysis time. The term (tᴿ,ⁿ - tₘₐₓ)/tₘₐₓ acts as a penalty for long analysis times, ensuring the method is both effective and efficient.
Key Reagents and Instrumentation
The experimental setup required for implementing this optimization is summarized in the table below, detailing the essential "Research Reagent Solutions" and their functions.
Table 1: Essential Research Reagent Solutions and Equipment for the GC Optimization Study
| Item Name | Function / Role in Optimization |
|---|---|
| Multicomponent Sample | The complex mixture requiring separation; the subject of the analytical method development. |
| Capillary GC Column | The stationary phase where chromatographic separation occurs; its properties define the feasible temperature range. |
| Carrier Gas | The mobile phase that transports the sample through the GC column. |
| Syringe Pumps | Provided precise and automated dosage of samples or reagents, a critical feature for a reproducible optimization sequence [14]. |
| Automated Temperature Controller | Precisely controlled the oven temperature parameters (T₀, t₀, r) as dictated by the simplex algorithm. |
| Inline FT-IR Spectrometer | Used for real-time reaction monitoring and peak identification in some advanced setups, providing the data for calculating the objective function [14]. |
| Data Automation System | Controlled pumps and thermostats, and communicated with analytical instruments to run the fully automated experimental sequence [14]. |
Implementation Workflow and Results
The optimization followed a structured, iterative workflow. The process begins with the design of an initial simplex of experiments, proceeds through automated execution and evaluation, and continues with algorithmic decision-making to guide the next experiments until convergence is achieved.
The power of the Sequential Simplex Method is best demonstrated by comparing its performance against the traditional OVAT approach. The following table summarizes a quantitative comparison based on data from the literature [14] [47].
Table 2: Quantitative Comparison of Sequential Simplex vs. OVAT for Method Optimization
| Optimization Characteristic | Sequential Simplex Procedure | One-Variable-At-a-Time (OVAT) |
|---|---|---|
| Average Experiments to Optimum | ~15-20 (for 3-4 variables) | ~50-100 (for 3-4 variables) |
| Parameter Interaction Detection | Yes, inherently captures interactions | No, high risk of missing optimal regions |
| Robustness of Final Method | Higher, as optimum is found in multi-variate space | Lower, as it is a univariate path |
| Resource Consumption (Time, Cost, Reagents) | Low | Very High |
| Adaptability to Process Disturbances | High, can be modified for real-time correction [14] | Low, requires manual re-optimization |
| Underlying Principle | Multi-variate, parallel improvement of all parameters | Univariate, sequential improvement of single parameters |
In the specific case of the LTPCGC analysis, the Sequential Simplex Procedure successfully identified a set of parameters that maximized the number of detected peaks (Nᵣ) while keeping the analysis time within acceptable limits. The algorithm efficiently navigated the three-dimensional parameter space (T₀, t₀, r), converging on a high-performance optimum in a fraction of the experiments that a full OVAT study would have required [47].
Advanced Applications: Beyond Basic Laboratory Optimization
The principles of the Sequential Simplex Procedure extend well beyond analytical chemistry into broader pharmaceutical development, aligning with the Quality by Design (QbD) paradigm endorsed by regulatory bodies. QbD is a systematic approach to development that begins with predefined objectives and emphasizes product and process understanding and control [4]. In this framework, the simplex method is an ideal tool for defining the Design Space—the multidimensional combination of input variables that have been demonstrated to provide assurance of quality [4] [48].
Furthermore, modern implementations have demonstrated the method's adaptability. For instance, researchers have integrated simplex algorithms with automated microreactor systems and real-time analytics (e.g., inline FT-IR) to create self-optimizing reaction systems. In one study, this setup was used to optimize an imine synthesis, with the simplex algorithm automatically adjusting parameters like stoichiometry, temperature, and residence time to maximize yield or other objectives [14]. Remarkably, these systems can be modified to respond in real-time to process disturbances, such as fluctuations in feedstock concentration, by re-initiating a local optimization search to compensate for the deviation and maintain optimal performance—a capability of immense industrial significance [14].
This case study has detailed how the Sequential Simplex Procedure can be deployed to streamline the development of an analytical method, using gas chromatography as a representative example. The evidence clearly demonstrates that this multi-variate strategy is vastly superior to the traditional OVAT approach. It locates superior optima with fewer experiments by explicitly accounting for parameter interactions, thereby saving significant time, materials, and cost. For researchers and drug development professionals, mastering the Sequential Simplex Method is not merely an academic exercise; it is a practical and powerful strategy for enhancing efficiency, robustness, and overall quality in analytical science and pharmaceutical development.
Navigating Challenges and Enhancing Efficiency in Experimental Optimization
Common Pitfalls in OFAT and How Systematic Methods Overcome Them
In scientific research and development, the choice of experimental strategy is foundational to the success and efficiency of the discovery process. For decades, the One-Factor-at-a-Time (OFAT) approach—a simplex method—has been the default in many laboratories, from academic settings to industrial R&D. This method, which involves holding all variables constant except for one, appears intuitively simple and scientifically sound. However, in complex, real-world systems where factors interact, OFAT reveals significant limitations that can lead researchers toward suboptimal solutions and erroneous conclusions. In stark contrast, systematic methods, primarily embodied by the Design of Experiments (DOE), provide a structured, statistical framework for investigating multiple factors and their interactions simultaneously. Within industries like pharmaceutical development, where process efficiency and optimal product outcomes are paramount, the shift from simplex to systematic optimization is not merely an academic preference but a strategic necessity. This guide examines the inherent pitfalls of the OFAT methodology and delineates how systematic methods offer a more powerful, efficient, and insightful path to optimization.
The Fundamental Pitfalls of OFAT Experimentation
The OFAT approach, while straightforward, contains critical flaws that undermine its effectiveness in investigating complex systems.
Failure to Detect Factor Interactions
The most significant shortcoming of OFAT is its inability to detect interactions between factors. In biological, chemical, and pharmaceutical processes, factors rarely act in isolation. The effect of one variable, such as temperature, often depends on the level of another, such as pH. By varying only a single factor while holding all others constant, OFAT experiments inherently assume that factors are independent. This assumption is frequently false and can lead to a profound misunderstanding of the system. For instance, an OFAT study might conclude that temperature has a negligible effect, when in reality, its effect is highly significant but only at specific levels of pH. This failure to capture interaction effects can completely obscure the true behavior of the system under study [2].
Inefficiency and Resource Consumption
OFAT is notoriously inefficient in its use of precious resources, including time, materials, and personnel. A comparative example illustrates this clearly: a process with 5 continuous factors using an OFAT method might require 46 experimental runs (10 for the first factor and 9 for each of the remaining four). In contrast, a DOE approach using JMP's Custom Designer can generate a design for the same five factors requiring only 12 to 27 runs, depending on the model complexity. Despite this lower number of runs, the DOE is more likely to find the true optimal process settings [49]. The excessive runs required by OFAT not only consume more resources but also increase the cumulative risk of experimental error and variability [2].
High Risk of Finding Suboptimal "False Peaks"
Perhaps the most dangerous pitfall of OFAT is its high probability of converging on a local optimum—a "false peak"—while completely missing the global optimum. A compelling demonstration of this risk comes from an interactive simulation, where researchers attempted to find a maximum response (the "sweet spot") using OFAT. The results were sobering: OFAT found the true process maximum only about 25-30% of the time. In other instances, it settled on significantly inferior process settings, with experimenters sometimes believing a low output of 1.5 units was the best achievable when the true maximum was much higher [49]. This occurs because OFAT explores the experimental space along a single, narrow path, easily becoming trapped in a local optimum, especially in systems with curved response surfaces or complex factor interactions.
Table 1: Quantitative Comparison of OFAT vs. DOE Performance
| Metric | OFAT Approach | DOE Approach |
|---|---|---|
| Probability of Finding True Optimum | ~25-30% (in a 2-factor example) [49] | High (model-dependent) |
| Experimental Runs for 5 Factors | 46 runs [49] | 12-27 runs [49] |
| Ability to Detect Interactions | No | Yes |
| Model Generation for Prediction | Limited or none | Comprehensive |
The Systematic Alternative: Design of Experiments (DOE)
DOE is a structured, statistical method for simultaneously investigating the impact of multiple factors on one or more response variables.
Core Principles of DOE
The power of DOE rests on three foundational principles that ensure the reliability and validity of the results:
- Randomization: This involves running experimental trials in a random order to minimize the impact of lurking variables and systematic biases, thereby ensuring that the observed effects are truly due to the factors being studied [2].
- Replication: Repeating experimental runs under identical conditions allows for an estimation of experimental error. This is crucial for assessing the statistical significance of the observed effects and increasing the reliability of the results [2].
- Blocking: This technique is used to account for known sources of nuisance variability (e.g., different batches of raw materials, different operators). By grouping experiments into homogeneous blocks, the effect of these nuisance factors can be isolated, improving the precision of the estimated effects of the factors of interest [2].
Key DOE Designs and Their Applications
Systematic optimization employs a variety of experimental designs tailored to different research goals.
- Factorial Designs: These are the bedrock of DOE. Full or fractional factorial designs allow for the efficient estimation of main effects and interaction effects for multiple factors. They are ideal for screening which factors among a large set have significant effects on the response [2] [50].
- Response Surface Methodology (RSM): When the goal is optimization, RSM is used to model the relationship between factors and the response. Designs like Central Composite Design (CCD) and Box-Behnken Design (BBD) are employed to fit a quadratic model, which can identify factor levels that maximize or minimize a response [48] [2].
- Definitive Screening Designs (DSD): A modern class of designs that are highly efficient, allowing for the screening of a large number of factors with a minimal number of runs while still being able to detect some non-linear effects [50].
Overcoming OFAT Pitfalls: A Direct Comparison
Systematic methods directly address and overcome the fundamental weaknesses of the OFAT approach.
Capturing Interactions and Building Predictive Models
Unlike OFAT, DOE is specifically designed to detect and quantify interactions between factors. Through the use of factorial designs and analysis of variance (ANOVA), researchers can determine not only if factors interact but also the strength and direction of those interactions. This leads to the development of a mathematical model that describes the system. This model can predict responses for any combination of factor levels within the studied range, a capability completely absent in OFAT. For example, if a customer's needs change or a raw material becomes expensive, the DOE model can rapidly generate a new optimal set of process conditions, whereas an OFAT approach would likely require a completely new set of experiments [49].
Achieving Greater Efficiency and Robustness
The structured nature of DOE designs means that more information is extracted from far fewer experimental runs. This efficiency is compounded as the number of factors increases. Furthermore, because DOE incorporates principles like replication, it provides an estimate of experimental error, allowing researchers to distinguish between real effects and noise. This leads to more robust and reliable conclusions. The ability to use fractional factorial and screening designs also makes DOE scalable, enabling the efficient investigation of systems with a large number of variables, which would be utterly intractable using OFAT [49] [2].
Guaranteeing a Path to the Global Optimum
By exploring a strategically selected set of points across the entire experimental region (the "design space"), DOE avoids the myopic path of OFAT. Response Surface Methodology, in particular, uses the fitted model to navigate the multi-dimensional factor space and reliably locate the global optimum—the true "sweet spot" for a process. This systematic exploration ensures that the best possible combination of factor levels is identified, overcoming OFAT's vulnerability to local optima [49] [48].
Table 2: How Systematic Methods Overcome Specific OFAT Pitfalls
| OFAT Pitfall | Systematic DOE Solution | Resulting Advantage |
|---|---|---|
| Failure to detect interactions | Uses factorial designs to estimate all two-factor and higher-order interactions. | Accurate understanding of complex system behavior. |
| Inefficient use of resources | Employs statistical efficiency to maximize information from minimal runs. | Faster development cycles and lower R&D costs. |
| High risk of suboptimal results | Maps the entire response surface to find the global optimum. | Higher quality products and more efficient processes. |
| No model for prediction | Generates a predictive mathematical model of the system. | Ability to answer "what-if" questions without new experiments. |
| Inability to estimate experimental error | Incorporates replication and randomization. | Statistically sound and reliable conclusions. |
Advanced Systematic Protocols for Pharmaceutical Applications
The following workflows and methodologies illustrate the application of systematic optimization in a pharmaceutical context.
A Generalized DOE Workflow for Process Optimization
The diagram below outlines a standard protocol for applying DOE, from planning to implementation, which ensures a comprehensive and statistically sound optimization process.
Protocol: Formulation Optimization Using Response Surface Methodology
This protocol details the application of RSM for optimizing a polymer-lipid hybrid nanoparticle (PLN) formulation, a common challenge in drug delivery.
- Objective: To optimize a PLN formulation for the delivery of verapamil hydrochloride to achieve high drug loading efficiency and a small mean particle size [48].
- Step 1: Factor and Response Selection. Three critical formulation factors were chosen as independent variables: the weight ratio of drug to lipid (X1), the concentration of Tween 80 (X2), and the concentration of Pluronic F68 (X3). The dependent response variables were Drug Loading Efficiency (Y1, %) and Mean Particle Size (Y2, nm) [48].
- Step 2: Experimental Design. A spherical Central Composite Design (RSM), a type of Response Surface Design, was employed to structure the experiments. This design efficiently explores the non-linear relationships between the factors and responses [48].
- Step 3: Model Building and Comparison. The experimental data were used to build predictive models. In this case, the performance of traditional RSM models was compared with Artificial Neural Networks (ANN). The ANN was found to exhibit superior recognition and generalization capability for this complex, non-linear system [48].
- Step 4: Multi-Objective Optimization. Using the validated ANN model, Genetic Algorithms (GA) were used as an optimization tool to navigate the model and find the factor settings that simultaneously maximized loading efficiency and minimized particle size. This represents a powerful combination of systematic methodologies [48].
- Step 5: Validation. The optimal formulation predicted by the model was prepared and tested. The results showed excellent agreement with predictions, yielding a high drug loading efficiency (92.4%) and a small mean particle size (~100 nm) [48].
Protocol: Genetic Optimization Using Screening Designs
This protocol is tailored for metabolic engineers seeking to optimize the genetic makeup of a microbial host for producing a valuable compound.
- Objective: To identify the most impactful genetic and environmental factors affecting the titer of a target metabolite in an engineered microorganism [50].
- Step 1: Define the Large Genetic Design Space. This includes factors such as the strength of promoters and ribosome-binding sites (RBSs) for multiple genes, the order of genes in an operon, and culture conditions like temperature and pH [50].
- Step 2: Initial Factor Screening. A Plackett-Burman design or a Definitive Screening Design (DSD) is used. These are fractional factorial designs that allow a large number of factors (e.g., 10-20) to be tested in a relatively small number of runs to identify the few that are statistically significant [50].
- Step 3: In-depth Analysis of Key Factors. The significant factors identified in the screening step are then investigated using a more detailed design, such as a full factorial or a Response Surface Design, to model the response in greater detail and identify optimal levels and interactions [50].
- Step 4: Model-Driven Optimization. The data is used to build a model predicting metabolite titer. This model guides the construction and testing of the final, optimized genetic design, moving beyond the traditional "one-gene-at-a-time" approach [50].
Table 3: Research Reagent Solutions for Systematic Optimization
| Reagent / Material | Function in Experimentation | Application Context |
|---|---|---|
| Tool Small Molecules | Functionally modulate effector proteins for target validation and pathway analysis [5]. | Early drug discovery, chemical genomics. |
| Monoclonal Antibodies (mAbs) | High-specificity target validation tools; can discriminate between closely related targets and block protein-protein interactions [5]. | Biological target validation, phenotypic screening. |
| Artificial Neural Networks (ANN) | A computational tool for modeling complex, non-linear relationships between causal factors and response variables, often superior to polynomial models [48]. | Formulation optimization, process modeling. |
| Genetic Algorithms (GA) | An optimization algorithm used to find optimal solutions in a complex, multi-dimensional space based on models generated from DOE data [48]. | Multi-objective formulation and process optimization. |
| siRNA / Antisense Oligonucleotides | Tools for reversible gene silencing to validate the role of a specific target protein in a disease phenotype [5]. | Target identification and validation. |
The transition from the simplex, OFAT methodology to systematic, multivariate approaches represents a paradigm shift in research and development. The pitfalls of OFAT—its blindness to interactions, inefficiency, and high risk of suboptimal outcomes—are severe and costly, particularly in high-stakes fields like pharmaceutical development. In contrast, Design of Experiments and related systematic methods provide a rigorous framework that not only overcomes these weaknesses but also delivers a deeper, predictive understanding of complex systems. By embracing principles of randomization, replication, and structured design, researchers can navigate vast experimental landscapes with unparalleled efficiency and confidence, ensuring that the final solutions are not just locally adequate, but globally optimal. The future of innovation, especially in the face of rising R&D costs and complexity, lies in the widespread adoption of these powerful systematic optimization strategies.
The selection of an appropriate optimization strategy is a critical determinant of success in scientific and industrial research. While the traditional one-variable-at-a-time (OVAT) approach remains prevalent, its inherent limitations—including inefficiency and inability to detect factor interactions—often render it unsuitable for complex modern applications, particularly in fields like drug development. This whitepaper provides an in-depth technical guide for researchers and scientists, contrasting OVAT with three powerful multivariate optimization methodologies: gradient-based methods, the simplex method, and Design of Experiments (DoE). Framed within the context of advancing beyond univariate research, this guide delivers structured comparisons, detailed experimental protocols, and visual workflows to inform strategic decision-making in process and analytical method development.
In experimental optimization, the one-variable-at-a-time (OVAT) approach involves varying the levels of one condition while holding all others constant. Despite its intuitive simplicity, this method is fundamentally flawed for complex systems. It is notoriously time- and reagent-consuming, and its most significant limitation is its inability to detect interaction effects between different variables [51]. Consequently, the true maximum efficiency of a process or analytical method may never be identified, as the synergistic or antagonistic effects between factors remain hidden.
Multivariate optimization, which varies all conditions simultaneously, represents a paradigm shift. It can identify the global optimum with far greater efficiency and reliability [51]. The evolution of these methods can be understood through two key axes: their reliance on a model (model-based vs. model-agnostic) and their execution strategy (sequential vs. parallel) [52]. The following sections provide a detailed examination of the three primary multivariate alternatives to OVAT, offering researchers a robust toolkit for modern scientific challenges.
Methodologies and Theoretical Foundations
Gradient-Based Methods
Gradient-based algorithms leverage derivative information to guide the search for an optimum. The core principle is to move through the parameter space in the direction of the steepest ascent (for maximization) or descent (for minimization), as defined by the gradient vector [51] [53].
- Core Principle: For an objective function ( U = f(X) ), where ( X = (x1, x2, ..., xn) ), the gradient ( G(X) ) is a vector of partial derivatives ( \partial U / \partial xi ). This vector points in the direction of the steepest increase of the function [51].
- First-Order Algorithms: These methods, including Gradient Descent and its variants (Momentum, Adam, RMSProp), use the first derivative (gradient) to update parameters. The basic update rule is ( X{k+1} = Xk - \alpha \nabla f(X_k) ), where ( \alpha ) is the learning rate [54] [53].
- Second-Order Algorithms: Methods like Newton's method and Quasi-Newton methods (e.g., BFGS, L-BFGS) incorporate second-derivative information (the Hessian matrix) to achieve faster convergence. They better approximate the local curvature of the objective function [54] [53].
Simplex-Based Methods
The term "simplex method" can refer to two distinct algorithms. The Nelder-Mead simplex method is a heuristic for non-linear optimization [53], while the Dantzig simplex algorithm is for linear programming [22]. This guide focuses on Nelder-Mead.
- Geometric Interpretation: For an n-variable problem, the algorithm maintains a simplex, a geometric figure defined by n+1 vertices. In two dimensions, this is a triangle [51] [53].
- Search Mechanism: The method iteratively moves the simplex across the response surface by reflecting, expanding, or contracting the worst point through the centroid of the opposite face. These operations allow it to navigate the search space without derivative information [51] [53].
Design of Experiments (DoE)-Based Approaches
DoE is a model-based, structured approach to understanding the relationship between factors and responses. It fits a statistical model, typically a polynomial, to data collected from a strategically designed set of experiments [52].
- Response Surface Methodology (RSM): RSM uses sequential experimentation to build models for optimization. It often starts with a screening design to identify vital few factors, followed by a more detailed model to locate the optimum [52].
- Common Designs:
Comparative Analysis and Selection Criteria
The choice between gradient, simplex, and DoE-based approaches depends on the specific characteristics of the optimization problem. The following table provides a structured comparison to guide this decision.
Table 1: Strategic Comparison of Optimization Methodologies
| Criterion | Gradient-Based Methods | Simplex (Nelder-Mead) Method | DoE-Based Approaches |
|---|---|---|---|
| Core Principle | Follows the direction of the gradient vector [51] | Geometric operations on a simplex (reflection, expansion, contraction) [51] [53] | Statistical fitting of a model (e.g., polynomial) to experimental data [52] |
| Derivative Requirement | Requires first (and sometimes second) derivatives [51] [54] | No derivatives required; uses only function evaluations [51] [54] | No derivatives required [52] |
| Typical Problem Scope | Well-defined mathematical functions with calculable derivatives [54] | Experimental systems where derivatives are unavailable or difficult to compute [51] | Systems requiring deep process understanding and model building [52] |
| Handling of Factor Interactions | Implicitly captured in the Hessian or gradient | Captured through the movement of the simplex in multi-dimensional space | Explicitly modeled through interaction terms in the statistical model [51] |
| Efficiency & Convergence | High convergence rate when derivatives are available [51] | Less efficient than gradient methods; effective for low-dimensional problems (<10 variables) [53] | Highly efficient in terms of the number of experimental runs required [55] |
| Primary Strengths | Fast, efficient convergence; strong theoretical guarantees [51] [54] | Robust, easy to implement; handles noisy functions well [54] [53] | Provides a predictive model; maps the entire experimental region; quantifies factor effects [52] |
| Key Limitations | Sensitive to noise; may get stuck in local optima; requires derivatives [54] | Can be slow to converge in high dimensions; lacks strong convergence proofs [53] | Model is an approximation; design can be inflexible if not planned carefully [52] |
Decision Workflow
To further aid in method selection, the following diagram illustrates a logical decision pathway based on the problem's characteristics.
Experimental Protocols and Workflows
Protocol: Implementing the Gradient Descent Algorithm
This protocol is suitable for optimizing a differentiable objective function, such as a loss function in machine learning or a well-defined chemical yield model.
- Initialize Parameters: Choose a starting point ( X_0 ) in the parameter space and set the learning rate ( \alpha ) and convergence tolerance ( \epsilon ) [54].
- Iterate until Convergence: a. Compute Gradient: Calculate the gradient vector ( \nabla f(Xk) ) at the current point ( Xk ) [54] [53]. b. Update Parameters: Apply the update rule: ( X{k+1} = Xk - \alpha \nabla f(Xk) ) [54] [53]. c. Check Convergence: If the change in the objective function ( |f(X{k+1}) - f(Xk)| < \epsilon ) or the norm of the gradient ( ||\nabla f(Xk)|| < \epsilon ), stop the iteration. Otherwise, return to step 2a [54].
Protocol: Executing the Nelder-Mead Simplex Method
This protocol is ideal for experimental optimization where the response surface is unknown or derivatives are unavailable, such as optimizing instrument parameters [51].
- Initialize Simplex: For an n-factor problem, define n+1 initial points to form the starting simplex [51] [53].
- Evaluate and Rank: Evaluate the objective function at each vertex and rank the vertices from best ( (Xb) ) to worst ( (Xw) ) [53].
- Calculate Centroid: Calculate the centroid ( \overline{X} ) of all points except ( X_w ) [51].
- Iteration Loop: a. Reflect: Compute the reflection point ( Xr = \overline{X} + \alpha (\overline{X} - Xw) ). If ( Xr ) is better than ( Xw ) but not the best, replace ( Xw ) with ( Xr ) [51] [53]. b. Expand: If ( Xr ) is the best point, compute the expansion point ( Xe ). If ( Xe ) is better than ( Xr ), replace ( Xw ) with ( Xe ); otherwise, use ( Xr ) [53]. c. Contract: If ( Xr ) is worse than the second-worst point, perform a contraction to find a new point ( Xc ). If ( Xc ) is better than ( Xw ), replace ( Xw ) with ( Xc ) [53]. d. Shrink: If contraction fails, shrink the entire simplex towards the best point ( Xb ) [53].
- Check Termination: Repeat until the simplex converges or a maximum number of iterations is reached [51].
Protocol: Conducting a DoE-Based Optimization (e.g., CCD)
This protocol, widely used in pharmaceutical process development, systematically builds a model to locate an optimum [52] [34].
- Define Problem: Identify the objective (response) and the key input factors and their ranges [52].
- Select Design: Choose an appropriate design (e.g., Central Composite Design) to support a second-order model [52].
- Execute Runs: Perform the experimental runs in a randomized order to minimize the effects of lurking variables [52].
- Fit Model: Use regression analysis to fit a quadratic model to the data: ( Y = \beta0 + \sum \betai xi + \sum \beta{ii} xi^2 + \sum \sum \beta{ij} xi xj ) [52].
- Validate Model: Check the model's goodness-of-fit (e.g., R², adjusted R²) and perform residual analysis [52].
- Locate Optimum: Use the fitted model to identify the factor settings that predict the optimal response, often via canonical analysis [52].
The workflow for a sequential DoE approach, from screening to optimization, is visualized below.
Case Study: Optimization in Drug Development
Lonza, a contract development and manufacturing organization (CDMO), has launched a "Design2Optimize" platform to streamline the development of active pharmaceutical ingredients (APIs). This platform employs a proprietary model-based DoE approach to guide experimental setup based on optimal conditions [34].
- Challenge: The increasing complexity of small molecule APIs, often involving 20 or more synthetic steps, makes traditional OVAT optimization prohibitively slow and resource-intensive [34].
- Solution: The platform combines physicochemical and statistical models within an optimization loop to maximize information gain from each experiment. This creates a "digital twin" of the process, enabling scenario testing without physical experimentation [34].
- Outcome: This approach has led to a significant reduction in the number of experiments required, accelerating the development timeline and increasing the likelihood of "right-first-time" processes for API manufacturing [34].
Essential Research Reagent Solutions
The following table lists key materials and their functions relevant to conducting optimization experiments, particularly in a biopharmaceutical context.
Table 2: Key Research Reagents and Materials for Optimization Studies
| Reagent/Material | Function in Optimization Experiments |
|---|---|
| Cell-Based Assay Kits (e.g., IFN-γ Release Assay) | Used as a response variable to optimize cell culture conditions or immune cell activation protocols [55]. |
| Flow Cytometry Reagents | Antibodies and viability dyes used to measure multiple cell surface and intracellular markers; their concentrations are often optimized using DoE or Simplex [55]. |
| Small Molecule APIs & Intermediates | The target products or precursors in reaction condition optimization (e.g., catalyst loading, temperature, solvent ratio) via DoE [34]. |
| Cell Culture Media & Supplements | Factors in DoE to optimize cell growth and product yield by simultaneously varying concentrations of components [55]. |
The move from one-variable-at-a-time experimentation to multivariate optimization is a cornerstone of modern, efficient research and development. Gradient-based methods offer speed and precision for well-defined, differentiable systems. The Simplex method provides a robust, derivative-free heuristic for lower-dimensional problems. DoE-based approaches deliver unparalleled process understanding and predictive power for complex system optimization. The choice is not which method is universally best, but which is most appropriate for the specific problem at hand. By applying the structured comparison and decision workflows outlined in this guide, researchers and drug development professionals can strategically select the right tool to accelerate timelines, reduce costs, and achieve superior, reproducible results.
The pursuit of optimal solutions represents a fundamental challenge across scientific and engineering disciplines, particularly in fields like drug discovery where the cost of experimentation is high and the search spaces are vast and complex. This guide examines contemporary optimization methodologies, framing them within the historical context of simplex-based approaches versus one-variable-at-a-time techniques. Where simplex methods (e.g., Nelder-Mead) operate by evaluating and updating an entire geometric simplex of points, one-variable-at-a-time methods sequentially optimize along individual coordinate directions. Modern algorithms have transcended this dichotomy through hybrid and sophisticated global strategies that better handle the high-dimensional, non-convex landscapes characteristic of real-world problems like molecular design and clinical trial optimization [56] [57].
The critical challenge in modern computational drug discovery lies in scaling these optimization techniques to handle problems with thousands of dimensions while maintaining reasonable convergence properties with limited data. As models grow in complexity and dimensionality, researchers face fundamental trade-offs between computational efficiency, generalization capability, and theoretical guarantees [56]. This technical guide provides a structured overview of current optimization paradigms, detailed experimental protocols, and practical implementation frameworks to help researchers navigate these complex considerations when deploying optimization strategies at scale.
Core Optimization Paradigms: A Systematic Taxonomy
Modern optimization methods for machine learning and scientific discovery can be systematically categorized into two fundamental paradigms: gradient-based techniques that utilize derivative information and population-based approaches that employ stochastic search strategies [56]. Each paradigm offers distinct advantages and addresses different aspects of the optimization challenge, with gradient methods excelling in data-rich scenarios requiring rapid convergence, while population approaches dominate complex problems where derivative information is unavailable or insufficient [56].
Gradient-Based Optimization Methods
Gradient-based algorithms form the backbone of modern deep learning optimization, leveraging derivative information for precise parameter updates. The fundamental stochastic optimization frameworks, including SGD and its variants, established convergence guarantees of O(1/T) for convex objectives [56]. Subsequent innovations introduced momentum acceleration and adaptive preconditioning to address ill-conditioned landscapes, culminating in unified frameworks like Adam [56].
Table 1: Advanced Gradient-Based Optimization Algorithms
| Algorithm | Core Innovation | Convergence Properties | Ideal Use Cases |
|---|---|---|---|
| AdamW [56] | Decouples weight decay from gradient scaling | 15% relative test error reduction on CIFAR-10/ImageNet vs Adam | Deep learning with need for robust regularization |
| AdamP [56] | Projected Gradient Normalization | Addresses scale parameter optimization in normalization layers | Models with BatchNorm/LayerNorm layers |
| LAMB [56] | Layer-wise adaptive batch scaling | Enables training of large models with large batch sizes | Large-scale distributed training |
| RAdam [56] | Rectified variance control | Stabilizes training in early stages | Problems with noisy gradients or sparse data |
| NovoGrad [56] | Layer-wise gradient normalization | Improved stability for speech and NLP models | Recurrent networks and attention models |
The AdamW algorithm exemplifies how modern optimizers address specific limitations of their predecessors. It resolves the inequivalence between L2 regularization and weight decay in adaptive gradient methods by decoupling weight decay from gradient scaling according to the update rule: θ̂{t+1} = (1-λ)θt - αMt∇ft(θt), where Mt represents the adaptive preconditioner. This modification ensures consistent regularization independent of adaptive learning rates, effectively bridging the generalization gap between adaptive methods and SGD [56].
Population-Based and Black-Box Optimization Methods
For problems where gradient information is unavailable, unreliable, or insufficient, population-based approaches provide a powerful alternative. These algorithms employ stochastic search strategies inspired by natural systems and are particularly valuable in scientific domains like drug discovery where objective functions may be non-differentiable, noisy, or expensive to evaluate [56] [57].
Table 2: Population-Based and Derivative-Free Optimization Methods
| Algorithm | Core Mechanism | Exploration Strategy | Optimal Problem Fit |
|---|---|---|---|
| CMA-ES [56] | Covariance matrix adaptation | Evolutionary strategy with adaptive step size | Medium-dimensional parametric optimization |
| DANTE [57] | Neural-surrogate-guided tree search | Combines DNN surrogates with tree exploration | High-dimensional problems with limited data |
| Bayesian Optimization [57] | Probabilistic surrogate model | Uncertainty-based acquisition functions | Expensive black-box functions (<100 dimensions) |
| IARO [56] | Center-driven refinement with Gaussian wandering | Mathematical optimization inspired by animal foraging | Feature selection and hyperparameter tuning |
The DANTE (Deep Active Optimization with Neural-Surrogate-Guided Tree Exploration) framework represents a significant advancement for high-dimensional optimization with limited data availability. Unlike traditional Bayesian optimization which primarily utilizes kernel methods and struggles beyond 100 dimensions, DANTE employs a deep neural surrogate to iteratively find optimal solutions while introducing mechanisms like conditional selection and local backpropagation to avoid local optima [57]. This approach has demonstrated superior performance in problems with up to 2,000 dimensions while requiring considerably fewer data points than conventional methods.
Optimization in Drug Discovery: Practical Applications
The pharmaceutical industry provides a compelling domain for examining optimization challenges at scale, where techniques must balance computational efficiency with real-world biological complexity. Model-Informed Drug Development (MIDD) has emerged as an essential framework that applies quantitative modeling to advance drug development and support regulatory decision-making [58]. These approaches span the entire drug development lifecycle from early discovery to post-market surveillance, requiring optimization strategies adaptable to diverse contexts of use and constrained by varying data availability [58].
Optimization Across the Drug Development Workflow
Drug development follows a structured process with five main stages, each presenting distinct optimization challenges: (1) discovery, where researchers identify disease targets and test compounds; (2) preclinical research involving laboratory and animal studies; (3) clinical research with human trials across three phases; (4) regulatory review; and (5) post-market monitoring [58]. Effective optimization requires aligning methodologies with the specific questions of interest and appropriate context of use at each stage [58].
In early discovery, quantitative structure-activity relationship (QSAR) modeling and AI-powered virtual screening optimize the identification of promising drug candidates. Pandey and Singh (2025) demonstrated the routine deployment of platforms like AutoDock and SwissADME to filter for binding potential and drug-likeness before synthesis, significantly reducing resource burden on wet-lab validation [11]. During hit-to-lead optimization, deep graph networks have been used to generate thousands of virtual analogs, resulting in sub-nanomolar inhibitors with over 4,500-fold potency improvement over initial hits, compressing discovery timelines from months to weeks [11].
Diagram 1: AI-Optimized Drug Discovery Pipeline
Clinical development benefits from model-based meta-analysis (MBMA), physiologically based pharmacokinetic (PBPK) modeling, and exposure-response (ER) analysis to optimize trial designs and dosage regimens [58]. The integration of artificial intelligence has been particularly transformative, with AI models capable of simulating thousands of virtual patients to predict responses, identify high-risk subpopulations, and inform dosage adjustments before costly clinical trials begin [59].
Case Study: DANTE Framework for Molecular Optimization
The DANTE framework exemplifies how modern optimization addresses complex challenges in drug discovery. This approach combines deep neural network surrogates with tree search to navigate high-dimensional molecular design spaces efficiently. The methodology employs several key innovations to overcome limitations of traditional approaches [57]:
Neural-Surrogate-Guided Tree Exploration (NTE) serves as the core component, optimizing exploration-exploitation trade-offs through visitation counts and a deep learning model. Unlike traditional Bayesian optimization, NTE uses the number of visits to a particular state as a measure of uncertainty rather than relying solely on probabilistic uncertainty estimates [57].
Conditional selection addresses the "value deterioration problem" where search trees without this mechanism often select lower-value leaf nodes during expansion, leading to rapid decline in solution quality. In NTE, if the data-driven upper confidence bound (DUCB) of the root node exceeds that of all leaf nodes, the search continues with the same root; otherwise, the highest-value leaf becomes the new root [57].
Local backpropagation enables escape from local optima by updating only the visitation data between the root and selected leaf node, preventing irrelevant nodes from influencing current decisions. This creates local DUCB gradients that help guide the algorithm away from suboptimal regions [57].
Diagram 2: DANTE Optimization Pipeline
Experimental Protocols and Implementation Frameworks
Protocol: Deep Active Optimization for Molecular Design
Objective: To identify optimal molecular structures with desired properties while minimizing expensive wet-lab experiments or simulations.
Materials and Computational Resources:
- Initial dataset of 100-200 characterized compounds
- Deep learning framework (TensorFlow 2.10+ or PyTorch 2.1.0+)
- High-performance computing cluster with GPU acceleration
- Validation resources (experimental assays or high-fidelity simulations)
Methodology:
- Initialization: Begin with a diverse initial dataset of 100-200 compounds with measured properties of interest [57].
- Surrogate Model Training: Train a deep neural network to predict molecular properties from structural representations or descriptors.
- Tree Search Configuration:
- Implement neural-surrogate-guided tree exploration (NTE) with data-driven UCB (DUCB)
- Set exploration parameters to balance discovery versus refinement
- Iterative Batch Selection:
- Use NTE to select 10-20 promising candidates for evaluation [57]
- Evaluate selected candidates using validation sources (experimental or simulated)
- Augment training dataset with new labeled compounds
- Stopping Criteria: Continue until performance plateaus or resource constraints are met (typically 10-15 iterations).
Validation: Confirm top candidates through experimental testing or high-fidelity simulation independent from the surrogate model training process.
Protocol: Hyperparameter Optimization for AI-Driven Virtual Screening
Objective: To identify optimal hyperparameters for AI models used in virtual screening of compound libraries.
Materials:
- Curated molecular dataset with known activities
- AI platform for virtual screening (e.g., AutoDock, SwissADME)
- Hyperparameter optimization framework (Optuna, Ray Tune)
Methodology:
- Search Space Definition: Define bounded ranges for critical hyperparameters including learning rate, batch size, network architecture, and regularization strength.
- Optimization Strategy Selection:
- For low-dimensional spaces (<20 parameters): Bayesian optimization with tree-structured Parzen estimators
- For high-dimensional spaces: Evolutionary strategies or population-based methods
- Objective Function Specification:
- Primary metric: Enrichment factor at 1% of screened library
- Secondary metrics: AUC-ROC, computational efficiency
- Parallelized Evaluation: Distribute candidate evaluations across available computational resources.
- Cross-Validation: Employ k-fold cross-validation to ensure robust performance estimation.
Validation: Apply optimized model to independent test set of recently discovered active compounds not used during optimization.
Table 3: Research Reagent Solutions for Optimization in Drug Discovery
| Tool/Category | Specific Examples | Primary Function | Implementation Considerations |
|---|---|---|---|
| Deep Learning Frameworks [56] | TensorFlow 2.10, PyTorch 2.1.0 | Provides automatic differentiation and distributed training support | GPU acceleration essential for large-scale molecular modeling |
| Hyperparameter Optimization [60] [56] | Optuna, Ray Tune, AdamP, AdamW | Automated search for optimal model configurations | Choice depends on search space dimensionality and budget |
| Molecular Modeling [11] [61] | AutoDock, SwissADME, CADD | Predicts binding affinities and drug-like properties | Integration with AI platforms enhances screening efficiency |
| Active Optimization [57] | DANTE, Bayesian Optimization | Guides experiment selection in data-limited regimes | Particularly valuable for expensive wet-lab experiments |
| Target Engagement [11] | CETSA (Cellular Thermal Shift Assay) | Validates direct binding in intact cells and tissues | Provides critical translational bridge between computation and biology |
Convergence Analysis and Scaling Properties
Evaluating optimization performance requires careful consideration of both theoretical convergence guarantees and practical scaling behavior. Traditional convergence analysis for convex problems establishes O(1/√T) rates for stochastic gradient descent and O(1/T) for strongly convex objectives [56]. However, modern deep learning models typically involve non-convex loss landscapes where such guarantees do not formally apply, necessitating empirical convergence metrics and benchmarking protocols.
For large-scale optimization, critical metrics include:
- Time to convergence (number of iterations or function evaluations)
- Computational resource requirements (memory, FLOPs)
- Solution quality (objective function value at convergence)
- Generalization performance (validation vs. training loss)
The LAMB (Layer-wise Adaptive Batch Scaling) algorithm exemplifies scaling considerations, enabling training of large models with large batch sizes through layer-wise adaptation [56]. This addresses the fundamental challenge that simple batch size scaling often degrades model performance without appropriate algorithmic adjustments.
In drug discovery applications, practical convergence is often determined by relative improvement rates rather than theoretical optimality. A common approach establishes a stopping criterion when the relative improvement in the objective function falls below a threshold (e.g., 0.1%) over multiple consecutive iterations, balanced against total computational budget constraints [57].
Selecting appropriate optimization strategies requires careful consideration of problem dimensionality, data availability, computational budget, and solution quality requirements. For low-dimensional problems with expensive evaluations, Bayesian optimization remains the gold standard. As dimensionality increases beyond 100 parameters, methods like DANTE that leverage deep neural surrogates demonstrate superior performance [57]. In data-rich environments with differentiable objective functions, adaptive gradient methods like AdamW and AdamP provide robust performance [56].
The historical dichotomy between simplex methods and one-variable-at-a-time optimization has evolved into a rich ecosystem of hybrid approaches that combine the strengths of multiple paradigms. For drug discovery professionals, this expanding toolkit enables more efficient navigation of complex chemical and biological spaces, accelerating the development of novel therapeutics while managing computational costs. As optimization methodologies continue to advance, their integration into automated discovery pipelines promises to further compress development timelines and enhance the precision of therapeutic intervention.
Handling Complex, Multi-Variable Systems with Interactions and Constraints
The analysis of complex, multi-variable systems represents a fundamental challenge across scientific and engineering disciplines, particularly in drug development where interactions between biological variables, dosage parameters, and constraints present formidable optimization problems. The core challenge lies in efficiently navigating high-dimensional search spaces with intricate variable interactions while respecting system constraints—a task where traditional one-variable-at-a-time approaches prove fundamentally inadequate. This whitepaper examines modern optimization methodologies through the critical lens of the simplex-versus-serial optimization paradigm, providing researchers with advanced frameworks for addressing these multidimensional challenges.
The historical dominance of one-variable-at-a-time (OVAT) experimentation persists despite recognized limitations, particularly its inability to detect variable interactions and tendency to converge on suboptimal local solutions. In contrast, simplex-based methods and their modern descendants provide systematic frameworks for exploring complex parameter spaces by considering multiple variables simultaneously. Contemporary approaches have evolved significantly beyond traditional simplex algorithms to include interior point methods offering polynomial-time solutions for linear programming problems and deep active optimization techniques capable of handling thousands of dimensions with limited data availability [62] [57]. This evolution represents a fundamental shift in optimization philosophy—from sequential parameter adjustment to holistic system exploration.
Theoretical Foundations: From Simplex to Modern Optimization
The Simplex Method Framework
The simplex algorithm, developed by George Dantzig in 1947, provides a systematic procedure for solving linear programming problems by moving along the edges of the feasible region polytope from one vertex to an adjacent vertex with an improved objective function value [22]. The algorithm operates on linear programs in canonical form:
- Maximize cᵀx
- Subject to Ax ≤ b and x ≥ 0
Where c represents the objective function coefficients, A defines the constraint coefficients, b represents the right-hand side constraints, and x is the vector of decision variables [22]. The method transforms inequality constraints to equalities by introducing slack variables, then iteratively applies pivot operations to navigate the solution space [22].
While theoretically effective for linear problems with convex feasible regions, the simplex method faces practical limitations with truly large-scale problems that challenge alternative approaches [62]. Its edge-following behavior, while guaranteed to find optimal solutions for linear problems, becomes computationally expensive for high-dimensional systems with numerous interacting variables.
Interior Point Methods and Beyond
Interior point methods (IPMs) emerged as a powerful alternative to simplex approaches, with Karmarkar's 1984 seminal paper delivering a polynomial algorithm for linear programming [62]. Rather than navigating the boundary of the feasible region, IPMs traverse through the interior of the solution space, demonstrating particular advantages for large-scale problems where their accuracy, efficiency, and reliability are especially appreciated [62].
Modern optimization frameworks have further expanded these concepts through deep active optimization pipelines that combine deep neural surrogates with sophisticated search algorithms. Methods like DANTE (Deep Active Optimization with Neural-Surrogate-Guided Tree Exploration) can effectively tackle complex, high-dimensional problems with limited data—addressing up to 2,000 dimensions compared to the 100-dimension limitation of earlier approaches [57]. These approaches treat complex systems as 'black boxes' with unknown internal structure, gradient, and convexity, using surrogate models to approximate the solution space [57].
Table 1: Comparative Analysis of Optimization Methodologies
| Methodology | Key Mechanism | Computational Complexity | Best Application Context | Interaction Handling |
|---|---|---|---|---|
| One-Variable-at-a-Time | Sequential parameter adjustment | Linear in variables | Preliminary screening | Fails to detect interactions |
| Simplex Algorithm | Vertex-to-vertex traversal along edges | Exponential worst-case | Small-to-medium linear programs | Limited to linear constraints |
| Interior Point Methods | Interior path-following | Polynomial time | Large-scale linear programs | Handles linear constraints efficiently |
| Deep Active Optimization | Neural surrogate with tree search | Adaptive sampling | High-dimensional, data-limited systems | Captures complex nonlinear interactions |
Methodological Framework for Complex Systems
Experimental Design and Workflow
Optimizing complex, multi-variable systems requires a structured experimental workflow that systematically progresses from screening to refinement while efficiently managing resources. The following diagram illustrates this iterative process:
Advanced Optimization Protocols
Neural-Surrogate-Guided Tree Exploration
The DANTE framework represents a cutting-edge approach for high-dimensional optimization with limited data. Its methodology integrates several advanced components [57]:
Deep Neural Surrogate: A deep neural network trained on initial experimental data to approximate the complex system's behavior, capable of capturing high-dimensional, nonlinear relationships that traditional models miss.
Neural-Surrogate-Guided Tree Exploration (NTE): A search algorithm that uses the neural surrogate to guide exploration, employing two key mechanisms:
- Conditional Selection: Prevents value deterioration by comparing the Data-driven Upper Confidence Bound (DUCB) of root and leaf nodes, selecting higher-value nodes for expansion.
- Local Backpropagation: Updates visitation data only between root and selected leaf nodes, enabling escape from local optima by creating local DUCB gradients.
Stochastic Rollout: Combines stochastic expansion of root nodes with local backpropagation to efficiently explore promising regions of the search space.
This methodology has demonstrated superior performance across diverse domains, identifying optimal solutions in 80-100% of synthetic test cases while using as few as 500 data points, and achieving 10-20% improvement over state-of-the-art methods in real-world applications [57].
Hybrid Priority Cluster Modeling
For systems with quantifiable outputs, a hybrid priority cluster modeling approach integrates statistical analysis with machine learning clustering, as demonstrated in nanocomposite optimization for hydrogen liquefaction [63]:
Correlation Analysis: Pearson's-r correlation analysis quantifies mutual effects and interactions between input parameters and system outcomes.
Weightage Analysis: The MEREC (Method Based on the Removal Effects of Criteria) method determines relative significance of input operational parameters.
Performance Clustering: k-means clustering groups experimental conditions based on performance results into best, worst, and average clusters.
Optimum Combination Establishment: Identifies optimal parameter combinations through analysis of cluster characteristics and performance metrics.
In application, this approach found optimum operating characteristics for hydrogen precooling at pressure of 0.23 MPa, temperature of 260 K, flow rate of 0.11 kg/s, and nanocomposite concentration of 0.24 wt%, achieving specific energy consumption of 2.70 kWh/kgLH₂ and coefficient of performance of 5 [63].
Research Reagent Solutions and Essential Materials
Table 2: Key Research Reagent Solutions for Complex System Optimization
| Reagent/Material | Function in Optimization | Application Context | Critical Specifications |
|---|---|---|---|
| Nanocomposites (Graphene/TiO₂, g-C₃N₄/TiO₂, BN-TiO₂) | Thermal management and energy efficiency enhancement | Hydrogen liquefaction, cryogenic systems | Thermal conductivity, stability under extreme conditions [63] |
| Mixed Refrigerants (Methane, Ethane, Propane) | Multi-stage cooling through balanced thermodynamic properties | Hydrogen precooling processes | Boiling points, latent heat properties, thermal mass [63] |
| Deep Neural Surrogate Models | High-dimensional function approximation | Data-limited complex systems | Architecture depth, regularization methods, training protocols [57] |
| MEREC Analysis Framework | Criteria weight determination for multi-parameter optimization | Experimental parameter prioritization | Removal effects calculation, normalization procedures [63] |
Data Presentation and Analysis Framework
Quantitative Optimization Outcomes
Table 3: Performance Comparison of Optimization Methods Across Domains
| Application Domain | Optimization Method | Key Performance Metrics | Result Value | Comparative Advantage |
|---|---|---|---|---|
| Hydrogen Liquefaction | Hybrid Priority Cluster with Nanocomposites | Specific Energy Consumption | 2.70 kWh/kgLH₂ | 33% reduction vs. conventional systems [63] |
| Coefficient of Performance | 5.0 | 25% improvement vs. baseline [63] | ||
| Synthetic Benchmark Functions | DANTE (Deep Active Optimization) | Success Rate (Global Optimum) | 80-100% | 30-50% improvement over BO [57] |
| Data Points Required | ≤500 | 50% reduction vs. alternatives [57] | ||
| Real-World Complex Systems | DANTE | Benchmark Metric Improvement | 10-20% | Consistent outperformance of SOTA [57] |
| Linear Programming | Interior Point Methods | Computational Complexity | Polynomial time | Exponential improvement over simplex worst-case [62] |
Workflow Integration and System Architecture
The integration of optimization methodologies into a cohesive experimental framework requires careful architecture of computational and physical components:
Implementation Considerations for Scientific Applications
Method Selection Guidelines
Choosing an appropriate optimization strategy requires careful consideration of problem characteristics:
For linear problems with moderate dimensions: Traditional simplex methods or interior point methods provide robust solutions with guaranteed convergence [62] [22].
For high-dimensional systems with limited data: Deep active optimization approaches like DANTE offer superior performance by combining neural surrogates with intelligent search strategies [57].
For systems with quantifiable inputs and outputs: Hybrid priority cluster modeling integrates statistical analysis with machine learning for parameter optimization and sensitivity analysis [63].
For problems with unknown convexity and gradient information: Surrogate-based methods that treat systems as black boxes provide effective alternatives to gradient-based approaches [57].
Validation and Verification Protocols
Rigorous validation ensures optimization results translate to real-world improvements:
Cross-validation: Partition data into training and validation sets to assess model generalizability.
Physical verification: Confirm computational predictions with targeted experimental validation.
Sensitivity analysis: Evaluate robustness of optimal solutions to parameter variations.
Comparative benchmarking: Compare against multiple alternative methods to establish performance advantages.
The optimization of complex, multi-variable systems has evolved fundamentally from one-variable-at-a-time approaches to sophisticated methodologies that holistically address variable interactions and constraints. Modern frameworks combining deep neural surrogates with intelligent search algorithms demonstrate remarkable capabilities in high-dimensional spaces with limited data, while hybrid approaches integrating statistical and machine learning techniques provide robust parameter optimization across scientific domains.
For drug development professionals and researchers, these advanced methodologies offer powerful tools for navigating complex parameter spaces, potentially accelerating development timelines and improving therapeutic outcomes. The continued integration of computational intelligence with experimental science promises further advances in our ability to master complex systems across biological, chemical, and physical domains.
Strategies for High-Dimensional Problems and Computational Efficiency
In both mathematical optimization and empirical scientific research, the challenge of efficiently navigating high-dimensional spaces to find optimal solutions is paramount. This guide frames the discussion within the long-standing methodological debate between systematic approaches, like the Simplex Method for linear programming, and simplistic one-variable-at-a-time (OVAT) experimentation. While the Simplex Method revolutionized optimization by moving systematically along the vertices of a feasible region to find the best outcome, OVAT approaches adjust one factor individually while holding others constant, often failing to capture critical interactions between variables [64] [65]. In contemporary research, particularly in drug development and biological protocol optimization, this foundational debate has evolved to address problems where dimensionality and computational complexity present significant barriers.
High-dimensional optimization problems routinely emerge in fields such as genomics, pharmaceutical development, and machine learning, where the number of parameters can reach hundreds or thousands while the truly influential factors may be few [66] [67]. Effective strategies must therefore balance comprehensive search with computational tractability. This technical guide explores advanced methodologies that extend beyond the traditional Simplex vs. OVAT dichotomy, providing researchers with frameworks for addressing modern optimization challenges while maintaining computational efficiency.
Theoretical Foundations: From Classical to Contemporary Approaches
The Simplex Method and Its Legacy
The Simplex Method, introduced by George Dantzig in 1947, represents a cornerstone of systematic optimization for linear programming problems. Geometrically, linear constraints define a feasible region—a convex polyhedron in n-dimensional space—with the optimal solution always residing at a vertex. The method operates by moving from vertex to vertex along the edges of this polyhedron, improving the objective function at each step until no further improvement is possible [64]. This systematic exploration stands in stark contrast to OVAT approaches, which cannot capture interaction effects and may converge to suboptimal solutions in complex landscapes.
For problems formulated as:
- Maximize: cᵀx
- Subject to: Ax ≤ b, x ≥ 0
The Simplex Method converts inequalities to equalities via slack variables, sets up an initial tableau, and employs pivoting operations to move toward the optimum [64]. Its efficiency in practice, intuitiveness, and interpretability have made it a pillar of applied mathematics and operations research for decades.
Limitations of One-Variable-at-a-Time Optimization
In laboratory settings, OVAT remains surprisingly prevalent despite well-documented deficiencies. The approach adjusts each factor individually while holding others constant, eventually arriving at a protocol that meets basic requirements [65]. This method fails fundamentally in scenarios where factor interactions significantly influence outcomes—a common occurrence in complex biological systems and high-dimensional optimization landscapes. While simple to implement and conceptually straightforward, OVAT designs are statistically inefficient and may completely miss optimal regions of the parameter space, especially when interaction effects are present.
Computational Strategies for High-Dimensional Problems
Dimension Reduction and Embedding Methods
For high-dimensional problems with low effective dimensionality, embedding approaches project the high-dimensional space into a reduced-dimensionality subspace. These methods leverage the empirical observation that many hyperparameter optimization problems in machine learning and physical simulations are driven by only a few truly influential directions [66]. The Model Aggregation Method for Bayesian Optimization (MamBO) algorithm extends this concept by utilizing multiple embeddings and Bayesian model aggregation to reduce uncertainty associated with subspace projections [66].
The core innovation in MamBO addresses a critical limitation of single-embedding approaches: when the optimum lies outside the sampling subspace, recovery becomes impossible. By leveraging multiple embeddings and incorporating a Bayesian aggregation framework, MamBO reduces this embedded model uncertainty while maintaining computational tractability through data subsampling and distributed model fitting [66].
Feature Selection and Hybrid Algorithms
In high-dimensional data classification, feature selection (FS) methods help eliminate irrelevant elements, reducing model complexity, decreasing training time, enhancing generalization, and avoiding the curse of dimensionality [67]. Hybrid algorithms such as TMGWO (Two-phase Mutation Grey Wolf Optimization), ISSA (Improved Salp Swarm Algorithm), and BBPSO (Binary Black Particle Swarm Optimization) have demonstrated significant improvements in identifying optimal feature subsets for classification tasks [67].
Table 1: Performance Comparison of Feature Selection Methods on Biological Datasets
| Method | Dataset | Accuracy | Precision | Recall | Features Selected |
|---|---|---|---|---|---|
| TMGWO-SVM | Breast Cancer Wisconsin | 96.0% | 95.8% | 96.2% | 4 |
| ISSA-RF | Differentiated Thyroid Cancer | 94.3% | 93.9% | 94.7% | 7 |
| BBPSO-MLP | Sonar Dataset | 92.7% | 92.1% | 93.2% | 11 |
| No FS (SVM) | Breast Cancer Wisconsin | 89.5% | 88.7% | 90.1% | 30 |
These hybrid FS algorithms introduce specific innovations: TMGWO incorporates a two-phase mutation strategy that enhances exploration-exploitation balance; ISSA employs adaptive inertia weights, elite salps, and local search techniques to boost convergence accuracy; and BBPSO streamlines the PSO framework through a velocity-free mechanism while preserving global search efficiency [67].
Robust Optimization for Biological Protocols
Robust optimization methods address real-world decision environments where data contain noise, optimal solutions are difficult to implement exactly, and small perturbations may yield infeasible solutions [65]. In biological protocol optimization, this approach combines statistical response function modeling (RFM) and robust optimization (RO) within a robust parameter design (RPD) framework to obtain improved protocols.
The robust optimization formulation for protocol development can be expressed as:
- minimize g₀(x)
- subject to g(x,z,w,e) ≥ t
- x ∈ 𝒮
where g₀(x) = cᵀx is the per-reaction cost of the protocol with cost vector c and factor levels vector x ∈ 𝒮 [65]. The constraint ensures protocol performance, as predicted by the model, meets threshold t despite randomness in noise factors z, w, and e.
Implementation Frameworks and Workflows
MamBO Algorithmic Framework
The Model Aggregation Method for Bayesian Optimization (MamBO) employs a sophisticated workflow that combines subsampling, subspace embedding, and model aggregation to address high-dimensional large-scale optimization problems.
MamBO Algorithm Workflow
The MamBO algorithm modifies the standard Gaussian process (GP) model in Bayesian optimization to handle dimensionality, scalability, and embedding model uncertainty through several key mechanisms [66]:
- Data Subsampling: Large datasets are partitioned into smaller subsets to distribute computational load
- Subspace Embedding: Each subset employs dimension reduction techniques to project high-dimensional inputs into lower-dimensional spaces
- Distributed GP Modeling: Individual GP models are fitted to each embedded subset
- Bayesian Aggregation: Predictions from multiple models are combined to form a robust aggregate prediction
- Iterative Refinement: The acquisition function (e.g., Expected Improvement) guides sequential evaluation of promising points
Robust Protocol Optimization Methodology
The robust parameter design framework for biological protocol optimization follows a structured three-stage process that integrates experimental design, modeling, and optimization.
Table 2: Experimental Design Framework for Robust Protocol Optimization
| Stage | Design Type | Purpose | Factors Included | Response Modeling |
|---|---|---|---|---|
| Screening | Fractional Factorial | Identify influential factors | Control, Noise, Uncontrollable | Main effects only |
| Characterization | Augmented Fractional Factorial | Estimate interaction effects | Significant factors from screening | Main effects + two-way interactions |
| Optimization | Center-Face Composite | Estimate quadratic effects | Most influential factors | Full quadratic model |
Robust Protocol Optimization Workflow
The experimental modeling phase employs a mixed effects model to estimate factor effects and variance components [65]: g(x,z,w,e) = f(x,z,β) + wᵀu + e
where β terms are modeled as fixed effects and {u, e} are modeled as random effects. This approach separates controllable factors (x), noise factors controllable only during experiments (z), and uncontrollable noise factors (w), enabling the development of protocols that perform robustly under production conditions.
Computational Performance and Validation
Scalability and Efficiency Metrics
The MamBO algorithm demonstrates significant computational advantages for high-dimensional problems, particularly when handling large observation sets (>1,000 observations) on standard hardware [66]. Through data subsampling and distributed model fitting, MamBO reduces the computational complexity of Gaussian process training from O(n³) to more manageable levels, enabling application to problem domains previously inaccessible to Bayesian optimization methods.
Table 3: Computational Efficiency Comparison of Optimization Algorithms
| Algorithm | Dimensionality Limit | Observation Scalability | Theoretical Guarantees | Embedding Uncertainty |
|---|---|---|---|---|
| MamBO | High (20+ dimensions) | Large (>1k observations) | Asymptotic convergence | Explicitly modeled |
| Standard BO | Low (<20 dimensions) | Medium (<500 observations) | Asymptotic convergence | Not considered |
| REMBO | High (20+ dimensions) | Medium (<500 observations) | Limited | Partially addressed |
| OVAT | Any | Small | None | Not applicable |
Experimental Validation in Biological Contexts
In polymerase chain reaction (PCR) protocol optimization, the robust optimization approach demonstrated practical superiority over both traditional OVAT methods and non-robust optimization approaches [65]. The optimized protocol achieved:
- 23% reduction in per-reaction costs compared to standard protocols
- 68% improvement in robustness metrics compared to non-robust optimization
- Consistent performance across multiple production batches with different operators
Similar validation of feature selection methods in cancer diagnostics showed that the TMGWO hybrid approach achieved 96% classification accuracy using only 4 features from the Wisconsin Breast Cancer Diagnostic dataset, outperforming recent Transformer-based approaches like TabNet (94.7%) and FS-BERT (95.3%) while requiring significantly less computational resources [67].
Table 4: Essential Research Reagents and Computational Resources for Optimization Experiments
| Resource Category | Specific Tools/Reagents | Function/Purpose | Application Context |
|---|---|---|---|
| Experimental Design | Fractional Factorial Designs | Efficient factor screening | Initial protocol exploration |
| Statistical Modeling | R, Python (scikit-learn) | Response surface modeling | Factor-effect quantification |
| Optimization Solvers | Gurobi, CPLEX, Google OR-Tools | Linear/nonlinear optimization | Simplex method implementation |
| Bayesian Optimization | GPyOpt, BoTorch, MamBO | Sequential parameter optimization | High-dimensional hyperparameter tuning |
| Feature Selection | TMGWO, ISSA, BBPSO | Dimensionality reduction | High-dimensional data classification |
| Biological Reagents | PCR Master Mixes | Nucleic acid amplification | Protocol robustness validation |
| Risk Measures | Conditional Value-at-Risk | Quantifying downside risk | Robust optimization formulation |
The evolution of optimization strategies from the fundamental Simplex vs. OVAT dichotomy to contemporary high-dimensional approaches reflects the increasingly complex challenges facing researchers in drug development and scientific computing. While the Simplex Method established the theoretical foundation for systematic optimization in constrained spaces, modern extensions like Bayesian optimization with embedding techniques and robust parameter design frameworks have expanded the applicability of these principles to problems of unprecedented scale and dimensionality.
The critical advancement embodied in algorithms like MamBO and robust optimization frameworks lies in their explicit acknowledgment of and adaptation to uncertainty—whether from embedded subspace projections, experimental noise, or model misspecification. By integrating advanced statistical modeling with computational efficiency considerations, these approaches enable researchers to navigate high-dimensional spaces effectively while maintaining practical computational requirements.
For scientific professionals engaged in drug development and biological research, these strategies offer mathematically rigorous alternatives to traditional OVAT experimentation, with demonstrated improvements in both performance robustness and resource utilization. As optimization challenges continue to increase in dimensionality and complexity, the integration of Bayesian methods, distributed computing, and robust risk measures will likely form the foundation for the next generation of scientific optimization platforms.
Evidence and Efficacy: Quantifying the Superiority of Systematic Optimization
The pursuit of optimal outcomes is a cornerstone of scientific research and industrial development, particularly in fields like drug development where efficiency and efficacy are paramount. This landscape is dominated by three distinct methodological philosophies: the traditional One-Factor-at-a-Time (OFAT) approach, the structured statistical framework of Design of Experiments (DoE), and the computational algorithm of the Simplex method. While OFAT represents a classical, intuitive approach to experimentation, both DoE and the Simplex method offer more sophisticated, systematic pathways to optimization, albeit in fundamentally different domains. OFAT involves varying a single factor while holding all others constant, a method deeply ingrained in early scientific practice [2] [10]. In contrast, DoE is a powerful, statistically-based methodology that deliberately varies multiple factors simultaneously to not only identify main effects but also crucial interaction effects between factors [49] [2]. The Simplex method, pioneered by George Dantzig in the 1940s, operates in a different sphere altogether; it is a deterministic algorithm designed to solve linear programming problems—to allocate limited resources most efficiently under a set of linear constraints [16] [68]. This guide provides an in-depth, technical comparison of these three approaches, framing them within the context of a broader thesis on optimization research and equipping scientists and engineers with the knowledge to select the right tool for their specific challenge.
Detailed Methodological Breakdown
One-Factor-at-a-Time (OFAT)
Core Principle and Historical Context: OFAT is a straightforward experimental strategy where a single input variable is altered across its levels while all other variables are maintained at a fixed, constant level [2] [10]. This process is repeated sequentially for each factor of interest. Its historical popularity stems from its intuitive logic and simplicity of implementation, requiring no advanced statistical knowledge for initial interpretation [2]. It was one of the earliest strategies employed in fields from chemistry to engineering.
Mechanism and Workflow: The typical OFAT protocol is sequential. It begins with establishing baseline conditions for all factors. The experimenter then selects one factor, varies it through a predetermined range of levels, and observes the response. After completing tests for this factor, it is returned to its baseline before the next factor is selected and varied in isolation [2]. This cycle continues until all factors have been tested individually.
Key Limitations: The primary critique of OFAT is its fundamental inability to detect interaction effects between factors [49] [2] [10]. In complex systems, factors often do not act independently; the effect of one factor can depend on the level of another. OFAT is blind to these synergies or antagonisms, which can lead to profoundly misleading conclusions and a failure to locate the true process optimum [49]. Furthermore, for a large number of factors, OFAT becomes highly inefficient, requiring a great many experimental runs to explore the factor space along a single, limited path [2] [1]. It also provides no inherent mechanism for estimating experimental error or for robust optimization.
Design of Experiments (DoE)
Core Principle and Philosophical Shift: DoE represents a paradigm shift from OFAT. It is a systematic approach to investigation that involves deliberately changing multiple input factors simultaneously according to a pre-defined experimental plan (or "design") to efficiently study their collective influence on one or more output responses [2] [69]. The power of DoE lies in its foundation on three key statistical principles: randomization (random run order to minimize bias), replication (repeating runs to estimate error), and blocking (grouping runs to account for nuisance variables) [70] [2].
Mechanism and Common Designs: The DoE workflow begins with a clear definition of objectives, followed by the selection of factors and their levels. An appropriate experimental design is then chosen based on these goals. Common designs include:
- Full Factorial Designs: Test all possible combinations of factor levels. They provide comprehensive data on main effects and all interactions but can become large as factors increase [71].
- Fractional Factorial Designs: A strategically chosen subset of a full factorial, these designs are used for screening many factors to identify the most important ones with fewer runs, though some interactions may be "confounded" (made indistinguishable) [69].
- Response Surface Methodology (RSM): Designs like Central Composite or Box-Behnken are used for optimization, as they are structured to fit quadratic models and thereby locate optimal points, including maxima, minima, and saddle points [2] [69].
The data from these runs are analyzed using statistical methods like analysis of variance (ANOVA) to quantify the significance and magnitude of effects.
Simplex Method
Core Principle and Problem Domain: The Simplex method, developed by George Dantzig in 1947, is a foundational algorithm for solving Linear Programming (LP) problems [16] [68]. It is designed to find the best outcome (such as maximum profit or lowest cost) in a mathematical model whose requirements are represented by linear relationships, subject to linear equality and inequality constraints. It is not an experimental method for physical systems but a computational one for mathematical optimization.
Mechanism and Geometric Interpretation: The algorithm operates on a geometric principle. The constraints of an LP problem form a convex polyhedron (or polytope) in multidimensional space, known as the feasible region. The fundamental theorem of linear programming states that the optimum value of a linear objective function is achieved at a vertex (or corner point) of this polyhedron [16]. The Simplex method intelligently navigates from one vertex of the polyhedron to an adjacent vertex, at each step improving the value of the objective function, until no further improvement is possible and the optimum is found. This process can be visualized as moving along the edges of the polyhedron.
Recent Advances and Theoretical Context: A long-standing shadow over the Simplex method was its theoretical "worst-case" performance, where the time to solve a problem could grow exponentially with its size [16]. However, recent groundbreaking work by mathematicians like Sophie Huiberts and Eleon Bach has provided a stronger theoretical explanation for its observed practical efficiency. Building on the 2001 work of Spielman and Teng, who showed that introducing tiny random perturbations ("smoothed analysis") makes the algorithm run in polynomial time, the new research has further optimized the algorithm and tightened these runtime guarantees, effectively demonstrating why the feared exponential scenarios do not materialize in practice [16] [68]. It is crucial to distinguish this linear programming Simplex algorithm from the "Simplex" or "Sequential Simplex" method used in evolutionary operation (EVOP) for process optimization, which is a different technique.
Head-to-Head Quantitative Comparison
The following tables provide a consolidated comparison of OFAT, DoE, and the Simplex method across key metrics relevant to researchers and drug development professionals.
Table 1: Comparison of OFAT and DoE for Physical Experimentation
| Metric | OFAT (One-Factor-at-a-Time) | DoE (Design of Experiments) |
|---|---|---|
| Experimental Goal | Screening individual factors; understanding isolated effects. | Screening, characterization, and optimization; understanding interactions. |
| Factor Interactions | Cannot detect interaction effects [49] [2] [71]. | Systematically estimates all interaction effects [2] [71]. |
| Statistical Efficiency | Low; requires more runs for the same precision in effect estimation [10]. | High; maximizes information per experimental run [2] [1]. |
| Statistical Principles | Lacks inherent structure for randomization, replication, and blocking. | Built upon randomization, replication, and blocking [70] [2]. |
| Optimal Solution | High risk of finding a false, sub-optimal solution [49] [1]. | High probability of locating a true, robust optimum [49] [2]. |
| Example: 5 Factors | ~46 runs (e.g., 10 for 1st factor + 9 for each of the other four) [49]. | 12-27 runs (e.g., via a fractional factorial or response surface design) [49]. |
Table 2: Comparison of DoE and the Simplex Algorithm
| Metric | DoE (Design of Experiments) | Simplex Algorithm |
|---|---|---|
| Primary Domain | Physical experimentation and empirical model building. | Computational optimization for mathematical (linear) models. |
| Problem Type | Nonlinear, unknown system responses; "black box" processes [69]. | Linear Programming (LP): Maximize/Minimize a linear objective subject to linear constraints. |
| Output | A statistical model (e.g., linear, quadratic) relating inputs to outputs. | An optimal numerical solution (a set of values for the decision variables). |
| Underlying Mathematics | Regression analysis, Analysis of Variance (ANOVA). | Linear algebra, convex geometry. |
| Key Strength | Reveals interaction effects and curvature; models complex real-world systems. | Proven, highly efficient in practice for a wide class of resource-allocation problems. |
| Theoretical Runtime | Determined by the number of experimental runs in the design. | Recently proven to be polynomial under smoothed analysis, explaining its practical speed [16]. |
Table 3: Essential Research Reagent Solutions
| Reagent / Solution | Function in the Experimentation Process |
|---|---|
| Statistical Software (e.g., JMP, Stat-Ease, Minitab) | Platform for designing experiments (DoE), randomizing run orders, analyzing data via ANOVA, and visualizing interaction effects and response surfaces [70] [49] [69]. |
| Random Number Generator | Critical tool for implementing the principle of randomization, ensuring run order is not biased by time-dependent lurking variables [70] [2]. |
| t-Test & ANOVA | Statistical tools for hypothesis testing. The t-test is core to simple comparative experiments, while ANOVA is used to analyze data from multi-factor DOEs [70] [69]. |
| Power Calculation Software | Used before experimentation to determine the minimum sample size (number of experimental runs) required to detect an effect of a given size with a certain confidence [70]. |
| Linear Programming Solver | Software that implements algorithms like the Simplex method or Interior Point Methods to solve resource allocation and optimization problems defined by linear constraints [16] [62]. |
Experimental Protocols and Visualization
Protocol: Comparative DoE for a Two-Factor System
This protocol outlines a definitive screening design to efficiently identify main effects and interactions, contrasting with an OFAT approach.
Objective: To determine the individual and interactive effects of Temperature (Factor A: 50°C, 70°C, 90°C) and Catalyst Concentration (Factor B: 1%, 2%) on Reaction Yield (Response, %).
Materials & Reagents:
- Reactor vessel, heating mantle with precision control, precision syringe pumps for catalyst addition, analytical equipment (e.g., HPLC, GC-MS) for yield quantification, purified substrate, catalyst stock solutions at 1% and 2%.
Procedure:
- Experimental Design: Generate a definitive screening design using statistical software, resulting in a randomized run order. For two factors, this includes runs at all combinations of corner points (e.g., 50°C/1%, 90°C/1%, 50°C/2%, 90°C/2%) and center points (e.g., 70°C/1.5%) to check for curvature [69].
- Randomization: Execute all experimental runs in the computer-generated random order to protect against confounding from lurking variables [70] [69].
- Execution: a. Prepare the reactor with a fixed mass of substrate. b. For each run, set the temperature to the level specified in the design. c. At the set temperature, add the specified volume of catalyst solution. d. Allow the reaction to proceed for a fixed time. e. Quench the reaction and analyze the mixture to determine the reaction yield.
- Replication: Include 2-3 replicate runs at the center point conditions to obtain an estimate of pure experimental error.
- Data Analysis: Input the yield data into the statistical software. Perform ANOVA to assess the significance of the main effects (Temperature, Concentration) and their two-factor interaction (Temperature*Concentration). Generate an interaction plot and a response surface model if curvature is significant.
Expected Outcome: The analysis will quantify whether Temperature and Concentration have significant individual effects and, crucially, whether they interact. For example, it may reveal that the effect of changing temperature on yield is much greater at high catalyst concentration than at low concentration—an insight completely invisible to an OFAT study.
Protocol: Conceptual Workflow of the Simplex Algorithm
This protocol describes the computational steps of the Simplex algorithm for a standard Linear Programming problem.
Objective: Maximize a linear objective function, Z = cᵀx, subject to constraints Ax ≤ b and x ≥ 0.
Materials & Reagents:
- A linear programming problem formulation.
- A computer with an LP solver implementing the Simplex algorithm.
Procedure:
- Initialization: Convert all constraints into equalities by introducing "slack variables." Identify an initial "basic feasible solution" (a starting vertex of the feasible polyhedron).
- Optimality Check: At the current vertex, check if moving along any adjacent edge improves the objective function. This is done by calculating the "reduced cost" for each non-basic variable. If all reduced costs are non-positive (for a maximization problem), the current solution is optimal; TERMINATE.
- Pivot Operation: If improvement is possible, select a non-basic variable to enter the basis (the "entering variable"), which defines the edge to move along. Then, determine which basic variable must leave the basis (the "leaving variable") to move to the next vertex without violating any constraints. This is a pivot operation on the "tableau" (matrix representation of the LP).
- Iteration: Update the solution and the tableau to reflect the pivot. This moves the solution to an adjacent vertex with an improved objective value.
- Loop: Return to Step 2 and repeat until the optimality condition is met.
Expected Outcome: The algorithm terminates at the optimal vertex, providing the values of the decision variables (x) that maximize the objective function Z while satisfying all constraints.
Workflow and Relationship Diagrams
The following diagrams, defined in the DOT language, visualize the core workflows and logical relationships of the three methods.
Diagram 1: Sequential OFAT Workflow
Diagram 2: Integrated DoE Workflow
Diagram 3: Simplex Path Through a Feasible Polyhedron
The choice between OFAT, DoE, and the Simplex method is not a matter of one being universally "best" but of selecting the right tool for the specific problem at hand. OFAT may still have a place in very simple, preliminary investigations where interactions are confidently known to be absent, or when factors are physically extremely hard to change [71] [69]. However, for the vast majority of scientific experimentation, particularly in complex domains like drug development, the limitations of OFAT are severe and the advantages of DoE are overwhelming. DoE is the unequivocal choice for efficiently building empirical models, understanding complex systems with interactions, and finding true, robust optimal conditions.
The Simplex method, while sharing the goal of "optimization," addresses a fundamentally different class of problems. It is the tool of choice for deterministic, linear resource allocation problems, such as optimizing a supply chain or blending materials to meet specifications at minimum cost. Its recent theoretical advancements further cement its reliability and efficiency for these large-scale linear problems [16].
In a modern research and development environment, these tools are complementary. A scientist might use DoE to optimize a chemical reaction (maximizing yield, minimizing impurities) in the lab, and a production manager might later use the Simplex method to optimize the large-scale manufacturing and distribution of the resulting drug product. Understanding the core metrics, workflows, and appropriate applications of each method, as outlined in this guide, is essential for deploying them effectively and driving efficient, data-driven innovation.
Within the broader research on optimization strategies, the debate between the simplex method and the one-variable-at-a-time (OVAT) approach is pivotal for experimental scientists. OVAT methods, which alter a single factor while holding others constant, are intuitively simple but often inefficient and prone to missing optimal conditions due to ignored variable interactions. In contrast, the simplex method, a systematic sequential optimization algorithm, navigates the experimental factor space by moving along the edges of a geometric polytope, inherently accounting for factor interactions to converge more rapidly on an optimum [18]. This technical guide documents the substantial, quantifiable advantages of the simplex method over traditional OVAT, providing a detailed analysis of experimental protocols and resource savings relevant to researchers in drug development and related fields.
Quantitative Data: Simplex vs. OVAT and EVOP
Direct, high-dimensional comparisons between simplex and OVAT in contemporary literature are scarce. However, a foundational simulation study offers a robust comparison between the basic simplex method and Evolutionary Operation (EVOP), another sequential method designed for real-world process improvement with small perturbations [72]. The findings are highly relevant, as EVOP shares the core weakness of OVAT: an inability to efficiently handle multiple, interacting factors.
The study evaluated performance across different numbers of factors (k), step sizes (dxi), and Signal-to-Noise Ratios (SNR) [72]. Key performance metrics included the number of experiments required to reach the optimum and the consistency of the solution path.
- Performance in Higher Dimensions: A critical finding was that as the number of factors (
k) increases, the performance of EVOP deteriorates significantly. The computational overhead for calculating new experimental directions becomes "prohibitive," making it unsuitable for modern, multi-factor problems [72]. - Impact of Noise: The simplex method demonstrated superior robustness in the presence of experimental noise (lower SNR). While both methods were affected, simplex maintained a more stable path toward the optimum under noisy conditions [72].
- Resource Consumption: The number of required experiments is a direct measure of time and material resource consumption. The study concluded that the simplex method requires fewer experiments than EVOP to locate the optimum, particularly as problem complexity grows [72].
Table 1: Summary of Comparative Performance from Simulation Studies [72]
| Metric | Simplex Method | EVOP / OVAT-like Methods |
|---|---|---|
| Scalability (as k increases) | Maintains performance | Performance deteriorates significantly; becomes "prohibitive" |
| Robustness to Noise | More robust; stable path under low SNR | Less robust; performance degrades with noise |
| Experiments Required | Fewer measurements to reach optimum | More measurements required, especially for higher k |
| Handling Interactions | inherently accounts for factor interactions | ignores interactions, leading to suboptimal outcomes |
Beyond direct algorithmic comparisons, the simplex method's core principle of optimizing a system holistically leads to dramatic gains in applied industrial scheduling, a close analog to multi-step synthetic campaigns in drug development.
Table 2: Documented Makespan Reductions in Chemical Library Synthesis Using Formal Optimization (MILP) vs. Baseline Schedulers [73]
| Application Context | Optimization Approach | Reported Reduction in Makespan | Key Resource Saved |
|---|---|---|---|
| Chemical Library Synthesis | Mixed Integer Linear Program (MILP) | Up to 58% (Average 20%) | Total campaign time (Makespan) |
| Chemical Library Synthesis | MILP vs. rule-based/heuristic schedulers | Significant reductions in simulated instances | Laboratory instrument and operator time |
Experimental Protocols & Methodologies
The Simplex Optimization Protocol
The following protocol details the steps for implementing the basic simplex method for experimental process improvement. This is adapted from the classical approach for use in a modern, computer-assisted setting [72] [18].
Initialization:
- Define the
kfactors to be optimized and their feasible ranges. - Set the step size,
dxi, for each factor. This is a small perturbation that keeps the process within acceptable operating bounds. - Construct an initial simplex, a geometric figure with
k+1vertices. For a 2-factor problem, this is a triangle. Each vertex represents a unique set of experimental conditions.
- Define the
Iterative Procedure:
- Step 1: Experimentation. Run the experiment at each vertex of the current simplex and measure the response.
- Step 2: Identification. Identify the vertex with the worst response.
- Step 3: Reflection. Reflect the worst vertex through the centroid of the opposite face to generate a new candidate vertex.
- Step 4: Evaluation. Run the experiment at the new candidate vertex.
- If the response is better than the worst vertex, replace the worst vertex with the new candidate.
- If the response is worse, return to Step 3 and generate a new point (e.g., via contraction).
- Step 5: Termination. Check convergence criteria (e.g., minimal improvement over several iterations, or the simplex becomes sufficiently small). If not met, return to Step 2.
This workflow is visualized in the following diagram, illustrating the decision-making process within the factor space.
Protocol for Chemical Synthesis Scheduling Optimization
The dramatic makespan reductions shown in Table 2 were achieved by formalizing chemical library synthesis as a Flexible Job-Shop Scheduling Problem (FJSP) and solving it as a Mixed Integer Linear Program (MILP) [73]. The protocol is as follows:
Problem Definition:
- Input: A set of synthetic routes to target compounds, represented as a reaction network.
- Input: A list of available hardware modules (reactors, evaporators, etc.) and their capabilities.
- Objective: Minimize the total campaign duration (makespan).
Constraint Modeling:
- Precedence Relations: Model the required order of operations within a synthetic route (e.g., reaction must complete before work-up).
- Resource Constraints: Define the capacity of shared hardware (e.g., a multi-position heater can run several reactions in parallel).
- Temporal Constraints: Incorporate real-world limitations like maximum time lags between operations (e.g., a sensitive intermediate must be used within a specific timeframe) and work shifts [73].
Solution via MILP:
- The problem is formulated mathematically where decision variables include the start time of each operation and its assignment to a specific hardware module.
- A MILP solver is used to find the assignment and schedule that minimizes the makespan while respecting all constraints.
The workflow for this formal optimization approach is more complex and is outlined below.
The Scientist's Toolkit: Research Reagent Solutions
The following table details key resources and computational tools essential for implementing the optimization strategies discussed in this guide.
Table 3: Essential Research Reagents and Computational Tools
| Item Name | Function / Role in Optimization | Application Context |
|---|---|---|
| Reaction Network | A bipartite directed graph defining the pathways from starting materials to target compounds; the foundational input for scheduling optimization [73]. | Chemical Library Synthesis |
| Operation Graph | A directed acyclic graph defining the precise sequence of physical operations (e.g., heat, stir, evaporate) for each reaction and their dependencies [73]. | Chemical Library Synthesis |
| Mixed Integer Linear Program (MILP) Solver | Software that finds the optimal solution to the formulated scheduling problem by determining operation start times and hardware assignments [73]. | Scheduling & Resource Allocation |
| Simplex Optimization Algorithm | A sequential algorithm that directs experimental effort by moving a simplex through factor space to rapidly locate an optimum without a detailed pre-existing model [72] [18]. | Process Improvement & Analytical Method Development |
| Hardware Modules | Physical laboratory equipment (reactors, heaters, liquid handlers) that are assigned to operations by the scheduler; their flexibility and number define resource constraints [73]. | Automated Synthesis & Workflow Execution |
The quantitative evidence and detailed protocols presented herein compellingly demonstrate the superiority of the simplex method and related formal optimization approaches over OVAT and other heuristic methods. The documented reductions in experimental time—up to 58% shorter campaign durations in synthesis scheduling and fewer required experiments in process optimization—translate directly into significant conservation of material resources and laboratory capacity. For researchers and drug development professionals, the adoption of these systematic optimization strategies is not merely a theoretical improvement but a practical imperative for enhancing research efficiency and accelerating discovery timelines.
In the competitive landscape of industrial manufacturing, particularly in sectors like pharmaceuticals and specialty chemicals, achieving robust processes is not merely an advantage—it is a fundamental requirement for regulatory compliance and commercial success. A robust process is one that consistently delivers the desired output, such as product yield or quality, despite the inevitable variations in input materials, environmental conditions, and equipment settings [74]. For decades, the one-variable-at-a-time (OVAT) approach has been the default optimization method in many labs and plants. However, OVAT is inherently inefficient and myopic, as it fails to capture interaction effects between process variables and requires a large number of experiments, often leading to suboptimal process conditions that are highly sensitive to disturbances [14].
This technical guide frames the discussion of Design of Experiments (DoE) and Simplex methods within a broader research thesis that argues for the systematic replacement of OVAT with more sophisticated, multivariate optimization strategies. Where OVAT perturbes one factor while holding others constant, DoE and Simplex represent a paradigm shift by simultaneously varying multiple factors to efficiently map the experimental space, identify optimal conditions, and build in inherent robustness against noise variables [72] [14]. For researchers and drug development professionals, mastering these methods is crucial for developing processes that are not only high-performing but also reproducible from the laboratory to the production scale, and resilient to the variability encountered in real-world manufacturing.
Core Methodological Foundations
Design of Experiments (DoE)
DoE is a structured, statistical methodology for planning, conducting, and analyzing controlled tests to investigate the relationship between input factors (both controllable and uncontrollable) and one or more output responses [75]. Its fundamental principle is to gain the maximum amount of information about a system with the minimum number of experimental runs, thereby enabling data-driven decision-making.
Key Principles and Design Types
The power of DoE lies in its ability to efficiently screen factors and model complex responses. Key designs include:
- Full Factorial Designs: These test all possible combinations of the levels of all factors. While they provide complete information on main effects and interactions, the number of runs grows exponentially with the number of factors, making them impractical for systems with many variables [75].
- Fractional Factorial Designs: These are a high-efficiency alternative that sacrifices higher-order interaction effects (which are often negligible) to drastically reduce the number of required runs. They are ideal for initial screening to identify the most influential factors from a large pool [75] [76].
- Response Surface Methodology (RSM): Once the critical factors are identified, RSM is used to model curvature in the response and find the true optimum settings. Central Composite Design (CCD) and Box-Behnken Design are common RSM designs that help in refining formulations and optimizing processes [75].
A specialized application of DoE is Robust Parameter Design (RPD), introduced by Genichi Taguchi. RPD explicitly distinguishes between control factors (which can be specified by the designer) and noise factors (which are difficult or expensive to control in practice). The goal of RPD is to find settings for the control factors that make the process response insensitive to variation in the noise factors [76]. For example, a cake manufacturer can control the recipe (control factors) but not the consumer's oven temperature (noise factor). RPD helps find a recipe that produces a high-quality cake across a range of oven temperatures [76].
Simplex-Based Optimization Methods
The term "Simplex" in optimization can refer to two distinct algorithms, which must be clearly differentiated.
Nelder-Mead Simplex (for Non-Linear Optimization)
The Nelder-Mead Simplex is a popular heuristic search method for finding a local optimum of a non-linear function. It is a direct search method that does not require calculating derivatives. The algorithm operates by comparing the values of the objective function at the vertices of a simplex, which is a geometric figure with (n+1) vertices in (n) dimensions. Through an iterative process of reflection, expansion, and contraction, the simplex adaptively moves towards the optimum and shrinks around it [22] [14]. It is particularly useful for optimizing systems where a theoretical model is not available, and the objective function is evaluated through physical experimentation or simulation. However, its convergence to a local optimum is not guaranteed and its performance can be sensitive to the chosen initial simplex [14].
Simplex Algorithm (for Linear Programming)
In contrast, Dantzig's Simplex algorithm is a deterministic procedure for solving Linear Programming (LP) problems. It operates on a linear objective function subject to linear equality and inequality constraints [22]. The algorithm explores the vertices of the feasible region, defined by the constraints, by moving along the edges of the polytope. At each step, it pivots to an adjacent vertex that improves the value of the objective function until the optimum is reached. A specialized and highly efficient variant is the Network Simplex method, which exploits the special structure of network flow problems. It can solve such problems 200-300 times faster than a standard simplex approach that ignores the network structure, due to the total unimodularity of network matrices, which ensures integral solutions without the need for branch-and-bound [77].
Practical Implementation and Workflows
A Generic DoE Workflow for Robustness
Implementing DoE successfully requires a structured, cross-functional approach [75]. The following workflow outlines the key stages:
Table: Key Stages of DoE Implementation
| Stage | Description | Key Activities |
|---|---|---|
| 1. Define Problem & Objectives | Clearly articulate the goal of the study. | Identify the process or product for improvement; establish quantifiable success metrics (e.g., "reduce waste by 15%"). |
| 2. Identify Factors & Responses | Brainstorm all variables and measurable outcomes. | With subject matter experts, list all potential input variables (factors) and the measurable output results (responses). Review historical data. |
| 3. Choose Experimental Design | Select the statistical design that fits the problem. | Based on the number of factors and objectives, choose a design (e.g., Fractional Factorial for screening, RSM for optimization). |
| 4. Execute Experiment | Run the tests as per the design matrix. | Systematically change factors according to the design; control non-tested variables; collect data meticulously. |
| 5. Analyze Data | Use statistics to interpret the results. | Use Analysis of Variance (ANOVA) to identify significant factors and interactions; build a predictive model. |
| 6. Interpret & Validate | Draw conclusions and confirm the findings. | Determine optimal process settings from the model. Perform confirmatory runs to validate the model in a real production environment. |
Figure: DoE Workflow Diagram
A Self-Optimizing Workflow Using the Simplex Method
The Nelder-Mead Simplex algorithm can be integrated into a fully automated, self-optimizing experimental platform. The following workflow is adapted from a microreactor system used for chemical synthesis [14]:
- System Setup: An automated flow reactor is equipped with pumps, thermostats, and real-time analytical monitoring (e.g., inline FT-IR or online HPLC).
- Initial Simplex Formation: An initial simplex is defined by choosing (n+1) sets of input parameters (e.g., temperature, flow rate, concentration) in the (n)-dimensional factor space.
- Experiment Execution & Analysis: The system automatically runs experiments at each vertex of the simplex. The analytical data is fed to a control software (e.g., coded in MATLAB) which calculates the objective function (e.g., yield, purity, production rate) for each vertex.
- Algorithmic Iteration: The Nelder-Mead rules are applied:
- Worst Vertex Identification: The vertex with the least desirable objective value is identified.
- Simplex Transformation: A new vertex is generated by reflecting the worst vertex through the centroid of the opposing face. Depending on the performance at this new point, the simplex may also be expanded, contracted, or shrunk to navigate the factor space.
- Convergence Check: Steps 3 and 4 repeat until the simplex converges to an optimum (i.e., the variance in response across the vertices falls below a predefined threshold) or a maximum number of iterations is reached.
- Disturbance Handling (Advanced): In a production setting, the system can be programmed to automatically re-initiate the optimization if a process disturbance (e.g., a drop in feedstock concentration) is detected, thus providing real-time robustness [14].
Figure: Nelder-Mead Simplex Workflow
Comparative Analysis: Performance and Applications
Quantitative Performance Comparison
The choice between DoE and Simplex is often dictated by the specific problem context, including the number of factors, the presence of noise, and the available resources. The table below summarizes key comparative insights derived from simulation studies and real-world applications.
Table: Comparison of DoE and Simplex Methods
| Aspect | Design of Experiments (DoE) | Simplex-Based Methods |
|---|---|---|
| Primary Strength | Builds a global predictive model; quantifies factor interactions and main effects [75]. | Efficiently finds an optimum with minimal prior knowledge; requires fewer initial runs [72]. |
| Noise Handling | Explicitly models and robustifies against noise factors via RPD [76] [74]. | Performance degrades with high noise; requires careful step-size selection to maintain sufficient Signal-to-Noise Ratio (SNR) [72]. |
| Dimensionality | Full factorial runs grow exponentially ((2^k)). Fractional designs efficiently handle many factors (screening) [75]. | Becomes less efficient in high dimensions ((k > 8)); number of vertices increases with (k) [72]. |
| Information Output | Provides a comprehensive model of the response surface and factor significance. | Provides a path to a local optimum but limited global insight into the response surface. |
| Typical Resource Use | Higher initial investment in runs for model building. | Lower initial runs; total runs to convergence can be high for complex surfaces. |
| Best-Suited For | Process understanding, robustness studies, and finding a globally optimal, reproducible region [74]. | Rapid performance improvement, real-time optimization, and systems where a model is difficult to establish [14]. |
Case Studies in Pharmaceutical and Chemical Development
DoE for Robust Pharmaceutical Process Design
In pharmaceutical manufacturing, DoE is a cornerstone of the Quality by Design (QbD) paradigm. It is used extensively to develop robust formulations and processes that ensure product stability, bioavailability, and consistent quality, which are critical for regulatory compliance [75]. For instance, a robustness study might be conducted on a finalized baking process for a drug product. Using a Resolution III factorial design, researchers can systematically introduce small, controlled variations in external noise factors (e.g., ambient humidity, mixer brand) that are anticipated in the field. The goal is to demonstrate insensitivity—proving that the Critical Quality Attributes (CQAs) of the product remain within acceptable limits despite these variations, thus ensuring the process is robust before tech transfer to production [74].
Self-Optimizing Continuous Flow Synthesis with Simplex
A compelling application of the Nelder-Mead Simplex is in the self-optimization of continuous flow reactors. Fath et al. (2020) demonstrated a fully automated microreactor system that performed a multi-variate optimization of an imine synthesis [14]. The system used inline FT-IR spectroscopy for real-time reaction monitoring and a MATLAB-controlled Simplex algorithm to maximize the product yield by adjusting parameters like residence time and temperature. The study highlighted the method's efficiency in finding optimal conditions with minimal human intervention. Furthermore, they enhanced the system to provide a real-time response to disturbances (e.g., fluctuations in feedstock concentration), showcasing how Simplex can be used not just for optimization but also for maintaining robust operation in the face of process upsets [14].
The Scientist's Toolkit: Essential Reagents and Materials
The experimental setups supporting DoE and Simplex optimization, especially in chemical and pharmaceutical contexts, rely on a suite of specialized tools and reagents.
Table: Key Research Reagent Solutions
| Item | Function/Description | Application Example |
|---|---|---|
| Inline FT-IR Spectrometer | Provides real-time, non-destructive monitoring of reaction progress by identifying functional groups and quantifying species concentration [14]. | Tracking the conversion of benzaldehyde and formation of imine product in a self-optimizing flow reactor [14]. |
| Microreactor System | A continuous flow device with small internal dimensions (e.g., capillary tubes) that offers superior heat and mass transfer, high reproducibility, and enhanced safety for screening parameters [14]. | Serving as the core reaction vessel in an automated optimization platform for organic syntheses [14]. |
| Process Simulators (e.g., PharmaPy, gPROMS, AspenPlus) | Software tools that create digital models of processes, allowing for in-silico experimentation and optimization without physical trials [78]. | Used in a simulation-optimization framework for the digital design of pharmaceutical manufacturing processes [78]. |
| Statistical Software (e.g., JMP, Minitab, Design-Expert) | Specialized software that streamlines the design of experiments, statistical analysis of data (e.g., ANOVA), and visualization of results [75]. | Designing a Fractional Factorial screening study and analyzing the significance of multiple factors on a product's yield. |
| Syringe Pumps | Provide precise and continuous dosing of reagents in flow chemistry applications, which is critical for maintaining steady-state conditions [14]. | Delivering solutions of benzaldehyde and benzylamine in methanol to a microreactor for imine synthesis [14]. |
The journey from a research concept to a scalable, robust manufacturing process is fraught with challenges posed by variability. The one-variable-at-a-time approach is fundamentally ill-equipped to meet these challenges, as it ignores critical factor interactions and fails to build robustness into the process design. As detailed in this guide, both Design of Experiments and Simplex methods offer powerful, systematic alternatives that are firmly grounded in a strong research thesis advocating for multivariate optimization.
DoE provides a comprehensive framework for deep process understanding. It empowers scientists to build predictive models, quantify the impact of noise, and identify a robust operating region that ensures consistent quality and reproducibility, making it indispensable for rigorous pharmaceutical process validation and life-cycle management.
The Simplex method, particularly the Nelder-Mead algorithm, excels in scenarios requiring agile, model-free optimization. Its strength lies in its ability to efficiently guide a process to a local optimum with minimal initial information, making it ideal for real-time self-optimization in automated systems and for responding dynamically to process disturbances.
The decision between these two methodologies is not a matter of which is universally better, but rather which is more appropriate for the specific stage of development and the nature of the problem at hand. In many cases, they can be used complementarily—for instance, using DoE for initial screening and model building, and employing a Simplex for final fine-tuning. For researchers and drug development professionals, proficiency in both tools is a critical component of the modern toolkit for achieving truly robust, reproducible, and scalable processes.
In both pharmaceutical development and broader scientific research, optimization represents a fundamental process for improving system performance, whether maximizing product yield, enhancing analytical sensitivity, or achieving adequate separation in chromatographic methods [79]. The validation of these optimal solutions ensures that the identified conditions genuinely deliver the promised performance and that the models used to find them adequately represent the underlying system behavior. Within optimization methodology, two philosophically distinct approaches have emerged: the traditional one-variable-at-a-time (OVAT) approach and the more efficient simplex optimization method [80] [79]. While OVAT varies factors individually while holding others constant, simplex optimization employs an efficient experimental design strategy that can optimize a relatively large number of factors simultaneously through a logically-driven sequential algorithm [79]. This technical guide examines validation protocols within the context of both approaches, providing researchers and drug development professionals with methodologies to confirm both optimal solutions and model adequacy throughout the optimization lifecycle.
The fundamental distinction between these approaches extends to their validation philosophies. The classical OVAT approach follows a sequential process of screening important factors, modeling their effects on the system, and then determining optimum levels [79]. In contrast, the simplex optimization strategy essentially reverses this sequence: it first finds the optimum combination of factor levels, then models the system behavior in the region of the optimum, and finally screens for important factor effects [79]. This paradigm difference necessitates distinct but complementary validation protocols to establish scientific evidence that the optimized process consistently delivers quality results.
Theoretical Framework: Verification vs. Validation
In optimization modeling, verification and validation represent distinct but complementary processes essential for establishing model credibility [81]. Verification refers to "the process of demonstrating that the modeling formalism is correct" [81]. It ensures that the computerized implementation accurately represents the conceptual model and that the mathematical logic is sound for the model's intended purpose [81]. In practical terms, verification involves checking that the code executes without errors, constraints are properly implemented, and the solution method performs according to its theoretical specifications [82].
Validation, conversely, concerns how well the model fulfills its intended purpose within its domain of applicability [81]. Where verification asks "Did we build the model right?", validation asks "Did we build the right model?" [82]. In optimization contexts, validation ensures that the recommended optimal solution genuinely improves the real-world system and that the model adequately captures the essential relationships between factors and responses.
Table 1: Key Terminology in Optimization Model Evaluation
| Term | Definition | Primary Focus |
|---|---|---|
| Computerized Model Verification | Demonstrating correct technical implementation of the conceptual model [81] | Debugging, code correctness, mathematical accuracy |
| Conceptual Validity | Justifiability of theories and assumptions underlying the conceptual model [81] | Theoretical foundations, mathematical logic, assumptions |
| Operational Validation | Evaluating how well the model fulfills its intended purpose [81] | Practical utility, decision support adequacy, real-world performance |
| Face Validation | Subjective assessment of model plausibility by domain experts [81] | Intuitive reasonableness, stakeholder acceptance |
For complex optimization problems in domains like pharmaceutical development, a comprehensive approach combines both verification and validation activities throughout the model lifecycle. This integrated approach is particularly crucial when dealing with "squishy" problems involving complex natural systems, deep uncertainties, and extended timescales where straightforward data-driven validation may be impossible [81].
Validation in the Optimization Lifecycle
A robust validation framework for optimization models spans multiple stages, from initial conceptualization through final implementation and ongoing monitoring. This lifecycle approach aligns with the process validation guidance from regulatory agencies, which emphasizes building quality into processes rather than merely testing finished products [83].
Stage 1: Process Design and Conceptual Validation
The initial stage involves defining the optimization problem and developing a conceptual model that adequately represents the real-world system [83]. In pharmaceutical contexts, this includes creating a Quality Target Product Profile (QTPP), identifying Critical Quality Attributes (CQAs), and defining Critical Process Parameters (CPPs) [83]. Key validation activities at this stage include:
- Stakeholder engagement: Establishing dialog between model developers and domain experts to ensure the optimization problem properly captures real-world constraints and objectives [81]
- Assumption documentation: Explicitly recording all theoretical assumptions, mathematical simplifications, and domain constraints that inform the model structure [82]
- Variable selection justification: Providing scientific rationale for the factors included in the optimization study, particularly when using screening designs to select influential factors [80]
Conceptual validation at this stage ensures that the optimization model incorporates appropriate scientific principles and operational realities before significant resources are invested in experimental work or algorithmic development.
Stage 2: Method Qualification and Operational Validation
Once a conceptual model has been developed, the focus shifts to qualifying the optimization method and validating its operation. This stage involves "collecting and evaluating data on all aspects and stages of the manufacturing process" in pharmaceutical contexts [83], or more broadly, demonstrating that the optimization approach reliably identifies genuine improvements in the system [84]. For simplex optimization methods, this includes:
- Algorithm verification: Confirming that the sequential simplex method correctly implements reflection, expansion, and contraction operations according to established rules [80] [79]
- Constraint handling validation: Verifying that the method properly respects operational boundaries and constraint conditions throughout the optimization sequence [82]
- Solution feasibility testing: Intentionally testing known feasible and infeasible solutions to verify that the method correctly identifies constraint violations [82]
For both simplex and OVAT approaches, visualization techniques provide powerful validation tools during this stage. For routing problems, network designs, or response surfaces, simply visualizing the optimization results can reveal violations of unstated constraints or opportunities for improvement that might be missed by purely numerical checks [82].
Diagram 1: Optimization Validation Lifecycle
Stage 3: Continued Process Verification
The final validation stage involves ongoing monitoring to ensure the optimized process remains in a state of control during routine operation [83]. In optimization contexts, this translates to:
- Performance drift detection: Monitoring system response over time to identify when the optimal solution no longer delivers the expected performance due to changes in the underlying system [83]
- Model relevance assessment: Periodically revalidating that the optimization model remains appropriate as new information becomes available or system conditions evolve [81]
- Reoptimization triggers: Establishing criteria for when the optimization process should be repeated to account for system changes [79]
Continued process verification is particularly important for simplex optimization methods, as their efficiency in finding local optima makes them well-suited for periodic retuning of processes that experience gradual drift [79].
Validation Protocols for Simplex vs. OVAT Optimization
The distinct methodologies of simplex and one-variable-at-a-time optimization necessitate specialized validation approaches tailored to their respective strengths and limitations.
One-Variable-at-a-Time (OVAT) Validation
The classical OVAT approach requires rigorous validation at each stage of the optimization process:
- Screening validation: Confirm that factors eliminated during screening truly have negligible effects on critical responses [79]. This is particularly important as screening experiments based on first-order models may miss factors that only exhibit significant effects through interactions [79]
- Model adequacy checking: Verify that empirical models (typically response surface models) provide sufficient fit to the experimental data through residual analysis, lack-of-fit testing, and examination of model diagnostics [80]
- Prediction validation: Confirm that optima predicted by the fitted model actually deliver the expected performance when implemented in the real system [80] [85]
Table 2: OVAT Optimization Validation Checklist
| Validation Activity | Methodology | Acceptance Criteria |
|---|---|---|
| Factor Significance | Effect calculations, Pareto analysis | Statistical significance (p < 0.05) or practical significance thresholds |
| Model Fit | R² analysis, residual plots, lack-of-fit testing | R² > 0.8, non-significant lack-of-fit (p > 0.05) |
| Optimal Solution | Confirmatory runs at predicted optimum | Response within confidence interval of prediction |
| Robustness | Small perturbations around optimum | Insensitive to minor variations in factor settings |
A significant challenge in OVAT validation arises from the potential for interaction effects between factors. When factors interact, the optimal level of one factor depends on the levels of others, making the one-at-a-time approach potentially misleading [80]. Validation must therefore include checks for interaction effects, possibly through additional experiments that vary multiple factors simultaneously.
Simplex Optimization Validation
The sequential simplex method requires different validation strategies due to its operational characteristics:
- Movement validation: Verify that each simplex move actually improves the system response, with particular attention to constraints and boundary conditions [79]
- Convergence confirmation: Demonstrate that the simplex has genuinely converged to an optimum rather than cycling or oscillating due to experimental noise or response surface peculiarities [80]
- Global optimum assessment: Evaluate whether the identified optimum is local or global, potentially through multiple optimizations from different starting points or by combining with other methods that better handle multiple optima [79]
For simplex methods, visualization again serves as a powerful validation tool. Plotting the path of the simplex through the factor space helps identify problematic behavior such as excessive reflection at boundaries or slow convergence in elongated response regions [80].
Diagram 2: Validation Pathways Comparison
Advanced Validation Techniques
Cross-Validation and Data Splitting
In data-rich optimization environments, cross-validation techniques provide robust methods for assessing model adequacy and predictive performance. While more commonly associated with statistical modeling, these approaches can be adapted for optimization validation:
- K-fold cross-validation: Partitioning experimental data into k subsets, using k-1 subsets for model building or optimization, and validating on the remaining subset [86]
- Time-series validation: For processes with temporal components, using historical data for optimization and more recent data for validation [86]
- Spatial cross-validation: For geographical optimization problems, using data from some regions for model development and other regions for validation
These techniques are particularly valuable for identifying overfitting in complex empirical models used with OVAT approaches, but can also help validate the generalizability of solutions found through simplex methods.
Comparative Validation Against Benchmarks
Establishing model credibility often involves comparison against established benchmarks or alternative approaches:
- Historical comparison: Comparing optimized performance against historical operational data to demonstrate improvement [82]
- Benchmark problems: Testing optimization approaches on standardized problems with known solutions to verify correct implementation [82]
- Alternative method comparison: Solving the same problem with different optimization approaches and comparing results [81]
For pharmaceutical applications, this comparative validation provides compelling evidence for regulatory submissions by demonstrating that the optimized process consistently outperforms previous approaches while maintaining quality standards [84].
The Scientist's Toolkit: Research Reagent Solutions
Table 3: Essential Research Reagents and Materials for Optimization Validation
| Item | Function in Validation | Application Context |
|---|---|---|
| Reference Standards | Providing benchmark for response measurements; verifying analytical methods | All quantitative optimization studies |
| Calibration Materials | Ensuring measurement system accuracy throughout experimental domain | Method optimization, analytical development |
| Positive Controls | Verifying system responsiveness; detecting performance drift | Bioassays, enzymatic reactions, pharmaceutical processes |
| Negative Controls | Establishing baseline performance; detecting interference | Screening experiments, specificity optimization |
| Stability Indicators | Monitoring system consistency during extended optimization sequences | Long-duration experiments, continued process verification |
The selection and proper use of these research reagents forms an essential component of optimization validation, particularly in regulated environments like pharmaceutical development where analytical methods must be verified according to international pharmacopeia standards [84].
Implementation Framework and Documentation
Successful validation requires not only technical execution but also comprehensive documentation and structured implementation:
Validation Protocol Development
A formal validation protocol provides the foundation for systematic optimization validation [84]. Key elements include:
- Objective statement: Clear definition of what the validation aims to demonstrate [84]
- Acceptance criteria: Quantifiable metrics for success, established prior to validation activities [84]
- Scope definition: Delineation of system boundaries and operating conditions covered by the validation [84]
- Responsibilities assignment: Clear allocation of tasks and approval authorities [84]
- Reference documents: Supporting methodologies, standard operating procedures, and regulatory guidelines [84]
Validation Report Preparation
Upon completion of validation activities, a comprehensive report should document:
- Protocol adherence: Any deviations from the planned validation protocol with justification [84]
- Raw data presentation: Complete experimental results supporting validation conclusions [83]
- Statistical analysis: Appropriate statistical treatments of validation data with interpretation [80]
- Conclusion statement: Clear declaration of whether acceptance criteria were met [84]
- Ongoing monitoring plan: Procedures for continued verification of optimal performance [83]
This documentation is particularly critical in pharmaceutical applications where regulatory agencies require "scientific evidence that a process is capable of consistently delivering quality products" [83].
Within the broader thesis comparing simplex versus one-variable-at-a-time optimization approaches, validation protocols serve as the critical bridge between theoretical optimization and practical implementation. For OVAT methods, validation provides essential checks on the screening decisions, model adequacy, and prediction reliability that could otherwise be compromised by unaccounted factor interactions. For simplex approaches, validation confirms the sequential improvement, convergence, and optimality claims that define the method's efficiency advantages.
A comprehensive validation convention for optimization models should include (1) face validation by domain experts, (2) application of at least one additional validation technique appropriate to the optimization methodology, and (3) explicit discussion of how the validated model fulfills its stated purpose [81]. By implementing structured validation protocols throughout the optimization lifecycle—from initial conceptualization through continued process verification—researchers and drug development professionals can confidently translate optimal solutions into reliable real-world performance.
Synthesis of Evidence from Pharmaceutical and Biomedical Case Studies
This technical guide synthesizes evidence from pharmaceutical and biomedical case studies to evaluate the efficacy of simplex-based optimization methods against traditional one-variable-at-a-time (OFAT) approaches. Through detailed analysis of experimental protocols and quantitative data comparisons, we demonstrate that multivariate optimization strategies, including the simplex algorithm and its derivatives, consistently outperform OFAT methodologies in computational efficiency, model robustness, and resource utilization. The findings provide researchers and drug development professionals with validated frameworks for implementing advanced optimization techniques across various biomedical applications, from pharmaceutical manufacturing to experimental protocol design.
Optimization methodologies represent critical tools in pharmaceutical and biomedical research, where efficient resource allocation and parameter tuning directly impact development timelines, costs, and ultimately, patient outcomes. The fundamental dichotomy in optimization strategies lies between the traditional one-variable-at-a-time (OFAT) approach and more sophisticated multivariate techniques, notably the simplex algorithm and its variants. OFAT methodology, while straightforward to implement, varies one factor while holding all others constant, fundamentally ignoring potential factor interactions and often leading to suboptimal solutions [87].
The simplex algorithm, developed by George Dantzig in 1947, provides a mathematical foundation for systematic exploration of parameter spaces by moving along the edges of a polytope to identify optimal solutions in linear programming problems [22]. In contrast to OFAT, simplex-based methods simultaneously evaluate multiple variables, capturing interaction effects and converging more efficiently to global optima. This guide synthesizes evidence from diverse case studies across pharmaceutical manufacturing, healthcare optimization, and biomedical experimental design to demonstrate the superior performance characteristics of simplex-based methods within a broader thesis comparing optimization methodologies.
Theoretical Foundations of Optimization Methods
One-Variable-at-a-Time (OFAT) Approach
The OFAT methodology represents the most intuitive optimization strategy, particularly for researchers without formal training in design of experiments (DoE). In this approach, each process parameter is varied independently while all other factors remain fixed at baseline levels. The primary advantage of OFAT lies in its conceptual simplicity and straightforward implementation, requiring no specialized statistical software or mathematical training. However, this method suffers from critical limitations, most notably its inability to detect factor interactions and its tendency to converge on local rather than global optima [87]. When factor interactions are present—as is common in complex biological and pharmaceutical systems—OFAT can identify seriously suboptimal operating conditions and fail to characterize the true response surface adequately.
Simplex Algorithm and Multivariate Methods
The simplex algorithm operates on linear programs in canonical form, seeking to maximize or minimize a linear objective function subject to linear constraints [22]. The algorithm functions by moving along edges of a feasible region defined by constraints, systematically visiting extreme points until an optimal solution is identified. Key advantages include:
- Guaranteed Convergence: For linear problems with feasible solutions, the simplex algorithm provably converges to a global optimum [22]
- Efficient Exploration: The method explores the parameter space more efficiently than exhaustive search or OFAT by leveraging mathematical structure
- Interaction Capture: Multivariate approaches naturally account for factor interactions, providing more accurate process characterization
For nonlinear systems common in biomedical applications, variants such as the Nelder-Mead simplex method adapt this approach for derivative-free optimization of complex objective functions.
Quantitative Comparison of Optimization Approaches
Table 1: Performance Comparison of Optimization Methods Across Case Studies
| Application Domain | Optimization Method | Key Performance Metrics | Result | Reference |
|---|---|---|---|---|
| Pharmaceutical Manufacturing (Hybrid Routes) | Derivative-based NLP/MINLP | Implementation Time, Solve Time | 1-2 orders of magnitude faster than traditional approaches | [88] |
| Network Flow Problems | Network Simplex | Computational Speed | 200-300 times faster than standard simplex | [77] |
| Design Space Identification | Flexibility Analysis Framework | Computation Time | >100x decrease vs. Monte Carlo sampling | [88] |
| Analytical Method Optimization | Multivariate QbD | Model Accuracy, Factor Interaction Detection | Superior to OFAT with significant interaction effects | [87] |
Table 2: Resource Efficiency Analysis in Pharmaceutical Applications
| Resource Metric | OFAT Approach | Simplex/Multivariate Methods | Relative Improvement | |
|---|---|---|---|---|
| Experimental Runs Required | Exponential with factors | Linear to polynomial scaling | 60-80% reduction | [87] |
| Computational Time for Design Space | High (exponential) | Low (polynomial) | >100x faster | [88] |
| Model Accuracy (with interactions) | Low | High | Significant improvement | [87] |
| Optimization Convergence Reliability | Unreliable (local optima) | High (global optima) | Consistent improvement | [22] |
Pharmaceutical Manufacturing Case Studies
Hybrid Pharmaceutical Process Optimization
The transition from batch to continuous manufacturing in pharmaceutical production presents complex optimization challenges, particularly for hybrid routes incorporating both batch and continuous unit operations. Laky (2022) implemented a simulation-optimization framework using PharmaPy, an open-source tool for pharmaceutical process development, to address these challenges [88]. The research compared derivative-free optimization approaches with derivative-based methods using the PyNumero package and Ipopt solver, demonstrating that the latter approach significantly reduced solve times while maintaining implementation efficiency.
The experimental protocol involved:
- Model Development: Creating rigorous mathematical models for synthesis, crystallization, and filtration units within PharmaPy
- Simulation: Dynamic simulation of fully continuous and hybrid manufacturing processes
- Optimization: Implementing mixed-integer nonlinear programming (MINLP) to identify optimal operating conditions
- Validation: Comparing optimized parameters with traditional OFAT approaches across multiple performance metrics
Results demonstrated that the derivative-based optimization framework leveraging simplex-type algorithms achieved computational speed improvements of 1-2 orders of magnitude compared to traditional OFAT methods, while simultaneously providing more robust operating parameters resilient to process disturbances [88].
Quality by Design in Analytical Method Optimization
The pharmaceutical industry's adoption of Quality by Design (QbD) principles has accelerated the shift from OFAT to multivariate optimization methods. As noted in Catalent's analysis, "the novelty of the multivariate approach over the traditional one-factor-at-a-time (OFAT) type of study is the ability to evaluate both the individual factor effects and the factor-factor interactions that can also be significant" [87].
The experimental protocol for QbD implementation typically includes:
- Factor Screening: Identifying critical process parameters (CPPs) and critical quality attributes (CQAs)
- Experimental Design: Designing a structured experiment using design of experiments (DoE) principles
- Model Fitting: Applying response surface methodology (RSM) to characterize factor-response relationships
- Design Space Exploration: Using optimization algorithms to identify regions meeting all quality specifications
This systematic approach captures interaction effects that OFAT methodologies inevitably miss, leading to more robust analytical methods with better understanding of parameter effects and their interactions [87].
Biomedical Research Applications
Optimization in Health Services Research
Constrained optimization methods provide systematic approaches for identifying optimal solutions to complex problems in health services research, where maximizing health benefits subject to resource constraints is paramount. These mathematical programming techniques enable health services researchers to efficiently allocate limited resources while addressing multiple constraints including patient characteristics, healthcare system capabilities, and budgetary limitations [89].
The generalized optimization framework for health applications involves:
- Objective Function Specification: Defining the health outcome to maximize (e.g., QALYs, patient throughput)
- Constraint Identification: Specifying operational, financial, and clinical constraints
- Model Solving: Applying appropriate optimization algorithms (e.g., simplex, interior point methods)
- Sensitivity Analysis: Evaluating solution robustness to parameter uncertainty
This mathematical programming approach outperforms simpler allocation methods by simultaneously considering all constraints and objective components, analogous to the advantages of multivariate over OFAT optimization in pharmaceutical applications [89].
Behavioral Imaging Protocol Optimization
Schiffer et al. (2007) optimized experimental protocols for quantitative behavioral imaging with 18F-FDG in rodents, demonstrating principles analogous to parameter optimization in pharmaceutical manufacturing [90]. The research aimed to simplify behavioral imaging procedures without loss of quantitative precision through systematic protocol optimization.
The experimental methodology included:
- Parameter Identification: Key parameters included administration route (intraperitoneal vs. intravenous), scan duration, and blood sampling timing
- Experimental Groups: Sixteen animals with carotid artery cannulations divided into three experimental groups with different administration routes and scanning protocols
- Quantitative Comparison: Comparing fully quantitative kinetic modeling with simplified standardized uptake value (SUV) approaches
- Optimization Criterion: Identifying protocols that maintained accuracy while reducing complexity and resource requirements
Results demonstrated that an intraperitoneal injection route with a single plasma point at 60 minutes provided a sensitive index of glucose metabolic rate while significantly simplifying the experimental protocol [90]. This systematic approach to protocol optimization mirrors the efficiency gains of simplex over OFAT methods in pharmaceutical applications.
Experimental Protocols and Methodologies
Computational Optimization Protocol
For implementing simplex-based optimization in pharmaceutical applications, the following protocol provides a robust framework:
Problem Formulation:
- Define objective function (e.g., yield, purity, cost)
- Identify decision variables and constraints
- Transform to standard form using slack variables [22]
Algorithm Selection:
- Choose appropriate simplex variant (standard, network, Nelder-Mead)
- For network problems, select specialized network simplex solvers [77]
Implementation:
- Initialize with basic feasible solution
- Perform pivot operations to move to adjacent vertices [22]
- Continue until optimality conditions satisfied
Validation:
- Compare results with OFAT approach
- Verify constraint satisfaction
- Perform sensitivity analysis
This protocol consistently demonstrates superior performance compared to OFAT, particularly for problems with interacting factors and multiple constraints [22] [88] [87].
Design Space Identification Protocol
The identification of design spaces for pharmaceutical processes under uncertainty can be accelerated using flexibility analysis frameworks:
- Model Development: Create rigorous process models identifying critical quality attributes (CQAs)
- Uncertainty Characterization: Quantify parameter uncertainties and their distributions
- Flexibility Analysis: Formulate and solve mathematical programming problems to identify feasible operating regions [88]
- Design Space Verification: Validate model predictions through limited experimental verification
This methodology decreased design space identification time by more than two orders of magnitude compared to traditional Monte Carlo sampling approaches [88], demonstrating the significant efficiency gains possible with mathematical programming techniques over simpler methods.
Visualization of Optimization Workflows
Diagram 1: Optimization Methodology Comparison
Diagram 2: Pharmaceutical Optimization Workflow
Research Reagent Solutions
Table 3: Essential Research Materials for Optimization Studies
| Reagent/Software | Function in Optimization Research | Application Context |
|---|---|---|
| PharmaPy | Open-source pharmaceutical process simulator | Dynamic simulation of continuous and hybrid manufacturing processes [88] |
| Pyomo with PyNumero | Python-based optimization modeling environment | Formulation and solution of mathematical programming problems [88] |
| Ipopt Solver | Interior Point Optimizer for nonlinear problems | Solving large-scale nonlinear optimization problems [88] |
| 18F-FDG Radiotracer | Glucose metabolic tracer for PET imaging | Quantitative behavioral imaging in rodent models [90] |
| MicroPET R4 System | Small-animal PET imaging | Acquisition of dynamic and static PET data [90] |
| Carotid Artery Catheters | Arterial blood sampling | Obtaining input functions for kinetic modeling [90] |
The synthesis of evidence across pharmaceutical and biomedical case studies demonstrates the consistent superiority of simplex-based optimization methods over traditional OFAT approaches. Key findings include:
- Computational Efficiency: Simplex-based methods achieve speed improvements of 1-3 orders of magnitude across applications from network flow problems to pharmaceutical manufacturing optimization [88] [77]
- Model Accuracy: Multivariate approaches capture factor interactions that OFAT methods miss, leading to more robust process parameters and experimental protocols [87]
- Resource Utilization: Structured optimization reduces experimental runs by 60-80% and computational time for design space identification by over 100x compared to traditional methods [88]
- Implementation Framework: Successful implementation requires appropriate problem formulation, algorithm selection, and validation, as detailed in the experimental protocols
For researchers and drug development professionals, adopting simplex-based optimization methodologies represents an opportunity to significantly accelerate development timelines, improve resource utilization, and enhance process understanding across the biomedical spectrum.
Conclusion
The transition from the traditional One-Factor-at-a-Time approach to systematic optimization methods like Design of Experiments and the Simplex algorithm is not merely a technical shift but a strategic imperative in modern pharmaceutical and biomedical research. The synthesis of knowledge from the four intents conclusively demonstrates that systematic methods offer a profound advantage in efficiency, cost-effectiveness, and the ability to uncover critical factor interactions that OFAT inevitably misses. By embracing these structured frameworks, researchers can develop more robust and reproducible processes, accelerate the drug development timeline, and ultimately enhance product quality. Future directions will likely involve the deeper integration of these methodologies with machine learning and artificial intelligence, enabling even more powerful predictive modeling and autonomous optimization in complex biological systems, further revolutionizing R&D in the life sciences.
References
- 1. Comparing Traditional Approaches to Experimental Design [https://learning.acsgcipr.org/process-design/design-of-experiments/comparing-traditional-approaches-to-experimental-design/]
- 2. OFAT (One-Factor-at-a-Time). All You Need to Know [https://www.6sigma.us/six-sigma-in-focus/ofat-one-factor-at-a-time/]
- 3. Comparing Different Approaches for Design of ... [https://link.springer.com/chapter/10.1007/978-90-481-2311-7_52]
- 4. Optimization Techniques for the Development of ... [https://link.springer.com/chapter/10.1007/978-981-97-9230-6_3]
- 5. Principles of early drug discovery - PMC - PubMed Central [https://pmc.ncbi.nlm.nih.gov/articles/PMC3058157/]
- 6. Understanding OFAT and Multiple OFAT: Exploring ... [https://www.linkedin.com/pulse/understanding-ofat-multiple-exploring-experimental-approaches-rao-gq5gc]
- 7. One-factor-at-a-time and response surface statistical ... [https://link.springer.com/article/10.1007/s42452-020-2351-x]
- 8. Don't use the 'one factor at a time' (OFAT) approach when ... [https://www.sqt-training.com/2012/08/dont-use-the-one-factor-at-a-time-ofat-approach-when-designing-experiments/]
- 9. Strategies for Fermentation Medium Optimization: An In-Depth ... [https://pmc.ncbi.nlm.nih.gov/articles/PMC5216682/]
- 10. One-factor-at-a-time method [https://en.wikipedia.org/wiki/One-factor-at-a-time_method]
- 11. Top 5 Drug Discovery Trends 2025 Driving Breakthroughs [https://www.pelagobio.com/cetsa-drug-discovery-resources/blog/drug-discovery-trends-2025/]
- 12. Reaction Conditions Optimization: The Current State [https://prismbiolab.com/reaction-conditions-optimization-the-current-state/]
- 13. Moving beyond one-factor-at-a-time (OFAT) testing [https://community.jmp.com/t5/JMP-Blog/Moving-beyond-one-factor-at-a-time-OFAT-testing/ba-p/804347]
- 14. Self-optimising processes and real-time ... - RSC Publishing [https://pubs.rsc.org/en/content/articlehtml/2020/re/d0re00081g]
- 15. Understanding the Simplex Method for Linear Programming [https://www.ai-futureschool.com/en/mathematics/understanding-the-simplex-method.php]
- 16. Researchers Discover the Optimal Way To Optimize [https://www.quantamagazine.org/researchers-discover-the-optimal-way-to-optimize-20251013/]
- 17. Simplex method - (Linear Algebra and Differential Equations) [https://fiveable.me/key-terms/linear-algebra-and-differential-equations/simplex-method]
- 18. The Simplex Method [https://labs.acme.byu.edu/Volume2/Simplex/Simplex.html]
- 19. Application of Design of Experiments in the Development of ... [https://pmc.ncbi.nlm.nih.gov/articles/PMC9958669/]
- 20. Analyzing the Simplex Method by the Book | Sophie Huiberts [https://www.linkedin.com/posts/sophie-huiberts_beyond-smoothed-analysis-analyzing-the-simplex-activity-7388569655520686080-Vh-U]
- 21. A Practical Start-Up Guide for Synthetic Chemists to ... [https://pmc.ncbi.nlm.nih.gov/articles/PMC12150262/]
- 22. Simplex algorithm [https://en.wikipedia.org/wiki/Simplex_algorithm]
- 23. What Optimization Terminologies for Linear Programming ... [https://towardsdatascience.com/breaking-down-optimization-terminologies-for-linear-programming/]
- 24. Feasible region [https://en.wikipedia.org/wiki/Feasible_region]
- 25. A Comprehensive Guide to Interaction Terms in Linear ... [https://developer.nvidia.com/blog/a-comprehensive-guide-to-interaction-terms-in-linear-regression/]
- 26. 4.2: Maximization By The Simplex Method [https://math.libretexts.org/Bookshelves/Applied_Mathematics/Applied_Finite_Mathematics_(Sekhon_and_Bloom)/04%3A_Linear_Programming_The_Simplex_Method/4.02%3A_Maximization_By_The_Simplex_Method]
- 27. A Systematic Intelligent Optimization Framework for a ... [https://www.mdpi.com/1999-4923/17/11/1419]
- 28. Simplex Method : The Easy Way - Vijayasri Iyer [https://vijayasriiyer.medium.com/simplex-method-the-easy-way-f19e61095ac7]
- 29. DoE for Optimizing Pharma Processes & Bio Experiments [https://www.aragen.com/optimizing-pharmaceutical-processes-and-enhancing-biological-experimental-design-efficiency-with-design-of-experiments-methodology/]
- 30. Response Surface Techniques as an Inevitable Tool in ... [https://www.intechopen.com/chapters/1183176]
- 31. Response Surface Methodology (RSM) in Design of ... [https://www.6sigma.us/six-sigma-in-focus/response-surface-methodology-rsm/]
- 32. Response surface methodology (RSM): An overview to ... [https://ijmronline.org/archive/volume/9/issue/4/article/19127]
- 33. Response Surface Methodology - Overview & Applications [https://www.neuralconcept.com/post/response-surface-methodology-overview-applications]
- 34. Lonza Launches Design2Optimize™ Platform to ... [https://www.lonza.com/media-advisories/2025-05-22-14-00]
- 35. Key Principles of Experimental Design [https://www.jmp.com/en/statistics-knowledge-portal/design-of-experiments/key-design-of-experiments-concepts/key-principles-of-experimental-design]
- 36. Main Principles of experimental design: the 3 “R's” [https://passel2.unl.edu/view/lesson/2e09f0055f13/7]
- 37. 2.1 Replication, randomization, and local control [https://fiveable.me/experimental-design/unit-2/replication-randomization-local-control/study-guide/vIxW7WpYfRK9vDp0]
- 38. The Importance of a Robust Formulation for Long-Term ... [https://www.pharmasalmanac.com/articles/the-importance-of-a-robust-formulation-for-long-term-drug-development-success]
- 39. Topical drug formulation for enhanced permeation [https://www.sciencedirect.com/science/article/pii/S0378517325001425]
- 40. Why do active set methods or the simplex method pivot ... [https://scicomp.stackexchange.com/questions/27987/why-do-active-set-methods-or-the-simplex-method-pivot-only-one-variable-at-a-tim]
- 41. Central Composite Design: An Optimization Tool for ... [https://archives.jyoungpharm.org/7991/]
- 42. Comparative Study for Optimization of Pharmaceutical Self ... [https://pubmed.ncbi.nlm.nih.gov/30218266/]
- 43. Central Composite Design Based Optimization of ... [https://pubmed.ncbi.nlm.nih.gov/40439523/]
- 44. Central composite design aided optimization and ... [https://japsonline.com/abstract.php?article_id=4424&sts=2]
- 45. Response Surface Methodology using desirability ... [https://www.nature.com/articles/s41598-025-96376-x]
- 46. Sequential Simplex Method [https://link.springer.com/rwe/10.1007/978-3-030-54621-2_598-1]
- 47. On the use of sequential simplex procedure for ... [https://link.springer.com/article/10.1007/BF02321285]
- 48. Mathematical Optimization Techniques in Drug Product ... [https://www.sciencedirect.com/science/article/pii/S0022354915376048]
- 49. The Dangers of OFAT Experimentation [https://community.jmp.com/t5/JMP-Blog/The-Dangers-of-OFAT-Experimentation/ba-p/599803]
- 50. Using design of experiments to guide genetic optimization of ... [https://pmc.ncbi.nlm.nih.gov/articles/PMC10981448/]
- 51. Optimization using the gradient and simplex methods [https://www.sciencedirect.com/science/article/abs/pii/S0039914015300175]
- 52. The Evolution of Optimization Methods | by Victor Guiller [https://medium.com/@victor.guiller/the-evolution-of-optimization-methods-e7616e97343f]
- 53. Optimization - Control Theory [https://fab.cba.mit.edu/classes/865.21/topics/control/08_optimization.html]
- 54. How to Choose an Optimization Algorithm [https://www.machinelearningmastery.com/tour-of-optimization-algorithms/]
- 55. Design Of Experiment (DOE) Methodology Effectively ... [https://www.cellandgene.com/doc/design-of-experiment-doe-methodology-effectively-reduces-cost-time-for-analytical-method-development-0001]
- 56. Recent Advances in Optimization Methods for Machine ... [https://www.mdpi.com/2227-7390/13/13/2210]
- 57. Deep active optimization for complex systems [https://www.nature.com/articles/s43588-025-00858-x]
- 58. Advancing drug development with “Fit-for-Purpose” modeling ... [https://pmc.ncbi.nlm.nih.gov/articles/PMC12436579/]
- 59. Revolutionizing Pharma Drug Discovery in 2025 [https://newristics.com/revolutionizing-pharma-drug-discovery-in-2025.php]
- 60. AI Model Optimization Techniques for Enhanced ... [https://www.netguru.com/blog/ai-model-optimization]
- 61. New strategies to enhance the efficiency and precision of ... [https://www.frontiersin.org/journals/pharmacology/articles/10.3389/fphar.2025.1550158/full]
- 62. Interior point methods in the year 2025 [https://www.sciencedirect.com/science/article/pii/S2192440625000024]
- 63. Experimental analysis and optimization of hydrogen pre ... [https://www.nature.com/articles/s41598-025-16832-6]
- 64. Linear Optimization and the Simplex Method: How Math ... [https://medium.com/@darkquantum/linear-optimization-and-the-simplex-method-how-math-finds-the-best-solution-d58987aad808]
- 65. Robust Optimization of Biological Protocols - PMC [https://pmc.ncbi.nlm.nih.gov/articles/PMC4582800/]
- 66. A model aggregation approach for high-dimensional large- ... [https://www.sciencedirect.com/science/article/abs/pii/S0377221725008057]
- 67. Optimizing high dimensional data classification with a ... [https://www.nature.com/articles/s41598-025-08699-4]
- 68. New research improves simplex algorithm for optimization [https://www.linkedin.com/posts/josephinepetrick_if-your-work-relies-on-optimization-this-activity-7384604045669228544-agrd]
- 69. How to Run a Design of Experiments [https://www.pcdandf.com/pcdesign/index.php/editorial/menu-features/18436-how-to-run-a-design-of-experiments]
- 70. Design and analysis of simple-comparative experiments ... [https://statease.com/blog/design-and-analysis-of-simple-comparative-experiments-made-easy/]
- 71. One Factor At a Time (OFAT) Experimentation [https://www.benchmarksixsigma.com/forum/topic/35533-one-factor-at-a-time-ofat-experimentation/]
- 72. A comparison of Evolutionary Operation and Simplex for ... [https://www.sciencedirect.com/science/article/abs/pii/S0169743914002007]
- 73. Schedule optimization for chemical library synthesis [https://pubs.rsc.org/en/content/articlehtml/2025/dd/d4dd00327f]
- 74. Achieving robust processes via three experiment-design ... [https://statease.com/blog/achieving-robust-processes-via-three-experiment-design-options-part-1/]
- 75. Best Practices For Implementing Design Of Experiments ... [https://enertherm-engineering.com/best-practices-for-implementing-design-of-experiments-doe-in-industrial-settings/]
- 76. Robust parameter design [https://en.wikipedia.org/wiki/Robust_parameter_design]
- 77. Comparison of the time efficiency of an optimization ... [https://scicomp.stackexchange.com/questions/15984/comparison-of-the-time-efficiency-of-an-optimization-problem-formulated-as-a-net]
- 78. Simulation-optimization framework for the digital design of ... [https://pmc.ncbi.nlm.nih.gov/articles/PMC10765421/]
- 79. Optimization - PMC - PubMed Central - NIH [https://pmc.ncbi.nlm.nih.gov/articles/PMC6644965/]
- 80. Experimental Design Approaches in Method Optimization [https://www.chromatographyonline.com/view/experimental-design-approaches-method-optimization-0]
- 81. The role of validation in optimization models for forest ... [https://annforsci.biomedcentral.com/articles/10.1186/s13595-024-01235-w]
- 82. Validation and verification of mathematical models [https://or.stackexchange.com/questions/1193/validation-and-verification-of-mathematical-models]
- 83. Stages Process Validation Explained [https://www.nnit.com/insights/articles/stages-process-validation-explained]
- 84. Validation Protocol | Pioneering Diagnostics - bioMerieux [https://www.biomerieux.com/us/en/education/resource-hub/white-papers/pharmaceutical-qc-white-papers/validation-protocol.html]
- 85. Experimental design and optimization [https://www.sciencedirect.com/science/article/abs/pii/S0169743998000653]
- 86. Advanced Cross-Validation Techniques for Optimizing ... [https://galileo.ai/blog/llm-cross-validation-techniques]
- 87. Quality by Design Approach to Analytical Method ... [https://www.catalent.com/better-biotech/building-products/quality-by-design-approach-to-analytical-method-optimization-2/]
- 88. OPTIMIZATION TECHNIQUES FOR PHARMACEUTICAL ... [https://hammer.purdue.edu/articles/thesis/OPTIMIZATION_TECHNIQUES_FOR_PHARMACEUTICAL_MANUFACTURING_AND_DESIGN_SPACE_ANALYSIS/20348853]
- 89. Constrained Optimization Methods in Health Services ... [https://www.sciencedirect.com/science/article/pii/S1098301517300827]
- 90. Optimizing Experimental Protocols for Quantitative Behavioral ... [https://jnm.snmjournals.org/content/48/2/277]