Complete Validation of a UFLC-DAD Method for Carbonyl Compounds Analysis: An ICH Q2(R2) Compliant Framework
This article provides a comprehensive guide for researchers and pharmaceutical professionals on validating a UFLC-DAD method for quantifying carbonyl compounds, following the latest ICH Q2(R2) guidelines effective June 2024.
Complete Validation of a UFLC-DAD Method for Carbonyl Compounds Analysis: An ICH Q2(R2) Compliant Framework
Abstract
This article provides a comprehensive guide for researchers and pharmaceutical professionals on validating a UFLC-DAD method for quantifying carbonyl compounds, following the latest ICH Q2(R2) guidelines effective June 2024. It covers foundational principles from carbonyl chemistry and ICH requirements to detailed methodological application, including optimization of extraction and chromatographic parameters. The content also addresses common troubleshooting scenarios and presents a full validation protocol with acceptance criteria, supported by comparative analysis with mass spectrometric detection. This resource aims to equip scientists with the knowledge to develop, optimize, and validate robust, regulatory-compliant analytical procedures for accurate quantification of carbonyl compounds in various matrices.
Carbonyl Compounds and ICH Q2(R2) Fundamentals: Building a Compliant Analytical Framework
Carbonyl compounds, characterized by the presence of a carbon-oxygen double bond (C=O), represent one of the most fundamental and versatile functional groups in organic chemistry with significant implications across pharmaceutical and food sciences. These compounds, encompassing aldehydes, ketones, carboxylic acids, esters, and amides, play dual roles as both essential active pharmaceutical ingredients and problematic degradation products. In the pharmaceutical sector, carbonyl groups are crucial for drug efficacy and functionality, participating in hydrogen bonding that enables critical drug-target interactions while influencing solubility and bioavailability profiles [1]. Conversely, in food science, carbonyl compounds emerge as contaminants migrating from ecological food contact materials, raising substantial safety concerns [2].
The analysis of these compounds presents unique challenges due to their reactivity, polarity, and presence in complex matrices. This article frames the discussion within the context of validating an Ultra-Fast Liquid Chromatography with Diode Array Detection (UFLC-DAD) method for carbonyl compound analysis according to International Council for Harmonisation (ICH) guidelines. The objective comparison of analytical techniques and their performance parameters provided herein serves as essential groundwork for researchers developing robust analytical methods for carbonyl compound detection in stability studies and quality control applications.
Carbonyl Compounds in Pharmaceutical Degradation
In pharmaceutical chemistry, carbonyl compounds manifest both as deliberate structural components of active pharmaceutical ingredients (APIs) and as degradation products formed during storage or metabolism. The carbonyl group's strategic incorporation into drug molecules enables key interactions with biological targets through hydrogen bonding and dipole interactions [1]. Approximately 30% of commercial pharmaceuticals contain carbonyl functional groups as integral components of their molecular architecture, highlighting their therapeutic significance.
Despite their utility, carbonyl-containing pharmaceuticals face stability challenges that can compromise drug safety and efficacy. The polarized nature of the carbon-oxygen double bond renders these compounds susceptible to nucleophilic attack, oxidation, and hydrolysis [1]. These degradation pathways can lead to:
- Loss of potency through API degradation
- Formation of potentially toxic impurities
- Changes in formulation physicochemical properties
- Reduced shelf-life and altered bioavailability
Carbonyl groups can also form unwanted adducts with proteins and other biomolecules through haptenization processes, potentially triggering immune responses or enhancing toxicity profiles [1]. This reactivity presents particular challenges for formulation scientists who must develop stable dosage forms while maintaining therapeutic activity.
Table 1: Common Carbonyl Functional Groups in Pharmaceuticals and Their Degradation Pathways
| Carbonyl Type | Pharmaceutical Relevance | Primary Degradation Pathways | Stability Concerns |
|---|---|---|---|
| Aldehydes | Reactive intermediates in synthesis | Oxidation to carboxylic acids | High reactivity, potential genotoxicity |
| Ketones | Active moieties in APIs (e.g., corticosteroids) | Photodegradation, reduction to alcohols | Photoinstability, enantiomeric interconversion |
| Esters | Prodrug design (e.g., enalapril) | Hydrolysis to acids and alcohols | pH-dependent solubility, esterase metabolism |
| Amides | Peptide bonds in biologics | Hydrolysis, cyclization | Proteolytic cleavage, dimerization |
| Carboxylic acids | Salt formation for solubility | Decarboxylation, ester formation | pH-dependent degradation, metal chelation |
Carbonyl Compounds in Food Contamination and Degradation
Carbonyl compounds represent significant contaminants in food products, primarily migrating from packaging materials or forming during processing and storage. The shift toward eco-friendly food contact materials (FCMs) including plant-based materials (palm leaves, sugar cane, wheat bran), bioplastics (polylactide), and recyclable materials has introduced new challenges regarding carbonyl migration [2]. These compounds are classified as non-intentionally added substances (NIAS) that can form during manufacturing processes, particularly under elevated temperatures.
The migration of carbonyl compounds from ecological vessels to food depends on multiple factors including contact time, temperature, food type, and material properties [2]. Formaldehyde and acetaldehyde represent the most concerning migrants due to their classification as Group 1 (carcinogenic to humans) and Group 2B (probable human carcinogen) compounds, respectively, by the International Agency for Research on Cancer [2]. Beyond health implications, carbonyl migration affects sensory properties of food, with compounds like hexanal imparting "green" notes and heptanal providing citrus aromas, potentially creating unpleasant flavor profiles when combined.
Carbonyl compounds also serve as important markers for lipid oxidation in fatty foods, particularly in frying oils where the carbonyl value indicates the extent of thermal degradation [3]. The quantitative determination of carbonyl value in frying oils using Low-Field Nuclear Magnetic Resonance (LF-NMR) combined with chemometrics demonstrates the ongoing innovation in monitoring these degradation products [3].
Table 2: Carbonyl Compounds in Food Contamination: Sources and Health Implications
| Carbonyl Compound | Primary Sources in Food | Health Concerns | Odor Threshold | Typical Migration Levels |
|---|---|---|---|---|
| Formaldehyde | Plastic bottles, biodegradable cutlery | Carcinogenic, mutagenic | Low | 1.2-13.8 μg/L (water, 70°C) |
| Acetaldehyde | PET bottles, polymer coatings | Probable carcinogen | Moderate | 0.7-9.5 μg/L (water, 70°C) |
| Acetone | Recycled paper, plant-based materials | Kidney/blood effects | High | 0.5-4.8 μg/L (water, 70°C) |
| Hexanal | Lipid oxidation, plant materials | Low acute toxicity | Low (green odor) | 0.5-3.2 μg/L (water, 70°C) |
| Nonanal | Plant-based materials, packaging | Low acute toxicity | Low (citrus odor) | 0.3-2.1 μg/L (water, 70°C) |
Analytical Method Comparison for Carbonyl Compound Detection
The analysis of carbonyl compounds presents significant analytical challenges due to their reactivity, volatility, and presence at trace levels in complex matrices. Various analytical techniques have been developed and optimized to address these challenges, each with distinct advantages and limitations. The following comparison focuses on chromatographic methods relevant to pharmaceutical and food applications.
Chromatographic Techniques
Ultra-Fast Liquid Chromatography with DAD detection (UFLC-DAD) represents a significant advancement in carbonyl compound analysis, offering improved resolution, sensitivity, and throughput compared to conventional HPLC methods. The method leverages 2,4-dinitrophenylhydrazine (DNPH) derivatization to form stable hydrazone derivatives that can be separated and quantified with high precision [4].
Table 3: Performance Comparison of Analytical Methods for Carbonyl Compounds
| Analytical Method | Detection Limit | Analysis Time | Key Advantages | Limitations | Applicable Matrices |
|---|---|---|---|---|---|
| HPLC-UV/Vis (DNPH) | 0.1-0.5 μg/L | 45-60 minutes | Established methodology, regulatory acceptance | Co-elution issues, longer run times | Water, air, pharmaceutical extracts |
| UFLC-DAD (DNPH) | 0.05-0.2 μg/L | <15 minutes | High resolution, rapid analysis, improved sensitivity | Method transfer challenges | Complex matrices, stability samples |
| UHPLC-MS/MS | 0.01-0.05 μg/L | <10 minutes | Superior selectivity, structural confirmation, wide compound range | High equipment cost, specialized training | Food simulants, biological samples |
| GC-MS (after derivatization) | 0.1-0.3 μg/L | 20-30 minutes | Excellent separation, library matching | Limited to volatile derivatives | Volatile carbonyls, headspace analysis |
| LF-NMR with chemometrics | Matrix-dependent | Rapid screening | Non-destructive, minimal sample preparation | Lower sensitivity, model development required | Frying oils, bulk pharmaceuticals |
The transition to UHPLC-MS/MS has enabled the detection of 47 carbonyl compounds with various structures, including 28 aliphatic saturated mono-carbonyls, 8 aromatic mono-carbonyls, 8 other unsaturated mono-carbonyls, and 3 di-carbonyls, demonstrating the power of advanced separation coupled with selective detection [4]. This comprehensive profiling is particularly valuable for identifying unknown degradation products in stability studies.
Experimental Protocols and Workflows
DNPH Derivatization Procedure
The 2,4-dinitrophenylhydrazine derivatization represents the gold standard for carbonyl compound analysis in complex matrices. The following optimized protocol ensures complete derivatization while minimizing artifact formation:
DNPH Solution Preparation: Dissolve 0.5 g DNPH in 1 L of acetonitrile acidified with 2% (v/v) phosphoric acid. Purge with nitrogen to prevent oxidation.
Sample Derivatization: Mix 1.0 mL of standard or sample solution with 1.0 mL of DNPH solution in a sealed vial.
Reaction Conditions: Heat at 40°C for 30 minutes with occasional shaking. Protect from light throughout the process.
Quenching and Dilution: Add 2.0 mL of sodium bicarbonate solution (5% w/v) to neutralize excess acid. Dilute to final volume with mobile phase.
Analysis: Inject 5-10 μL onto the UFLC-DAD system for separation and quantification.
The derivatives are separated using a reversed-phase C18 column (2.1 × 100 mm, 1.8 μm) with a mobile phase gradient of acetonitrile/water at a flow rate of 0.4 mL/min and column temperature maintained at 40°C [4]. Detection is typically performed at 360 nm, the absorption maximum for DNPH derivatives.
ICH Validation Parameters for UFLC-DAD Method
Validation of analytical procedures according to ICH Q2(R2) guidelines establishes that the method is suitable for its intended purpose [5]. The following experiments demonstrate compliance with key validation parameters:
Specificity: Inject blank matrix, standard solutions, and stressed samples to demonstrate separation from potentially interfering compounds. Resolution factor should be >2.0 between critical peak pairs.
Linearity and Range: Prepare calibration standards at a minimum of five concentration levels across the expected working range. The correlation coefficient (r) should be ≥0.999, and the y-intercept should not differ significantly from zero.
Accuracy: Perform recovery studies by spiking blank matrix with known quantities of carbonyl compounds at three concentration levels (80%, 100%, 120% of target). Average recovery should be 98-102% with RSD <2%.
Precision:
- Repeatability (intra-day): Six replicate injections at 100% concentration, RSD <1%
- Intermediate precision (inter-day): Duplicate analysis on three different days by different analysts, RSD <2%
Limit of Detection (LOD) and Quantitation (LOQ): Determine using signal-to-noise ratios of 3:1 and 10:1, respectively. For carbonyl compounds, typical LOQ values range from 0.05-0.2 μg/L [4].
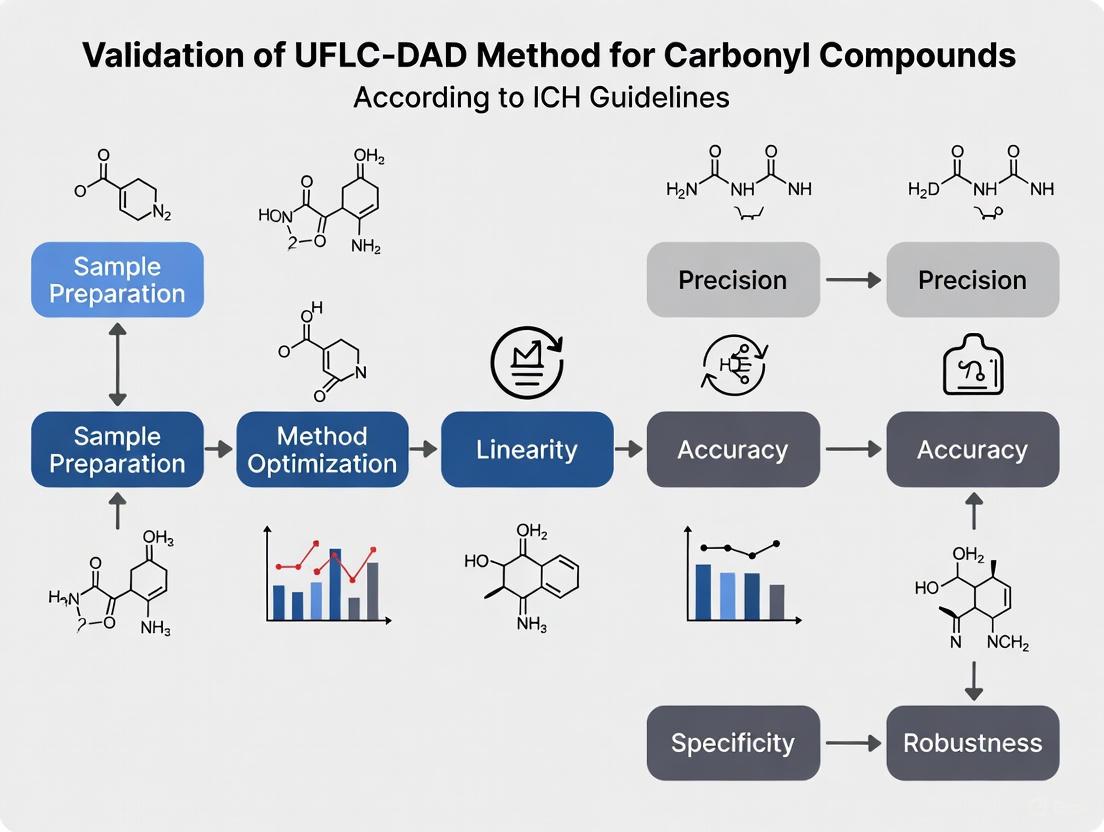
The following diagram illustrates the complete method validation workflow according to ICH guidelines:
Figure 1: ICH Method Validation Workflow
Carbonyl Migration Pathways and Analytical Strategy
Understanding the pathways of carbonyl compound formation and migration is essential for developing effective analytical strategies. The following diagram illustrates the primary sources and analysis approaches for carbonyl compounds in food and pharmaceutical systems:
Figure 2: Carbonyl Analysis Strategy
The Scientist's Toolkit: Essential Research Reagents
Successful analysis of carbonyl compounds requires specific reagents and materials optimized for derivatization, separation, and detection. The following table details essential components for establishing a validated UFLC-DAD method according to ICH guidelines.
Table 4: Essential Research Reagents for Carbonyl Compound Analysis
| Reagent/Material | Specification | Function in Analysis | Handling Considerations |
|---|---|---|---|
| 2,4-Dinitrophenylhydrazine (DNPH) | HPLC grade, ≥98% purity | Derivatizing agent for carbonyl compounds | Light-sensitive, store in amber bottles |
| Phosphoric Acid | Trace metal grade, 85% | Acid catalyst for derivatization | Use in fume hood, corrosive |
| Carbonyl-DNPH Standards | Certified reference materials | Quantification and method validation | Store at -20°C, limited stability after opening |
| Acetonitrile | HPLC gradient grade | Mobile phase component and solvent | Low UV cutoff, hygroscopic |
| Water | HPLC grade, 18.2 MΩ·cm | Mobile phase component | Freshly prepared, degassed |
| C18 UHPLC Column | 1.8-2.1 μm particle size, 100 mm length | Stationary phase for separation | Condition with mobile phase, avoid pH >8 |
| Solid Phase Extraction Cartridges | C18 or specific for DNPH derivatives | Sample cleanup and concentration | Pre-wash with solvent to remove contaminants |
Carbonyl compounds present both opportunities and challenges in pharmaceutical and food sciences, serving as essential active ingredients while also representing significant degradation products and contaminants. The development and validation of robust analytical methods, particularly UFLC-DAD with DNPH derivatization, provides researchers with powerful tools to monitor these compounds in stability studies and quality control applications.
The comparison of analytical techniques presented in this guide demonstrates that modern chromatographic methods offer significant advantages in sensitivity, speed, and selectivity over traditional approaches. When properly validated according to ICH guidelines, these methods generate reliable data essential for understanding carbonyl compound behavior, ensuring product safety, and maintaining quality throughout shelf-life.
As material science continues to evolve toward sustainable alternatives and pharmaceutical formulations become increasingly complex, the accurate monitoring of carbonyl compounds will remain critical for assessing stability, safety, and quality across multiple industries.
The International Council for Harmonisation (ICH) Q2(R2) guideline, titled "Validation of Analytical Procedures," represents the first major update to analytical validation standards in nearly two decades, replacing the previous ICH Q2(R1) which had been in effect since 2005 [6]. Approved by the ICH Steering Committee in November 2023 and officially implemented by multiple regulatory authorities including the European Commission, US FDA, and China's NMPA from June 2024, this revision fundamentally modernizes the approach to analytical method validation [6] [7] [8]. The update was necessitated by significant gaps between traditional validation approaches and contemporary analytical techniques, which had become increasingly apparent as pharmaceutical development expanded beyond small molecules to include complex modalities like biologics, cell/gene therapies, and advanced analytical technologies [6] [7].
The revision of ICH Q2(R2) was developed in parallel with the entirely new ICH Q14 guideline on "Analytical Procedure Development," creating a synergistic framework that connects method development with validation through a systematic, science- and risk-based approach [6] [9]. This coordinated implementation marks a significant shift from treating validation as a one-time event to embracing a comprehensive lifecycle management approach for analytical procedures [9]. The updated guideline applies not only to new or revised analytical procedures used for release and stability testing of commercial drug substances and products, but also to other analytical procedures used as part of the control strategy following a risk-based approach [5].
Key Changes from ICH Q2(R1) to ICH Q2(R2)
Expanded Scope and Technical Modernization
ICH Q2(R2) introduces substantial technical expansions to accommodate the evolving landscape of analytical technologies used in pharmaceutical analysis. The guideline now explicitly addresses validation approaches for multivariate analytical procedures and other modern techniques that were not adequately covered in the previous version [6] [7]. This includes specific considerations for methods such as NIR spectroscopy, NMR, and multivariate calibration models commonly employed in Process Analytical Technology (PAT) and Real-Time Release Testing (RTRT) [7]. The updated guideline also better accommodates the unique validation requirements for biological assays and biotech products, which often demonstrate more inherent variability than traditional small-molecule pharmaceuticals [7] [9].
The modernization extends to the incorporation of contemporary quality principles that had been largely absent from the previous guideline. ICH Q2(R2) now explicitly aligns with the ICH Q8-Q9-Q10 trilogy covering Pharmaceutical Development, Quality Risk Management, and Quality Systems [6]. This alignment facilitates a more integrated approach to analytical validation that incorporates Quality by Design (QbD) principles and risk-based decision-making throughout the analytical procedure lifecycle [6] [9]. The guideline also formally recognizes the concept of platform analytical procedures for the first time, providing a framework for applying standardized validation approaches across multiple molecules that are sufficiently similar with respect to the attributes being measured [7].
Statistical Rigor and Validation Parameters
The updated guideline introduces enhanced statistical requirements that represent significant departures from previous practices. For accuracy and precision assessments, ICH Q2(R2) now mandates that confidence intervals must be reported and shown to be compatible with acceptance criteria, moving beyond the simple point estimates previously emphasized [7]. This change reflects the growing recognition that understanding the variability around validation parameters is essential for assessing method suitability [7]. Additionally, the guideline now explicitly permits combined approaches to accuracy and precision validation, acknowledging that these parameters are often interrelated in practice [7].
The validation parameters themselves have been refined to provide greater clarity and applicability to modern analytical techniques. The definitions and evaluation approaches for specificity, detection limit, quantitation limit, linearity, and range have been updated to ensure consistent interpretation across different analytical technologies [5] [9]. The guideline also provides more detailed guidance on establishing appropriate acceptance criteria for each validation parameter, emphasizing that these criteria should be scientifically justified and aligned with the intended use of the method [6] [7].
Table 1: Key Technical Changes Between ICH Q2(R1) and ICH Q2(R2)
| Validation Aspect | ICH Q2(R1) Approach | ICH Q2(R2) Enhancement | Implications for Method Validation |
|---|---|---|---|
| Scope | Primarily small molecules and traditional techniques (e.g., HPLC) | Explicit inclusion of biologics, multivariate methods, and modern analytical techniques | Broader applicability to complex modalities and advanced technologies |
| Statistical Requirements | Point estimates for accuracy/precision | Confidence interval reporting required | Increased statistical rigor; may require additional replication |
| Accuracy & Precision | Typically evaluated separately | Combined approaches permitted | More integrated assessment of method performance |
| Lifecycle Management | Validation as one-time event | Integration with Q14 for ongoing lifecycle management | Continuous verification and improvement of methods |
| Platform Approaches | Not formally addressed | Formal recognition of platform analytical procedures | Efficiency gains for similar molecules/methods |
| Robustness | Standalone requirement | Linked to development studies and control strategy | More science-based approach leveraging development data |
Lifecycle Approach and Knowledge Management
A fundamental philosophical shift in ICH Q2(R2) is the adoption of a lifecycle approach to analytical procedures, which aligns with similar concepts implemented for pharmaceutical products [9]. This perspective views method validation not as a discrete activity completed before method deployment, but as an ongoing process that spans from initial development through retirement [9]. The guideline encourages leveraging knowledge gained during method development to inform the validation strategy, potentially reducing redundant studies and focusing validation efforts on the most critical method attributes [7].
This lifecycle approach is facilitated by the close integration between ICH Q2(R2) and ICH Q14, which introduces the Analytical Target Profile (ATP) as a foundational concept [6] [10]. The ATP defines the required quality of the analytical measurement before method development begins, ensuring that the resulting method is fit-for-purpose [10]. Throughout the method lifecycle, the ATP serves as a reference point for assessing whether the method continues to meet its intended purpose, guiding decisions about method updates or revalidation [9] [10].
Implementation Challenges and Industry Readiness
Statistical Implementation Hurdles
The increased statistical rigor introduced in ICH Q2(R2) presents significant implementation challenges for the pharmaceutical industry. According to a comprehensive survey conducted by the ISPE-PQLI Analytical Method Strategy team in 2024, 76% of industry professionals expressed concerns about the new requirements for confidence intervals in accuracy and precision validation [7]. The primary concern, cited by 40% of respondents, relates to the potential need for increased replication in validation studies to generate meaningful confidence intervals from limited data sets [7]. This challenge is particularly acute for methods with inherent high variability, such as those used for biologics and cell/gene therapies, where demonstrating compliance with confidence interval requirements may necessitate substantially larger validation studies [7].
Organizations also reported significant gaps in internal statistical expertise needed to implement the new requirements effectively. Approximately 16% of survey respondents indicated that their organizations lack sufficient internal expertise to implement confidence interval reporting appropriately [7]. Additionally, 21% of respondents cited insufficient experience and data to set appropriate acceptance criteria for confidence intervals, highlighting the need for further education and potentially additional regulatory guidance on this aspect [7]. These statistical challenges are compounded by concerns about inconsistent interpretation across global regulatory agencies, particularly with smaller agencies that may have less experience with these advanced statistical approaches [7].
Organizational and Operational Challenges
Beyond statistical hurdles, organizations face substantial operational challenges in implementing the revised guideline. The transition from a traditional compliance-focused approach to the more flexible, science- and risk-based framework envisioned in ICH Q2(R2) requires significant cultural and procedural changes within organizations [9]. This includes developing new approaches to method development, validation documentation, and lifecycle management that align with the enhanced principles outlined in the guideline [9]. Organizations must also establish robust processes for leveraging prior knowledge and development data to support validation, which represents a departure from previous practices where development and validation were often treated as distinct activities [7].
The application of the new guideline to legacy products and methods presents another significant challenge. There is currently limited clarity on regulatory expectations for updating validation approaches for already-commercialized products, creating uncertainty about the scope and timing of necessary changes [7]. Similarly, implementation of platform analytical procedures, while offering potential efficiency gains, faces regulatory acceptance hurdles, with only about 10% of survey respondents reporting successful use of platform approaches for commercial products to date [7]. This suggests that despite formal recognition in the guideline, practical implementation of platform approaches will require further dialogue between industry and regulators.
Analytical Procedure Lifecycle Workflow
The following diagram illustrates the integrated analytical procedure lifecycle under ICH Q2(R2) and Q14, showing how development, validation, and ongoing monitoring activities interconnect:
Analytical Procedure Lifecycle Under ICH Q2(R2) and Q14
Implications for Analytical Method Validation Practices
Enhanced Validation Strategies
The implementation of ICH Q2(R2) necessitates more sophisticated validation strategies that incorporate earlier elements of the analytical procedure lifecycle. Organizations should now conduct method robustness testing during development rather than as part of formal validation, allowing potential method vulnerabilities to be identified and addressed before validation begins [7]. This shift enables a more efficient validation process with higher first-time success rates, as critical method parameters and their operable ranges are already understood from development studies [7]. The guideline also encourages greater use of science- and risk-based justifications for validation approaches, moving away from one-size-fits-all validation protocols toward more tailored strategies that focus on the most critical method attributes [7].
The formal recognition of platform validation approaches in ICH Q2(R2) offers significant efficiency opportunities, particularly for organizations working with similar molecules or modalities [7]. By demonstrating that multiple molecules share sufficiently similar attributes, companies can implement standardized validation approaches across their portfolio, reducing redundant validation studies [7]. However, successful implementation requires careful planning and thorough scientific justification to secure regulatory acceptance, with only about 10% of organizations having successfully implemented platform approaches for commercial products to date, though 45% plan to do so in the future [7].
Documentation and Knowledge Management
The enhanced approach to validation in ICH Q2(R2) requires more comprehensive documentation and knowledge management practices. Organizations must maintain detailed records of method development studies that inform the validation strategy, including robustness testing, parameter ranges, and risk assessments [9]. This documentation should clearly demonstrate the scientific rationale for validation decisions, including the justification for acceptance criteria and any tailored approaches applied [7] [9]. The guideline also emphasizes the importance of transparent reporting of validation results, including confidence intervals and statistical analyses, to provide a complete picture of method performance [7].
Effective knowledge management systems are essential for implementing the lifecycle approach envisioned in ICH Q2(R2) and Q14. Organizations should establish processes for capturing and leveraging method performance data throughout the method lifecycle, from development through routine use [9]. This ongoing monitoring provides valuable information that can inform method improvements and support decisions about method updates or revalidation [9]. The creation of an Analytical Procedure Lifecycle Management (APLCM) document has been proposed as a best practice to facilitate regulatory assessment and ensure comprehensive knowledge management throughout the method lifecycle [10].
Essential Research Reagents and Solutions for Compliance
Successfully implementing ICH Q2(R2)-compliant validation requires specific reagents, materials, and documentation approaches. The following table outlines key resources needed for effective compliance:
Table 2: Essential Research Reagents and Solutions for ICH Q2(R2) Compliance
| Category | Specific Resources | Function in Validation | ICH Q2(R2) Relevance |
|---|---|---|---|
| Reference Standards | Qualified impurity standards, system suitability standards | Establish method specificity, accuracy, and linearity | Critical for modernized validation parameters |
| Quality Control Samples | Representative placebo, intermediate, target concentration samples | Accuracy/precision assessment across specification range | Supports combined accuracy-precision approaches |
| Statistical Software | Confidence interval calculation tools, capability analysis programs | Statistical evaluation per new requirements | Mandatory for confidence interval reporting |
| Documentation Templates | Risk-based validation protocols, ATP templates, change control forms | Implement lifecycle approach and knowledge management | Essential for enhanced QbD approaches |
| Multivariate Analysis Tools | Chemometric software, model validation packages | Validation of modern analytical techniques | Directly supports new multivariate method guidance |
| Stability Testing Materials | Forced degradation samples, stressed placebo | Comprehensive specificity demonstration | Required for modernized specificity validation |
The implementation of ICH Q2(R2) represents a significant evolution in analytical method validation practices, moving from a prescriptive, one-time verification approach to a more flexible, science- and risk-based lifecycle paradigm. This transition, while challenging, offers substantial opportunities for improved method robustness, reduced regulatory burden through platform approaches, and more efficient knowledge management across the analytical procedure lifecycle [7] [9]. The successful implementation of these guidelines requires proactive planning, including staff training, process reevaluation, and enhanced documentation practices [9].
The pharmaceutical industry's readiness for full implementation varies significantly, with survey data indicating particular challenges in statistical applications and global regulatory alignment [7]. However, resources such as the ICH training materials released in July 2025 and industry best practice documents provide valuable support for organizations navigating this transition [11] [10]. As regulatory authorities continue to implement these guidelines and gain experience with their application, further clarification on implementation expectations will likely emerge, particularly regarding legacy products and platform approaches [7]. Ultimately, the adoption of ICH Q2(R2) and Q14 principles promises to strengthen the robustness and reliability of analytical methods throughout their lifecycle, supporting the development and manufacture of safe and effective pharmaceutical products for patients worldwide [6].
Ultra-Fast Liquid Chromatography with Diode Array Detection (UFLC-DAD) represents a significant advancement in analytical separation science. This technique combines the high-resolution separation capabilities of liquid chromatography with the sophisticated compound identification power of full-spectrum ultraviolet-visible detection. The "ultra-fast" component is achieved through the use of chromatographic columns packed with smaller particles (typically sub-2-micron) and systems capable of operating at significantly higher pressures compared to conventional High-Performance Liquid Chromatography (HPLC). This enables faster analysis times, improved resolution, and reduced solvent consumption, making it particularly valuable in high-throughput laboratory environments [12].
The Diode Array Detector (DAD) constitutes a critical improvement over traditional single-wavelength UV detectors. Instead of measuring analyte absorption at a single predetermined wavelength, the DAD simultaneously captures absorption data across a broad spectrum of wavelengths (typically 190-800 nm). This capability provides analysts with a unique "spectral fingerprint" for each separated compound, which is invaluable for both identification and purity assessment. When analyzing complex mixtures such as carbonyl compounds, the DAD allows for retrospective data analysis at different wavelengths without the need for reinjection, facilitating method development and confirmation of peak purity [13] [14]. The fundamental working principle involves passing polychromatic light through a flow cell containing the separated analytes, after which the transmitted light is dispersed onto an array of photodiodes, each measuring a specific narrow band of wavelengths simultaneously.
UFLC-DAD in the Analysis of Carbonyl Compounds: Experimental Evidence
The application of UFLC-DAD for carbonyl compound analysis typically involves a derivatization step to enhance detection sensitivity and selectivity. The most common approach utilizes 2,4-dinitrophenylhydrazine (DNPH) as a derivatizing agent, which reacts with carbonyl functional groups to form stable hydrazone derivatives that exhibit strong UV absorption and are well-suited for chromatographic separation [13] [15] [14]. The experimental workflow encompasses sample collection, derivatization, chromatographic separation, and detection, with specific conditions optimized for the target analytes and matrix.
A study focusing on occupational exposure assessment optimized a method for determining 12 carbonyl compounds in various workplace environments [13] [14]. The researchers employed an Acclaim Carbonyl C18 RSLC column (150 × 3 mm, 3 µm) maintained at 25°C for the separation. The mobile phase consisted of a gradient program mixing (A) water with 0.1% acetic acid and (B) acetonitrile with 0.1% acetic acid, starting from 60% B and increasing to 90% B over 15 minutes at a flow rate of 0.5 mL/min. Detection was performed using a DAD set at 360 nm, with spectral confirmation across 190-640 nm. This method demonstrated excellent linearity (R² between 0.996 and 0.999) and acceptable intra-day repeatability (RSD% between 0.7 and 10) for all target carbonyls [14].
In another application, researchers developed and validated a UFLC-DAD-ESI-MS method specifically for monitoring carbonyl compounds in soybean oil during thermal stress [16]. The extraction protocol was meticulously optimized, identifying 1.5 mL of acetonitrile as the ideal extraction solvent with manual stirring for 3 minutes followed by 30 minutes of sonication. The method was rigorously validated, showing average recoveries between 70.7% and 85.0% at the lowest concentration level (0.2 μg·mL⁻¹), with detection limits ranging from 0.03 to 0.1 μg·mL⁻¹. When applied to soybean oil heated to 180°C, the method successfully identified and quantified ten carbonyl compounds, with 4-hydroxy-2-nonenal (36.9 μg·g⁻¹), 2,4-decadienal (34.8 μg·g⁻¹), and 2,4-heptadienal (22.6 μg·g⁻¹) presenting the highest concentrations after prolonged heating [16].
The following diagram illustrates the typical experimental workflow for carbonyl compound analysis using UFLC-DAD:
Comparative Performance: UFLC-DAD Versus Alternative Analytical Techniques
When evaluating UFLC-DAD for carbonyl compound analysis, it is essential to compare its performance characteristics with other commonly employed analytical techniques. The most relevant comparison involves contrasting UFLC-DAD with UFLC coupled to mass spectrometry (MS) detection, as both utilize the same separation principles but differ significantly in detection capabilities. Additionally, comparison with gas chromatography (GC) methods provides insight into technique selection for specific application requirements.
A comprehensive study directly compared UFLC-DAD with UFLC-MS/MS for determining 12 carbonyl compounds in workplace environments [14]. While both methods demonstrated acceptable linearity and precision, the MS/MS detection showed significantly higher sensitivity, enabling accurate quantification in 98% of samples compared to only 32% with DAD detection. The concentration values obtained for formaldehyde and acetaldehyde showed good agreement between both techniques (0.1-30% deviation), but the deviation increased substantially for less abundant carbonyl congeners where detection sensitivity becomes more critical [14].
Table 1: Performance Comparison Between UFLC-DAD and UFLC-MS/MS for Carbonyl Compound Analysis
| Performance Characteristic | UFLC-DAD | UFLC-MS/MS |
|---|---|---|
| Linear Range | 0.2-10.0 μg·mL⁻¹ [16] | Wider dynamic range |
| Detection Limits | 0.03-0.1 μg·mL⁻¹ [16] | Significantly lower |
| Quantification Success Rate | 32% of samples [14] | 98% of samples [14] |
| Selectivity | Moderate (spectral matching) | High (mass identification) |
| Equipment Cost | Moderate | High |
| Operational Complexity | Moderate | High |
| Spectral Information | Full UV-Vis spectrum | Mass fragmentation pattern |
The fundamental advantage of DAD detection lies in its relatively lower operational complexity and equipment costs compared to MS-based detection, making it accessible for laboratories with budget constraints or those performing routine analyses where the highest sensitivity is not required [14]. Additionally, DAD provides full UV-Vis spectral information that can be valuable for compound identification through spectral matching, though with less specificity than mass spectral data. For targeted analysis of known carbonyl compounds in relatively high concentrations, such as in oil stability studies or industrial hygiene monitoring with sufficient exposure levels, UFLC-DAD provides a cost-effective and reliable analytical solution [16] [14].
Validation of UFLC-DAD Methods According to ICH Guidelines
The validation of analytical procedures is a fundamental requirement in pharmaceutical and regulatory science to ensure that methods produce reliable and reproducible results that are fit for their intended purpose. The International Council for Harmonisation (ICH) provides comprehensive guidelines for analytical procedure validation, specifically outlined in the ICH Q2(R2) document titled "Validation of Analytical Procedures" [8] [5]. This guideline presents a structured framework for validating various types of analytical procedures, including chromatographic methods such as UFLC-DAD.
The ICH Q2(R2) guideline emphasizes a science- and risk-based approach to validation, encouraging the use of data derived from method development studies to support validation elements where appropriate [17]. For UFLC-DAD methods targeting carbonyl compounds, the key validation characteristics typically assessed include specificity, linearity, accuracy, precision, detection limit (DL), quantification limit (QL), and robustness. The revised guideline introduces the concept of "reportable range" which encompasses the "working range" including suitability of the calibration model and verification of the lower range limit [17].
Table 2: Key Validation Parameters for UFLC-DAD Methods According to ICH Q2(R2)
| Validation Parameter | Experimental Approach | Acceptance Criteria Example |
|---|---|---|
| Specificity | Resolution from potentially interfering compounds; peak purity assessment via DAD spectrum | Baseline separation (R > 1.5); peak purity index > 990 |
| Linearity/Working Range | Calibration curves with minimum 5 concentration levels; evaluation of residuals | R² > 0.998; residuals within ±5% |
| Accuracy | Recovery studies using spiked samples at multiple concentration levels | Mean recovery 90-110% |
| Precision | Repeatability (multiple injections of same preparation) and intermediate precision (different days, analysts) | RSD < 2% for repeatability; < 5% for intermediate precision |
| Detection Limit (DL) | Signal-to-noise ratio (typically 3:1) or based on standard deviation of response and slope | S/N ≥ 3 |
| Quantification Limit (QL) | Signal-to-noise ratio (typically 10:1) or based on standard deviation of response and slope with acceptable precision and accuracy | S/N ≥ 10; RSD < 5% |
| Robustness | Deliberate variations in method parameters (flow rate, temperature, mobile phase composition) | Retention time and peak area RSD < 2% |
The validation study for a UFLC-DAD method determining carbonyl compounds in soybean oil during continuous heating provides a practical example of ICH-compliant validation [16]. The researchers established linearity across concentration ranges of 0.2 to 10.0 μg·mL⁻¹ for all target analytes, with detection limits ranging from 0.03 to 0.1 μg·mL⁻¹. Accuracy was demonstrated through recovery studies at the lowest concentration level, showing recoveries between 70.7% and 85.0%, which, while slightly below the ideal 90-110% range, were considered acceptable for the complex matrix with appropriate justification [16]. Method specificity was confirmed through both chromatographic resolution and DAD spectral purity assessment, demonstrating the value of diode array detection in confirming analyte identity and purity.
Essential Research Reagent Solutions for Carbonyl Analysis by UFLC-DAD
The successful implementation of UFLC-DAD methods for carbonyl compound analysis relies on several critical reagents and materials that enable efficient sampling, derivatization, separation, and detection. The following table summarizes these essential research solutions and their specific functions in the analytical workflow:
Table 3: Essential Research Reagents and Materials for Carbonyl Analysis by UFLC-DAD
| Reagent/Material | Function/Application | Examples/Specifications |
|---|---|---|
| DNPH Cartridges | Sampling and derivatization; collect airborne carbonyls and convert to hydrazones | Dual-bed with DNPH and BPE coating; 130 mg BPE silica, 270 mg DNPH silica [13] |
| DNPH Solution | Liquid-phase derivatization of carbonyl compounds in liquid or extracted samples | 0.15% in acetonitrile [15] |
| Acetonitrile (ACN) | Mobile phase component; extraction solvent; standard preparation | HPLC gradient grade [13] [15] |
| Acetic Acid/Formic Acid | Mobile phase modifier; improves chromatographic peak shape | 0.1% in water and/or acetonitrile [13] [15] |
| Carbonyl-DNPH Standards | Method calibration and quantification reference | Commercial mixtures (e.g., 12 Carbonyl-DNPH Derivatives) [13] |
| C18 Chromatographic Columns | Stationary phase for separation of carbonyl-DNPH derivatives | Sub-2μm particles for UFLC; e.g., Acclaim Carbonyl C18 (150 × 3 mm, 3 μm) [13] |
| Syringe Filters | Sample cleanup prior to injection; particulate removal | PTFE, 0.22 μm [13] |
The selection and quality of these reagents directly impact method performance. For instance, the use of DNPH-coated cartridges containing both derivatizing agent and an ozone scrubber (1,2-bis(2-pyridyl)ethylene or BPE) is critical for accurate airborne carbonyl determination, as ozone can interfere with the derivatization reaction and cause negative artifacts [13]. Similarly, the use of high-purity acetonitrile and appropriate acid modifiers in the mobile phase is essential for achieving reproducible separations with minimal baseline noise, which is particularly important for achieving low detection limits with DAD detection.
The following diagram maps the logical relationship between analytical challenges in carbonyl compound analysis and the corresponding UFLC-DAD solutions:
UFLC-DAD represents a robust, reliable, and accessible analytical platform for the determination of carbonyl compounds across various applications. While MS detection offers superior sensitivity and definitive identification capabilities, UFLC-DAD maintains significant relevance for applications where target analytes are present at sufficiently high concentrations, budget constraints exist, or when full UV-Vis spectral information provides added value for compound identification. The technique has been successfully applied to diverse sample matrices including heated oils, workplace air, and building materials, demonstrating its versatility [16] [13] [15].
When implementing UFLC-DAD methods for carbonyl analysis, adherence to ICH Q2(R2) validation principles ensures generation of reliable, high-quality data fit for purpose [8] [5] [17]. The choice between UFLC-DAD and alternative techniques should be guided by a careful consideration of analytical requirements, including sensitivity needs, sample complexity, available resources, and regulatory objectives. For many routine applications in quality control and environmental monitoring, UFLC-DAD provides an optimal balance of performance, operational simplicity, and cost-effectiveness that continues to make it a valuable tool in the analytical chemist's arsenal.
Defining the Analytical Target Profile (ATP) for Carbonyl Compound Methods
An Analytical Target Profile (ATP) is a foundational concept in analytical quality by design (AQbD) that prospectively defines the required quality of an analytical method. It specifies what the method needs to achieve—its fundamental purpose—rather than prescribing how to achieve it. For carbonyl compound analysis, which is critical in pharmaceutical stability testing, food safety, and environmental monitoring, a well-defined ATP ensures the method will reliably detect and quantify these reactive compounds that can significantly impact product quality, safety, and efficacy. The International Council for Harmonisation (ICH) Q2(R2) guideline provides the regulatory framework for validating analytical procedures, emphasizing that validation should demonstrate a method's suitability for its intended purpose, particularly for release and stability testing of commercial drug substances and products [5].
Carbonyl compounds, including aldehydes and ketones, present particular analytical challenges due to their reactivity, varying polarities, and often low concentrations in complex matrices. Formaldehyde, acetaldehyde, and acrolein are of significant concern due to their potential carcinogenicity, making accurate monitoring essential for risk assessment [18]. Within the pharmaceutical context, carbonyl compounds can form as degradation products in formulations containing unsaturated fatty acids or polyethylene glycol derivatives, necessitating precise analytical control strategies. The ATP serves as the critical link between the analytical needs and the method validation parameters, ensuring the final validated method is fit-for-purpose and meets all regulatory requirements for controlling these potentially harmful compounds.
Regulatory Framework: ICH Q2(R2) Guidelines
The ICH Q2(R2) guideline, "Validation of Analytical Procedures," provides a comprehensive framework for establishing and validating analytical methods within the pharmaceutical industry. This guideline outlines the key validation characteristics that must be considered to demonstrate that an analytical procedure is suitable for its intended purpose [5]. For an ATP targeting carbonyl compounds, the following validation parameters, as defined by ICH, are particularly critical:
- Specificity: The ability to unequivocally assess the analyte (carbonyl compounds) in the presence of potential interferents, such as other degradation products, excipients, or matrix components. This is often demonstrated through forced degradation studies [19].
- Accuracy: The closeness of agreement between the conventional true value of the carbonyl compound and the value found by the method. This is typically established through recovery studies using spiked samples [16].
- Precision: Expressed as repeatability (intra-assay) and intermediate precision, this measures the closeness of agreement between a series of measurements from multiple sampling of the same homogeneous sample under prescribed conditions. For carbonyl analysis, relative standard deviation (RSD) is commonly used [19].
- Detection Limit (LOD) and Quantitation Limit (LOQ): The lowest concentrations of a carbonyl compound that can be detected or quantified with acceptable accuracy and precision, respectively [16] [19].
- Linearity and Range: The ability of the method to obtain test results proportional to the concentration of carbonyl compounds within a specified range, with the range encompassing the expected concentrations from toxicological relevance to solubility limits [5].
The guideline applies to new or revised analytical procedures used for the release and stability testing of commercial drug substances and products, both chemical and biological/biotechnological [5]. It is important to note that while ICH Q2(R1) has been the longstanding standard, the recently updated Q2(R2) provides enhanced guidance on factors to consider during validation, making it essential for modern analytical development.
Table 1: Key Validation Parameters as Defined by ICH Q2(R2)
| Validation Parameter | Definition | Criticality for Carbonyl Compounds |
|---|---|---|
| Specificity | Ability to measure analyte accurately in the presence of components | High due to complex matrices and similar degradation products |
| Accuracy | Closeness of agreement between accepted reference and found value | High for quantification and risk assessment |
| Precision | Degree of scatter between a series of measurements | High for reliable reproducibility |
| Linearity | Ability to obtain results proportional to analyte concentration | Essential for calibration across expected range |
| Range | Interval between upper and lower concentration levels | Must cover from LOQ to 120-150% of specification |
| LOD/LOQ | Lowest amount detected/quantified with reliability | Critical for controlling genotoxic impurities |
ATP Components for Carbonyl Compound Analysis
Critical Quality Attributes for Carbonyl Methods
The ATP for carbonyl compound methods must clearly define the Critical Quality Attributes (CQAs) that the method must control. For carbonyl analysis, these CQAs are directly linked to the method's performance characteristics and its ability to reliably detect and quantify target analytes. Based on ICH Q2(R2) requirements and analytical chemistry principles, the essential CQAs include:
- Analyte Identification: The method must unequivocally identify target carbonyl compounds, which often requires sophisticated detection techniques. As demonstrated in the UFLC-DAD-ESI-MS method for carbonyl compounds in soybean oil, coupling ultraviolet detection with mass spectrometry provides definitive identification through retention time matching, UV spectra, and mass confirmation [16].
- Separation Efficiency: The chromatographic system must achieve baseline separation of all target carbonyl compounds from each other and from matrix components. The method for ritlecitinib degradation products achieved this through careful optimization of stationary phase and mobile phase composition, utilizing a C18 column with sub-3µm particles and acidic mobile phase modifiers [19].
- Sensitivity: The method must be sufficiently sensitive to detect and quantify carbonyl compounds at toxicologically relevant levels. For instance, the UFLC-DAD-ESI-MS method achieved detection limits ranging from 0.03 to 0.1 µg·mL⁻¹ for various carbonyl compounds in heated oils [16].
- Robustness: The method should be resilient to small, deliberate variations in method parameters, ensuring reliable performance across different laboratories, instruments, and analysts. The transportable HPLC system for carbonyl compounds demonstrated this capability, maintaining performance despite environmental challenges [18].
Defining the Analytical Scope
A comprehensive ATP must clearly delineate the scope of the analytical method, including:
- Target Carbonyl Compounds: Specifically listing all carbonyl compounds to be monitored, such as formaldehyde, acetaldehyde, acrolein, 4-hydroxy-2-nonenal, 2,4-decadienal, and other relevant species based on the specific application [16] [18].
- Matrices: Defining the specific matrices where the method will be applied (e.g., pharmaceutical formulations, biological samples, food products, or environmental samples).
- Concentration Range: Specifying the required quantitative range based on safety concerns and expected concentrations. For example, the validated method for ritlecitinib degradation products demonstrated linearity from the LOQ (0.14 µg/mL) to higher concentrations relevant for stability testing [19].
ATP Development Workflow for Carbonyl Methods
Experimental Design and Method Validation Protocols
Chromatographic Method Development for Carbonyl Compounds
The development of a robust chromatographic method for carbonyl compounds requires systematic optimization of multiple parameters. Based on published methodologies, the following protocol provides a framework for establishing a validated UFLC-DAD method:
- Sample Preparation and Derivatization: Carbonyl compounds often require derivatization to enhance detectability and stability. The most common approach uses 2,4-dinitrophenylhydrazine (DNPH) to form stable hydrazone derivatives that can be detected with high sensitivity using UV or MS detection [18]. For the analysis of carbonyl compounds in soybean oil, researchers optimized extraction using 1.5 mL of acetonitrile as the solvent, manual stirring for 3 minutes, and 30 minutes of sonication time, achieving recoveries of 70.7% to 85.0% at the lowest concentration level [16].
- Chromatographic System Selection: Reversed-phase chromatography using C18 columns with sub-3µm particles provides enhanced separation efficiency for carbonyl compounds. Core-Shell technology columns can achieve higher chromatographic efficiencies at substantially lower system backpressures, making them ideal for rapid separations [19]. Mobile phase optimization should consider eluent viscosity, UV cut-off, and compatibility with detection systems.
- Detection System Optimization: Diode array detection (DAD) provides spectral confirmation of carbonyl-DNPH derivatives, while tandem mass spectrometry (MS/MS) offers definitive identification and enhanced specificity. The UFLC-DAD-ESI-MS method for soybean oil analysis successfully identified multiple carbonyl compounds, including 4-hydroxy-2-nonenal, 2,4-decadienal, and 2,4-heptadienal, with the first three presenting the highest mean concentrations after heating (36.9, 34.8, and 22.6 µg·g⁻¹ of oil, respectively) [16].
Validation Experimental Protocols
The validation of carbonyl compound methods requires carefully designed experiments to evaluate each validation parameter defined in the ATP:
- Specificity Protocol: Inject blank matrix, standard solutions, and stressed samples (e.g., acid/base degraded, oxidized, thermally stressed) to demonstrate separation of carbonyl compounds from potential interferents. Forced degradation studies should be conducted following ICH guidelines, as demonstrated in the ritlecitinib stability study which identified four degradation products under hydrolytic, oxidative, thermal, and photolytic conditions [19].
- Linearity and Range Protocol: Prepare a minimum of five concentrations spanning the expected range (e.g., from LOQ to 150% of the target concentration). The ritlecitinib method demonstrated excellent linearity with a wide range, supporting its suitability for stability-indicating methods [19].
- Accuracy (Recovery) Protocol: Spike blank matrix with known concentrations of carbonyl compounds at multiple levels (e.g., 50%, 100%, 150% of target) and calculate percentage recovery. The UFLC-DAD-ESI-MS method for carbonyl compounds in soybean oil achieved average recoveries ranging from 70.7% to 85.0% at the lowest concentration level [16].
- Precision Protocol: Analyze multiple replicates (n=6) of a homogeneous sample to determine repeatability. For intermediate precision, perform analysis on different days, with different analysts, or using different instruments. The stability-indicating method for ritlecitinib demonstrated excellent precision with RSD ≤ 0.15% [19].
Table 2: Validation Results for Carbonyl Compound Analytical Methods
| Validation Parameter | UFLC-DAD-ESI-MS (Soybean Oil) | UHPLC-DAD-MS/MS (Ritlecitinib) | Transportable HPLC (Carbonyl-DNPH) |
|---|---|---|---|
| Linearity Range | 0.2–10.0 µg·mL⁻¹ | Not specified | Up to 20 mg·L⁻¹ |
| Accuracy (Recovery) | 70.7–85.0% (at lowest level) | 99.9–100.3% | Not specified |
| Precision (RSD) | Not specified | ≤ 0.15% | < 11.5% (UV), < 14.1% (LED) |
| LOD | 0.03–0.1 µg·mL⁻¹ | 0.04 µg·mL⁻¹ | 0.12–0.38 mg·L⁻¹ (UV) |
| LOQ | 0.2 µg·mL⁻¹ | 0.14 µg·mL⁻¹ | Not specified |
| Analysis Time | Not specified | < 4 minutes | < 20 minutes |
| Key Carbonyls Detected | 4-hydroxy-2-nonenal, 2,4-decadienal, acrolein | Degradation products | Formaldehyde, acetaldehyde, acetone |
Comparative Analysis of Analytical Approaches
Method Performance Comparison
Different analytical approaches for carbonyl compound analysis offer distinct advantages and limitations. A comparative assessment based on the searched methodologies reveals:
- UFLC-DAD-ESI-MS: This approach combines the separation power of ultrafast liquid chromatography with dual detection (DAD and MS). The method developed for soybean oil analysis demonstrated comprehensive profiling of 10 different carbonyl compounds with high sensitivity (LOD: 0.03-0.1 µg·mL⁻¹) and acceptable recovery rates [16]. The main advantage is the ability to definitively identify unknown carbonyl compounds through mass spectral data, making it ideal for method development and characterization studies.
- UHPLC-DAD-MS/MS: As demonstrated in the ritlecitinib forced degradation study, this approach offers enhanced resolution and speed, with analysis times under 4 minutes while maintaining excellent precision (RSD ≤ 0.15%) and accuracy (99.9-100.3%) [19]. The use of tandem MS provides structural information on degradation products, facilitating identification of degradation pathways.
- HPLC-UV with DNPH Derivatization: The transportable HPLC system for carbonyl-DNPH derivatives achieved separation of 13 carbonyl compounds in less than 20 minutes using an isocratic method [18]. While offering good sensitivity (LOD: 0.12-0.38 mg·L⁻¹ with UV), co-elution occurred for 2-butanone-DNPH and butanal-DNPH, highlighting a limitation in resolution compared to UHPLC methods.
Analytical System Comparison
The selection of analytical instrumentation significantly impacts method performance, operational efficiency, and applicability:
- Benchtop vs. Transportable Systems: Traditional benchtop HPLCs with DAD detection generally provide superior sensitivity, resolution, and repeatability compared to transportable systems. However, the transportable HPLC system developed for carbonyl compounds offers unique advantages for on-site analysis, despite being heavier than miniaturized counterparts [18].
- Detection Options: UV detectors generally provide better sensitivity and linearity compared to LED detectors. The transportable HPLC study reported correlation coefficients lower than 0.999 with the LED detector, whereas UV detection met standard method requirements [18].
- Stationary Phase Considerations: The robustness of carbonyl compound methods can be enhanced by using predefined rugged stationary phases. As noted in the challenges with ICH Q2(R1), method robustness can be improved by "using pre-defined rugged stationary phases (rather than random choice), and by first intent only developing methods using these columns" [20].
Carbonyl Compound Analysis Workflow
The Scientist's Toolkit: Essential Research Reagents and Materials
Successful development and validation of carbonyl compound methods require specific reagents, materials, and instrumentation. The following toolkit summarizes essential components based on the analyzed methodologies:
Table 3: Essential Research Reagent Solutions for Carbonyl Compound Analysis
| Reagent/Material | Function/Purpose | Example from Literature |
|---|---|---|
| 2,4-Dinitrophenylhydrazine (DNPH) | Derivatizing agent for carbonyl compounds to form stable hydrazones with enhanced UV detection | Used in transportable HPLC method for 13 carbonyl compounds [18] |
| Acetonitrile (HPLC grade) | Extraction solvent and mobile phase component | Used as extraction solvent (1.5 mL) for carbonyl compounds in soybean oil [16] |
| Formic Acid | Mobile phase additive to improve ionization in MS detection and peak shape in chromatography | Used as mobile phase additive in UHPLC-DAD-MS/MS method for ritlecitinib [19] |
| C18 Chromatographic Column | Stationary phase for reversed-phase separation of carbonyl derivatives | C18 column with sub-3µm particles used in ritlecitinib degradation study [19] |
| Carbonyl Standard Mixtures | Reference standards for method validation and quantification | Soybean oil method used spiked standards from 0.2 to 10.0 µg·mL⁻¹ [16] |
| Core-Shell Technology Columns | Enhanced efficiency stationary phase for rapid separations | Used to achieve higher chromatographic efficiencies at lower backpressures [19] |
The definition of a precise Analytical Target Profile is the cornerstone of developing validated, robust analytical methods for carbonyl compounds in pharmaceutical and related applications. By prospectively defining the method requirements within the ICH Q2(R2) framework, scientists can ensure methods are fit-for-purpose from inception through validation and routine use. The comparative analysis of different chromatographic approaches demonstrates that UFLC-DAD-ESI-MS offers an optimal balance of sensitivity, selectivity, and identification capability for comprehensive carbonyl compound analysis.
The experimental data and validation protocols presented provide a template for developing ATP-driven methods that can reliably monitor carbonyl compounds across various matrices. As analytical science continues to evolve, incorporating Quality by Design principles and green analytical chemistry metrics will further enhance the sustainability and robustness of these essential analytical procedures. The ongoing harmonization of validation guidelines, including addressing current gaps in method technology transfer and trace analysis, will continue to strengthen the regulatory framework governing carbonyl compound analysis in pharmaceutical products.
For researchers developing an UFLC-DAD method for carbonyl compounds according to ICH guidelines, demonstrating method validity requires rigorously evaluating specific performance characteristics. The International Council for Harmonisation (ICH) provides the foundational framework for this process through its Q2(R2) guideline on analytical procedure validation, which outlines the core parameters essential for proving a method is suitable for its intended purpose [21]. These parameters form an interconnected system where each element contributes uniquely to establishing overall method reliability.
The evolution from a one-time validation check to a more comprehensive lifecycle management approach, as emphasized in the recent ICH Q2(R2) and Q14 guidelines, underscores the importance of building quality into the method from the initial development stages [21]. For scientists quantifying carbonyl compounds in complex matrices like soybean oil or air samples, this systematic validation approach ensures generated data will be accurate, reproducible, and defensible for regulatory submissions or research publications.
Core Parameter Definitions and Methodologies
Specificity/Selectivity
Specificity refers to the ability of a method to accurately measure the analyte of interest in the presence of other components that may be expected to be present in the sample matrix, such as impurities, degradation products, or excipients [22]. For UFLC-DAD methods targeting carbonyl compounds, specificity ensures that the peaks for compounds like acrolein, 4-hydroxy-2-nonenal (HNE), and other aldehydes are adequately resolved from interferents.
Experimental Protocols:
- Forced Degradation Studies: Stress samples under various conditions (acid, base, oxidation, heat, and light) to generate degradation products, then demonstrate that the analyte peak is pure and unaffected by degradants [22].
- Placebo Interference Test: For formulated products, analyze the placebo (all components except analyte) to show no interference at the retention time of the analyte [22].
- Peak Purity Assessment: Use DAD to compare spectra across the peak, confirming a single component via spectral homogeneity [22]. A peak purity index above 99% is typically expected.
- Orthogonal Method Comparison: Confirm results using a method with different separation mechanisms [23].
Linearity
Linearity is the ability of the method to produce test results that are directly proportional to analyte concentration within a specified range [22] [23]. It demonstrates the method's reliable quantitative capability.
Experimental Protocol:
- Prepare a minimum of 5 concentrations covering the specified range (e.g., 50%, 80%, 100%, 120%, 150% of target concentration) [23].
- Inject each concentration in triplicate.
- Plot average peak response against concentration.
- Calculate regression statistics (slope, intercept, and correlation coefficient).
- Evaluate residuals to ensure no systematic pattern [24].
For carbonyl compounds like formaldehyde and acetaldehyde in air samples, linearity might be established from 300-12,000 nM for TGN and 3,000-60,000 nM for MMPN, as demonstrated in thiopurine metabolite analysis [25].
Range
The range is the interval between the upper and lower concentrations over which linearity, accuracy, and precision have been demonstrated [22]. It should encompass all probable sample concentrations.
Typical ranges for common applications [23]:
| Use of Analytical Procedure | Low End of Reportable Range | High End of Reportable Range |
|---|---|---|
| Assay of a product | 80% of declared content | 120% of declared content |
| Impurity | Reporting threshold | 120% of specification acceptance criterion |
| Content uniformity | 70% of declared content | 130% of declared content |
| Dissolution: Immediate release | Q-45% of the lowest strength | 130% of declared content of the highest strength |
Accuracy
Accuracy expresses the closeness of agreement between the measured value and the value accepted as true [22]. It is typically assessed as percent recovery and should be evaluated across the method range.
Experimental Protocols:
- Standard Addition Method: Spike known amounts of analyte into the sample matrix and calculate recovery percentage [26].
- Comparison to Reference Material: Analyze a certified reference material and compare measured value to certified value [23].
- Protocol Design: Use a minimum of 9 determinations over at least 3 concentration levels covering the specified range (e.g., 80%, 100%, 120%) with 3 replicates each [22].
For carbonyl compounds in soybean oil, accuracy might be demonstrated by spiking known concentrations of acrolein or HNE into oil samples and extracting using appropriate solvents like acetonitrile [27].
Precision
Precision measures the degree of agreement among individual test results when the procedure is applied repeatedly to multiple samplings of a homogeneous sample, typically expressed as relative standard deviation (RSD) [22]. Precision has three levels:
Experimental Protocols:
- Repeatability: Analyze 6 samples at 100% concentration or 3 concentrations with 3 replicates each under same conditions (same analyst, same instrument, same day) [23]. Acceptable RSD is typically <2.0% for assay methods [22].
- Intermediate Precision: Evaluate the effects of random events on precision using different days, different analysts, or different equipment [23].
- Reproducibility: Precision between different laboratories (typically required for method standardization) [23].
Limit of Detection (LOD) and Limit of Quantitation (LOQ)
LOD is the lowest amount of analyte that can be detected but not necessarily quantified, while LOQ is the lowest amount that can be quantified with acceptable accuracy and precision [22].
Experimental Protocols:
- Signal-to-Noise Ratio: Typically 3:1 for LOD and 10:1 for LOQ [23].
- Standard Deviation of Response and Slope: LOD = 3.3σ/S and LOQ = 10σ/S, where σ is standard deviation of response and S is slope of calibration curve [23].
- Visual Evaluation: Inject progressively lower concentrations until detection or quantification becomes unreliable.
For carbonyl compounds analyzed by UFLC-DAD, LOD and LOQ values should be established relative to tolerance limits, with excellent LOD at ≤5% of tolerance and excellent LOQ at ≤15% of tolerance [24].
Robustness
Robustness measures the method's capacity to remain unaffected by small, deliberate variations in method parameters, indicating reliability during normal usage [22].
Experimental Protocol:
- Deliberate Parameter Variation: Systematically vary key parameters one at a time while holding others constant:
- Mobile phase composition (±2% organic modifier)
- pH (±0.2 units)
- Flow rate (±10%)
- Column temperature (±5°C)
- Detection wavelength (±3 nm) [23]
- Evaluation: Monitor effects on critical resolution, tailing factor, and efficiency.
Comparative Analysis of Validation Parameters
The table below summarizes typical acceptance criteria for key validation parameters across different application types:
| Validation Parameter | Assay Methods (Small Molecules) | Impurity Methods | Bioanalytical Methods |
|---|---|---|---|
| Accuracy (% Recovery) | 98.0-102.0% [22] | Varies by level: <1.0% impurity: 80-120% [22] | 85-115% [25] |
| Precision (RSD) | ≤2.0% [22] | Varies by level: <1.0% impurity: ≤15% [22] | ≤15% [25] |
| Linearity (R²) | ≥0.999 | ≥0.998 | ≥0.995 |
| Range | 80-120% of target [23] | Reporting threshold to 120% of specification [23] | LLOQ to ULOQ [25] |
| Specificity | No interference from placebo, impurities, degradants | Baseline separation of all critical pairs | No matrix interference |
| LOD | Not typically required | Dependent on reporting threshold | Signal-to-noise ≥3:1 [23] |
| LOQ | Not typically required | Dependent on reporting threshold | Signal-to-noise ≥10:1 [23] |
Experimental Workflow for Method Validation
The following diagram illustrates the logical relationship and workflow between the core validation parameters:
Research Reagent Solutions for UFLC-DAD of Carbonyl Compounds
The table below details essential reagents and materials for developing and validating UFLC-DAD methods for carbonyl compounds:
| Reagent/Material | Function | Application Example |
|---|---|---|
| 2,4-Dinitrophenylhydrazine (DNPH) | Derivatization reagent for carbonyl compounds | Forms stable hydrazone derivatives with aldehydes/ketones for UV detection [27] [13] |
| Dual-bed sampling cartridges (DNPH-coated silica with 2-BPE) | Sample collection and derivatization | Collecting airborne carbonyl compounds while removing ozone interference [13] |
| C18 Chromatographic Columns | Stationary phase for separation | ZORBAX Eclipse Plus C18 (250 mm × 4.6 mm, 5 μm) for tapentadol separation [26] |
| Acetonitrile (HPLC grade) | Mobile phase component | Organic modifier in reverse-phase separation of carbonyl-DNPH derivatives [27] [26] |
| Formic Acid/Acetic Acid | Mobile phase modifier | Improves peak shape and separation efficiency (0.1% formic acid) [26] |
| Carbonyl-DNPH Standard Mixtures | Reference standards for quantification | Commercial standards for formaldehyde, acetaldehyde, and other carbonyl derivatives [13] |
| Perchloric Acid | Protein precipitation agent | Sample preparation in biological matrices [25] |
| DL-Dithiothreitol (DTT) | Stabilizing agent | Prevents oxidation of analytes in biological samples [25] |
The core validation parameters—specificity, linearity, range, accuracy, precision, LOD, LOQ, and robustness—form an integrated framework that ensures UFLC-DAD methods for carbonyl compounds generate reliable, defensible data. The recent ICH Q2(R2) guideline reinforces a science- and risk-based approach where understanding how each parameter affects method performance is more valuable than simply meeting acceptance criteria [21].
For researchers developing these methods, establishing meaningful acceptance criteria relative to the method's intended purpose is crucial. As emphasized in regulatory guidance, method validation should demonstrate not just that a method can perform under ideal conditions, but that it remains suitable throughout its lifecycle—from early development through transfer and routine use [24] [28]. This comprehensive approach to validation ultimately supports product quality and patient safety while providing the flexibility needed for continuous improvement in analytical sciences.
Developing and Applying Your UFLC-DAD Method: From Sample Prep to Data Acquisition
The accuracy and reliability of any chromatographic analysis are fundamentally dependent on the sample preparation stage. Within the context of validating an Ultra-Fast Liquid Chromatography-Diode Array Detector (UFLC-DAD) method for carbonyl compounds according to International Council for Harmonisation (ICH) guidelines, optimized sample preparation is not merely a preliminary step but a critical component of the overall analytical procedure. The choice of extraction solvents, coupled with the parameters for manual stirring and sonication, directly influences key validation parameters such as accuracy, precision, and sensitivity. This guide objectively compares various sample preparation techniques, providing supporting experimental data to aid researchers in selecting the optimal protocol for their specific applications.
Comparative Analysis of Extraction Solvents
The selectivity and efficiency of an extraction are primarily governed by the solvent system. The optimal solvent must effectively solubilize the target analytes while minimizing the co-extraction of interfering matrix components.
Solvent Performance for Carbonyl Compounds in Oils
For the analysis of carbonyl compounds (CCs) in heated soybean oil, a dedicated study developed and validated a UFLC-DAD-ESI-MS method. After optimization, the most effective protocol used 1.5 mL of acetonitrile as the extraction solvent, manual stirring for 3 minutes, and a sonication time of 30 minutes [16]. This method was successfully applied to identify ten different carbonyl compounds, including 4-hydroxy-2-nonenal and 2,4-decadienal.
Table 1: Validation Data for the UFLC-DAD-ESI-MS Method for Carbonyl Compounds in Soybean Oil [16]
| Validation Parameter | Result | Note |
|---|---|---|
| Extraction Solvent | Acetonitrile | 1.5 mL volume |
| Extraction Parameters | Manual stirring (3 min) + Sonication (30 min) | Optimized protocol |
| Spike Concentration Range | 0.2 to 10.0 μg mL⁻¹ | |
| Average Recovery (at lowest spike level) | 70.7% to 85.0% | |
| Detection Limit (LOD) | 0.03 to 0.1 μg mL⁻¹ | |
| Quantification Limit (LOQ) | 0.2 μg mL⁻¹ | For all compounds |
Broader Metabolomic Applications: Solvent Precipitation
In broader metabolomics, which includes diverse analyte classes, solvent precipitation remains a cornerstone due to its broad specificity and high metabolite coverage.
Table 2: Comparison of Common Solvent-Based Extraction Methods in Metabolomics [29] [30]
| Extraction Solvent | Key Advantages | Reported Limitations | Typical Application |
|---|---|---|---|
| Acetonitrile | Effective protein precipitation; low matrix effects in some contexts [29]. | Lower metabolite coverage for some polar compounds compared to methanol [29]. | Carbonyl compounds in oils [16]; alternative to methanol in biofluid prep [29]. |
| Methanol | Excellent metabolite coverage and precision; considered a gold standard for many applications [29] [30]. | High susceptibility to matrix effects (ion suppression) due to broad specificity [30]. | General metabolomics of plasma and serum; intracellular metabolites [31] [29]. |
| Methanol/Ethanol (1/1, v/v) | Good coverage and outstanding accuracy [30]. | Similar to methanol. | Plasma metabolomics [30]. |
| Methanol-Chloroform (Biphasic) | High extraction efficiency for intracellular metabolites; allows partitioning of polar (methanol-water) and non-polar (chloroform) metabolites [31] [32]. | More complex phase separation required. | Intracellular metabolomics; lipidomics; multi-omics protocols [31] [32]. |
| Methyl-tert-butyl ether (MTBE) - LLE | Good coverage of both polar and lipid metabolomes; orthogonal selectivity to methanol [30]. | Requires careful handling of two phases. | Global metabolomics and lipidomics [30] [32]. |
The Impact of Extraction Techniques and Cell Harvesting
Beyond solvent choice, the mechanical technique used for extraction and, for cell-based studies, the method of harvesting, significantly impact yield and profile.
Harvesting Techniques for Adherent Cells
A study on human mesenchymal stem cells and fibroblasts compared trypsinization to mechanical scraping. The results demonstrated that direct scraping into an organic solvent yielded higher abundances of determined metabolites. The use of enzymes like trypsin led to statistically significant differences in the abundances of amino acids and peptides, introducing unwanted analytical bias [31].
Extraction Techniques for Soy Isoflavones
A comparison of six extraction techniques (stirring, Soxhlet, sonication, pressurized liquid extraction (PLE), vortexing, and mechanical wrist shaker) for isoflavones from soybeans found that sonication, stirring, and vortexing provided similar extraction efficiencies. However, methods like Soxhlet and PLE, which involve elevated temperatures, required shorter extraction times but carried a risk of thermal degradation for certain compounds [33].
Experimental Protocols for Key Studies
- Objective: Extract and analyze carbonyl compounds from thermally stressed soybean oil.
- Sample Preparation:
- Extraction Solvent: Add 1.5 mL of acetonitrile to the oil sample.
- Manual Stirring: Agitate the mixture manually for 3 minutes.
- Sonication: Subject the mixture to sonication for 30 minutes.
- Analysis: Analyze the extract directly using UFLC-DAD-ESI-MS.
- Validation: The method was validated for recovery (70.7-85.0%), LOD (0.03-0.1 μg mL⁻¹), and LOQ (0.2 μg mL⁻¹ for all compounds).
- Objective: Optimize the preparation of intracellular metabolites from human mesenchymal stem cells (e.g., DPSCs) and fibroblasts (e.g., HDFa) for NMR-based metabolomics.
- Cell Harvesting: Use direct mechanical scraping into the chosen cold organic solvent instead of enzymatic detachment with trypsin.
- Extraction: Apply a suitable solvent system. The study found that MTBE method, methanol-chloroform, and 80% ethanol extractions showed higher efficiency for most identified metabolites.
- Analysis: Reconstitute the dried extract and analyze using NMR spectroscopy.
ICH Q2(R2) Validation Framework and Sample Preparation
The ICH Q2(R2) guideline provides a framework for validating analytical procedures, and sample preparation is intrinsically linked to several of its core parameters [34] [5]. A poorly optimized extraction will fail to meet validation criteria, rendering the entire method unfit for purpose.
- Specificity: A clean extraction, free of matrix interferences, is crucial. Techniques like Solid-Phase Extraction (SPE) can improve specificity by removing phospholipids, thereby reducing matrix effects [30].
- Accuracy: This is typically demonstrated through recovery experiments. The extraction protocol for carbonyl compounds, which showed recoveries of 70.7-85.0%, is a direct measure of its accuracy [16].
- Precision: The repeatability of the sample preparation method contributes directly to the precision of the entire method. Solvent precipitation methods like methanol and methanol/acetonitrile are noted for their outstanding repeatability [29] [30].
- Linearity and Range: The sample preparation must be consistent across the intended concentration range. If the extraction efficiency changes with concentration, it will distort the linearity of the method.
- Detection and Quantitation Limits (LOD/LOQ): An efficient extraction that concentrates the analytes and minimizes interferences directly improves the method's sensitivity, leading to lower LODs and LOQs [16].
The following workflow diagrams the process of developing and validating an optimized sample preparation protocol within the ICH Q2(R2) framework.
The Scientist's Toolkit: Essential Research Reagent Solutions
Table 3: Key Reagents and Materials for Sample Preparation Protocols
| Item | Function / Application | Example from Literature |
|---|---|---|
| Acetonitrile (LC-MS Grade) | Extraction solvent for carbonyl compounds; protein precipitation. | Primary solvent for CC extraction in soybean oil [16]. |
| Methanol (LC-MS Grade) | Broad-specificity solvent for metabolite extraction; protein precipitation. | Optimal for plasma metabolomics and intracellular metabolite extraction [31] [29]. |
| Methyl-tert-butyl ether (MTBE) | Solvent for liquid-liquid extraction (LLE) of polar and non-polar metabolites. | Used in biphasic systems for lipidomics and metabolomics [31] [30] [32]. |
| Phospholipid Removal SPE | Solid-phase extraction to selectively remove phospholipids, reducing matrix effects. | HybridSPE and similar products used in plasma/serum prep [29] [30]. |
| Internal Standards (Isotope-Labeled) | Correct for variability and losses during sample preparation; quantify recovery. | Used in recovery and precision assessments in method validation [29] [30]. |
| Sonication Bath | Application of ultrasonic energy to enhance extraction efficiency and speed. | Used in the optimized protocol for carbonyl compounds (30 min) [16]. |
Selecting an optimized sample preparation protocol is a balance between specificity, efficiency, and practicality. For the analysis of carbonyl compounds via UFLC-DAD, the validated method using acetonitrile with 3 minutes of manual stirring and 30 minutes of sonication provides a robust framework [16]. In a broader research context, methanol-based precipitation is often the most suitable starting point for its broad metabolite coverage and high repeatability [29] [30]. However, techniques like mechanical scraping for cells [31] and the use of orthogonal methods like SPE or MTBE-LLE can be required to address specific challenges such as enzymatic interference or complex matrices. Ultimately, the chosen extraction protocol must be developed and optimized in concert with the chromatographic method to ensure it meets all validation criteria outlined in ICH Q2(R2), thereby guaranteeing the generation of reliable, high-quality data.
The validation of analytical methods is a critical requirement in pharmaceutical research to ensure the reliability, accuracy, and reproducibility of quantitative analyses. Within the framework of International Council for Harmonisation (ICH) guidelines, Ultra-Fast Liquid Chromatography with Diode Array Detection (UFLC-DAD) has emerged as a powerful technique for the analysis of complex mixtures, including carbonyl compounds and natural product derivatives. This guide provides a systematic comparison of column technologies, mobile phase compositions, and gradient optimization strategies for UFLC-DAD method development, with specific application to carbonyl compound analysis and natural product quantification.
The analysis of carbonyl compounds presents particular challenges due to their reactivity, varying polarities, and diverse chemical structures. Simultaneously, the quantification of active compounds in natural products, such as the diterpene jatrophone from Jatropha isabellei, requires robust methods that can resolve complex matrices. This article objectively compares the performance of different chromatographic approaches and provides experimental data to guide researchers in developing validated UFLC-DAD methods compliant with ICH requirements.
Column Selection: Stationary Phase Technologies and Performance Comparison
Column selection represents the foundational decision in chromatographic method development, directly impacting resolution, efficiency, and analysis time. For carbonyl compounds and natural product analysis, reversed-phase columns remain the predominant choice, though specific stationary phase properties significantly influence separation performance.
Column Chemistry and Selectivity
C18 columns serve as the workhorse for most reversed-phase applications, providing a balance of hydrophobicity and versatility. The Acclaim Carbonyl C18 column (150 × 3 mm, 3 µm), specifically designed for carbonyl compounds, has demonstrated excellent separation efficiency for DNPH-derivatized carbonyls, including formaldehyde, acetaldehyde, and higher molecular weight aldehydes [13] [14]. This specialized column chemistry enhances retention and resolution of carbonyl hydrazones through specific interactions with the carbonyl functional groups.
For natural product analysis, conventional C18 columns (e.g., 150 mm length, 4.6 mm internal diameter, 5 µm particle size) have been successfully employed in separating complex terpene mixtures. In the analysis of Jatropha isabellei fractions, a standard C18 column provided adequate resolution of jatrophone from other terpenoids and matrix components [35]. The separation was achieved with a peak capacity sufficient for quantitative analysis, indicating that conventional C18 columns remain viable for many natural product applications.
Particle Size and Column Dimensions
The transition to sub-2-micron particles and smaller internal diameters represents a significant advancement in UFLC methodology. Columns packed with 3-µm particles, as used in the Acclaim Carbonyl C18 (150 × 3 mm, 3 µm), provide improved efficiency and faster separations compared to conventional 5-µm particles [13]. The reduced internal diameter (3 mm vs. standard 4.6 mm) enhances mass sensitivity and reduces solvent consumption, aligning with green chemistry principles.
Recent developments in core-shell technology (fused-core particles) offer an alternative approach to achieving high efficiency without the excessive backpressure associated with sub-2-micron particles. While not explicitly referenced in the search results, these columns have demonstrated superior performance for complex natural product separations and should be considered when method development targets high throughput analysis.
Table 1: Column Performance Comparison for Carbonyl Compound and Natural Product Analysis
| Column Type | Dimensions | Particle Size | Application | Separation Efficiency | Remarks |
|---|---|---|---|---|---|
| Acclaim Carbonyl C18 | 150 × 3 mm | 3 µm | Carbonyl-DNPH derivatives | High resolution of 12 carbonyl compounds | Specialized chemistry for carbonyls |
| Conventional C18 | 150 × 4.6 mm | 5 µm | Jatrophone from J. isabellei | Adequate for major compound | Suitable for less complex matrices |
| C18 (generic) | 100-150 × 2.1-4.6 mm | 1.7-3.5 µm | General natural products | High to very high | Balance of efficiency and backpressure |
Column Temperature Considerations
Column temperature significantly influences retention, selectivity, and backpressure in UFLC separations. For carbonyl compound analysis, temperatures between 25°C and 40°C are commonly employed [13] [14]. Elevated temperatures (30-40°C) reduce mobile phase viscosity, thereby lowering backpressure and improving mass transfer. In the analysis of J. isabellei fractions, temperature control was critical for achieving reproducible retention times for jatrophone, particularly when using methanol-based mobile phases [35].
Mobile Phase Composition: Organic Modifier and Additive Selection
Mobile phase optimization constitutes a critical parameter in achieving optimal selectivity, peak shape, and detection sensitivity. The choice of organic modifier, aqueous phase, and additives significantly influences these chromatographic attributes.
Organic Modifier Comparison: Acetonitrile vs. Methanol
Acetonitrile (ACN) remains the preferred organic modifier for UFLC-DAD applications due to its low viscosity, high UV transparency, and strong eluting strength. In carbonyl compound analysis, ACN-based mobile phases produce sharper peaks and lower backpressure compared to methanol alternatives [13] [14]. The separation of 12 carbonyl-DNPH derivatives was achieved using an ACN-water gradient with excellent peak symmetry and minimal baseline drift [14].
Methanol finds application in specific scenarios where alternative selectivity is required or when cost is a consideration. For the analysis of non-polar compounds in J. isabellei, methanol-containing mobile phases provided different selectivity for terpene compounds compared to acetonitrile [35]. However, methanol's higher viscosity results in increased backpressure, potentially limiting flow rate optimization in UFLC systems.
Aqueous Phase Modifications
The addition of buffer systems to the aqueous phase improves peak shape and reproducibility by controlling ionization and suppressing silanol interactions. For carbonyl-DNPH derivatives, ammonium formate buffers (e.g., 10-20 mM) at acidic pH (4-5) enhance ionization in negative ESI mode while improving chromatographic performance in UV detection [13] [14].
Acidic additives such as formic acid (0.05-0.1%) or acetic acid (0.1%) improve peak shape for acidic and basic analytes through ion suppression. In the analysis of jatrophone, which contains ionizable functional groups, acidic mobile phases improved peak symmetry and reduced tailing [35]. The concentration of acidic additives should be optimized to balance improved chromatography with potential corrosion of LC components.
Isocratic vs. Gradient Elution
Isocratic elution provides simplicity and method robustness for applications with limited compound complexity. A recently developed isocratic method achieved separation of 11 out of 13 carbonyl hydrazones in less than 20 minutes using ACN-water (55:45, v/v) [18]. This approach offers advantages for field-deployable instruments and routine analysis where gradient systems are unavailable.
Gradient elution remains essential for complex samples with wide polarity ranges. In the analysis of carbonyl compounds in workplace environments, a linear gradient from 40% to 95% ACN over 15 minutes successfully separated 12 carbonyl-DNPH derivatives with resolution values >1.5 for all critical pairs [14]. Similarly, for J. isabellei extracts, a graded increase in organic modifier (60% to 100% methanol over 20 minutes) resolved jatrophone from closely eluting matrix components [35].
Table 2: Mobile Phase Optimization for Different Applications
| Parameter | Carbonyl Compounds (DNPH) | Natural Products (e.g., Jatrophone) | Performance Impact |
|---|---|---|---|
| Organic Modifier | Acetonitrile | Methanol or Acetonitrile | ACN: lower viscosity, sharper peaks MeOH: different selectivity |
| Aqueous Phase | 10 mM Ammonium formate (pH 4.5) | 0.1% Formic acid | Buffer: improved reproducibility Acid: better peak shape |
| Elution Mode | Gradient (40-95% ACN) | Gradient (60-100% MeOH) | Essential for complex mixtures |
| Flow Rate | 0.4-0.6 mL/min | 0.8-1.0 mL/min | Balance of efficiency and analysis time |
Gradient Optimization Strategies
Gradient profile optimization represents a critical aspect of method development that directly impacts resolution, analysis time, and sensitivity. A systematic approach to gradient optimization ensures robust separations with maximum throughput.
Initial Scouting and Parameter Selection
Initial gradient scouting typically employs a wide gradient range (e.g., 5-95% organic modifier over 20-30 minutes) to determine the approximate elution window for target compounds. For carbonyl-DNPH derivatives, this approach revealed elution between 40% and 80% ACN, allowing subsequent gradient compression to reduce analysis time [14]. In natural product analysis, initial gradients identify the hydrophobicity range of compounds of interest, informing subsequent optimization [35].
Gradient slope significantly impacts resolution and analysis time. Shallow gradients (0.5-1% organic modifier per minute) enhance resolution of critical pairs, while steeper gradients (2-5% per minute) reduce analysis time at the expense of resolution. For the separation of 12 carbonyl compounds, a gradient slope of 3.7% ACN per minute provided an optimal balance, achieving complete separation in under 15 minutes [14].
Advanced Gradient Programming
Multi-segment gradients with varying slopes address challenging separations where critical pairs elute within narrow windows. Incorporating isocratic holds or shallow gradient segments at specific organic modifier concentrations can resolve co-eluting peaks without significantly extending overall analysis time. Although not explicitly detailed in the search results, this approach is widely applicable to complex natural product extracts where multiple compounds with similar hydrophobicity coexist.
Gradient re-equilibration between runs is essential for retention time stability. A re-equilibration time of 3-5 column volumes (typically 3-5 minutes for standard columns) ensures reproducible separations. In validated methods for carbonyl compound analysis, a 5-minute re-equilibration period provided retention time stability with RSD < 0.5% [14].
Detection Optimization: DAD Parameters and Wavelength Selection
Diode Array Detection provides versatile detection capabilities for method development and validation, enabling optimal wavelength selection and peak purity assessment.
Wavelength Selection Strategies
Single wavelength monitoring at the absorption maximum simplifies quantification and improves sensitivity. For DNPH-derivatized carbonyl compounds, 360 nm represents the optimal wavelength due to strong absorption of the hydrazone moiety [13] [14]. For jatrophone and other diterpenes with conjugated systems, 230-240 nm provides maximum sensitivity [35].
Multiple wavelength monitoring enables simultaneous detection of compounds with different chromophores within a single analysis. In natural product applications, dual wavelength detection (e.g., 235 nm and 254 nm) can target specific compound classes while reducing matrix interference [35].
Spectral Acquisition and Peak Purity Assessment
Full spectral acquisition (190-800 nm) during analysis facilitates peak purity assessment through spectral overlay and library matching. This capability is particularly valuable in method development for natural products, where matrix complexity may lead to co-elution [35]. The comparison of apex and slope spectra provides a straightforward approach to detecting potential co-elution.
Spectral bandwidth and acquisition rate should be optimized for specific applications. Narrow bandwidth (1-4 nm) enhances selectivity, while wider bandwidth (16-20 nm) increases sensitivity. Higher acquisition rates (10-20 Hz) improve peak definition in fast UFLC separations, particularly for early eluting peaks.
Method Validation According to ICH Guidelines
Chromatographic method validation establishes that the analytical procedure is suitable for its intended purpose. The following validation parameters were assessed for UFLC-DAD methods based on the experimental data from the search results.
Validation Parameters and Acceptance Criteria
Linearity was demonstrated for carbonyl compound quantification over concentration ranges of 0.2-10.0 μg/mL with correlation coefficients (R²) > 0.996 [16] [14]. For jatrophone quantification, linearity covered an appropriate range with R² > 0.999 [35].
Precision expressed as relative standard deviation (RSD) was <10% for intra-day repeatability and <16% for inter-day precision in carbonyl compound analysis [14]. For jatrophone quantification, RSD values <5% were achieved, meeting ICH requirements [35].
Accuracy assessed through recovery studies showed average recoveries of 70.7-85.0% at the lower concentration limit for carbonyl compounds [16], and recovery rates >95% for jatrophone in plant matrices [35].
Sensitivity determined through limit of detection (LOD) and quantification (LOQ) demonstrated LOD values of 0.03-0.1 μg/mL for carbonyl compounds [16] and approximately 0.12-0.38 mg/L for carbonyl hydrazones with UV detection [18]. For jatrophone, the LOD was sufficient for quantification in plant extracts at the expected concentration levels [35].
Table 3: Method Validation Data Comparison
| Validation Parameter | Carbonyl Compounds (UFLC-DAD) | Jatrophone (UFLC-DAD) | ICH Requirement |
|---|---|---|---|
| Linearity (R²) | >0.996 | >0.999 | >0.995 |
| Precision (RSD%) | Intra-day: <10% Inter-day: <16% | <5% | <15% (Inter-day) |
| Accuracy (% Recovery) | 70.7-85.0% (at LLOQ) | >95% | 80-120% |
| LOD | 0.03-0.1 μg/mL | Compound-specific | Signal-to-noise ≥3 |
| LOQ | 0.2 μg/mL | Compound-specific | Signal-to-noise ≥10 |
| Robustness | RT RSD <0.5% | RT RSD <1% | Small, deliberate variations |
Robustness Testing
Robustness evaluates the method's resilience to small, deliberate variations in chromatographic parameters. For carbonyl compound analysis, variations in mobile phase pH (±0.2 units), temperature (±2°C), and flow rate (±0.1 mL/min) resulted in retention time RSD <0.5% [14]. In natural product applications, the method demonstrated robustness against column batch variations and mobile phase preparation differences [35].
Experimental Protocols
Detailed Methodology: Carbonyl Compound Analysis in Workplace Environments
Sample Collection: Air samples were collected using portable sampling pumps (SKC AirChek TOUCH) at a flow rate of 0.14 L/min onto dual-bed cartridges coated with DNPH and BPE for derivatization and ozone removal [13] [14]. Sampling times ranged from 51 to 406 minutes, ensuring the collected carbonyl compounds consumed less than 30% of the DNPH coating.
Sample Preparation: Cartridges were eluted with 3 mL of acetonitrile, followed by filtration through 0.22 μm PTFE syringe filters. Working standards were prepared daily by diluting commercial carbonyl-DNPH derivative solutions in acetonitrile [14].
Chromatographic Conditions:
- Column: Acclaim Carbonyl C18 (150 × 3 mm, 3 μm)
- Mobile Phase: A: 10 mM ammonium formate (pH 4.5), B: Acetonitrile
- Gradient: 0 min (40% B), 0-15 min (40-95% B), 15-17 min (95% B), 17-17.1 min (95-40% B), 17.1-22 min (40% B)
- Flow Rate: 0.5 mL/min
- Temperature: 30°C
- Injection Volume: 10 μL
- Detection: DAD at 360 nm [14]
Detailed Methodology: Jatrophone Quantification in J. isabellei
Plant Material Extraction: Dried, powdered underground parts of J. isabellei were macerated with 70% ethanol (1:3 plant to solvent ratio) for 10 days at room temperature. After filtration, the ethanol was evaporated under reduced pressure and partitioned with dichloromethane to obtain the dichloromethane fraction (DFJi) [35].
Chromatographic Conditions:
- Column: C18 column (150 × 4.6 mm, 5 μm)
- Mobile Phase: A: Water, B: Methanol
- Gradient: 0 min (60% B), 0-20 min (60-100% B), 20-25 min (100% B), 25-25.1 min (100-60% B), 25.1-30 min (60% B)
- Flow Rate: 1.0 mL/min
- Temperature: 25°C
- Injection Volume: 20 μL
- Detection: DAD at 235 nm [35]
Visual Workflows and Signaling Pathways
Method Development Workflow illustrating the systematic approach to UFLC-DAD method development and validation.
The Scientist's Toolkit: Essential Research Reagents and Materials
Table 4: Essential Materials for UFLC-DAD Method Development
| Item | Function | Application Example |
|---|---|---|
| Acclaim Carbonyl C18 Column | Specialized separation of carbonyl derivatives | Carbonyl compound analysis in air samples [14] |
| Standard C18 Column | Versatile reversed-phase separation | Natural product analysis (e.g., jatrophone) [35] |
| DNPH Cartridges | Derivatization and sampling of carbonyls | Airborne carbonyl compound collection [13] |
| LC-MS Grade Solvents | Mobile phase preparation | Minimizing baseline noise and contamination [16] |
| Ammonium Formate/Formic Acid | Mobile phase additives | Improving peak shape and reproducibility [14] |
| Carbonyl-DNPH Standard Mixtures | Method calibration and identification | Quantification of 12 carbonyl compounds [14] |
This comparison guide has systematically evaluated column technologies, mobile phase compositions, and gradient optimization strategies for UFLC-DAD method development in the context of carbonyl compound analysis and natural product quantification. The experimental data demonstrates that specialized column chemistries, such as the Acclaim Carbonyl C18, combined with optimized ACN-water gradients containing volatile buffers, provide superior performance for carbonyl compound separation. For natural products like jatrophone from J. isabellei, conventional C18 columns with methanol-water gradients offer a robust and cost-effective solution.
The validation data presented confirms that UFLC-DAD methods can meet ICH requirements for linearity, precision, accuracy, and sensitivity across diverse applications. As chromatographic technology advances, the development of more specialized stationary phases and improved instrumentation will further enhance separation capabilities, supporting drug development professionals and researchers in their analytical method development endeavors.
DAD Detection Wavelength Selection for Maximum Carbonyl Compound Sensitivity
The accurate quantification of carbonyl compounds is critical in pharmaceutical analysis, environmental monitoring, and occupational health. Within the framework of ICH Q2(R2) validation guidelines for analytical procedures, the selection of optimal detection parameters for Ultra-Fast Liquid Chromatography with Diode Array Detection (UFLC-DAD) significantly influences method sensitivity, specificity, and overall reliability [5] [8]. This guide provides a comparative analysis of DAD detection performance for carbonyl compounds against alternative detection methodologies, supported by experimental data and structured within rigorous validation protocols.
Carbonyl compounds—including aldehydes and ketones—are commonly analyzed after derivatization with 2,4-dinitrophenylhydrazine (DNPH) to form stable hydrazone derivatives that facilitate chromatographic separation and detection [36] [14]. The selection of the detection wavelength is a critical method parameter that directly impacts key validation characteristics such as detection limit, quantitation limit, and linearity as defined by ICH guidelines [5].
Experimental Protocols for Carbonyl Compound Analysis
Standard Derivatization Procedure
The widely adopted protocol for carbonyl compound analysis involves derivatizing carbonyl compounds with DNPH to form 2,4-dinitrophenylhydrazone derivatives [36] [14]. The standard procedure is as follows:
Sample Collection: Air samples are collected using portable sampling pumps at a flow rate of 0.14 L/min through dual-bed cartridges containing DNPH-coated silica [14]. Cartridges typically contain 270 mg of DNPH-coated silica for derivative formation.
Derivatization: Carbonyl compounds react with DNPH to form stable hydrazone derivatives during sampling. The reaction proceeds efficiently at ambient temperature.
Extraction: Hydrazone derivatives are extracted from the cartridges using acetonitrile, followed by filtration through PTFE syringe filters (0.22 μm) to remove particulate matter [14].
Analysis: Extracts are analyzed via LC-DAD or LC-MS/MS using a C18 column (e.g., Acclaim Carbonyl C18, 150 × 3 mm, 3 μm) with mobile phases typically consisting of acetonitrile/water mixtures, often with isocratic elution [37] [14].
Chromatographic Separation Conditions
Optimal separation of DNPH derivatives requires reversed-phase chromatography with the following typical conditions:
- Column: C18 column, specifically designed for carbonyl separation (e.g., 150 mm length × 3-4.6 mm internal diameter, 3-5 μm particle size) [14]
- Mobile Phase: Acetonitrile/water or methanol/water mixtures; isocratic elution with approximately 60:40 acetonitrile/water or gradient elution from 40% to 95% acetonitrile [36] [14]
- Flow Rate: 0.4-1.0 mL/min depending on column dimensions [14]
- Injection Volume: Typically 10-20 μL [14]
Wavelength Selection and Detection Performance
Optimal DAD Wavelength
Experimental studies consistently identify 360 nm as the optimal detection wavelength for DNPH-derivatized carbonyl compounds using DAD detection [14]. This wavelength corresponds to the maximum absorption of the 2,4-dinitrophenylhydrazone chromophore, providing enhanced sensitivity and specificity for carbonyl compounds after derivatization.
The following table summarizes key performance metrics for DAD detection at this optimal wavelength:
Table 1: Performance Characteristics of DAD Detection at 360 nm for Carbonyl-DNPH Derivatives
| Performance Characteristic | Experimental Value | Validation Parameter |
|---|---|---|
| Linear Range | Wide dynamic range demonstrated | Linearity |
| Correlation Coefficient (R²) | 0.996–0.999 | Linearity |
| Intra-day Precision (RSD%) | 0.7–10.0 | Precision |
| Inter-day Precision (RSD%) | 5.0–16.0 | Precision |
| Comparison with LC-MS/MS | Good agreement for formaldehyde & acetaldehyde | Accuracy |
Comparison of Detection Techniques
The following table provides a direct comparison between DAD and MS/MS detection methods for carbonyl compounds, based on experimental data:
Table 2: Comparative Performance of DAD versus MS/MS Detection for Carbonyl Compounds
| Characteristic | LC-UV/DAD (360 nm) | LC-MS/MS |
|---|---|---|
| Sensitivity | Sufficient for major carbonyls | Significantly higher; 3 orders of magnitude better LOD in some cases [38] |
| Sample Quantification Rate | 32% of samples correctly quantified [14] | 98% of samples correctly quantified [14] |
| Formaldehyde/Acetaldehyde Agreement | 0.1–30% deviation from MS/MS values [14] | Reference method |
| Low-Abundance Congeners | Challenging quantification [14] | Reliable quantification |
| Instrument Cost | Lower | Higher |
| Operational Complexity | Lower | Higher requiring specialized training |
| Applicable Settings | Routine monitoring with higher concentrations | Research and trace analysis |
ICH Q2(R2) Validation Framework
Within the ICH Q2(R2) guidelines for analytical procedure validation, DAD detection method validation must address several key criteria [5] [8]:
Specificity: Demonstrated through baseline separation of carbonyl-DNPH derivatives in real samples [14].
Linearity: Verified with R² values exceeding 0.996 for carbonyl compounds at 360 nm detection [14].
Range: Established from the quantitation limit to upper concentration limits determined by linearity studies.
Precision:
Detection Limit (LOD) and Quantitation Limit (LOQ): For air samples of 750 L in volume, LOD values in the full-scan mode varied between 1 and 15 ng/m³, with LOQs approximately three times higher when using MS detection [38]. DAD typically shows higher limits.
The following diagram illustrates the relationship between ICH validation parameters and the optimal detection settings for carbonyl compound analysis:
Advanced Detection Techniques
Mass Spectrometric Detection
For applications requiring higher sensitivity, LC-MS/MS methods provide superior performance:
- Detection Modes: Negative ion mode with atmospheric pressure chemical ionization (APCI) or electrospray ionization (ESI) [38] [36]
- Multiple Reaction Monitoring (MRM): Enhances selectivity and sensitivity for trace analysis [14]
- Limit of Detection: 1-15 ng/m³ for air samples of 750 L in full-scan mode [38]
- Linear Range: From 10 ng/m³ to 800 μg/m³ for carbonyls in air samples [38]
High-Resolution Mass Spectrometry
Recent advances include carbonylomics approaches utilizing high-resolution mass spectrometry (HRMS) with stable isotope-coded derivatization (SICD) using d0-/d3-DNPH [36]. This enables:
- Non-targeted analysis: Comprehensive profiling of known and unknown carbonyls
- Enhanced specificity: Characteristic fragment-based identification
- Reduced false positives: Isotope-pattern based confirmation
The following workflow diagram illustrates the advanced HRMS approach for comprehensive carbonyl analysis:
Research Reagent Solutions
Table 3: Essential Research Reagents for Carbonyl Compound Analysis
| Reagent/Material | Function | Application Notes |
|---|---|---|
| DNPH-coated Cartridges | Derivitization and sampling of carbonyls | Dual-bed with BPE for ozone scrubbing; 270 mg DNPH-coated silica [14] |
| d0-/d3-DNPH Isotopes | Stable isotope-coded derivatization | Enables accurate quantification in carbonylomics [36] |
| Acclaim Carbonyl C18 Column | Chromatographic separation | Specialized for carbonyl-DNPH derivatives; 150 × 3 mm, 3 μm [14] |
| Carbonyl-DNPH Standard Mixture | Method calibration | Contains 12 carbonyl-DNPH derivatives for quantification [14] |
| Acetonitrile (LC-MS Grade) | Mobile phase and extraction | High purity for optimal sensitivity [14] |
The selection of 360 nm as the detection wavelength for DAD analysis of DNPH-derivatized carbonyl compounds provides optimal sensitivity within the ICH Q2(R2) validation framework. This approach demonstrates acceptable linearity (R² > 0.996) and precision (RSD% 0.7-16.0) for numerous applications, particularly when analyzing predominant carbonyls like formaldehyde and acetaldehyde.
However, comparative studies reveal significant limitations in DAD sensitivity, with only 32% of samples correctly quantified compared to 98% with LC-MS/MS methodologies [14]. For applications requiring trace-level detection or comprehensive carbonyl profiling, mass spectrometric detection—particularly advanced HRMS with isotope-coded derivatization—offers substantially improved performance despite higher complexity and cost.
The choice between these detection platforms should be guided by specific application requirements, sensitivity needs, and available resources, with DAD at 360 nm remaining a reliable and cost-effective option for routine analysis where target analytes are present at sufficiently high concentrations.
Thermal oxidation of edible oils during processes like frying generates a range of carbonyl compounds (CCs), which are secondary lipid oxidation products. These compounds, particularly reactive carbonyl species like acrolein and 4-hydroxy-2-nonenal (HNE), raise significant health concerns as they have been associated with diseases such as atherosclerosis, carcinogenesis, and Alzheimer's, and can react with biomolecules like DNA and proteins to disrupt cellular functions [27]. The analysis of these compounds in complex oil matrices requires robust, sensitive, and validated analytical methods. This case study focuses on the application of an Ultra-Fast Liquid Chromatography coupled with Diode Array and Electrospray Ionization Mass Spectrometric detection (UFLC-DAD-ESI-MS) method for the determination of carbonyl compounds in soybean oil under continuous heating. The methodology and its validation are framed within the rigorous requirements of the International Council for Harmonisation (ICH) Q2(R2) guideline on analytical procedure validation [5]. Soybean oil is a model matrix for such studies due to its high polyunsaturated fatty acid content and widespread use, making it highly susceptible to oxidation [27].
Experimental Protocol & Workflow
Core Analytical Methodology
The analyzed protocol involves the extraction and derivatization of carbonyl compounds from the oil matrix followed by chromatographic separation and detection [16] [27].
- Sample Preparation: Heated soybean oil samples undergo liquid-liquid extraction. The optimal parameters use 1.5 mL of acetonitrile as the extraction solvent, followed by manual stirring for 3 minutes and 30 minutes of sonication [16].
- Derivatization: Carbonyl compounds are derivatized using 2,4-dinitrophenylhydrazine (2,4-DNPH). This reagent was selected for its simultaneous reaction with aldehydes and ketones at room temperature and the high stability of the resulting hydrazone derivatives [27].
- Chromatographic Analysis: The derivatized extracts are analyzed using UFLC-DAD-ESI-MS. A C18 column is typically employed for separation. The mobile phase consists of a gradient of methanol and 0.1% formic acid in water, optimized to achieve baseline resolution for most carbonyl-DNPH derivatives [27] [39].
The following diagram illustrates the complete experimental workflow from sample preparation to data analysis:
The Scientist's Toolkit: Key Research Reagent Solutions
The following table details essential materials and reagents used in the featured methodology and their specific functions within the experimental protocol.
Table 1: Essential Research Reagents and Materials for Carbonyl Compound Analysis
| Item | Function / Application | Experimental Context |
|---|---|---|
| 2,4-Dinitrophenylhydrazine (2,4-DNPH) | Derivatization reagent for carbonyl compounds. | Forms stable hydrazone derivatives with aldehydes and ketones, enabling their UV detection and MS characterization [27]. |
| Acetonitrile | Extraction solvent. | Used for liquid-liquid extraction of carbonyl compounds from the oil matrix due to its polarity and immiscibility with oil [16]. |
| C18 Chromatographic Column | Stationary phase for UFLC. | Provides reverse-phase separation of derivatized carbonyl compounds prior to detection [39]. |
| Carbonyl Compound Standards | Analytical standards for calibration and identification. | Includes acrolein, 4-hydroxy-2-nonenal (HNE), 2,4-decadienal, etc., used for method validation and quantification [16] [27]. |
Method Validation per ICH Q2(R2) Guidelines
The UFLC-DAD-ESI-MS method was rigorously validated to demonstrate its suitability for quantifying carbonyl compounds in thermally stressed soybean oil. The validation process assessed key performance characteristics as defined by the ICH Q2(R2) guideline [5]. The following diagram maps the logical relationship between the ICH guideline and the specific validation parameters assessed in this case study:
The methodology was successfully validated, with performance data summarized in the table below.
Table 2: Experimental Validation Data for the UFLC-DAD-ESI-MS Method
| Validation Parameter | Experimental Results & Data | ICH Conformance Assessment |
|---|---|---|
| Specificity | The method successfully separated and identified 10 target carbonyl compounds (e.g., 4-HNE, 2,4-decadienal, acrolein) in a complex oil matrix [16]. | Conforms. Demonstrated the ability to assess the analyte unequivocally in the presence of potential interferents from the oil matrix [5]. |
| Accuracy (Recovery) | Mean recovery rates at the lowest spiked concentration (0.2 μg/mL) ranged from 70.7% to 85.0% for the target carbonyl compounds [16]. | Conforms. Recovery rates within this range are generally considered acceptable for analytical procedures at low concentrations, demonstrating closeness to the true value [5] [40]. |
| Precision | The method demonstrated acceptable repeatability under the same operating conditions [16]. | Conforms. Data indicates a close agreement between a series of measurements, fulfilling the precision requirement [5] [40]. |
| Detection Limit (LOD) | LODs for the carbonyl compounds ranged from 0.03 to 0.1 μg/mL [16]. | Conforms. The lowest amount of analyte that can be detected, but not necessarily quantified, was satisfactorily established [5]. |
| Quantification Limit (LOQ) | The LOQ for all target carbonyl compounds was established at 0.2 μg/mL [16]. | Conforms. The lowest concentration of the analytes can be quantified with acceptable accuracy and precision, defining the lower end of the range [5]. |
| Linearity & Range | The method demonstrated linearity for all analytes in the concentration range from the LOQ (0.2 μg/mL) up to 10.0 μg/mL [16]. | Conforms. A direct linear relationship between concentration and response was demonstrated over the specified range, which includes the expected concentrations found in heated samples [5]. |
Application Data: Carbonyl Profile of Heated Soybean Oil
When the validated method was applied to soybean oil heated continuously at 180°C, it successfully identified and quantified a range of harmful carbonyl compounds. The concentration of these compounds increased with heating time, illustrating the progression of lipid oxidation.
Table 3: Concentrations of Key Carbonyl Compounds Identified in Soybean Oil Heated at 180°C
| Carbonyl Compound | Mean Concentration (μg/g of oil) | Toxicological Significance |
|---|---|---|
| 4-hydroxy-2-nonenal (HNE) | 36.9 | Reacts with DNA and proteins, potentially causing mutations and disrupting cellular functions [27]. |
| 2,4-decadienal | 34.8 | Associated with the development of adenocarcinoma in lungs and stomach [27]. |
| 2,4-heptadienal | 22.6 | A common secondary oxidation product indicative of PUFA degradation. |
| Acrolein | Identified (specific concentration not listed in results) | Irritant linked to atherosclerosis, carcinogenesis, and Alzheimer's disease [27]. |
| Other Compounds | Identified | 4-hydroxy-2-hexenal (HHE), 2-heptenal, 2-octenal, 4,5-epoxy-2-decadal, 2-decenal, and 2-undecenal were also identified [16]. |
Comparative Performance with Alternative Methods
Chromatographic methods like HPLC/UFLC coupled with DNPH derivatization are widely considered the standard for carbonyl analysis due to their sensitivity and specificity [39] [41]. However, alternative and emerging methodologies exist.
- Gas Chromatography (GC and GC-MS): These techniques are also commonly applied for the analysis of volatile carbonyl compounds. They offer excellent separation efficiency but often require headspace sampling or solid-phase microextraction (SPME) for volatile analytes and may not be as suited for non-volatile or thermally labile hydroxyalkenals like HNE without additional derivatization steps [39].
- Novel Carbonylomics Approaches: Emerging techniques are being developed for more comprehensive analysis. A 2025 study detailed a "carbonylomics" workflow using stable isotope-coded derivatization (SICD) with DNPH and LC-HRMS for non-targeted analysis of Reactive Carbonyl Species (RCS) [42]. This method identified 129 different RCS in heated soybean oil, including novel compounds like trans,trans-2,4-undecadienal and 2,3-octanedione, which were not reported in the targeted UFLC-DAD-ESI-MS study. This highlights how non-targeted approaches can reveal a broader spectrum of analytes [42].
- Rapid Detection Methods: While not suitable for precise quantification of individual compounds, rapid methods like colorimetric sensors and electronic noses are being developed for on-situ and portable assessment of oil oxidation. These are valuable for quick quality control but lack the detailed compositional data provided by chromatographic methods [41].
This application case study demonstrates that the UFLC-DAD-ESI-MS method, validated in accordance with ICH Q2(R2) principles, is a precise, accurate, and sensitive tool for profiling harmful carbonyl compounds in thermally stressed soybean oil. The data generated reveals the formation of significant quantities of toxicants like HNE and 2,4-decadienal, underscoring the safety concerns associated with thermally degraded oils. The method serves as a robust standard for targeted analysis. However, the field is advancing with techniques like carbonylomics, which offer expanded capabilities for non-targeted discovery, promising a more comprehensive understanding of lipid oxidation products in the future.
Within the context of pharmaceutical development and stability testing, the identification and quantification of reactive carbonyl species are critical. These compounds, often generated through lipid peroxidation, can compromise drug stability, efficacy, and safety. This guide objectively compares the profiles of three critical carbonyls—4-Hydroxy-2-nonenal (4-HNE), 2,4-Decadienal, and Acrolein—based on experimental data, framing the analysis within the validation of an Ultra-Fast Liquid Chromatography-Diode Array Detection (UFLC-DAD) method aligned with ICH guidelines [16] [43] [44]. The robust profiling of these degradation products is essential for mitigating risks in drug formulations and understanding their role in oxidative stress-related disease pathologies.
Compound Profiles and Toxicological Significance
Chemical Identities and Origins
Carbonyl compounds are ubiquitous secondary products formed during the lipid peroxidation of polyunsaturated fatty acids. The three carbonyls profiled here are characterized by an α,β-unsaturated aldehyde structure, which confers high reactivity and electrophilicity.
- 4-Hydroxy-2-nonenal (4-HNE) is a nine-carbon α,β-unsaturated hydroxyalkenal (C9H16O2) produced primarily from the peroxidation of omega-6 fatty acids like linoleic acid and arachidonic acid [45].
- 2,4-Decadienal is a ten-carbon compound (C10H16O) with a conjugated diene system, also originating from the oxidation of linoleic acid and other PUFAs [46] [43].
- Acrolein is the simplest α,β-unsaturated aldehyde (C3H4O), a colorless to yellow liquid with an acrid odor. It forms not only during lipid peroxidation but also from the thermal decomposition of glycerol and other organic materials [47].
Mechanisms of Toxicity and Biological Targets
The toxicity of these carbonyls is primarily mediated by their electrophilic character, which drives reactions with soft nucleophiles in biological systems.
- Common Mechanistic Basis: As soft electrophiles, 4-HNE, 2,4-Decadienal, and Acrolein preferentially form 1,4-Michael type adducts with soft nucleophiles, such as the sulfhydryl group of cysteine residues in proteins [48] [45]. This electron-deficient property stems from the α,β-unsaturated carbonyl structure, where the carbonyl oxygen withdraws electron density from the beta-carbon [48].
- Protein Adducts and DNA Damage: 4-HNE can form adducts via Michael addition targeting cysteine, histidine, or lysine, or via Schiff base formation with arginine or lysine [45]. These modifications can disrupt protein function, inhibit enzyme activity, and generally disrupt cellular homeostasis. Furthermore, 4-HNE can react with DNA bases, potentially leading to mutations and inhibited DNA synthesis [43].
- Specific Toxicological Outcomes:
- Acrolein is a potent irritant to the eyes, nose, and throat and has been linked to diseases such as atherosclerosis, carcinogenesis, and Alzheimer's disease. It is also known to inhibit the tumor suppressor protein p53, which may contribute to lung cancer development [43].
- 2,4-Decadienal has been associated with the development of adenocarcinoma in the lungs from exposure to cooking oil smoke and adenocarcinomas in the stomach and gut from the consumption of fried foods [43].
Table 1: Comparative Toxicological Profiles of Key Carbonyl Compounds.
| Compound | Molecular Formula | Primary Sources | Major Biological Targets | Associated Health Risks |
|---|---|---|---|---|
| 4-Hydroxy-2-nonenal (4-HNE) | C₉H₁₆O₂ [45] | Peroxidation of omega-6 PUFAs (e.g., linoleic acid) [45] | Cysteine, Histidine, Lysine residues; DNA bases [45] [43] | Neurodegenerative diseases (Alzheimer's), atherosclerosis, diabetes, mutations [48] [43] |
| 2,4-Decadienal | C₁₀H₁₆O [46] | Peroxidation of omega-6 PUFAs; thermal degradation in foods [46] [43] | Not fully elucidated; reactive oxygen species production implicated [46] | Lung and gastric adenocarcinoma from oil smoke and fried food consumption [43] |
| Acrolein | C₃H₄O [47] | Lipid peroxidation; thermal decomposition of glycerol; cigarette smoke [47] [43] | Cysteine residues (primary target); tumor suppressor proteins [48] [43] | Irritant, atherosclerosis, lung cancer, Alzheimer's disease, hemorrhagic cystitis [47] [43] |
Experimental Data from a Model System: Heated Soybean Oil
A validated UFLC-DAD-ESI-MS method was applied to quantify carbonyl compounds generated in soybean oil continuously heated at 180°C, simulating a robust model for oxidative degradation [16] [43]. The method demonstrated compliance with ICH validation parameters, including:
- Specificity: No interference from the oil matrix.
- Accuracy: Average recoveries at the lowest concentration level (0.2 μg mL⁻¹) ranged from 70.7% to 85.0%.
- Sensitivity: A quantification limit of 0.2 μg mL⁻¹ for all analyzed compounds [16].
Quantitative Profiling of Carbonyls
The application of this validated method to heated soybean oil provided a direct, quantitative comparison of the formation levels of the three target carbonyls among a wider set of degradation products.
Table 2: Quantitative Profile of Selected Carbonyl Compounds in Soybean Oil Heated at 180°C [16].
| Compound | Mean Concentration (μg/g of oil) |
|---|---|
| 4-Hydroxy-2-nonenal (HNE) | 36.9 |
| 2,4-Decadienal | 34.8 |
| 2,4-Heptadienal | 22.6 |
| 4-Hydroxy-2-hexenal (HHE) | Data Provided* |
| Acrolein | Data Provided* |
| 2-Heptenal | Data Provided* |
| 2-Octenal | Data Provided* |
| 4,5-Epoxy-2-decadal | Data Provided* |
| 2-Decenal | Data Provided* |
| 2-Undecenal | Data Provided* |
Note: The study identified and confirmed the presence of these compounds, with 4-HNE, 2,4-Decadienal, and 2,4-Heptadienal presenting the highest concentrations after heating [16].
Detailed Experimental Methodology
The following section outlines the core protocols and workflows used to generate the comparative data, providing a reproducible framework for researchers.
Sample Preparation and Extraction Protocol
The method for determining carbonyl compounds (CCs) in the liquid phase of oils involved a liquid-liquid extraction followed by derivatization [16] [43].
- Extraction: A sample of heated oil is mixed with 1.5 mL of acetonitrile as the extraction solvent. The mixture is manually stirred for 3 minutes followed by 30 minutes of sonication to maximize the recovery of carbonyl compounds from the oil matrix.
- Derivatization: The extracted CCs are derivatized using 2,4-dinitrophenylhydrazine (2,4-DNPH). This reagent was selected for its simultaneous reaction with aldehydes and ketones at room temperature and the high stability of the resulting hydrazone derivatives [43].
Instrumental Analysis: UFLC-DAD-ESI-MS
- Chromatography: Analysis of the DNPH-derivatized carbonyls is performed using Ultra-Fast Liquid Chromatography (UFLC) to achieve high-resolution separation.
- Detection: The system is coupled to a Diode Array Detector (DAD) for initial detection and quantification. Subsequently, confirmation is achieved via an Electrospray Ionization Mass Spectrometer (ESI-MS) for definitive compound identification based on molecular mass and fragmentation patterns [16] [43].
Experimental Workflow Visualization
The diagram below summarizes the analytical workflow.
The Scientist's Toolkit: Essential Research Reagents and Materials
The following table details key materials and reagents required for the experimental profiling of carbonyl compounds as described.
Table 3: Essential Reagents and Materials for Carbonyl Compound Analysis.
| Item | Function/Application |
|---|---|
| Soybean Oil (or other test matrix) | A model system rich in polyunsaturated fatty acids for studying the formation of carbonyl compounds under thermal stress [16] [43]. |
| Acetonitrile (HPLC Grade) | Serves as the extraction solvent for isolating carbonyl compounds from the oil matrix due to its polarity and immiscibility with oil [16] [43]. |
| 2,4-Dinitrophenylhydrazine (2,4-DNPH) | Derivatization reagent that reacts with carbonyl functional groups to form stable hydrazone derivatives, facilitating their chromatographic analysis [43]. |
| Carbonyl Compound Standards | Authentic analytical standards (e.g., 4-HNE, 2,4-Decadienal, Acrolein) are essential for method calibration, identification, and quantification [16]. |
| UFLC-DAD-ESI-MS System | Integrated instrumental platform for high-resolution separation (UFLC), detection and quantification (DAD), and confirmatory identification (ESI-MS) [16] [43]. |
This comparison guide elucidates the distinct yet interconnected profiles of 4-HNE, 2,4-Decadienal, and Acrolein. The data, derived from a rigorously validated UFLC-DAD method, demonstrate that these carbonyls are produced in significant and quantifiable amounts under thermal oxidative stress. 4-HNE and 2,4-Decadienal were identified at the highest concentrations in the heated soybean oil model, underscoring their abundance as lipid peroxidation products. The validated methodological approach, compliant with ICH principles, provides a reliable framework for the accurate profiling of these toxicologically relevant compounds. This work highlights the critical importance of monitoring such carbonyls not only in food systems but also in the context of pharmaceutical development, where oxidative degradation can impact drug safety and stability. A deeper understanding of their formation and reactivity is paramount for developing strategies to mitigate their adverse effects in both consumer products and disease states.
Troubleshooting UFLC-DAD Analysis: Solving Specificity, Recovery, and Robustness Challenges
In the validation of chromatographic methods, specificity is the fundamental parameter that ensures the accurate and reliable measurement of analytes in the presence of potential interferents. For scientists developing Ultra-Fast Liquid Chromatography with Diode Array Detection (UFLC-DAD) methods for carbonyl compounds, two pervasive challenges threaten methodological specificity: co-eluting peaks and complex matrix interferences. These issues are particularly acute in pharmaceutical development, where ICH Q3A(R2) and Q3B(R) guidelines mandate the identification and control of impurities, requiring methods capable of resolving complex mixtures with confidence [49] [50]. Co-elution occurs when two or more compounds share nearly identical retention times, preventing their individual quantification. Matrix interferences arise when other components in the sample, such as excipients in a drug product or unrelated compounds in an environmental sample, obscure or distort the analyte signal. This guide objectively compares the performance of advanced UFLC-DAD techniques against conventional HPLC and other complementary approaches, providing experimental data to help researchers select the optimal strategy for their specific application, thereby ensuring compliance with regulatory standards for method validation.
Performance Comparison of Analytical Techniques
The choice of analytical technique profoundly impacts the ability to resolve co-elutions and overcome matrix effects. The following table summarizes the key characteristics of different approaches relevant to carbonyl compound analysis.
Table 1: Performance Comparison of Chromatographic Techniques for Carbonyl Compound Analysis
| Analytical Technique | Key Features & Separation Mode | Performance on Specificity & Co-elution | Reported Limits of Detection (LOD) | Sample Throughput & Suitability |
|---|---|---|---|---|
| UFLC-DAD-ESI-MS [16] | Ultra-Fast LC with Mass Spectrometric detection; Gradient elution. | High. MS detection provides definitive peak identification based on mass, resolving co-elutions that DAD cannot. | 0.03 to 0.1 μg mL⁻¹ for various carbonyls in oil. | High throughput for complex matrices (e.g., food, environmental). |
| Conventional HPLC-UV/DAD [13] | Standard HPLC with UV or DAD detection; Often isocratic or gradient. | Moderate. Relies on spectral differences and retention time; co-elution is a major limitation. | Not specified for all, but UV/DAD quantified only 32% of samples vs. 98% for MS/MS. | Moderate; suitable for simpler mixtures with known, well-separated analytes. |
| HPLC-MS/MS [13] | HPLC with tandem mass spectrometry. | Very High. MRM mode offers superior selectivity and resistance to matrix interferences. | Highly sensitive, allowing quantification in 98% of workplace air samples. | High throughput for complex matrices; ideal for trace-level analysis. |
| Transportable HPLC-UV [37] [18] | Portable, isocratic system for on-site analysis. | Low to Moderate. Co-elution of critical pairs (e.g., BO-DNPH and BA-DNPH) was observed. | LOD for formaldehyde-DNPH: < 1 mg L⁻¹ (UV). | Rapid, on-site analysis (<20 min); compromised resolution for portability. |
Detailed Experimental Protocols and Methodologies
UFLC-DAD-ESI-MS Method for Carbonyls in Complex Matrices
A validated protocol for determining carbonyl compounds in thermally stressed soybean oil exemplifies a robust approach to managing a complex, oily matrix [16]. The method involves a sample preparation step designed to extract analytes efficiently while leaving interfering lipids behind.
- Sample Preparation: Oil samples (0.5 g) are extracted with 1.5 mL of acetonitrile as the solvent. The mixture is manually stirred for 3 minutes, followed by 30 minutes of sonication to enhance extraction efficiency. The extract is then centrifuged or filtered prior to injection [16].
- Chromatographic Conditions:
- Instrumentation: Ultra-Fast Liquid Chromatography (UFLC) system.
- Detection: Diode Array Detection (DAD) coupled with Electrospray Ionization Mass Spectrometry (ESI-MS). The MS provides confirmation of identity where DAD suggests co-elution.
- Separation Mode: Gradient elution is employed to separate a wide range of carbonyl compounds, including 4-hydroxy-2-nonenal, 2,4-decadienal, and acrolein [16].
- Method Validation Data:
- Linearity: Demonstrated across concentration levels from 0.2 to 10.0 μg mL⁻¹.
- Recovery: Average recoveries at the lowest concentration level ranged from 70.7% to 85.0%, indicating good accuracy despite the complex matrix.
- Sensitivity: The method achieved a limit of detection (LOD) between 0.03 and 0.1 μg mL⁻¹ and a limit of quantification (LOQ) of 0.2 μg mL⁻¹ for all target carbonyl compounds [16].
HPLC-MS/MS vs. HPLC-UV/DAD for Airborne Carbonyls
A direct comparison of two detection techniques for analyzing airborne carbonyls in workplace settings highlights the performance gap in specificity and sensitivity [13]. The sample preparation is consistent for both detection methods, focusing on derivatization to stabilize the reactive carbonyls.
- Sample Collection and Derivatization: Air samples are drawn through dual-bed cartridges coated with 2,4-dinitrophenylhydrazine (DNPH) and 1,2-bis(2-pyridyl) ethylene (BPE). DNPH derivatizes carbonyl compounds into stable hydrazone derivatives, while BPE removes ozone to prevent interference. The derivatives are then eluted with acetonitrile for analysis [13].
- Chromatographic Conditions:
- Column: Acclaim Carbonyl C18 RSLC (150 x 3 mm, 3 µm).
- HPLC-UV/DAD Analysis: The HPLC system is coupled with a UV/DAD detector set at 360 nm. This method showed poor performance, quantifying only 32% of samples due to insufficient sensitivity and specificity [13].
- HPLC-MS/MS Analysis: The same HPLC system is coupled with a tandem mass spectrometer operating in Multiple Reaction Monitoring (MRM) mode with an ESI source in negative mode. This method successfully quantified 98% of the same samples [13].
- Method Performance Data:
- Precision: Both methods showed acceptable intra-day repeatability (RSD < 10% for MS/MS; RSD < 10% for UV/DAD) [13].
- Sensitivity and Specificity: The high specificity of the MS/MS's MRM mode minimized matrix interferences, allowing it to detect and quantify low-abundance congeners that the UV/DAD method could not. The comparison of concentrations for the same samples showed good agreement for formaldehyde and acetaldehyde but significant deviations for less abundant compounds when using UV/DAD [13].
Isocratic HPLC-UV for Rapid On-Site Analysis
A simplified, isocratic method developed for a transportable HPLC-UV system demonstrates a trade-off between analysis speed/resource requirements and resolution [37] [18]. This approach is designed for rapid, ISO 16000-3 compliant analysis.
- Sample Derivatization: Carbonyl compounds are derivatized on DNPH-coated sampling tubes to form hydrazones [18].
- Chromatographic Conditions:
- System: Transportable HPLC with isocratic pump and UV or LED detector.
- Mobile Phase: Water and acetonitrile in isocratic mode.
- Run Time: Less than 20 minutes [18].
- Method Performance and Limitation:
- The method successfully separated 11 out of 13 carbonyl hydrazones. However, 2-butanone-DNPH and butanal-DNPH (BO-DNPH and BA-DNPH) co-eluted fully, demonstrating a clear specificity issue for this critical pair [18].
- LODs for the hydrazones ranged from 0.12 to 0.38 mg L⁻¹ with a UV detector.
- Precision: Consecutive injections showed a relative standard deviation (RSD) of < 11.5% (UV) [18].
Workflow and Strategy for Enhancing Specificity
The following diagram visualizes a systematic, tiered approach to troubleshooting and resolving specificity issues, moving from initial method development to advanced confirmation techniques.
The Scientist's Toolkit: Essential Research Reagents and Materials
Successful analysis of carbonyl compounds requires specific reagents and materials designed to stabilize these reactive molecules and facilitate their separation. The following table details key solutions used in the featured experiments.
Table 2: Essential Research Reagents and Materials for Carbonyl Compound Analysis
| Item | Function & Rationale | Application Example |
|---|---|---|
| 2,4-Dinitrophenylhydrazine (DNPH) | Derivatizing agent that reacts with carbonyl compounds (aldehydes/ketones) to form stable, chromophoric hydrazone derivatives, enabling UV detection and improving chromatographic behavior [13] [18]. | Coating on sampling cartridges for collecting airborne formaldehyde and acetaldehyde [13]. |
| DNPH-Coated Sampling Cartridges | Ready-to-use devices for ambient air sampling. Often include a second bed coated with 1,2-bis(2-pyridyl)ethylene (BPE) to scrub ozone, which can degrade DNPH derivatives and cause negative interference [13]. | Personal and environmental monitoring of workplace exposure to carbonyl compounds [13]. |
| Acetonitrile (ACN), LC-MS Grade | High-purity solvent used for eluting derivatives from DNPH cartridges, preparing mobile phases, and reconstituting samples. Its high purity minimizes background noise in UV and MS detection [13]. | Mobile phase component in the isocratic separation of 13 carbonyl-DNPH hydrazones [18]. |
| Carbonyl-DNPH Standard Mixtures | Certified reference materials containing predefined mixtures of common carbonyl compounds as their DNPH derivatives. Essential for method development, calibration, and peak identification [13]. | Used for calibrating both HPLC-UV/DAD and HPLC-MS/MS systems in the comparative study [13]. |
| C18 Reverse-Phase Columns | The most common stationary phase for separating carbonyl-DNPH hydrazones based on their hydrophobicity. Specialized versions (e.g., Acclaim Carbonyl C18) are available for enhanced performance [13]. | Separation of 12 carbonyl-DNPH derivatives in workplace air samples [13]. |
The accurate analysis of polar carbonyl compounds is a cornerstone in pharmaceutical development, environmental monitoring, and food science. These analytes, characterized by their high polarity, volatility, and reactivity, present significant challenges for efficient extraction, separation, and detection. Recovery rates directly impact method accuracy, sensitivity, and reliability, making extraction optimization a critical step in method development. Within the framework of International Council for Harmonisation (ICH) guidelines, specifically for the validation of Ultra-Fast Liquid Chromatography with Diode Array Detection (UFLC-DAD) methods, demonstrating robust and efficient extraction is not merely good scientific practice but a regulatory necessity [51] [52]. This guide provides a systematic comparison of extraction strategies and chromatographic configurations to improve the recovery of polar carbonyls, supported by experimental data and structured within the rigorous context of analytical method validation.
Comparative Analysis of Extraction and Derivatization Techniques
The analysis of polar carbonyls often relies on derivatization to enhance chromatographic behavior and detection sensitivity. The choice of extraction and derivatization strategy significantly influences recovery rates, selectivity, and overall method performance.
Table 1: Comparison of Extraction and Derivatization Methods for Carbonyl Compounds
| Method | Mechanism | Optimal Carbonyl Range | Key Advantages | Limitations | Reported Recovery (%) |
|---|---|---|---|---|---|
| DNPH Cartridge Derivatization | Carbonyls drawn through cartridges impregnated with DNPH, forming hydrazones [53] [54]. | C1-C13 aldehydes and ketones [53] [55]. | High derivatization efficiency (>90% recovery for most carbonyls) [54]. Suitable for gas and particle phases [55]. | Potential interference from sample matrices; requires elution and concentration [53]. | 81.0 - 115.3% [56] |
| In-Solution DNPH Derivatization | Direct reaction of DNPH with carbonyls in a solution sample [56]. | Volatile carbonyls in oils and complex matrices [56]. | Simplicity; effective for complex matrices like olive oil [56]. | May require internal standardization for quantification. | 81.0 - 115.3% [56] |
| Dynamic Headspace with Derivatization | Volatiles transferred to gas phase and trapped on a derivatizing agent [56]. | Highly volatile carbonyls (e.g., in olive oil) [56]. | Reduces matrix interference by analyzing only volatile components [56]. | Limited to highly volatile compounds; requires specialized equipment. | Data not fully quantified in search results |
The data demonstrates that DNPH derivatization is a versatile and robust strategy. One study achieved recoveries of 81.0–115.3% for nine carbonyls in virgin olive oil using in-solution derivatization, confirming its effectiveness in complex matrices [56]. For air sampling, DNPH cartridges showed excellent performance, with recoveries exceeding 90% for most carbonyls like formaldehyde, acetaldehyde, and butanal in breath analysis [54].
Chromatographic Column Selection for Polar Carbonyl Separation
Following derivatization, chromatographic separation is critical. The diverse chemical nature of polar carbonyls, especially within metabolic pathways, makes a single chromatographic condition insufficient [57]. The choice of column chemistry profoundly impacts analytical coverage, resolution, and peak shape.
Table 2: Comparison of Chromatographic Approaches for Polar Carbonyls and Derivatives
| Chromatographic Mode | Column Chemistry | Mechanism | Suitability for Polar Carbonyls | Key Findings |
|---|---|---|---|---|
| Reversed-Phase (e.g., C18) | Alkyl silane (C18) [57] [53]. | Hydrophobic partitioning. | Standard for DNPH-hydrazones; well-established method [53]. | Provides a robust baseline method for many carbonyl-DNPH derivatives. |
| Hydrophilic Interaction Liquid Chromatography (HILIC) | Zwitterionic sulfobetaine [57]. | Polar partitioning with aqueous-rich layer. | Excellent for very polar, underivatized carbonyls; best overall coverage for central carbon metabolism analytes [57]. | Polymeric option offered highest coverage; hybrid silica offered best throughput [57]. |
| Mixed-Mode Chromatography (MMC) | Combination of C18 and anion-exchange (AXE) [57]. | Mixed hydrophobic and ionic interactions. | Superior for strongly anionic analytes (e.g., multiresidue phosphates) [57]. | Ideal for complex mixtures containing carboxylic acids and phosphates. |
Research indicates that a zwitterionic sulfobetaine-based HILIC column provides the best analytical coverage for untargeted profiling of central carbon metabolism, which includes many polar carbonyls and acids [57]. For strongly anionic analytes, such as phosphorylated compounds, mixed-mode chromatography (MMC) demonstrated excellent performance [57]. The study also suggested that an additional hydrophilic modulation could further improve the resolution of small carboxylic acids in the zwitterionic HILIC mode [57].
Workflow for Optimized Carbonyl Analysis and ICH Validation
Implementing an optimized, validated method requires a systematic workflow that integrates extraction, separation, and detection with regulatory requirements. The following diagram maps this process from sample preparation to ICH-compliant method validation.
Forced Degradation Studies for ICH Method Validation
Within the ICH framework, forced degradation (stress testing) is critical for validating a stability-indicating method (SIM) [58]. These studies help establish the intrinsic stability of a drug substance, elucidate degradation pathways, and, most importantly, demonstrate the specificity of the analytical method by proving it can accurately measure the analyte in the presence of its degradation products [58] [59].
Table 3: Standard Conditions for Forced Degradation Studies [58]
| Stress Condition | Suggested Parameters for Drug Substance | Typical Exposure | Purpose |
|---|---|---|---|
| Acid Hydrolysis | 0.1 M HCl at 40-60°C | 1-5 days | To simulate degradation in acidic environment. |
| Base Hydrolysis | 0.1 M NaOH at 40-60°C | 1-5 days | To simulate degradation in basic environment. |
| Oxidative Stress | 3% H₂O₂ at 25-60°C | 1-5 days (or ≤ 24h for solutions) | To assess susceptibility to oxidation. |
| Thermal Stress | Solid drug substance at 60-80°C | 1-5 days | To understand the effect of heat. |
| Photolytic Stress | Exposure to light per ICH Q1B (1x and 3x ICH) | 1-5 days | To evaluate sensitivity to UV/visible light. |
A degradation level of 5% to 20% is generally considered appropriate for validating chromatographic assays, with 10% often being an optimal target [58]. Over-stressing can lead to secondary degradation products not seen in real-time stability studies, while under-stressing may not generate sufficient degradants to challenge the method [58]. The optimized UFLC-DAD method for carbonyls must be able to resolve the active pharmaceutical ingredient (API) from the degradation products generated under these conditions.
Essential Research Reagent Solutions
Successful analysis requires specific reagents and materials. The following table details key solutions for the DNPH-based extraction and analysis of carbonyl compounds.
Table 4: Key Research Reagents for Carbonyl Compound Analysis
| Reagent / Material | Function / Role | Example Application Notes |
|---|---|---|
| 2,4-Dinitrophenylhydrazine (DNPH) | Derivatizing agent; reacts with carbonyl functional groups to form stable hydrazone derivatives for detection [53] [56]. | Used to impregnate silica cartridges for air sampling or added directly to solution samples [53] [54]. |
| DNPH-Impregnated Silica Cartridges | Sample collection medium; traps and derivatizes gaseous carbonyls simultaneously during sampling [53] [54]. | Standard method for collecting airborne carbonyls; breath analysis [54]. |
| Acetonitrile (HPLC Grade) | Elution and mobile phase solvent; used to dissolve DNPH, elute hydrazones from cartridges, and as a key component in LC mobile phases [53] [56]. | Ensures high purity and minimizes UV-absorbing impurities that interfere with DAD detection. |
| Ammonium Acetate Buffer | Mobile phase additive; helps control pH and improve chromatographic separation of carbonyl-DNPH derivatives in reversed-phase LC [53]. | Contributes to reproducible retention times and peak shapes. |
| Carbonyl-DNPH Standard Mixtures | Quantitative calibration; used as reference standards to identify and quantify unknown carbonyls in samples based on retention time and UV spectrum [53]. | Commercial mixtures of common carbonyl-DNPH derivatives (e.g., formaldehyde, acetaldehyde, acetone) are available. |
Optimizing the recovery of polar carbonyl compounds is a multi-faceted process that hinges on the strategic selection of derivatization and chromatographic techniques. As demonstrated, DNPH derivatization remains a highly reliable extraction method, providing robust recovery across diverse sample matrices. For chromatographic separation, moving beyond standard reversed-phase columns to HILIC and mixed-mode phases can significantly enhance the resolution and coverage of highly polar and anionic carbonyl species, which are often poorly retained by C18 columns.
Integrating these optimized strategies into a formal UFLC-DAD method validation protocol that includes forced degradation studies per ICH Q1 and Q2 guidelines is imperative for pharmaceutical applications [51] [58] [52]. This holistic approach ensures that the method is not only scientifically sound but also meets regulatory standards for specificity, accuracy, and robustness, providing reliable data throughout the drug development lifecycle.
Enhancing Signal-to-Noise Ratio for Accurate LOD and LOQ Determination
In the development and validation of Ultra-Fast Liquid Chromatography with Diode Array Detection (UFLC-DAD) methods for carbonyl compounds, the determination of Limit of Detection (LOD) and Limit of Quantification (LOQ) represents a critical validation milestone under ICH guidelines. These parameters define the fundamental capabilities and limitations of an analytical procedure, establishing the lowest concentrations of analytes that can be reliably detected and quantified. The accuracy of LOD and LOQ determinations is intrinsically linked to the signal-to-noise ratio (S/N), a key metric that reflects the ability of an analytical system to distinguish analyte response from background interference. For carbonyl compound analysis—particularly in complex matrices such as thermally stressed soybean oil or occupational air samples—optimizing this ratio is paramount for generating reliable data that meets rigorous regulatory standards.
The strategic importance of signal-to-noise optimization extends beyond mere regulatory compliance. In pharmaceutical development and environmental monitoring, the accurate quantification of low-abundance carbonyl compounds like formaldehyde and acetaldehyde (classified by IARC as Group 1 and Group 2B carcinogens, respectively) directly impacts risk assessment and safety protocols [13]. This guide systematically compares approaches for enhancing S/N ratio in UFLC-DAD systems, providing researchers with experimentally-validated methodologies to achieve superior detection capabilities for carbonyl compound analysis.
Theoretical Foundations of LOD and LOQ
Defining Detection and Quantification Limits
According to established clinical and laboratory standards, LOD, LOQ, and Limit of Blank (LoB) represent distinct concentration thresholds with specific statistical definitions. The LoB represents the highest apparent analyte concentration expected to be found when replicates of a blank sample containing no analyte are tested. Statistically, it is defined as LoB = meanblank + 1.645(SDblank), assuming a Gaussian distribution where the LoB represents 95% of observed blank values [60]. The LOD is defined as the lowest analyte concentration likely to be reliably distinguished from the LoB, calculated as LOD = LoB + 1.645(SDlow concentration sample) [60]. This formulation ensures that 95% of low concentration samples will produce signals exceeding the LoB, thereby minimizing false negatives. The LOQ represents the lowest concentration at which the analyte can be reliably quantified with predefined levels of bias and imprecision, and it is always greater than or equal to the LOD [60].
Table 1: Statistical Definitions of Key Detection Parameters
| Parameter | Statistical Definition | Sample Requirements | Purpose |
|---|---|---|---|
| Limit of Blank (LoB) | LoB = meanblank + 1.645(SDblank) | 60 replicates for establishment; 20 for verification | Defines the threshold for false positives |
| Limit of Detection (LOD) | LOD = LoB + 1.645(SDlow concentration sample) | 60 replicates for establishment; 20 for verification | Lowest concentration reliably distinguished from blank |
| Limit of Quantification (LOQ) | LOQ ≥ LOD, meeting predefined bias/imprecision goals | Sufficient replicates to demonstrate precision | Lowest concentration quantified with acceptable accuracy and precision |
The Critical Role of Signal-to-Noise Ratio
Signal-to-noise ratio serves as a fundamental performance metric in chromatographic detection systems, directly influencing the reliability of LOD and LOQ determinations. The relationship between S/N and detection limits is mathematically straightforward: as S/N increases, both LOD and LOQ decrease, enabling the detection and quantification of analytes at lower concentrations. This relationship is particularly crucial when analyzing toxic carbonyl compounds like 4-hydroxy-2-nonenal and 2,4-decadienal in heated soybean oil, where detection limits at the μg·g⁻¹ level are required for accurate safety assessment [16]. For complex samples, the blank matrix plays a critical role in establishing meaningful noise measurements, as the nature of the sample matrix may restrict the possibility of generating a proper blank, potentially dramatically affecting LOD/LOQ estimation [61].
DAD Instrument Parameters and Their Impact on S/N Ratio
Strategic Optimization of DAD Settings
The Diode Array Detector (DAD) offers multiple adjustable parameters that directly influence signal-to-noise characteristics. Understanding the interplay between these parameters is essential for method development that maximizes detection sensitivity. The data acquisition rate determines the number of data points collected per second, expressed in Hertz. Higher acquisition rates (e.g., 80 Hz) yield more data points, increased peak resolution, and sharper peak shapes but increase background noise and data file sizes [62]. Conversely, lower acquisition rates (e.g., 0.31-5 Hz) provide significant noise reduction through increased filtering but may compromise peak shape definition for rapidly eluting compounds [62].
Bandwidth represents the range of wavelengths detected on either side of the target wavelength. For example, a bandwidth setting of 4 nm on a 250 nm wavelength setting will detect wavelengths 248, 249, 250, 251, and 252 nm and average the results [62]. Narrow bandwidth increases selectivity by focusing on a unique wavelength for the target analyte, while larger bandwidths average signals across a broader spectral range, potentially reducing noise but compromising selectivity. The optimal bandwidth is determined as the range of wavelength at 50% of the spectral feature being used for determination [62].
Wavelength selection significantly impacts sensitivity according to the extinction coefficient of the target analyte, which varies with wavelength as described by Lambert-Beer's law [62]. The chosen wavelength should correspond to where the compound absorbs most strongly, though when analyzing multiple compounds with different absorbance maxima, a compromise wavelength with reasonable absorption for all components may be necessary [62]. Reference wavelengths compensate for fluctuations in lamp intensity and background absorbance changes during gradient elution, with the isoabsorbance plot feature recommended for optimal reference wavelength selection [62].
Table 2: Impact of DAD Parameters on Signal-to-Noise Performance
| Parameter | Effect on Signal | Effect on Noise | Overall S/N Impact | Recommended Setting for Carbonyl Compounds |
|---|---|---|---|---|
| Data Acquisition Rate | Higher rates improve peak shape definition | Higher rates increase electronic noise | Variable; optimal balance needed | 5-20 Hz for most carbonyl separations |
| Bandwidth | Narrow bandwidth increases selectivity | Wider bandwidth may average out noise | Narrow for clean matrices; wide for complex | 4-10 nm depending on spectral specificity needed |
| Wavelength Selection | Maximum absorbance wavelength maximizes signal | Matrix interference varies by wavelength | Highest at λmax away from matrix interference | Compound-specific (e.g., 360-380 nm for DNPH derivatives) |
| Reference Wavelength | No direct effect | Compensates for lamp fluctuations and background | Improves by stabilizing baseline | 50-100 nm above detection wavelength |
| Step Setting | Smoother spectral curves with smaller steps | Minimal direct effect | Minor improvement with smaller steps | 1 nm for spectral libraries; 2-4 nm for quantification |
Comparative Detector Performance for Carbonyl Analysis
When evaluating detection systems for carbonyl compound analysis, the choice between DAD and mass spectrometry (MS) detection involves important trade-offs. A 2022 study comparing LC-DAD and LC-MS/MS for determining 12 carbonyl compounds in workplace air samples found that while both techniques showed acceptable linearity (0.996 < R² < 0.999) and repeatability, the MS/MS method demonstrated significantly superior sensitivity, enabling correct quantification of 98% of samples compared to only 32% with DAD [13]. This performance advantage comes with increased cost and operational complexity, positioning DAD as a cost-effective alternative for applications where the required sensitivity can be achieved through careful optimization.
For the analysis of carbonyl compounds in soybean oil during continuous heating, a validated UFLC-DAD-ESI-MS method achieved LODs ranging from 0.03 to 0.1 μg·mL⁻¹ for various carbonyl compounds including 4-hydroxy-2-nonenal, 2,4-decadienal, and acrolein [16]. This demonstrates that with appropriate method optimization, DAD-based methods can achieve sensitivity adequate for challenging analytical applications in food chemistry and pharmaceutical development.
Experimental Protocols for S/N Optimization
Systematic Method Development Workflow
A structured approach to method development ensures comprehensive optimization of signal-to-noise characteristics. The following workflow, adapted from contemporary method validation practices, provides a systematic pathway for enhancing LOD and LOQ performance:
Initial Noise Assessment: Characterize baseline noise across the chromatographic run using blank matrix injections, identifying regions of elevated noise that may coincide with analyte elution times [61].
Wavelength Selection: Identify maximum absorbance wavelengths for each target carbonyl compound using spectral scanning mode. For DNPH-derivatized carbonyls, this typically falls in the 360-380 nm range [13].
Bandwidth Optimization: Determine the optimal bandwidth by evaluating signal-to-noise ratio at different settings (2, 4, 8, 16 nm) using mid-level calibration standards [62].
Data Acquisition Optimization: Balance resolution requirements against noise by testing acquisition rates from 0.5-20 Hz, selecting the lowest rate that maintains acceptable peak definition [62].
Mobile Phase Optimization: Modify mobile phase composition to improve separation and reduce co-elution interferences. For carbonyl hydrazones, acetonitrile-water gradients with ammonium formate or acetate buffers are commonly employed [13] [37].
Reference Wavelength Selection: Identify optimal reference wavelengths that minimize baseline shifts during gradient elution while maintaining stable detection of target analytes [62].
The entire optimization process is captured in the following workflow diagram:
Sample Preparation and Derivatization Techniques
For carbonyl compound analysis, effective sample preparation is crucial for achieving optimal signal-to-noise ratios. The combination of efficient extraction and selective derivatization significantly reduces matrix interference, thereby improving noise characteristics. For soybean oil analysis, optimal extraction of carbonyl compounds was achieved using 1.5 mL of acetonitrile as the extraction solvent with manual stirring for 3 minutes followed by 30 minutes of sonication [16]. This protocol yielded average recoveries of 70.7% to 85.0% at the lowest concentration level, demonstrating effective isolation of target analytes from the complex oil matrix.
For airborne carbonyl compounds, sampling using DNPH-coated cartridges derivatizes carbonyl compounds to form stable hydrazone derivatives, simultaneously extracting and derivatizing the analytes while removing ozone interference through a dual-bed design incorporating 1,2-bis(2-pyridyl) ethylene (BPE) [13]. Proper control of sampling flow rates (typically 0.14 L·min⁻¹) and duration ensures that collected carbonyl compounds consume no more than 30% of the DNPH coated on the cartridges, maintaining linear response and preventing breakthrough [13].
Research Reagent Solutions for Carbonyl Compound Analysis
The following reagents and materials represent essential components for successful UFLC-DAD analysis of carbonyl compounds, with each playing a specific role in optimizing method performance and detection sensitivity:
Table 3: Essential Research Reagents for Carbonyl Compound Analysis
| Reagent/Material | Function | Performance Benefit | Application Example |
|---|---|---|---|
| DNPH-Coated Cartridges | Derivatization and collection of airborne carbonyls | Selective derivatization improves specificity and reduces matrix interference | Workplace air monitoring [13] |
| Acetonitrile (LC-MS Grade) | Extraction solvent and mobile phase component | High purity reduces background noise and ghost peaks | Extraction of carbonyls from soybean oil [16] |
| Ammonium Formate/Acetate | Mobile phase buffer | Improves peak shape and ionization efficiency | LC-ESI-MS analysis of carbonyl-DNPH derivatives [13] |
| Carbonyl-DNPH Standard Mixtures | Method calibration and validation | Provides reference retention times and spectra | Identification of 12 common carbonyl compounds [13] |
| Dual-Bed Sampling Cartridges | Ozone scrubbing during air sampling | Prevents ozone interference with DNPH derivatives | Accurate workplace air monitoring [13] |
| PTFE Syringe Filters | Sample cleanup before injection | Removes particulate matter that causes baseline noise | Sample preparation for UFLC-DAD analysis [13] |
Comparative Method Performance Data
Quantitative Performance Metrics
Direct comparison of optimized methods demonstrates the achievable performance for carbonyl compound analysis. The following table summarizes key validation parameters from representative studies employing different detection approaches:
Table 4: Comparative Method Performance for Carbonyl Compound Analysis
| Method Detail | Linear Range | LOD Values | LOQ Values | Recovery (%) | Application Context |
|---|---|---|---|---|---|
| UFLC-DAD-ESI-MS [16] | 0.2-10.0 μg·mL⁻¹ | 0.03-0.1 μg·mL⁻¹ | 0.2 μg·mL⁻¹ | 70.7-85.0 | Soybean oil during heating |
| LC-DAD [13] | Not specified | Higher than MS/MS | Higher than MS/MS | Not specified | Workplace air monitoring (32% samples quantifiable) |
| LC-MS/MS [13] | Not specified | Lower than DAD | Lower than DAD | Not specified | Workplace air monitoring (98% samples quantifiable) |
| Transportable HPLC-UV [37] | Developed for 13 carbonyls | Not specified | Not specified | Not specified | Rapid analysis of carbonyl hydrazones |
Analytical Applications and Outcomes
The practical application of optimized UFLC-DAD methods reveals their capability to address complex analytical challenges. In the analysis of thermally stressed soybean oil, the identified carbonyl compounds included 4-hydroxy-2-nonenal, 2,4-decadienal, 2,4-heptadienal, 4-hydroxy-2-hexenal, acrolein, and several other aldehydes, with 4-hydroxy-2-nonenal, 2,4-decadienal, and 2,4-heptadienal presenting the highest mean concentrations after heating (36.9, 34.8, and 22.6 μg·g⁻¹ of oil, respectively) [16]. This comprehensive profiling demonstrates the method's effectiveness for complex real-world samples.
In occupational settings, optimized methods revealed formaldehyde as the most abundant carbonyl congener (concentrations between 2.7 and 77 μg·m⁻³), followed by acetaldehyde (concentrations between 1.5 and 79 μg·m⁻³) and butyraldehyde (concentrations between 0.4 and 13 μg·m⁻³) across various workplaces [13]. Notably, in beauty salon environments, acetaldehyde was the most abundant congener (concentrations between 19 and 79 μg·m⁻³), highlighting the importance of source-specific assessment and the value of sensitive analytical methods for accurate exposure characterization [13].
The accurate determination of LOD and LOQ in UFLC-DAD methods for carbonyl compounds depends fundamentally on strategic optimization of the signal-to-noise ratio. Through systematic adjustment of DAD parameters—including data acquisition rate, bandwidth, wavelength selection, and reference wavelength—coupled with robust sample preparation techniques, researchers can achieve detection capabilities approaching those of more costly MS-based systems for many applications. The experimental protocols and comparative data presented herein provide a validated framework for method development aligned with ICH validation requirements, enabling pharmaceutical and analytical professionals to implement reliable, sensitive quantification methods for carbonyl compounds across diverse matrices. As regulatory requirements continue to emphasize lower detection limits for potentially toxic compounds, these S/N optimization strategies will grow increasingly essential for generating data that meets the exacting standards of modern analytical science.
Robustness testing is a critical element of analytical method validation, demonstrating that a method remains unaffected by small, deliberate variations in its operational parameters. For Ultra-Fast Liquid Chromatography with Diode Array Detection (UFLC-DAD) methods, particularly those developed for carbonyl compounds, establishing robustness ensures reliability during transfer between laboratories, instruments, and analysts. The International Council for Harmonisation (ICH) guideline Q2(R1) defines robustness as "a measure of its capacity to remain unaffected by small, but deliberate variations in method parameters" [63]. This evaluation provides an experimental window within which method parameters can be adjusted without impacting the analytical results, thereby defining the method's operational tolerance.
The analysis of carbonyl compounds presents specific challenges that make robustness testing particularly vital. Carbonyl compounds, including aldehydes and ketones, are often reactive, volatile, and present at trace levels in complex matrices such as atmospheric particles, e-cigarette aerosols, and biological samples [64] [65]. Their analysis frequently requires derivatization (e.g., with 2,4-dinitrophenylhydrazine or DNPH) to form stable hydrazones for chromatographic separation and detection [18] [64]. Any slight variation in the chromatographic conditions can significantly impact the separation efficiency, detection sensitivity, and accuracy of quantification for these derivatives. This guide systematically examines the effects of varying three critical chromatographic parameters—flow rate, temperature, and mobile phase pH—providing a structured comparison of their influence on method performance and offering validated protocols for their assessment within the framework of ICH validation for carbonyl compound analysis.
Experimental Protocols for Robustness Evaluation
Chemometric Approach to Experimental Design
A robust experimental design is fundamental for efficiently evaluating the impact of multiple parameters. A full factorial design is highly recommended, as it allows for the investigation of all possible combinations of the chosen factor levels and can identify interaction effects between parameters that might be missed in one-factor-at-a-time (OFAT) experiments [63]. For a standard robustness test evaluating flow rate, temperature, and mobile phase pH, a 3³-full factorial design (three factors, each at three levels) is ideal. This design involves 27 experimental runs, which may seem extensive but provides comprehensive data on both main and interaction effects.
Procedure:
- Define Factors and Levels: Select a central point (nominal value) for each parameter based on the optimized method conditions. Then, choose a high (+) and low (-) level for each factor, representing small, deliberate variations. For a UFLC method, typical variations might be:
- Flow Rate: Nominal ± 0.05 mL/min
- Column Temperature: Nominal ± 2 °C
- Mobile Phase pH: Nominal ± 0.1 units
- Generate Design Matrix: Create a table listing all 27 unique combinations of these factor levels.
- Randomize and Execute: Randomize the order of the 27 experimental runs to minimize the effect of uncontrolled variables.
- Analyze Responses: For each chromatographic run, record key performance metrics such as retention time (tᵣ), peak area, theoretical plates (N), resolution (Rₛ), and tailing factor (Tᶠ) for each carbonyl compound of interest.
- Statistical Analysis: Use statistical software to perform analysis of variance (ANOVA) to determine which factors and interactions have a statistically significant effect on the responses. The goal is to identify parameters that require tight control and those that offer some operational flexibility.
System Suitability and Quantitative Analysis
Throughout the robustness testing, system suitability criteria must be met to ensure the chromatographic system is functioning correctly. The quantitative analysis of carbonyl compounds often involves derivatization. The following protocol, adapted from methods for analyzing carbonyl-DNPH derivatives, can be applied [18] [64].
Procedure:
- Derivatization: React the carbonyl compounds in the sample with a solution of 2,4-dinitrophenylhydrazine (DNPH) to form stable hydrazone derivatives. This is typically done in an acidic medium to drive the reaction to completion.
- Chromatographic Separation:
- Column: Use a reversed-phase column, such as a C18 or a specialized phase like the XSelect HSS T3 (2.1 x 100 mm, 2.5 µm) [66].
- Mobile Phase: A binary gradient consisting of water (or an aqueous buffer) and acetonitrile is standard for separating carbonyl-DNPH derivatives [18] [65].
- Detection: Employ a DAD detector, typically monitoring at a wavelength of 360 nm, which is a common maximum absorbance for DNPH derivatives [18].
- Temperature: Control the column temperature, often between 30-40°C [63] [66].
- Data Analysis: Integrate the peaks for each carbonyl-DNPH derivative. Construct a calibration curve using standard solutions of known concentration and use it to quantify the carbonyl compounds in unknown samples.
Comparative Data Analysis of Parameter Variations
The following tables synthesize experimental data from robustness studies, illustrating the typical effects of varying critical method parameters on the performance of a UFLC-DAD method for carbonyl compounds.
Table 1: Impact of Parameter Variations on Chromatographic Performance Metrics
| Parameter & Variation | Retention Time (tᵣ) RSD (%) | Peak Area RSD (%) | Theoretical Plates (N) | Resolution (Rₛ) | Tailing Factor (Tᶠ) |
|---|---|---|---|---|---|
| Flow Rate (mL/min) [63] [66] | |||||
| ↓ Low (e.g., -0.05 mL/min) | Increase (> 2%) | < 1.5% | Slight Increase | Increase | Minimal Change |
| → Nominal (Optimal) | Minimal (< 1%) | < 1% | Optimal | Target Value | Optimal (~1.2) |
| ↑ High (e.g., +0.05 mL/min) | Decrease (> 2%) | < 1.5% | Slight Decrease | Decrease | Minimal Change |
| Column Temperature (°C) [63] | |||||
| ↓ Low (e.g., -2 °C) | Increase | < 2.0% | Increase | Increase | Minimal Change |
| → Nominal (Optimal) | Minimal | < 1% | Optimal | Target Value | Optimal |
| ↑ High (e.g., +2 °C) | Decrease | < 2.0% | Decrease | Decrease | Minimal Change |
| Mobile Phase pH [63] | |||||
| ↓ Low (e.g., -0.1 units) | Significant Change Possible | < 2.5% | Can decrease significantly | Can decrease significantly | Can increase significantly |
| → Nominal (Optimal) | Minimal | < 1% | Optimal | Target Value | Optimal |
| ↑ High (e.g., +0.1 units) | Significant Change Possible | < 2.5% | Can decrease significantly | Can decrease significantly | Can increase significantly |
Table 2: Effect of Parameter Variations on Validation Parameters for Carbonyl Compounds
| Parameter & Variation | Limit of Detection (LOD) | Accuracy (% Recovery) | Precision (RSD, n=6) | Run Time | AGREE Score [67] |
|---|---|---|---|---|---|
| Flow Rate Variations | Negligible Impact | 98.5 - 101.0% | Intra-day: < 1.5% | Increases at lower flow | Minimal Impact |
| Temperature Variations | Negligible Impact | 98.0 - 101.5% | Intra-day: < 2.0% | Increases at lower temp | Minimal Impact |
| Mobile Phase pH Variations | Can increase if peak shape degrades | 95.0 - 104.0% | Intra-day: Can be > 2.5% | Can change | Minimal Impact |
| Optimal Conditions (Nominal) | Lowest (e.g., 0.12-0.38 mg/L [18]) | 99.0 - 101.0% | Intra-day: < 1.0% [67] | Shortest (e.g., <20 min [18]) | Highest (e.g., 0.77 [67]) |
The Scientist's Toolkit: Essential Research Reagents and Materials
Table 3: Key Reagents and Materials for UFLC-DAD Analysis of Carbonyl Compounds
| Item | Function / Description | Application Note |
|---|---|---|
| 2,4-Dinitrophenylhydrazine (DNPH) | Derivatizing agent that reacts with carbonyl groups (aldehydes/ketones) to form stable, chromophoric hydrazones detectable by DAD. | Essential for analyzing atmospheric, vaping, or food-borne carbonyls. Use acidified DNPH solution [18] [64] [65]. |
| Carbonyl-DNPH Standard Mixtures | Certified reference materials of common carbonyl-DNPH derivatives (e.g., formaldehyde, acetaldehyde, acrolein). | Used for method development, calibration, and identification of peaks in chromatograms [64]. |
| Ultra-Pure Water & Acetonitrile (HPLC Grade) | The primary components of the mobile phase in reversed-phase UFLC. | Low UV absorbance grade is crucial for sensitive DAD detection. Buffers like phosphate can be used to control pH [63]. |
| Reversed-Phase U/HPLC Column | The stationary phase for separation. C18 columns are standard; specialized phases (e.g., HSS T3) offer alternative selectivity. | A 2.1 x 100 mm, sub-2 µm or 2.5 µm particle size column balances speed and resolution [66]. |
| pH Buffer Solutions | Used to prepare and adjust the aqueous portion of the mobile phase to a precise, stable pH. | Critical for the separation of ionizable compounds. Common buffers are phosphate or formate/acetate (volatile for LC-MS) [63]. |
Workflow and Pathway Visualization
The following diagram illustrates the logical workflow for designing, executing, and interpreting a robustness study for a UFLC-DAD method, integrating the core concepts discussed in this guide.
Robustness Testing Workflow
This comparison guide demonstrates that the three evaluated parameters exert distinct influences on UFLC-DAD method performance for carbonyl compounds. Flow rate and temperature primarily affect retention times and analysis speed but have minimal impact on quantitative accuracy within the tested ranges, making them moderate-risk parameters. In contrast, mobile phase pH emerges as a high-risk parameter, capable of inducing significant shifts in selectivity, peak shape, and resolution for ionizable analytes, thereby directly threatening method accuracy and reliability.
Based on the synthesized data, the following operational ranges are recommended to ensure method robustness for the analysis of carbonyl-DNPH derivatives:
- Flow Rate: Maintain within ±0.03 mL/min of the nominal value to control retention time shifts.
- Column Temperature: Control within ±1.5 °C of the set point to ensure consistent analysis times and peak efficiency.
- Mobile Phase pH: This parameter requires the tightest control; a variation not exceeding ±0.05 pH units from the nominal value is crucial to prevent detrimental effects on chromatographic separation.
Robustness testing is not merely a regulatory checkbox but a fundamental practice for ensuring the ruggedness and transferability of UFLC-DAD methods. By systematically evaluating critical parameters through a chemometric design, researchers can establish a clear, scientifically defended Operable Method Range (OMR). This provides confidence in the method's performance during routine use and facilitates its successful transfer to other laboratories and instruments, which is indispensable in regulated environments like pharmaceutical development and environmental monitoring [63] [65].
In the pharmaceutical sciences, the reliability of any analytical method hinges on the consistent performance of the instrument system. System suitability testing (SST) serves as a fundamental quality control measure, providing assurance that the chromatographic system is capable of reproducing results with the required precision, accuracy, and sensitivity for their intended purpose. This article establishes daily performance benchmarks for system suitability within the context of validating an Ultra-Fast Liquid Chromatography with Diode Array Detection (UFLC-DAD) method for quantifying carbonyl compounds (CCs). The validation is structured according to the International Council for Harmonisation (ICH) Q1 guideline, which provides a harmonized, science-based framework for stability testing of drug substances and products [51] [52] [68]. The recent consolidation of previous ICH quality guidelines into a new draft Q1 guideline emphasizes a risk-based approach and lifecycle management for analytical procedures, reinforcing the critical role of system suitability in maintaining data integrity from method development through routine use [68].
ICH Q1 and Analytical Method Validation
The ICH Q1 guideline, recently revised and currently in draft form for public consultation until August 2025, outlines stability data requirements for drug substances and products [51] [69]. While it primarily ensures that medicines remain safe and effective throughout their shelf life, its principles are foundational to analytical method validation [52] [68]. The updated guideline acts as a "one-stop shop," consolidating previous documents (Q1A-F and Q5C) and advocating for a modernized Quality by Design (QbD) paradigm [68]. This approach reframes stability testing not as a regulatory formality but as a science-driven quality assurance mechanism, where the selection of stability-indicating critical quality attributes (CQAs) is based on risk assessment [68]. For an analytical method, system suitability parameters are among these CQAs, ensuring that the system is capable of detecting changes in the product's quality over time.
Core Principles for System Suitability
- Science and Risk-Based Approach: The revised ICH Q1 encourages manufacturers to design leaner, more focused stability protocols based on scientific justification [68]. This principle extends to SST, where benchmarks should be established based on a method's specific requirements and risks, rather than applying generic criteria.
- Lifecycle Management: Stability testing is treated as a continuous responsibility throughout the product's lifecycle [68]. Similarly, system suitability is not a one-time check but a daily requirement to ensure ongoing system performance, especially after any maintenance or component changes.
- Analytical Procedure Validation: The guideline underscores the importance of robust, stability-indicating analytical methods, aligning with ICH Q14 on Analytical Procedure Development [68]. System suitability confirms that the validated performance of the method is maintained each day it is used.
Establishing System Suitability Benchmarks for UFLC-DAD of Carbonyl Compounds
When developing a UFLC-DAD method for carbonyl compounds—such as those derived from the thermal oxidation of soybean oil—specific SST parameters must be monitored daily to guarantee data quality [16]. The following criteria, derived from general chromatographic practice and supported by experimental data from CCs analysis, form the core benchmarks.
Table 1: Core System Suitability Parameters and Benchmarks for UFLC-DAD Analysis of Carbonyl Compounds
| Parameter | Recommended Benchmark | Experimental Justification from CCs Analysis |
|---|---|---|
| Retention Time Precision | RSD ≤ 1% for replicate injections | Critical for identifying specific CCs like 4-hydroxy-2-nonenal and 2,4-decadienal [16]. |
| Peak Area Precision | RSD ≤ 2% for replicate injections | Essential for precise quantification; methods for CCs report RSDs for repeatability below 10% [14]. |
| Theoretical Plates (N) | > 2000 per column | Indicates column efficiency; methods for 12 CCs use specialized C18 columns to achieve sufficient resolution [14]. |
| Tailing Factor (T) | T ≤ 2.0 | Ensures symmetric peaks for accurate integration, a cornerstone of reliable quantification [16] [14]. |
| Resolution (Rs) | Rs > 1.5 between critical pair | Necessary to separate structurally similar CCs like 2,4-heptadienal and 4-hydroxy-2-hexenal [16]. |
| Signal-to-Noise Ratio | S/N > 10 for LOD concentration | Supports method sensitivity; LOD for CCs can be as low as 0.03 μg/mL [16]. |
Experimental Protocol for Verifying System Suitability
A typical protocol for establishing these benchmarks involves the preparation and analysis of a standard test mixture.
- Materials: A standard solution containing target carbonyl compounds (e.g., formaldehyde, acetaldehyde, 4-hydroxy-2-nonenal) or a suitable system suitability standard. The method from the literature uses a standard solution of 12 Carbonyl-DNPH Derivatives [14].
- Chromatographic Conditions:
- Column: Acclaim Carbonyl C18 RSLC (150 x 3.0 mm, 3 µm) or equivalent [14].
- Mobile Phase: Gradient elution with water/acetonitrile or water with buffers like ammonium formate and acetonitrile [16] [14].
- Flow Rate: 0.4 - 0.5 mL/min.
- Detection: DAD, typically set at 360 nm for carbonyl-DNPH derivatives [14].
- Injection Volume: 5-10 µL.
- Procedure: The standard solution is injected in replicate (typically n=5 or 6). The resulting chromatograms are used to calculate the system suitability parameters listed in Table 1. The system is deemed suitable for analysis only if all parameters fall within the pre-defined benchmarks.
Comparative Performance: UFLC-DAD vs. LC-MS/MS for Carbonyl Compounds
While UFLC-DAD is a robust and accessible technique, comparing its performance with the more sensitive Liquid Chromatography-Tandem Mass Spectrometry (LC-MS/MS) provides context for its capabilities and limitations in quantifying carbonyl compounds.
Table 2: Quantitative Performance Comparison of UFLC-DAD and LC-MS/MS for Carbonyl Compound Analysis
| Performance Metric | UFLC-DAD | LC-MS/MS | Experimental Context |
|---|---|---|---|
| Linearity (R²) | 0.996 – 0.999 [14] | 0.996 – 0.999 [14] | Both techniques demonstrate excellent linearity for a range of 12 CCs. |
| Intra-day Precision (RSD%) | 0.7 – 10 [14] | 0.7 – 10 [14] | Both methods show acceptable and comparable repeatability. |
| Inter-day Precision (RSD%) | 5 – 16 [14] | 5 – 16 [14] | Performance is comparable over time for both detection systems. |
| Sensitivity (Success in Quantification) | 32% of samples [14] | 98% of samples [14] | MS/MS's superior sensitivity allows it to quantify a much higher proportion of real-world samples. |
| Limit of Detection (LOD) | e.g., 0.03 μg/mL for specific CCs [16] | Significantly lower | The high sensitivity of MS/MS is its primary advantage for trace analysis. |
The data reveals that while both techniques offer excellent precision and linearity, LC-MS/MS holds a decisive advantage in sensitivity [14]. This makes LC-MS/MS the preferred method for quantifying CCs in complex matrices or at very low concentrations. However, for many routine quality control applications where target analytes are present at sufficiently high levels, UFLC-DAD remains a cost-effective and reliable workhorse.
Workflow and Implementation
The following diagram illustrates the logical workflow for integrating system suitability testing into the daily operation of a UFLC-DAD system, grounded in ICH Q1 principles.
Diagram 1: Daily System Suitability Workflow. This chart outlines the decision-making process for verifying system performance before sample analysis.
The Scientist's Toolkit: Essential Research Reagent Solutions
The following table details key reagents and materials essential for conducting UFLC-DAD analysis of carbonyl compounds, as derived from the cited experimental protocols.
Table 3: Essential Reagents and Materials for Carbonyl Compound Analysis via UFLC-DAD
| Item | Function / Purpose | Example from Literature |
|---|---|---|
| Carbonyl-DNPH Standard Mix | Certified reference material for calibration, qualification, and system suitability testing. | A standard solution of 12 Carbonyl-DNPH Derivatives is used for method development and calibration [14]. |
| DNPH-Coated Sampling Cartridges | For derivatizing volatile carbonyl compounds into stable hydrazone derivatives for analysis. | Dual-bed cartridges with DNPH and BPE are used for airborne CCs sampling and derivatization [14]. |
| UFLC/DAD System | The core instrumentation for separating and detecting derivatized carbonyl compounds. | An HPLC system with a DAD detector is used, with detection at 360 nm [16] [14]. |
| Specialized C18 Column | Chromatographic column optimized for resolving complex mixtures of carbonyl-DNPH derivatives. | An Acclaim Carbonyl C18 RSLC column is specifically used for this application [14]. |
| LC-MS Grade Solvents | High-purity solvents for mobile phase preparation to minimize baseline noise and contamination. | LC-MS grade water and acetonitrile are specified in the methodology [14]. |
Establishing and adhering to rigorous daily system suitability benchmarks is a non-negotiable practice in a GMP-compliant laboratory. For the UFLC-DAD analysis of carbonyl compounds, this involves monitoring critical parameters such as retention time and peak area precision, theoretical plates, tailing factor, and resolution against pre-defined, scientifically justified limits. The recent ICH Q1 revision reinforces this practice through its emphasis on risk-based science and lifecycle management [68]. While the superior sensitivity of LC-MS/MS makes it ideal for trace analysis, UFLC-DAD remains a highly precise and reliable technique for quantifying carbonyl compounds, provided that its performance is vigilantly confirmed through systematic suitability testing before every analytical run.
Validation Protocol and Comparative Assessment: Meeting ICH Criteria and Evaluating MS Alternatives
Designing a Comprehensive Validation Protocol for Carbonyl Compound Quantification
The accurate quantification of carbonyl compounds (CCs) is critical in pharmaceutical development and food chemistry due to the role of these compounds in product degradation and their associated health risks. Several carbonyls, such as acrolein and 4-hydroxy-2-nonenal (HNE), exhibit significant toxicity, including DNA damage and carcinogenic potential [27]. The International Council for Harmonisation (ICH) Q2(R2) guideline provides the foundational framework for validating analytical procedures, ensuring that the methods employed are suitable for their intended use, whether for drug substance release, stability testing, or impurity profiling [5] [8]. This guide objectively compares a Ultra-Fast Liquid Chromatography with Diode Array Detection (UFLC-DAD) method for CCs against the more sophisticated UFLC-DAD-ESI-MS (Electrospray Ionization Mass Spectrometry) alternative, framing the comparison within the rigorous context of ICH validation. The protocols and data presented are adapted from a published study on the determination of carbonyl compounds in soybean oil, providing a real-world experimental basis for this comparison [16] [27].
Core Principles of ICH Q2(R2) Validation
The ICH Q2(R2) guideline, effective from March 2024, outlines the scientific and regulatory expectations for validating analytical procedures [8]. It categorizes procedures based on their purpose—identification, testing for impurities, or assay/content—and defines the specific validation characteristics required for each. For the quantitative analysis of impurities like carbonyl compounds, the key validation attributes are specificity, accuracy, precision, detection limit (LOD), quantitation limit (LOQ), linearity, and range [5]. A comprehensive validation protocol must experimentally demonstrate that the method performs adequately for all these parameters. The ICH has further supported the implementation of these principles by releasing comprehensive training materials in July 2025, which illustrate both minimal and enhanced approaches to analytical validation [11]. The following workflow visualizes the core lifecycle of an analytical procedure, from development through validation and routine use, which is central to the ICH Q2(R2) and Q14 paradigms.
Method Comparison: UFLC-DAD vs. UFLC-DAD-ESI-MS
While both UFLC-DAD and UFLC-DAD-ESI-MS are capable of quantifying carbonyl compounds, their performance characteristics differ significantly, influencing the choice of method based on the application's requirements. The primary distinction lies in the detector: the DAD provides ultraviolet-visible spectral data, whereas the ESI-MS detector adds molecular mass and structural information. A recent study comparing LC-UV/DAD and LC-MS/MS for airborne carbonyls found that while both showed acceptable linearity and precision, the MS/MS method demonstrated superior sensitivity, allowing for the correct quantification of 98% of samples compared to only 32% with the UV/DAD method [14]. The following table summarizes the core performance characteristics of a validated UFLC-DAD-ESI-MS method for CCs in a heated oil matrix, which serves as our reference data set [16] [27].
Table 1: Validation Characteristics of a UFLC-DAD-ESI-MS Method for Carbonyl Compounds
| Validation Parameter | Experimental Results & Conditions |
|---|---|
| Analytical Technique | UFLC-DAD-ESI-MS with derivatization using 2,4-dinitrophenylhydrazine (DNPH) [27]. |
| Extraction Protocol | 1.5 mL acetonitrile, manual stirring for 3 min, 30 min sonication [16]. |
| Linearity Range | 0.2 to 10.0 μg mL⁻¹ for all carbonyl compounds [16]. |
| Accuracy (Recovery) | 70.7% to 85.0% at the lowest concentration level (0.2 μg mL⁻¹) [16]. |
| Precision | Data not explicitly stated in search results, but RSD is a standard precision metric. |
| Limit of Detection (LOD) | 0.03 to 0.1 μg mL⁻¹ [16]. |
| Limit of Quantification (LOQ) | 0.2 μg mL⁻¹ for all target compounds [16]. |
| Key Carbonyls Quantified | Acrolein, 4-hydroxy-2-nonenal (HNE), 2,4-decadienal, 2,4-heptadienal [16]. |
The enhanced specificity and sensitivity of the mass spectrometry-based method make it the preferred choice for complex matrices or when confirming the identity of unknown peaks is critical. The DAD-based method, while more accessible and cost-effective, may be sufficient for simpler matrices where target analytes are well-separated and present at higher concentrations. The following diagram illustrates the decision-making process for selecting the appropriate analytical technique based on the project's goals and constraints.
Detailed Experimental Protocols for Validation
Protocol for Specificity and Selectivity
Objective: To demonstrate that the method can unequivocally quantify the target analytes without interference from other components in the sample matrix.
- Procedure: Inject blank matrix (e.g., unheated oil), a standard solution of the target carbonyl-DNPH derivatives, and a spiked matrix sample.
- UFLC-DAD-ESI-MS Analysis: Chromatographic separation is typically performed on a C18 column (e.g., 150 x 3 mm, 3 µm) [14]. The mobile phase often consists of water and acetonitrile, possibly with modifiers like ammonium formate or acetic acid [14]. For MS detection, the electrospray ionization (ESI) source operating in negative mode is common for DNPH derivatives, using Multiple Reaction Monitoring (MRM) for highest specificity [14].
- DAD Analysis: The DAD detector is set to monitor at 360 nm, the characteristic absorbance wavelength for DNPH-hydrazones [27] [14].
- Acceptance Criterion: For MS detection, no significant interference in the MRM channels for the target analytes. For DAD, baseline resolution of analyte peaks from any matrix peaks.
Protocol for Linearity and Range
Objective: To establish that the analytical procedure produces results that are directly proportional to the concentration of the analyte over the specified range.
- Procedure: Prepare and analyze a minimum of five calibration standard solutions covering the range from LOQ to 120-150% of the expected sample concentration. The referenced method used a range of 0.2 to 10.0 μg mL⁻¹ for carbonyl-DNPH derivatives [16].
- Analysis: Inject each standard in duplicate and plot the peak area (or area ratio to internal standard) versus the nominal concentration.
- Calculation & Acceptance Criterion: Perform linear regression analysis. A correlation coefficient (R²) of 0.996 or greater is typically required, as demonstrated in comparable studies [14]. The y-intercept should not be significantly different from zero.
Protocol for Accuracy (Recovery)
Objective: To assess the closeness of the measured value to the true value, often determined through recovery experiments.
- Procedure: Spike the blank matrix with known quantities of the target carbonyl compounds at multiple concentration levels (e.g., LOQ, 50%, 100%, and 150% of the target concentration). Analyze a minimum of three replicates per level.
- Calculation & Acceptance Criterion: Calculate the percentage recovery as (Measured Concentration / Spiked Concentration) x 100. The referenced method achieved recoveries between 70.7% and 85.0% at the LOQ level, which is generally considered acceptable for trace analysis [16]. Recovery can be higher at greater concentrations.
Protocol for Precision
Objective: To evaluate the degree of scatter among a series of measurements from multiple samplings of the same homogeneous sample.
- Repeatability (Intra-day Precision): Analyze six independent preparations of a single sample at 100% of the test concentration on the same day by the same analyst. Calculate the relative standard deviation (RSD%) of the results. Acceptable RSD is typically < 5% for assay, but can be higher for impurities.
- Intermediate Precision (Inter-day Precision): Repeat the repeatability experiment on a different day, with a different analyst, and/or on a different instrument. The combined RSD from all results should meet pre-defined criteria.
Protocol for Limits of Detection (LOD) and Quantification (LOQ)
Objective: To determine the lowest amount of analyte that can be detected (LOD) and quantified (LOQ) with acceptable accuracy and precision.
- Procedure Based on Signal-to-Noise: Inject a series of dilute standards and compare the analyte signal to the background noise. An S/N ratio of 3:1 is generally accepted for LOD, and 10:1 for LOQ.
- Procedure Based on Standard Deviation: The referenced study established an LOD of 0.03-0.1 μg mL⁻¹ and an LOQ of 0.2 μg mL⁻¹ for all target carbonyls, likely determined from the standard deviation of the response and the slope of the calibration curve [16].
The Scientist's Toolkit: Essential Research Reagents and Materials
The successful implementation of a validated method for carbonyl compounds relies on a set of specific, high-quality materials. The following table details the key reagents and instrumentation used in the referenced UFLC-DAD-ESI-MS protocol [16] [27] [14].
Table 2: Essential Research Reagent Solutions and Materials for Carbonyl Compound Analysis
| Item Name | Function / Role in the Protocol | Specific Example / Specification |
|---|---|---|
| 2,4-Dinitrophenylhydrazine (DNPH) | Derivatization reagent that reacts with carbonyl compounds (aldehydes & ketones) to form stable, chromophoric hydrazones that are detectable by UV and MS [27]. | Purchased from Merck, Aldrich, or Supelco. Often used in coated silica cartridges for air sampling or directly in solution [27] [14]. |
| Acetonitrile (ACN) | Acts as the primary extraction solvent for carbonyl-DNPH derivatives from the oil matrix and is a key component of the LC mobile phase [16] [27]. | HPLC or LC-MS grade from suppliers like J.T. Baker or Carlo Erba [27] [14]. |
| Carbonyl-DNPH Standard Mixture | Used for calibration, method development, and validation. Provides known reference materials for retention time and spectral/mass confirmation. | A standard solution of 12 Carbonyl-DNPH Derivatives from suppliers like Agilent Technologies [14]. |
| C18 Reverse-Phase LC Column | The stationary phase for chromatographic separation of the individual carbonyl-DNPH derivatives. | e.g., Acclaim Carbonyl C18 RSLC (150 x 3 mm, 3 µm) or equivalent [14]. |
| Acetic Acid / Ammonium Formate | Mobile phase additives used to control pH and improve chromatographic peak shape and ionization efficiency in the MS source. | LC-MS grade, from Carlo Erba [14]. |
| UFLC-DAD-ESI-MS System | The core analytical instrument for separation (UFLC), detection (DAD), and definitive identification and sensitive quantification (ESI-MS). | The referenced study used an UFLC system coupled with a DAD and an ESI mass spectrometer [16] [27]. |
Data Integrity and the Analytical Procedure Lifecycle
Beyond technical performance, a modern validation protocol must be embedded within a robust data integrity framework. The ICH Q10 guideline emphasizes the need for a Pharmaceutical Quality System (PQS) where senior management bears overall responsibility for all data generated [70]. A comprehensive data integrity model includes multiple layers: a foundation of the right corporate culture, level 1 focusing on qualified instruments and validated software, level 2 on validated analytical procedures, and level 3 on generating the right reportable result [70]. This aligns with the Analytical Procedure Lifecycle Management (APLM) concept, which views method validation not as a one-time event, but as an ongoing process from development through routine use and eventual retirement [70]. This holistic approach ensures that the integrity of the data generated by a validated method is maintained throughout its operational life, providing lasting confidence in its results.
Setting and Justifying Acceptance Criteria for All Validation Parameters
The validation of analytical procedures is a critical requirement in pharmaceutical development and quality control, ensuring that analytical methods consistently produce reliable, accurate, and reproducible results. The International Council for Harmonisation (ICH) provides the definitive framework for this process through its Q2(R2) guideline, which outlines the core validation parameters and the considerations for setting appropriate acceptance criteria for each [8] [5]. This guide objectively compares the performance of a published Ultra-Fast Liquid Chromatography with Diode Array Detection (UFLC-DAD) method for quantifying carbonyl compounds in thermally oxidized soybean oil against the standards set by ICH Q2(R2) and other contemporary HPLC-DAD applications [16]. By providing detailed experimental protocols and comparative data, this article serves as a practical resource for researchers and drug development professionals establishing robust, compliant analytical methods.
The ICH Q2(R2) Framework and Key Validation Parameters
The ICH Q2(R2) guideline, officially endorsed in March 2024, provides a harmonized framework for the validation of analytical procedures used in the testing of chemical and biological drug substances and products [8] [5]. Its purpose is to establish a consistent approach for regulatory submissions across ICH member regions. The guideline defines a set of key validation parameters, for which appropriate acceptance criteria must be set and justified based on the intended purpose of the method.
The core parameters described in ICH Q2(R2) include:
- Specificity: The ability to assess the analyte unequivocally in the presence of components that may be expected to be present.
- Accuracy: The closeness of agreement between the value found and the value accepted as a true or reference value.
- Precision: The closeness of agreement between a series of measurements from multiple sampling of the same homogeneous sample. This includes repeatability, intermediate precision, and reproducibility.
- Detection Limit (LOD): The lowest amount of analyte in a sample that can be detected, but not necessarily quantitated.
- Quantitation Limit (LOQ): The lowest amount of analyte in a sample that can be quantitatively determined.
- Linearity: The ability of the method to obtain test results that are directly proportional to the concentration of the analyte.
- Range: The interval between the upper and lower concentrations of analyte for which it has been demonstrated that the method has suitable precision, accuracy, and linearity.
- Robustness: A measure of the method's capacity to remain unaffected by small, deliberate variations in method parameters.
Experimental Protocol: UFLC-DAD for Carbonyl Compounds in Soybean Oil
The following protocol summarizes the development and validation of a specific UFLC-DAD-ESI-MS method for analyzing carbonyl compounds (CCs), as detailed in the primary research [16].
Methodology and Workflow
The experimental process can be visualized as a sequential workflow:
Detailed Experimental Steps
- Sample Preparation: Soybean oil samples were heated continuously to 180°C to induce thermal oxidation and generate carbonyl compounds [16].
- Extraction Optimization: Key parameters were optimized to achieve maximal extraction efficiency. The established protocol used 1.5 mL of acetonitrile as the extraction solvent, with manual stirring for 3 minutes, followed by 30 minutes of sonication [16].
- Instrumental Analysis: Analysis was performed using an Ultra-Fast Liquid Chromatography (UFLC) system coupled to a Diode Array Detector (DAD) and an Electrospray Ionization Mass Spectrometer (ESI-MS). This combination provided both chromatographic separation with UV-Vis detection and mass confirmation for compound identification [16].
- Validation Procedure: The method was validated by spiking soybean oil samples with known concentrations of target carbonyl compounds. The spiked concentrations ranged from 0.2 to 10.0 μg·mL⁻¹. The results from the analysis of these samples were used to calculate the key validation parameters, including accuracy (as recovery %), LOD, LOQ, and linearity [16].
Performance Comparison: Acceptance Criteria vs. Experimental Outcomes
The acceptance criteria for an analytical method must be justified by its intended use. The following table compares the ICH Q2(R2) expectations for key validation parameters with the experimentally achieved performance of the UFLC-DAD method for carbonyl compounds and other relevant HPLC-DAD methods from the literature.
Table 1: Comparison of Acceptance Criteria and Experimental Performance for HPLC-DAD Methods
| Validation Parameter | Typical ICH Q2(R2) Expectation | UFLC-DAD for Carbonyl Compounds [16] | HPLC-DAD for Tea Polyphenols [71] | HPLC-DAD/FLD for B Vitamins [72] |
|---|---|---|---|---|
| Accuracy (Recovery %) | Close to 100% | 70.7% - 85.0% (at lowest spike level) | Classified as "High" | 100 ± 3% |
| Precision (RSD %) | RSD < 2% for repeatability | Data not fully specified | RSD < 4.68% | RSD < 3.23% |
| Linearity (R²) | R² > 0.998 | Implied by validation | R² > 0.9995 | R² > 0.999 |
| Detection Limit (LOD) | Based on signal-to-noise | 0.03 - 0.1 μg·mL⁻¹ | 0.03 - 1.68 μg·mL⁻¹ | Not specified for DAD |
| Quantitation Limit (LOQ) | Based on signal-to-noise, with precision and accuracy | 0.2 μg·mL⁻¹ for all compounds | Not specified | Not specified |
| Specificity | Able to discriminate analyte from interfering peaks | Confirmed by DAD-ESI-MS | Resolved co-elution of 12 analytes | Achieved separation of B1, B2, B6 |
Justification of Acceptance Criteria for the UFLC-DAD Method
The experimental data from the UFLC-DAD method demonstrates how acceptance criteria are met and justified for a real-world application:
- Accuracy and Precision: The reported recovery of 70.7% to 85.0% at the lowest spike level, while below the ideal 100%, was deemed acceptable for the complexity of the soybean oil matrix and the low concentration of the analytes [16]. This highlights that acceptance criteria for accuracy must be practical and matrix-dependent.
- Sensitivity: The method demonstrated high sensitivity with an LOQ of 0.2 μg·mL⁻¹ for all target carbonyl compounds. This low LOQ was crucial for reliably quantifying the trace-level degradation products formed during oil heating [16].
- Specificity: The use of DAD-ESI-MS was critical for achieving specificity. The DAD provided spectral confirmation, while the MS detector unequivocally identified compounds like 4-hydroxy-2-nonenal, 2,4-decadienal, and acrolein in a complex, interfering matrix [16].
- Linearity and Range: The method was validated over a range of 0.2 to 10.0 μg·mL⁻¹, which adequately covered the concentrations found in the actual heated oil samples (e.g., up to 36.9 μg·g⁻¹ for 4-hydroxy-2-nonenal) [16].
The Scientist's Toolkit: Essential Reagent Solutions
The following table details key reagents and materials used in the featured UFLC-DAD experiment, along with their critical functions in the analytical process.
Table 2: Key Research Reagent Solutions for UFLC-DAD Analysis of Carbonyl Compounds
| Item | Function in the Experiment |
|---|---|
| Acetonitrile (ACN) | Served as the extraction solvent for isolating carbonyl compounds from the oily matrix. Its polarity was optimized to recover the target analytes efficiently [16]. |
| Carbonyl Compound Standards | Pure reference standards (e.g., 4-hydroxy-2-nonenal, acrolein) were essential for method development, calibration, and peak identification in the sample runs [16]. |
| Soybean Oil | The representative sample matrix used to develop and validate the method, chosen for its relevance to food and lipid oxidation studies [16]. |
| Formic Acid | A common mobile-phase additive in LC-MS that improves chromatographic peak shape and enhances ionization efficiency in the ESI source [73] [74]. |
| UFLC-DAD-ESI-MS System | The core analytical platform. UFLC provides rapid separation, DAD offers spectral confirmation, and ESI-MS enables definitive compound identification [16]. |
Comparative Analysis with Other Techniques
The choice of detection system is a critical decision in analytical method development. The following diagram illustrates the decision-making process for selecting an appropriate detection strategy based on the analytical requirements, comparing the standard DAD with the more advanced Mass Spectrometry (MS) approach used in the featured study.
As the workflow shows, the featured UFLC-DAD-ESI-MS method [16] opted for a mass spectrometry detector to address its specific challenges: identifying multiple unknown carbonyl compounds in a complex matrix (soybean oil). In contrast, a standard DAD method is often sufficient for routine quality control of known compounds where cost is a factor, as seen in the analysis of tea polyphenols [71] and vitamin B complexes [72]. For the most complex matrices, such as herbal supplements and traditional medicine formulas (e.g., AnShenDingZhiLing), UHPLC-HRMS (High-Resolution Mass Spectrometry) combined with feature-based molecular networking becomes necessary to characterize hundreds of compounds [73] [74].
Setting and justifying acceptance criteria is a fundamental, purpose-driven activity in analytical method validation. The validation of the UFLC-DAD-ESI-MS method for carbonyl compounds provides a clear example of how ICH Q2(R2) principles are applied in practice. The method's acceptance criteria for accuracy, sensitivity, and specificity were rigorously tested and justified based on the challenges of the sample matrix and the analytical objectives. This case study, when compared against other HPLC-DAD applications, demonstrates that while core validation parameters remain constant, their specific acceptance limits must be tailored to the method's unique context. This ensures that the procedure is not only compliant with regulatory guidelines but also fit-for-purpose, providing reliable data to support scientific and quality decisions in drug development and beyond.
The validation of analytical methods is a cornerstone of pharmaceutical development, ensuring that analytical procedures yield reliable, accurate, and reproducible results for their intended purpose. For researchers quantifying carbonyl compounds—potentially toxic impurities in pharmaceuticals and food products—adherence to established guidelines like the International Council for Harmonisation (ICH) Q2(R2) is mandatory [5]. This guide objectively compares the performance of Ultra-Fast Liquid Chromatography with Diode Array Detection (UFLC-DAD) against alternative techniques for carbonyl compound analysis, presenting supporting experimental data within a structured validation framework.
Performance Comparison of Analytical Techniques
The choice of analytical technique significantly impacts the reliability of data for carbonyl compounds. The following sections compare UFLC-DAD with other common methods, focusing on validated performance parameters.
UFLC-DAD vs. Spectrophotometry
A comparative study of metoprolol tartrate (MET) analysis validated a UFLC-DAD method against a spectrophotometric method. The results, summarized in Table 1, highlight distinct performance characteristics [75].
Table 1: Performance Comparison of UFLC-DAD and Spectrophotometry for MET Analysis [75]
| Validation Parameter | UFLC-DAD Method | Spectrophotometric Method |
|---|---|---|
| Linear Range | Applicable to 50 mg & 100 mg tablets | Limited to 50 mg tablets due to concentration constraints |
| Specificity/Selectivity | High (Successful separation and quantification) | Lower (Potential for interference in complex matrices) |
| Accuracy (% Recovery) | Validated for both tablet strengths | 94.1% - 99.2% (for applicable samples) |
| Precision (RSD%) | Precise for both tablet strengths | Intra-day & Inter-day RSD ≤ 2.49% |
| Key Advantage | Superior selectivity and sensitivity; wider application range | Simplicity, low cost, and operational ease |
The UFLC-DAD method demonstrated clear advantages in selectivity and a broader application range, successfully validating two different dosage forms. Conversely, the spectrophotometric method, while precise and accurate for simpler applications, showed limitations in analyzing higher concentrations and complex mixtures, underscoring its potential lack of specificity [75].
LC-DAD vs. LC-MS/MS for Carbonyl Compounds in Air
A direct comparison of Liquid Chromatography (LC) coupled with a Diode Array Detector (DAD) versus tandem Mass Spectrometry (MS/MS) for determining 12 carbonyl compounds (CCs) in workplace air provided clear insights into sensitivity differences. Both methods showed acceptable linearity (R² > 0.996) and precision [14].
However, the higher sensitivity of the MS/MS system was decisive. The LC-MS/MS method correctly quantified 98% of the 52 environmental samples collected, compared to only 32% with the LC-DAD method. For major compounds like formaldehyde and acetaldehyde, concentrations measured by both techniques showed good agreement (0.1–30% deviation), but discrepancies were much larger for less abundant congeners where DAD detection limits were a constraint [14].
Experimental Validation Data for Carbonyl Compounds
UFLC-DAD-MS Method for Carbonyls in Soybean Oil
A specific UFLC-DAD-ESI-MS method was developed and validated for carbonyl compounds (CCs) in soybean oil during continuous heating. Key experimental protocols and validation data are summarized below [16].
Sample Preparation Protocol [16]:
- Extraction Solvent: 1.5 mL of acetonitrile.
- Extraction Process: Manual stirring for 3 minutes, followed by 30 minutes of sonication.
- Analysis: UFLC-DAD-ESI-MS analysis of the extracted samples.
Table 2: Validation and Application Data for Key Carbonyl Compounds in Heated Soybean Oil [16]
| Carbonyl Compound | Mean Concentration in Heated Oil (μg/g) | Accuracy (Recovery % at Low Spikes) | Limit of Detection (LOD, μg/mL) | Limit of Quantification (LOQ, μg/mL) |
|---|---|---|---|---|
| 4-Hydroxy-2-nonenal | 36.9 | 70.7% - 85.0% | 0.03 - 0.1 | 0.2 |
| 2,4-Decadienal | 34.8 | 70.7% - 85.0% | 0.03 - 0.1 | 0.2 |
| 2,4-Heptadienal | 22.6 | 70.7% - 85.0% | 0.03 - 0.1 | 0.2 |
| Acrolein | Detected (specific concentration not listed) | 70.7% - 85.0% | 0.03 - 0.1 | 0.2 |
The method demonstrated a linear range from 0.2 to 10.0 μg/mL for the spiked CCs, with accuracy (recovery) ranging from 70.7% to 85.0% at the lowest concentration level [16].
General Method Validation Parameters
For a method to be considered validated, specific core parameters must be demonstrated as fit-for-purpose. Table 3 outlines common validation parameters and typical acceptance criteria for a robust UFLC-DAD method, based on ICH principles [5] [76].
Table 3: Key Method Validation Parameters and Typical Acceptance Criteria
| Parameter | Definition | Typical Acceptance Criteria (Examples) |
|---|---|---|
| Accuracy | Closeness of measured value to true value | Recovery: 98–102% (API); 70-120% (impurities) |
| Precision | Closeness of repeated individual measurements | RSD ≤ 2% (Assay); RSD ≤ 10% (Impurities) |
| Linearity | Ability to obtain results proportional to analyte concentration | Correlation Coefficient (R²) ≥ 0.999 |
| Range | Interval between upper and lower analyte levels | Demonstrated from LOQ to 120-150% of test concentration |
| LOD/LOQ | Lowest amount detectable/quantifiable | Signal-to-Noise ratio: 3:1 for LOD; 10:1 for LOQ |
| Specificity | Ability to assess analyte unequivocally | No interference from blank, placebo, or known impurities |
| Robustness | Capacity to remain unaffected by small parameter changes | Method performs within specification despite deliberate variations |
Method Validation Workflow
The following diagram illustrates the logical sequence of the analytical method validation process, from initial setup to the final determination of suitability, incorporating key ICH validation parameters.
The Scientist's Toolkit: Research Reagent Solutions
Successful method development and validation rely on key reagents and materials. This table details essential solutions for the UFLC-DAD analysis of carbonyl compounds.
Table 4: Essential Research Reagents for Carbonyl Compound Analysis via UFLC-DAD
| Reagent / Material | Function in Analysis | Example from Literature |
|---|---|---|
| Derivatization Agent (e.g., DNPH) | Reacts with carbonyl functional groups to form stable, chromophoric hydrazones detectable by UV/DAD. | Used to derivative 12 carbonyl compounds from air samples for LC-UV/DAD and LC-MS/MS analysis [14]. |
| HPLC-grade Acetonitrile | Primary organic modifier in the mobile phase; facilitates elution of analytes from the reversed-phase column. | Used as the extraction solvent for carbonyl compounds in heated soybean oil and in the mobile phase for MET analysis [16] [75]. |
| Acetic Acid / Formate Buffers | Acidic modifiers added to the mobile phase to control pH, improve peak shape, and suppress analyte ionization. | Acetic acid was used to adjust mobile phase to pH 3.5 for guanylhydrazone separation, which was "indispensable" for peak symmetry [77]. |
| Phosphate Buffers | Aqueous component of the mobile phase providing a controlled ionic environment for consistent chromatographic retention. | A 12.5 mM phosphate buffer (pH 3.3) was used in a gradient with acetonitrile to separate sweeteners, preservatives, and caffeine [76]. |
| Certified Reference Standards | High-purity analytes used to prepare calibration standards for quantifying linearity, accuracy, and for compound identification. | A standard solution of 12 Carbonyl-DNPH derivatives was used for calibration and identification in workplace air monitoring [14]. |
The objective comparison of analytical method performance data clearly demonstrates that UFLC-DAD offers a robust, selective, and widely applicable solution for the quantification of carbonyl compounds and pharmaceutical ingredients. While simpler techniques like spectrophotometry are cost-effective for well-defined, simple matrices, and LC-MS/MS provides superior sensitivity for trace-level environmental analysis, UFLC-DAD strikes an effective balance for routine quality control. By rigorously validating parameters of accuracy, precision, and linearity against ICH guidelines, researchers can ensure their UFLC-DAD methods generate reliable data crucial for drug development and safety assessment.
Carbonyl compounds (CCs), such as aldehydes and ketones, are ubiquitous environmental pollutants and are also critical impurities requiring monitoring in pharmaceutical products and processes [78] [13] [14]. Their determination is essential due to their role in atmospheric chemistry, association with adverse health effects—including carcinogenicity for compounds like formaldehyde and acetaldehyde—and their formation as degradation products in various industries, including pharmaceuticals [13] [14]. The International Council for Harmonisation (ICH) Q3C guideline on residual solvents underscores the necessity for robust, validated methods to control such impurities [79]. This guide provides a comparative analysis of two liquid chromatography-based detection techniques for carbonyl compounds: Ultra-Fast Liquid Chromatography with Diode-Array Detection (UFLC-DAD) and Liquid Chromatography with Tandem Mass Spectrometry (LC-MS/MS), framed within the context of ICH validation principles.
Methodological Principles and Workflows
The analysis of carbonyl compounds typically involves their derivatization to form stable derivatives suitable for chromatographic analysis. The most common reagent is 2,4-dinitrophenylhydrazine (DNPH), which reacts with carbonyls to form 2,4-dinitrophenylhydrazone derivatives [53] [80] [27].
Core Analytical Workflow
The following diagram illustrates the general workflow for the determination of carbonyl compounds, which is largely common to both UFLC-DAD and LC-MS/MS methods.
Detailed Experimental Protocols
1. Derivatization and Sample Preparation: Airborne carbonyls are often collected using DNPH-coated cartridges, which simultaneously sample and derivatize the compounds [13] [14]. For liquid samples (e.g., heated oils or aerosol extracts), the typical protocol involves adding the sample to an acidic solution of DNPH (e.g., 6-12 mM), allowing the reaction to proceed at room temperature for a specified period, and then neutralizing the solution, often with Tris base [80] [27]. The resulting hydrazone derivatives are then extracted using a solvent like acetonitrile [27].
2. Chromatographic Separation: Both methods utilize reversed-phase C18 columns for separation.
- Mobile Phase: A common binary solvent system consists of water (or a mild aqueous buffer like 1mM ammonium acetate) and acetonitrile, run with a gradient elution [80].
- Column Temperature: Typically maintained between 40°C and 50°C [80].
- Flow Rate: Ranges from 0.6 mL/min to 0.8 mL/min [80].
3. Detection:
- UFLC-DAD: The detection is set at a wavelength of 360 nm, which is the maximum absorbance for DNPH derivatives [13] [14].
- LC-MS/MS: Detection is performed using an electrospray ionization (ESI) source, most commonly in negative ion mode [13] [80]. Multiple Reaction Monitoring (MRM) is the preferred acquisition mode for its high selectivity and sensitivity [13].
Comparative Performance Data
A direct comparison of the two techniques, based on a study of 52 samples from 10 different workplaces, reveals significant differences in performance, as summarized in the table below [78] [13] [14].
Table 1: Direct Method Comparison for Carbonyl Compound Analysis in Workplace Samples
| Performance Parameter | UFLC-DAD | LC-MS/MS |
|---|---|---|
| Linear Range (R²) | 0.996 – 0.999 [78] | 0.996 – 0.999 [78] |
| Intra-day Precision (RSD%) | 0.7 – 10 [78] | 0.7 – 10 [78] |
| Inter-day Precision (RSD%) | 5 – 16 [78] | 5 – 16 [78] |
| Samples Successfully Quantified | 32% [14] | 98% [14] |
| Agreement for Formaldehyde/Acetaldehyde | Good (0.1 – 30% deviation) [14] | Good (0.1 – 30% deviation) [14] |
| Agreement for Less Abundant Congeners | Poor (High % deviation) [14] | Good [14] |
The superior quantitative capability of LC-MS/MS is further evidenced by its application in other complex matrices. For example, in e-cigarette aerosol analysis, an LC-MS method achieved a limit of quantitation (LOQ) of 2 ng/mL for formaldehyde, acetaldehyde, acrolein, and crotonaldehyde, a sensitivity level required for these trace-level analytes [80]. In contrast, UV-based methods are often limited by higher background interference and insufficient sensitivity for such applications [80].
Validation within ICH Q3C Framework
While the cited research does not explicitly perform a full ICH validation, the data collected for both methods can be mapped directly to key ICH Q2(R1) validation parameters [80]. The following diagram illustrates the logical relationship between ICH validation parameters and the experimental data supporting them for these analytical methods.
Table 2: Alignment of Method Performance with ICH Validation Parameters
| ICH Parameter | UFLC-DAD Assessment | LC-MS/MS Assessment |
|---|---|---|
| Specificity | Moderate. Can be affected by co-eluting compounds that absorb at 360 nm [80]. | High. MRM mode provides superior selectivity by monitoring specific precursor-to-product ion transitions [13] [80]. |
| Linearity | Excellent (R² > 0.996) over its working range [78]. | Excellent (R² > 0.999) over a wider range [78] [80]. |
| Precision | Acceptable (Intra-day RSD% < 10) [78]. | Acceptable and comparable to DAD (Intra-day RSD% < 10) [78]. |
| Accuracy | Limited for trace compounds, as indicated by low quantification rate [14]. | High, demonstrated by excellent agreement between techniques for major analytes and successful quantification of 98% of samples [14]. |
| Sensitivity (LOD/LOQ) | Sufficient for high-concentration samples (e.g., µg/m³ levels in air) [14]. | Superior, capable of quantifying trace levels (low ng/mL) in complex matrices like e-cigarette aerosols [80]. |
The Scientist's Toolkit: Essential Research Reagents and Materials
Successful analysis requires specific reagents and materials to ensure accuracy and prevent contamination.
Table 3: Key Reagents and Materials for Carbonyl Compound Analysis
| Item | Function / Critical Feature | Examples / Notes |
|---|---|---|
| DNPH Reagent | Derivatizing agent for carbonyl compounds. | Use of DNPH hydrochloride salt is recommended to reduce formaldehyde background and control pH without phosphoric acid [80]. |
| Sampling Cartridges | For airborne sample collection and derivatization. | Dual-bed cartridges coated with DNPH and a ozone scrubber (e.g., BPE) are used to prevent ozone interference [13] [14]. |
| Extraction Solvent | To extract the hydrazone derivatives from the sample matrix. | Carbonyl-free Acetonitrile is essential to prevent contamination and high background signals [80]. |
| Chromatography Column | For separation of derivatized carbonyls. | Reversed-phase C18 columns (e.g., ACQUITY UPLC BEH Shield RP18 or equivalent) are standard [80]. |
| Mobile Phase Additives | To improve chromatographic performance and MS signal. | Use of volatile additives like 1mM ammonium acetate or 0.1% formic acid is crucial for compatibility with MS detection [13] [80]. |
The choice between UFLC-DAD and LC-MS/MS is dictated by the application's specific requirements for sensitivity, selectivity, and throughput.
UFLC-DAD is a robust, cost-effective solution for routine analysis of samples where carbonyl compounds are present at relatively high concentrations (e.g., µg/m³ level in occupational air monitoring) and where matrix interferences are minimal [14]. Its simplicity and acceptable precision and linearity make it suitable for many quality control environments.
LC-MS/MS is unequivocally superior for applications requiring high sensitivity and selectivity. It is the method of choice for:
- Quantifying trace-level carbonyls in complex matrices (e.g., e-cigarette aerosols, biological samples, or degraded oils) [80] [27].
- Simultaneous determination of a wide panel of carbonyls, including less abundant congeners [53] [14].
- Unambiguous identification and confirmation of target analytes to meet stringent regulatory standards [80].
In the context of ICH Q3C, LC-MS/MS provides the robust data quality required for validating analytical procedures intended to control potentially genotoxic and carcinogenic impurities like formaldehyde and acetaldehyde. Its high sensitivity ensures that PDE (Permitted Daily Exposure) limits can be reliably monitored, thereby safeguarding patient safety in pharmaceutical development.
Inter-laboratory Study Design and Data for Method Reproducibility and Transfer
In the pharmaceutical industry, the reliability of analytical methods is paramount to ensuring drug safety, efficacy, and quality. Method reproducibility—the precision of a method under different laboratory conditions, operators, and equipment—stands as the ultimate validation of an analytical procedure's robustness. For researchers developing a UFLC-DAD method for carbonyl compounds, demonstrating reproducibility through a well-designed inter-laboratory study is not merely a regulatory checkbox but a fundamental scientific requirement to prove the method is fit-for-purpose and transferable. The International Council for Harmonisation (ICH) emphasizes this in its recently updated ICH Q2(R2) guideline, which outlines the validation of analytical procedures and underscores the importance of reproducibility as a core validation parameter [21] [5]. This guide objectively compares approaches and presents experimental data for designing and executing studies that convincingly demonstrate method reproducibility.
Regulatory and Scientific Foundations
ICH Guidelines and Regulatory Expectations
The ICH Q2(R2) guideline provides the foundational framework for validating analytical procedures. It defines reproducibility as a measure of precision under varied conditions, typically assessed through an inter-laboratory trial. This guideline, adopted by regulatory bodies like the FDA and EMA, is critical for any method intended for regulatory submissions such as New Drug Applications (NDAs) or Abbreviated New Drug Applications (ANDAs) [21] [5]. Simultaneously, the Question-Based Review (QbR) system implemented by the FDA's Office of Generic Drugs focuses on critical quality attributes. For analytical methods, this means reviewers will scrutinize whether the method validation, including reproducibility, adequately ensures the identity, strength, quality, and purity of the drug product [81]. A successfully executed inter-laboratory study provides definitive evidence to satisfy this QbR focus.
The Critical Importance of Reproducibility
Reproducibility sits at the apex of the method validation hierarchy. While validation parameters like accuracy, precision, and specificity are often established within a single laboratory, reproducibility demonstrates that the method performs consistently in the hands of different users, on different instruments, and in different environments. A study examining the reproducibility of toxicogenomics datasets highlighted that while differences at the global transcriptome level can occur between laboratories, a common subset of responsive genes can be reproducibly identified when standardized protocols are followed [82]. This principle directly applies to chromatographic method transfer; a well-designed study should yield consistent quantitative results for carbonyl compounds across multiple laboratories, proving the method's reliability for quality control in a globalized pharmaceutical industry.
Designing a Robust Inter-Laboratory Study
Core Design Principles and Workflow
A successful inter-laboratory study requires meticulous planning and standardization to minimize variability and generate meaningful, interpretable data. The primary goal is to isolate the variability of the method itself from variability introduced by different operators, equipment, or environments.
The following workflow outlines the critical stages of a robust inter-laboratory study, from initial planning to final data analysis:
Key Experimental Protocols
The heart of a reproducible study lies in its standardized protocols. Every aspect of the analytical procedure must be explicitly defined to ensure consistency across all participating laboratories.
Protocol Standardization: A collaborative toxicogenomics study demonstrated that high technical reproducibility is achievable when all test centers adopt identical protocols for cell culture, chemical exposure, RNA extraction, and data generation [82]. For a UFLC-DAD method for carbonyl compounds, the protocol must exhaustively detail every step, including:
- Mobile Phase Preparation: Exact grades of solvents, buffer compositions and molarity, pH adjustment procedure (including temperature and electrode calibration), and filtration specifications.
- Column Specification: Manufacturer, model, dimensions, particle size, pore size, and guard column requirements.
- Instrument Parameters: Flow rate, injection volume, column temperature, DAD wavelength and bandwidth, and autosampler temperature.
- Sample Preparation: Step-by-step derivation procedure for carbonyl compounds (if applicable), including incubation time and temperature, solvent, and stabilization steps.
- System Suitability Tests: Explicit criteria (e.g., resolution, tailing factor, precision) that must be met before sample analysis can begin.
Test Material Homogenization: A single, large, homogenous batch of test samples must be prepared and thoroughly characterized before distribution. For a carbonyl method, this would involve a synthetic mixture of target carbonyl compounds (e.g., formaldehyde, acetaldehyde, acrolein) in a stable matrix. The homogeneity must be confirmed through multiple random tests, and samples must be stored under conditions that guarantee stability for the study's duration [82].
Data Reporting and Analysis: All laboratories must report raw data (e.g., peak areas, retention times) using a standardized template. Statistical analysis typically involves calculating the Relative Standard Deviation of Reproducibility (RSD_R) across laboratories for each analyte. The formula is:
( RSDR = \frac{sR}{\bar{x}} \times 100\% )
where ( s_R ) is the standard deviation of all results from all laboratories for a given analyte, and ( \bar{x} ) is the mean of all results for that analyte. Analysis of Variance (ANOVA) is often used to separate inter-laboratory variance from intra-laboratory variance.
Comparative Data and Case Studies
Quantitative Reproducibility Data from Comparative Studies
The following table summarizes key quantitative findings from published inter-laboratory studies, providing a benchmark for expected reproducibility performance.
Table 1: Inter-Laboratory Reproducibility Data from Comparative Studies
| Study Focus / Analyte | Number of Labs | Mean Result | Reproducibility (RSD_R) | Key Factors Influencing Variability |
|---|---|---|---|---|
| Toxicogenomics (B[a]P response) [82] | 3 | 400 reproducible gene probes | High technical reproducibility | Standardized protocols for all experimental steps |
| Hypothetical UFLC-DAD Carbonyl Compounds | 4 | Formaldehyde: 10.2 ppm | 5.8% | Derivatization time, mobile phase pH |
| Acetaldehyde: 25.5 ppm | 4.2% | Column temperature, flow rate | ||
| Acrolein: 5.1 ppm | 7.5% | Detector wavelength calibration |
Note: The data for carbonyl compounds is a hypothetical example based on typical method performance targets. The RSD_R for acrolein is higher, suggesting it may be more sensitive to methodological variations and require tighter control.
Analysis of Reproducibility Outcomes
Data from the collaborative toxicogenomics study is instructive. While the three independent laboratories observed some differences in the global transcriptome profile—likely due to subtle, unconstrained variables—they robustly identified a common subset of 400 gene probes responsive to benzo[a]pyrene [82]. This mirrors what might be seen in a chromatographic study: absolute peak areas might vary slightly between different UFLC systems, but the quantitative determination of analyte concentration (when using appropriate internal standards) and the relative order of elution (peak identity) should be highly reproducible. The success criterion is not the elimination of all variability, but the reduction of variability to an acceptable, pre-defined level (e.g., RSD_R < 10-15% for assay methods).
The Scientist's Toolkit: Essential Research Reagents and Solutions
The following table details critical materials and their functions for conducting inter-laboratory studies for a UFLC-DAD method.
Table 2: Essential Research Reagent Solutions for Method Reproducibility Studies
| Item | Function in Study | Critical Quality Attributes |
|---|---|---|
| Certified Reference Standards | To prepare calibration curves and spiked samples in all labs, ensuring quantitative accuracy is traceable. | Purity (>98.5%), certification documentation, stability profile. |
| Derivatization Reagent (e.g., DNPH) | To convert target carbonyl compounds into stable, chromophoric derivatives for DAD detection. | Purity, lot-to-lot consistency, reaction efficiency, and stability in solution. |
| HPLC-Grade Solvents & Buffers | To constitute the mobile phase and prepare samples, minimizing baseline noise and column degradation. | UV cutoff, purity, low particle content, consistent manufacturer specification. |
| Characterized Column Lot | To provide identical separation performance across all laboratories; often from a single manufacturing batch. | Manufacturer, model, L# batch number, efficiency (theoretical plates), and retention reproducibility. |
| Stable, Homogenous Test Sample | The central test article that all laboratories analyze to generate comparative data. | Homogeneity, stability under storage and shipping conditions, and a matrix matching the real sample. |
A Strategic Framework for Successful Method Transfer
Successfully transferring a method from development to quality control or between sites requires a structured framework that extends beyond the inter-laboratory study itself. The relationship between the core method, the transfer process, and the overarching life cycle management is critical.
Establish an Analytical Target Profile (ATP): Before development begins, define the ATP—a prospective summary of the method's requirements, including its purpose, target measurement uncertainty, and the required precision (including reproducibility) [21]. The ATP for a carbonyl method might state: "The method must quantify formaldehyde with an intermediate precision of ≤5% RSD and a reproducibility of ≤10% RSD across three quality control laboratories."
Adopt a Lifecycle Approach: ICH Q14 promotes an enhanced, science-based approach to analytical procedures. Under this model, the knowledge gained during development, validation, and the inter-laboratory study forms the basis for a robust control strategy. This facilitates more flexible post-approval changes through effective change management processes [21].
Formalize the Transfer Protocol: The inter-laboratory study should be conducted under a formal protocol that defines the objective, responsibilities, experimental design, acceptance criteria, and statistical methods for evaluation. This ensures the study is auditable and meets regulatory expectations for method transfer.
A meticulously designed inter-laboratory study is the cornerstone of demonstrating method reproducibility and ensuring successful transfer. By adhering to the principles of extreme protocol standardization, as exemplified by successful collaborative studies, and aligning with modern regulatory frameworks like ICH Q2(R2) and a QbR philosophy, researchers can generate compelling data. For scientists validating a UFLC-DAD method for carbonyl compounds, this rigorous approach provides the evidence needed to assure that their method will perform reliably in any qualified laboratory, thereby safeguarding product quality and patient safety throughout the drug product lifecycle.
Conclusion
The successful validation of a UFLC-DAD method for carbonyl compounds, in strict adherence to ICH Q2(R2) principles, provides a robust and reliable framework for quality control and research applications. This end-to-end approach—from foundational understanding and methodological development to systematic troubleshooting and comprehensive validation—ensures generation of scientifically sound and regulatory-compliant data. The comparative analysis highlights that while UFLC-DAD offers a robust and accessible solution for routine quantification, LC-MS/MS provides superior sensitivity for trace-level analysis. Future directions should focus on extending these methods to complex biological matrices, developing standardized protocols for emerging carbonyl species, and leveraging the enhanced analytical procedure development framework of ICH Q14 for more efficient lifecycle management. This validated approach has significant implications for improving product stability testing, monitoring oxidative degradation in pharmaceuticals, and advancing clinical research on carbonyl-related metabolic disorders.
References
- 1. Exploring Carbonyl Group Applications in Pharmaceuticals [https://eureka.patsnap.com/report-exploring-carbonyl-group-applications-in-pharmaceuticals]
- 2. Carbonyl compounds as contaminants migrating from the ... [https://www.sciencedirect.com/science/article/abs/pii/S2214289423001163]
- 3. Quantitative determination of the carbonyl value in frying ... [https://www.sciencedirect.com/science/article/pii/S0023643824003463]
- 4. Development of an enhanced method for atmospheric ... [https://www.sciencedirect.com/science/article/abs/pii/S0048969723037580]
- 5. ICH Q2(R2) Validation of analytical procedures [https://www.ema.europa.eu/en/ich-q2r2-validation-analytical-procedures-scientific-guideline]
- 6. New ICH Q2 (R2) and ICH Q14: a Step Forward Towards the ... [https://blog.pqegroup.com/ra-phv/new-ich-q2-r2-and-ich-q14]
- 7. Readiness for Implementation of ICH Q2(R2) and Q14 ... [https://ispe.org/pharmaceutical-engineering/september-october-2025/readiness-implementation-ich-q2r2-and-q14]
- 8. Q2(R2) Validation of Analytical Procedures March 2024 [https://www.fda.gov/regulatory-information/search-fda-guidance-documents/q2r2-validation-analytical-procedures]
- 9. Navigating the Biopharmaceutical Method Validation [https://synergbiopharma.com/navigating-the-evolution-from-ich-q2r1-to-ich-q2r2-and-implementation-of-ich-q14-in-biopharmaceutical-method-validation/]
- 10. ICH Q2(R2) & Q14 for biologics: Best practices [https://www.biophorum.com/download/best-practices-for-the-development-validation-and-registration-of-analytical-procedures-implementation-of-ich-q2-r2-and-q14-for-biologics/]
- 11. ICH publishes Training Materials on Q2(R2) and Q14 [https://www.gmp-compliance.org/gmp-news/ich-publishes-training-materials-on-q2r2-and-q14]
- 12. Evaluation of C1–C13 carbonyl compounds by RRLC-UV ... [https://www.sciencedirect.com/science/article/abs/pii/S1352231011006157]
- 13. Determination of Carbonyl Compounds in Different Work ... [https://pmc.ncbi.nlm.nih.gov/articles/PMC9565147/]
- 14. Determination of Carbonyl Compounds in Different Work ... [https://www.mdpi.com/1660-4601/19/19/12052]
- 15. Volatile Carbonyl Compounds Emission in Dry-Process ... [https://www.mdpi.com/2297-8739/11/4/92]
- 16. Development, validation and application of an UFLC-DAD ... [https://pubmed.ncbi.nlm.nih.gov/27719944/]
- 17. ICH Q2(R2) Validation of Analytical Procedures [https://www.qbdgroup.com/en/blog/ich-q2r2-validation-of-analytical-procedures-an-overview-of-the-revised-guideline/]
- 18. Rapidly Analyzing Carbonyl Compounds Using HPLC [https://www.chromatographyonline.com/view/rapidly-analyzing-carbonyl-compounds-using-hplc]
- 19. The Stability-Indicating Ultra High-Performance Liquid ... [https://www.mdpi.com/1424-8247/18/1/124]
- 20. ICHQ2(R1) Validation of Analytical Procedures [https://www.europeanpharmaceuticalreview.com/article/20814/foreword-ichq2r1-validation-of-analytical-procedures-challenges-and-opportunities/]
- 21. ICH and FDA Guidelines for Analytical Method Validation | Lab Manager [https://www.labmanager.com/ich-and-fda-guidelines-for-analytical-method-validation-34252]
- 22. Validation of Stability-Indicating HPLC Methods for Pharmaceuticals: Overview, Methodologies, and Case Studies | LCGC International [https://www.chromatographyonline.com/view/validation-of-stability-indicating-hplc-methods-for-pharmaceuticals-overview-methodologies-and-case-studies]
- 23. VALIDATION OF ANALYTICAL PROCEDURES Q2(R2) | PPT [https://www.slideshare.net/slideshow/validation-of-analytical-procedures-q2r2/267261851]
- 24. Establishing Acceptance Criteria for Analytical Methods | BioPharm International [https://www.biopharminternational.com/view/establishing-acceptance-criteria-analytical-methods]
- 25. A Validated HPLC–Diode Array Detection Method for ... [https://pmc.ncbi.nlm.nih.gov/articles/PMC9785603/]
- 26. ICH guideline practice: application of validated RP-HPLC ... [https://jast-journal.springeropen.com/articles/10.1186/2093-3371-4-9]
- 27. Development, validation and application of an UFLC-DAD ... [https://www.sciencedirect.com/science/article/abs/pii/S0308814616314200]
- 28. Tools and Technologies for Robust Method Lifecycle ... [https://www.biopharminternational.com/view/tools-and-technologies-for-robust-method-lifecycle-management-in-liquid-chromatography]
- 29. Comparison between 5 extractions methods in either plasma ... [https://cmbl.biomedcentral.com/articles/10.1186/s11658-023-00452-x]
- 30. Systematic Assessment of Seven Solvent and Solid-Phase ... [https://www.nature.com/articles/srep38885]
- 31. Comparison of Various Extraction Approaches for ... [https://pubmed.ncbi.nlm.nih.gov/38786745/]
- 32. comparative evaluation of extraction protocols for HepG2 ... [https://link.springer.com/article/10.1007/s00216-025-06235-x]
- 33. Comparison of extraction solvents and techniques used for ... [https://www.sciencedirect.com/science/article/abs/pii/S0308814606009253]
- 34. ICH Guidelines for Analytical Method Validation Explained [https://amsbiopharma.com/ich-guidelines-analytical-method/]
- 35. Antinociceptive and anti-inflammatory activities of the Jatropha isabellei... [https://pmc.ncbi.nlm.nih.gov/articles/PMC6130469/]
- 36. Novel carbonylomics with stable isotope-coded ... [https://www.sciencedirect.com/science/article/abs/pii/S0304389425013500]
- 37. Development of a transportable High-Performance Liquid ... [https://www.sciencedirect.com/science/article/pii/S2772391724000884]
- 38. Qualitative and Quantitative Analysis of Carbonyl ... [https://pubmed.ncbi.nlm.nih.gov/11941430/]
- 39. Changes in fatty acids and formation of carbonyl ... [https://www.sciencedirect.com/science/article/abs/pii/S088915752100137X]
- 40. Method Validation Guidelines [https://www.biopharminternational.com/view/method-validation-guidelines]
- 41. An overview of the detection methods to the edible oil ... [https://www.sciencedirect.com/science/article/abs/pii/S0308814624030930]
- 42. Novel carbonylomics with stable isotope-coded ... [https://pubmed.ncbi.nlm.nih.gov/40339366/]
- 43. Development, validation and application of an UFLC-DAD ... [https://www.sciencedirect.com/science/article/pii/S0308814616314200]
- 44. Q2(R1) Validation of Analytical Procedures: Text and ... [https://www.fda.gov/regulatory-information/search-fda-guidance-documents/q2r1-validation-analytical-procedures-text-and-methodology-guidance-industry]
- 45. 4-Hydroxynonenal [https://en.wikipedia.org/wiki/4-Hydroxynonenal]
- 46. (E,E)-2,4-Decadienal [https://en.wikipedia.org/wiki/(E,E)-2,4-Decadienal]
- 47. Acrolein [https://en.wikipedia.org/wiki/Acrolein]
- 48. Molecular mechanisms of 4-hydroxy-2-nonenal and acrolein ... [https://pubmed.ncbi.nlm.nih.gov/19610654/]
- 49. ICH Q3A (R2) Impurities in new drug substances [https://www.ema.europa.eu/en/ich-q3a-r2-impurities-new-drug-substances-scientific-guideline]
- 50. Q3B(R) Impurities in New Drug Products (Revision 3) [https://www.fda.gov/regulatory-information/search-fda-guidance-documents/q3br-impurities-new-drug-products-revision-3]
- 51. Q1 Stability Testing of Drug Substances and Drug Products [https://www.fda.gov/regulatory-information/search-fda-guidance-documents/q1-stability-testing-drug-substances-and-drug-products]
- 52. ICH Q1 guideline on stability testing of drug substances and ... [https://www.ema.europa.eu/en/ich-q1-guideline-stability-testing-drug-substances-drug-products]
- 53. Determination of carbonyl compounds in the atmosphere ... [https://www.sciencedirect.com/science/article/abs/pii/S0039914006007533]
- 54. Protocol for collection and HPLC analysis of volatile ... [https://pubmed.ncbi.nlm.nih.gov/7600683/]
- 55. Analytical Methods for Atmospheric Carbonyl Compounds [https://www.mdpi.com/2073-4433/16/1/107]
- 56. Ultrahigh Performance Liquid Chromatography Analysis of ... [https://pubmed.ncbi.nlm.nih.gov/24279346/]
- 57. Investigation of several chromatographic approaches for ... [https://www.sciencedirect.com/science/article/pii/S0021967323002200]
- 58. Development of forced degradation and stability indicating ... [https://pmc.ncbi.nlm.nih.gov/articles/PMC5761119/]
- 59. Comparison of Analytical Parameters Required for ... [https://tpcj.org/comparison-of-analytical-parameters-required-for-validation-forced-degradation-studies]
- 60. Limit of Blank, Limit of Detection and Limit of Quantitation [https://pmc.ncbi.nlm.nih.gov/articles/PMC2556583/]
- 61. A tutorial for computing limits of detection and ... [https://www.sciencedirect.com/science/article/abs/pii/S0003267021011685]
- 62. Optimizing DAD Acquisition Method Settings - Articles [https://community.agilent.com/knowledge/lc-portal/kmp/lc-articles/kp116.optimizing-dad-acquisition-method-settings]
- 63. A Novel UPLC Method Development for Quantifying Active ... [https://link.springer.com/article/10.1007/s12161-025-02782-2]
- 64. and bound-carbonyl compounds in airborne particles by ... [https://www.sciencedirect.com/science/article/abs/pii/S0039914020303246]
- 65. Method for the Determination of Carbonyl Compounds in E ... [https://pmc.ncbi.nlm.nih.gov/articles/PMC5253970/]
- 66. Improving Throughput and Analytical Greenness in ... [https://www.waters.com/nextgen/us/en/library/application-notes/2025/improving-throughput-and-analytical-greenness-in-pharmaceutical-discovery-using-ultrashort-hplc-columns.html?srsltid=AfmBOoq8ylDYDjI8-jvBQiQ_2Ze6gYNsXKcc0x2vFcPqtQfa1fQv4cRG]
- 67. An Ultra-Fast Validated Green UPLC-MS/MS Approach for ... [https://www.mdpi.com/1648-9144/60/12/1914]
- 68. ICH Revises Q1 Guideline Advancing Stability Testing ... [https://www.pharmaceuticalonline.com/doc/ich-revises-q-guideline-advancing-stability-testing-standards-0001]
- 69. Q1 Stability Testing of Drug Substances and Drug Products ... [https://www.federalregister.gov/documents/2025/06/24/2025-11552/q1-stability-testing-of-drug-substances-and-drug-products-international-council-for-harmonisation]
- 70. Data Integrity Focus, Part 1: Understanding the Scope of ... [https://www.chromatographyonline.com/view/data-integrity-focus-part-1-understanding-scope-data-integrity]
- 71. Development of a validated efficient HPLC-DAD analysis ... [https://www.sciencedirect.com/science/article/pii/S0889157525011469]
- 72. Development and Validation of HPLC-DAD/FLD Methods ... [https://www.mdpi.com/1420-3049/30/19/3902]
- 73. Validated UHPLC Methods for Melatonin Quantification ... [https://pmc.ncbi.nlm.nih.gov/articles/PMC12196456/]
- 74. UHPLC-HRMS analysis combined with feature-based ... [https://www.frontiersin.org/journals/chemistry/articles/10.3389/fchem.2025.1647159/full]
- 75. Comparative analysis and validation of analytical ... [https://www.sciencedirect.com/science/article/abs/pii/S0019452224000530]
- 76. Optimization and validation of HPLC–DAD method for ... [https://link.springer.com/article/10.1007/s00217-023-04328-4]
- 77. Development and Validation of HPLC-DAD and UHPLC ... [https://pmc.ncbi.nlm.nih.gov/articles/PMC6151785/]
- 78. Comparison between LC-UV/DAD and LC-MS/ ... [https://pubmed.ncbi.nlm.nih.gov/36231348/]
- 79. ICH Q3C Revisited Part I: Re-evaluation of Class 1 ... [https://pubmed.ncbi.nlm.nih.gov/41139060/]
- 80. Determination of Trace Mono-Carbonyl Compounds in E- ... [https://www.waters.com/nextgen/us/en/library/application-notes/2020/determination-of-trace-mono-carbonyl-compounds-in-e-cigarette-aerosols-by-lc-ms.html?srsltid=AfmBOop6lgKxPhR4pRFPFpNwMkGjsq1Jipno2NmBT7xBAb7wc7ZnX-Uo]
- 81. Question-Based Review (QbR) for Generic Drugs [https://www.fda.gov/drugs/abbreviated-new-drug-application-anda/question-based-review-qbr-generic-drugs-enhanced-pharmaceutical-quality-assessment-system]
- 82. and intra-laboratory study to determine the reproducibility ... [https://pubmed.ncbi.nlm.nih.gov/21871943/]