HPLC-UV vs. HPLC-MS for Specificity Testing: A Strategic Guide for Analytical Scientists
This article provides a comprehensive comparison of High-Performance Liquid Chromatography with Ultraviolet (HPLC-UV) and Mass Spectrometric (HPLC-MS) detection for specificity testing in pharmaceutical analysis and bioanalytical research.
HPLC-UV vs. HPLC-MS for Specificity Testing: A Strategic Guide for Analytical Scientists
Abstract
This article provides a comprehensive comparison of High-Performance Liquid Chromatography with Ultraviolet (HPLC-UV) and Mass Spectrometric (HPLC-MS) detection for specificity testing in pharmaceutical analysis and bioanalytical research. It covers the foundational principles of both techniques, explores methodological considerations for diverse applications, and offers practical troubleshooting guidance. A detailed validation framework and comparative analysis equip scientists and drug development professionals with the knowledge to select the optimal technique, ensuring accurate, precise, and reliable identification and quantification of analytes in the presence of potential interferents.
Core Principles: Understanding How HPLC-UV and HPLC-MS Achieve Specificity
The Fundamental Mechanism of HPLC-UV Detection and Chromophore Dependency
In high-performance liquid chromatography (HPLC), the detector serves as the critical component that measures the concentrations of separated analytes, converting physicochemical properties into electrical signals for quantification and identification [1] [2]. Among available detection methods, ultraviolet (UV) detection remains the undisputed workhorse in quality control laboratories despite the rising prominence of mass spectrometry (MS) [1]. The reliability, ease of use, and universal response to chromophoric compounds make UV detection particularly valuable for pharmaceutical applications where higher precision (<0.2% RSD) is pivotal for regulatory testing [1].
This guide examines the fundamental mechanism of HPLC-UV detection with particular emphasis on chromophore dependency, while objectively comparing its performance capabilities with HPLC-MS for specificity testing in research applications. Understanding these core principles enables researchers to make informed decisions about detection strategies based on their specific analytical requirements, method development goals, and regulatory constraints.
Fundamental Principles of HPLC-UV Detection
Core Mechanism and Beer-Lambert Law
HPLC-UV detectors operate on the principle that organic molecules can absorb electromagnetic radiation in the form of photons of UV and visible light [3] [4]. When light passes through the flow cell containing analyte, chromophores within the molecule absorb specific wavelengths, promoting electrons from ground states to excited states [3]. This absorption follows the Beer-Lambert law, which states that absorbance (A) is proportional to the product of the molar absorptivity (ε), pathlength (b), and analyte concentration (c): A = ε × b × c [1].
The pathlength, typically 10 mm in standard flow cells, directly influences sensitivity [1]. Modern UV detectors achieve exceptional sensitivity, with noise specifications historically benchmarked at ±1 × 10⁻⁵ absorbance units (AU), a specification exceeded by most contemporary instruments [1]. The detector measures this absorbance continuously as analytes elute from the column, generating a chromatogram where peak areas correlate with analyte concentration [1] [2].
Electronic Transitions and Chromophore Dependency
UV absorption occurs when molecules contain chromophores - structural moieties capable of absorbing UV radiation through electronic transitions [1]. The specific energy transitions depend on available energy levels defined by atomic composition and molecular bonding [4]. Key electronic transitions include:
- π → π* transitions: Occur in compounds with double bonds or conjugated systems
- n → π* transitions: Involve promotion of non-bonding electrons
- σ → σ* transitions: Require higher energy, typically occurring at lower wavelengths [3]
Table 1: Electronic Transitions and Associated Chromophores
| Transition Type | Chromophore Example | Typical λmax (nm) | Molar Absorptivity |
|---|---|---|---|
| σ → σ* | Ethane | 135 | Low |
| n → σ* | Methanol | 183 | Medium |
| π → π* | Ethene | 175 | High |
| π → π* (conjugated) | Benzene | 254 | Very high |
| n → π* | Acetone | 290 | Low |
The dependency on chromophores represents both a strength and limitation of UV detection. Compounds lacking chromophores or containing only isolated single bonds typically exhibit weak absorption at low wavelengths (180-240 nm), where solvent interference often compromises sensitivity [3] [4].
Figure 1: Fundamental HPLC-UV Detection Mechanism. The process involves light selection through a monochromator, interaction with chromophores in the flow cell, and detection of transmitted light.
Instrumentation Types: VWD vs. DAD
HPLC-UV detection encompasses two primary instrument types that employ distinct optical approaches:
Variable Wavelength Detectors (VWD) utilize a monochromator with a rotating diffraction grating to disperse polychromatic light and select a specific wavelength before it passes through the flow cell [1] [2]. This approach offers enhanced sensitivity due to simultaneous measurement of an actual reference and reduced total light exposure of the sample, making it particularly suitable for light-sensitive compounds [2].
Diode Array Detectors (DAD), also known as photodiode array detectors (PDA), expose the sample to the entire spectrum, then disperse the transmitted light onto an array of photodiodes after it passes through the flow cell [1] [2]. This enables simultaneous monitoring of multiple wavelengths and provides full spectral information for each chromatographic peak, facilitating peak purity assessment and method development for complex mixtures [1] [2].
Specificity and Limitations in Pharmaceutical Analysis
Chromophore Dependency and Analytical Challenges
The fundamental requirement for chromophores creates specific limitations for HPLC-UV in pharmaceutical analysis. Many drug molecules, excipients, or impurities lack sufficient chromophores, rendering them undetectable or requiring derivatization [5]. For instance, sterol analysis by HPLC-UV presents challenges due to intrinsically low molar absorptivity [5]. Some sterols like coprostanol contain no chromophore, while others including 7-dehydrocholesterol and cholesterol exhibit maximum absorption at approximately 210 nm - close to the UV cut-off of common solvents like acetonitrile (190 nm), leading to spectral interference [5].
This chromophore dependency necessitates strategic workarounds. In one innovative approach, researchers developed an ultrasonic-assisted derivatization method using benzoyl isocyanate to introduce chromophore groups into sterol structures [5]. The reagent reacts with hydroxyl groups on sterols, forming carbamate derivatives containing both amide and phenyl groups that enable UV absorption, thereby overcoming the inherent detection limitations [5].
Specificity Considerations for Regulatory Compliance
For pharmaceutical applications following ICH guidelines, HPLC-UV methods require demonstrated specificity, particularly for stability-indicating methods where detection of impurities down to 0.05-0.10% is mandated [1]. While UV spectra can be somewhat featureless due to overlapping vibrational and rotational sublevels [3] [4], modern approaches utilize derivative spectra (dA/dλ) to enhance peak identification confidence [4].
The featureless nature of solution-based UV spectra presents challenges for confirming peak identity and purity, particularly compared to the rich structural information provided by mass spectrometry [3] [4]. While spectral libraries can aid identification, the influence of mobile phase composition on absorption spectra further complicates reliable compound matching [4].
HPLC-UV vs. HPLC-MS: A Specificity Comparison
Fundamental Detection Principles Compared
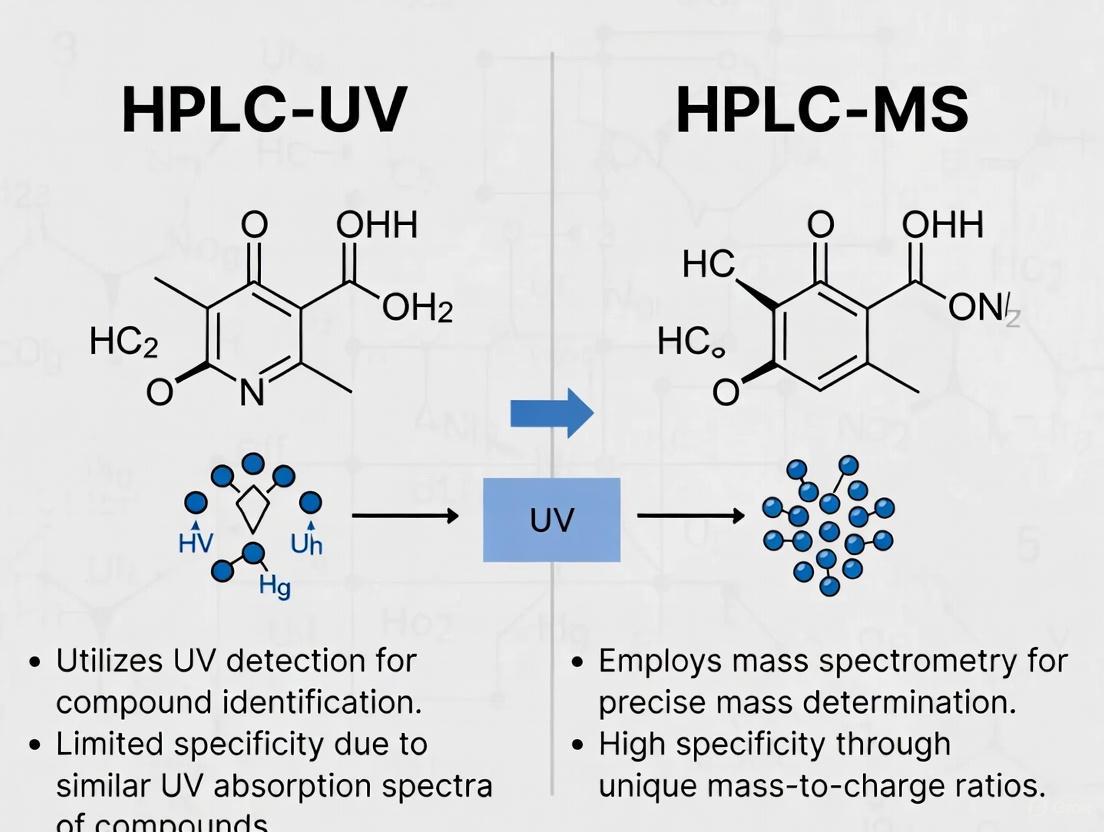
HPLC-UV and HPLC-MS operate on fundamentally different detection principles, leading to significant differences in specificity and application suitability. While UV detection measures light absorption by chromophores, MS detection separates and detects ions based on mass-to-charge (m/z) ratios [6] [7].
Table 2: HPLC-UV vs. HPLC-MS Fundamental Comparison
| Parameter | HPLC-UV | HPLC-MS |
|---|---|---|
| Detection Principle | Light absorption by chromophores | Mass-to-charge ratio of ions |
| Specificity Source | Chromophore structure, λmax, retention time | Molecular mass, fragmentation pattern, retention time |
| Structural Information | Limited (absorption spectrum) | High (mass spectrum, fragmentation) |
| Chromophore Dependency | Required | Not required |
| Ideal Applications | Quantitative analysis of known chromophoric compounds | Identification of unknowns, complex mixtures, non-chromophoric compounds |
| Detection Limits | Nanograms [2] | Picograms to femtograms [2] [8] |
| Quantitative Precision | High (<0.2% RSD) [1] | Variable (matrix-dependent) |
Specificity and Structural Elucidation
The triple specificity of HPLC-MS - based on retention time, molecular mass, and fragmentation pattern - provides unparalleled confidence in compound identification [7] [8]. This is particularly valuable for research applications involving unknown compounds or complex matrices. In contrast, HPLC-UV primarily relies on retention time matching with potentially variable UV spectra, offering lower confidence in peak identity [4].
For nucleic acid research, HPLC-MS provides exquisite specificity for detecting and quantifying modified nucleosides at low prevalence in biological samples [8]. The multiple reaction monitoring (MRM) capability of triple quadrupole instruments allows precise identification through unique precursor and product ion combinations, enabling specific quantification of compounds like 1-methyladenosine and 3-methylcytosine in complex biological matrices [8].
Figure 2: Specificity Comparison Workflow. HPLC-MS provides multiple dimensions of specificity through mass analysis and fragmentation patterns, while HPLC-UV relies primarily on retention time and UV spectrum.
Practical Research Applications: Case Studies
HPLC-UV Pharmaceutical Application: A 2025 study demonstrated a sustainable multi-task HPLC-UV method for simultaneous analysis of three neuromodulating drugs - piracetam, gabapentin, and levetiracetam - in diverse pharmaceutical formulations [9]. The method employed a C18 column with isocratic elution (methanol:water 15:85 v/v) and detection at 210 nm, achieving linearity across 10.0-100.0 μg/mL for piracetam and levetiracetam, and 30.0-1000.0 μg/mL for gabapentin [9]. This application highlights UV detection's suitability for quality control of known chromophoric compounds.
HPLC-MS Bioanalytical Application: Research on a novel aminothiazole compound (21MAT) demonstrated HPLC-MS's superior sensitivity for biological sample analysis [10]. While an HPLC-UV method was developed for analytical solutions, the LC-MS/MS method achieved detection in rat plasma across 1.25-1250 ng/mL, highlighting MS's advantage for complex biological matrices where sensitivity and specificity requirements exceed UV capabilities [10].
Experimental Protocols and Methodologies
HPLC-UV Method Development Protocol
Instrument Conditions Based on Pharmaceutical Method [9]:
- Column: Inertsil ODS-3 C18 (250 × 4.6 mm, 5 μm)
- Mobile Phase: Methanol:water (15:85 v/v), isocratic
- Flow Rate: 1.5 mL/min
- Detection: 210 nm
- Injection Volume: 20 μL
- Temperature: Ambient (25°C)
Wavelength Selection Strategy: Initial method development should incorporate DAD detection to identify optimal monitoring wavelengths. For compounds with low wavelength absorption, consider solvent transparency and mobile phase additives to minimize background noise [3]. Modern instruments allow λmax selection without significant robustness concerns, though regular wavelength verification using calibrants remains recommended [4].
Mobile Phase Optimization: Solvent polarity significantly impacts UV spectra through bathochromic (red) or hypsochromic (blue) shifts [4]. For π→π* transitions, polar solvents like ethanol produce longer wavelength maxima compared to nonpolar solvents like hexane [4]. pH effects can be substantial due to equilibrium shifts between molecular forms; buffer selection should consider UV cut-off values to minimize background absorption [3].
HPLC-MS Specificity Testing Protocol
Nucleoside Analysis Methodology [8]:
- System: Agilent 1290 Infinity II UHPLC with 6470 Triple Quadrupole MS
- Column: ZORBAX RRHD Eclipse Plus C18 (2.1 × 50 mm, 1.8 μm)
- Mobile Phase: Water with 0.1% formic acid and methanol with 0.1% formic acid
- Ionization: Electrospray ionization (ESI)
- Detection: Multiple Reaction Monitoring (MRM) mode
MRM Optimization: For each nucleoside, precursor ions are selected in the first quadrupole, fragmented in the second quadrupole with optimized collision energy, and product ions are selected in the third quadrupole [8]. This approach generates unique signature transitions for each compound (e.g., m/z 282→150 for 1-methyladenosine with collision energy 16V) [8].
Table 3: Research Reagent Solutions for HPLC Detection Systems
| Reagent/Component | Function in HPLC-UV | Function in HPLC-MS |
|---|---|---|
| Ammonium Formate | Typically not used | MS-compatible buffer; facilitates ionization |
| Formic Acid | Mobile phase modifier (low UV cut-off: 210 nm) [3] | Ionization enhancer in positive mode |
| Acetonitrile (HPLC-grade) | Low UV cut-off solvent (190 nm) [3] | MS-compatible organic modifier |
| Methanol (HPLC-grade) | Medium UV cut-off solvent (205 nm) [3] | MS-compatible organic modifier |
| Trifluoroacetic Acid | Ion-pairing reagent (UV cut-off: 210 nm) [3] | Generally avoided (ion suppression) |
| Phosphate Buffers | UV-transparent at appropriate pH [3] | Not recommended (non-volatile) |
| Deuterium Lamp | UV light source (190-600 nm) [1] | Not applicable |
| Electrospray Ionization Source | Not applicable | Ionization interface for LC-MS |
The fundamental mechanism of HPLC-UV detection, based on chromophore-dependent light absorption, provides robust, precise quantification for compounds with appropriate UV activity. Its reliability, ease of use, and cost-effectiveness maintain its position as the workhorse detector for pharmaceutical quality control [1].
However, for research applications requiring definitive compound identification, structural elucidation, or analysis of non-chromophoric compounds, HPLC-MS provides superior specificity through mass-based detection [7] [8]. The choice between these detection strategies should be guided by analytical requirements: HPLC-UV for precise quantification of known chromophoric compounds, and HPLC-MS for identification of unknowns, complex mixtures, or compounds lacking chromophores.
Understanding the chromophore dependency of HPLC-UV detection enables appropriate method selection and development, while recognizing situations where HPLC-MS's mass-based specificity provides necessary analytical confidence for research and drug development applications.
The selection of an appropriate detection method is a critical decision in analytical research, directly impacting the reliability, specificity, and efficiency of experimental outcomes. In the realm of specificity testing, particularly for pharmaceutical compounds and their complex matrices, the choice often narrows to two predominant techniques: High-Performance Liquid Chromatography with Ultraviolet detection (HPLC-UV) and High-Performance Liquid Chromatography with Mass Spectrometric detection (HPLC-MS). This guide provides an objective comparison of these two methodologies, focusing on their performance characteristics for specificity testing in research and drug development. We will dissect their fundamental principles, present supporting experimental data, and detail the protocols to empower scientists in making an informed selection based on their specific analytical requirements.
Fundamental Principles: UV Detection vs. Mass Spectrometry
The core distinction between HPLC-UV and HPLC-MS lies in their mechanism of detection, which fundamentally dictates their application and performance.
HPLC-UV operates on the principle of light absorption. After chromatographic separation, analytes pass through a flow cell where they are exposed to ultraviolet or visible light. The detector measures the amount of light absorbed at specific wavelengths, which is proportional to the analyte's concentration according to the Beer-Lambert law. This method requires that the analyte possesses a chromophore—a functional group that can absorb UV or visible light [11] [12].
HPLC-MS, in contrast, detects analytes based on their mass-to-charge ratio (m/z). After chromatographic separation and ionization (e.g., via electrospray ionization), the detector measures the mass of the ionized analyte and/or its fragments. This provides a second dimension of selectivity beyond mere retention time, allowing for the definitive identification of compounds based on molecular mass and structural information. This makes MS an "information rich" detection method [12].
Performance Comparison: Experimental Data and Selectivity
Direct comparative studies reveal significant differences in the performance of HPLC-UV and HPLC-MS, particularly concerning specificity, sensitivity, and precision in complex matrices.
Specificity and Accuracy in Complex Matrices
A 2019 study directly compared HPLC and UV-Vis for determining Levofloxacin released from a complex drug-delivery system (mesoporous silica microspheres/nano-hydroxyapatite composite scaffolds). The results demonstrated a clear advantage for HPLC in terms of accuracy when measuring drug concentration in a complex, impure environment [11].
Table 1: Comparison of HPLC and UV-Vis for Levofloxacin Analysis in a Composite Scaffold [11]
| Parameter | HPLC Method | UV-Vis Method |
|---|---|---|
| Regression Equation | y = 0.033x + 0.010 | y = 0.065x + 0.017 |
| Linearity (R²) | 0.9991 | 0.9999 |
| Recovery (Low Conc.) | 96.37 ± 0.50% | 96.00 ± 2.00% |
| Recovery (Medium Conc.) | 110.96 ± 0.23% | 99.50 ± 0.00% |
| Recovery (High Conc.) | 104.79 ± 0.06% | 98.67 ± 0.06% |
The study concluded that UV-Vis was not accurate for measuring drugs loaded onto biodegradable composites due to interference from other scaffold components, which could absorb light at similar wavelengths. HPLC was established as the preferred method for evaluating the sustained release characteristics in this tissue engineering context due to its superior specificity [11].
Another study comparing LC-UV and LC-MS for characterizing impurities in trimethoprim tablets found that although LC-UV is commonly used, LC-MS was a more viable alternative. LC-MS allowed for the simultaneous determination of the molecular masses and structural information of impurities and degradants, enabling better characterization even at low levels [13].
Sensitivity and Precision
The inherent sensitivity of mass spectrometry often provides lower detection limits compared to UV detection. This is particularly crucial for quantifying trace-level impurities or analytes in biological matrices [12].
However, a comparative study on the repeatability of quantitative data found that HPLC-UV can offer better precision in some contexts. The precision for UV peak area detection was on average 2.5% versus 6.8% for MS detection. The study noted that the response factor of the UV detector was more constant, likely due to stable HPLC flow rates, whereas MS response can be more variable [14].
Table 2: General Performance Comparison of HPLC-UV vs. HPLC-MS
| Performance Characteristic | HPLC-UV | HPLC-MS |
|---|---|---|
| Specificity | Moderate (based on Rt & UV spectrum) | High (based on Rt & m/z) |
| Sensitivity | Good for UV-absorbing compounds | Excellent (trace-level detection) |
| Precision (Peak Area) | High (~2.5% RSD) [14] | Moderate (~6.8% RSD) [14] |
| Structural Information | Limited (UV spectrum) | Extensive (Fragmentation patterns) |
| Analyte Requirement | Requires a chromophore | Must be ionizable |
| Tolerance to Complex Matrices | Lower (susceptible to interference) | Higher (with good chromatography) |
| Operational Cost | Lower | Higher (equipment and maintenance) |
Detailed Experimental Protocols
To illustrate the practical application of both techniques, below are detailed methodologies from cited research.
Protocol: HPLC-UV for Ampicillin Quantification in Human Serum
This validated method for therapeutic drug monitoring (TDM) of ampicillin exemplifies a robust HPLC-UV application in a complex biological matrix [15].
Chromatographic Conditions:
- Column: Reversed-phase C18 column (150 × 2 mm, 2.2-µm particle size) with a guard column.
- Mobile Phase: Eluent A: 0.1% formic acid in water; Eluent B: 0.1% formic acid in acetonitrile.
- Gradient Elution: Detailed gradient program increasing the percentage of Eluent B over the run.
- Flow Rate: Not specified, but typical for a 2 mm i.d. column is ~0.2-0.4 mL/min.
- Column Temperature: 50°C.
- Detection: UV detection at 210 nm.
- Injection Volume: 20 µL.
- Run Time: 12.5 minutes.
Sample Preparation:
- Protein Precipitation: Mix 100 µL of human serum with 200 µL of internal standard (IS) solution (caffeine in acetonitrile:methanol, 1:1).
- Vortex and Centrifuge: Vortex the mixture for 10 seconds and centrifuge at 8000 × g for 3 minutes.
- Dilution: Transfer 100 µL of the supernatant and dilute with 600 µL of water. Vortex for 10 seconds to mix.
- Analysis: Inject the prepared sample into the HPLC-UV system.
Validation Data: The method was linear from 2–128 mg/L. Both inter-day and intra-day accuracy and precision (CV) were less than 10% [15].
Protocol: HPLC-MS/MS for High-Throughput Screening
This protocol outlines a general approach for using HPLC-MS/MS in a high-throughput screening (HTS) setting for hit generation, such as reaction screening in drug discovery [16] [17].
Chromatographic Conditions (Fast UHPLC-MS):
- Column: Short column packed with sub-2-µm particles.
- Gradient: Fast gradient elution (can be as short as <1 minute).
- Flow Rate: Optimized for high speed and resolution.
- Detection: Triple quadrupole mass spectrometer operating in Multiple Reaction Monitoring (MRM) mode.
Sample Preparation:
- Reaction Quenching: The biochemical reaction is stopped using a volatile reagent. A common stop reagent is acetonitrile or methanol, often at a 1:1 to 1:4 sample-to-solvent ratio. This also precipitates proteins.
- Addition of Internal Standard: An isotopically labeled analog of the analyte is ideal and is added with the stop reagent to normalize the analyte response.
- Clean-up: Centrifuge or filter the plate to remove precipitated proteins before analysis.
Key MS Parameters:
- Ionization Mode: Typically electrospray ionization (ESI) in positive or negative mode.
- MRM Transitions: Unique parent ion > product ion transitions are established for the substrate and product.
- Source Conditions: Source temperature and gas flow rates are set high to handle the rapid analysis and high flow rates.
The Scientist's Toolkit: Essential Research Reagents and Materials
The following table details key reagents and materials essential for implementing the HPLC-UV and HPLC-MS protocols described above.
Table 3: Essential Research Reagents and Materials for HPLC-UV and HPLC-MS
| Item | Function/Purpose | Example/Notes |
|---|---|---|
| C18 Reverse-Phase Column | Chromatographic separation of analytes. | Varying lengths and particle sizes; e.g., 150 mm for standard HPLC-UV, shorter columns with sub-2-µm particles for UHPLC-MS [18] [15]. |
| Volatile Buffers | Mobile phase component for pH control. | HPLC-MS: Ammonium acetate, ammonium bicarbonate, or 0.1% formic acid are preferred for their volatility [17]. HPLC-UV: Phosphate buffers (e.g., KH₂PO₄) are common [11]. |
| HPLC-Grade Solvents | Mobile phase components. | Acetonitrile and methanol are standard. Water must be ultra-pure (e.g., 18.2 MΩ·cm) [15]. |
| Internal Standard (IS) | Normalizes analyte response for variability. | HPLC-MS: Ideal IS is an isotopically labeled analog of the analyte [17]. HPLC-UV: A structurally similar compound (e.g., Ciprofloxacin as IS for Levofloxacin) can be used [11]. |
| Protein Precipitation Solvents | Sample clean-up for biological matrices. | Acetonitrile or methanol, often mixed with the sample in a 1:1 to 1:4 ratio [17] [19]. |
| Nitrogen Blowdown System | Concentrates samples by evaporating solvent. | Uses inert nitrogen gas to prevent oxidation; crucial for preparing low-concentration samples for HPLC-MS/MS [19]. |
Application Scenarios: When to Use Which Technique
Choosing between HPLC-UV and HPLC-MS depends heavily on the analytical goal, sample complexity, and available resources.
HPLC-UV is the preferred choice when:
- The analytes have strong chromophores and are present at relatively high concentrations.
- The sample matrix is simple, with minimal risk of co-eluting, UV-absorbing interferents.
- The project requires a cost-effective and robust method for routine, high-precision quantification [15] [14].
- The application is for therapeutic drug monitoring (TDM) of drugs like ampicillin where a validated, straightforward method is sufficient [15].
HPLC-MS is necessary when:
- Analyzing high-complexity samples (e.g., biological fluids, tissue extracts, reaction mixtures) where UV selectivity is insufficient [11] [19].
- Detecting and quantifying trace-level analytes (impurities, metabolites) requires high sensitivity and specificity [12] [19].
- Structural elucidation or definitive identification of unknowns is required [13] [12].
- Facing high-throughput requirements where the superior selectivity of MS can allow for shorter run times without sacrificing data quality, despite the higher instrument cost [16] [19].
The power of mass spectrometry as a detection method lies in its unparalleled selectivity based on the mass-to-charge ratio (m/z), providing a definitive tool for identification and quantification in complex matrices. HPLC-UV remains a highly precise, cost-effective, and accessible workhorse for many routine analyses where specificity is not compromised. The decision between the two is not a matter of one being universally superior, but rather a strategic choice based on the specific analytical question. Researchers must weigh the requirements for specificity, sensitivity, and structural information against operational constraints like cost and throughput. By understanding the comparative data and practical protocols outlined in this guide, scientists can optimally leverage these powerful techniques to advance their specificity testing research and drug development projects.
In high-performance liquid chromatography (HPLC), the detection system is paramount for quantifying and identifying separated compounds. Detectors are broadly categorized based on their fundamental response mechanism: concentration-sensitive detectors, such as Ultraviolet (UV) detectors, measure a property proportional to the concentration of analyte in the flow cell, whereas mass-sensitive detectors, like Mass Spectrometry (MS), respond to the mass or mass-flow rate of the analyte entering the detector [20]. This fundamental distinction influences every aspect of analytical performance, from sensitivity and selectivity to operational requirements and application suitability.
UV detectors function by measuring the absorption of ultraviolet or visible light by chromophoric compounds in the eluted mixture as it passes through a flow cell. The signal depends on the analyte's concentration, pathlength of the flow cell, and its molar absorptivity according to the Beer-Lambert law [1]. In contrast, MS detectors ionize the analyte molecules and separate them based on their mass-to-charge ratio (m/z). The signal generated is proportional to the number of ions detected, making it fundamentally a mass-flow sensitive device [20]. This core difference in detection principle establishes a foundation for their contrasting performances in specificity testing research, particularly in pharmaceutical development.
Comparative Performance Characteristics
Quantitative Comparison of Key Parameters
The following table summarizes the critical performance characteristics of UV and MS detectors, highlighting their operational differences and typical capabilities.
Table 1: Performance Comparison of HPLC-UV and HPLC-MS Detectors
| Performance Characteristic | HPLC-UV Detector | HPLC-MS Detector |
|---|---|---|
| Detection Principle | Concentration-sensitive [20] | Mass-sensitive/Mass-flux sensitive [20] |
| Typical Sensitivity | Nanogram to picogram range [21] | Picogram to femtogram range (1000x more sensitive than UV) [21] |
| Key Selectivity Mechanism | Wavelength specificity, column separation [22] | Molecular mass, fragmentation patterns, high-resolution mass accuracy [23] [21] |
| Response Factors | Varies significantly with analyte's chromophore [1] | More uniform response, though subject to ion suppression [21] |
| Quantitative Precision | High precision (<0.2-3.1% RSD) [20] [1] | Good precision (0.5-7.5% RSD), but can be affected by matrix effects [20] |
| Inherent Instrument Noise | Low noise (±1×10⁻⁵ AU benchmark) [1] | Chemical noise from matrix, higher background in complex samples [13] |
Analysis of Sensitivity and Selectivity
Sensitivity advantages of MS are profound, often providing a 1000-fold improvement over UV detection [21]. This enables MS to detect trace-level impurities and metabolites that are invisible to UV. For instance, a study on diclofenac in microdialysis samples found that LC-MS offered a limit of quantification of 1 ng/mL, compared to only 10 ng/mL for LC-UV [24]. Furthermore, MS can detect compounds with poor chromophores, providing a more complete analytical picture [23].
Selectivity represents another area where MS excels. While UV detection relies on retention time and a limited spectral fingerprint for identification, MS provides a multi-dimensional identifier based on molecular mass and a unique fragmentation pattern [23]. Even for co-eluting compounds with identical UV spectra, MS can readily distinguish them if they have different masses [23]. High-resolution MS instruments can differentiate compounds with mass differences of less than 0.001 atomic mass units [21]. A comparative study on trimethoprim tablets confirmed that although LC-UV is common, LC-MS with modern algorithms better detected low-level impurities and provided simultaneous determination of molecular masses and structural information [13].
Quantitative Reliability and Reproducibility
Despite the superior sensitivity and selectivity of MS, UV detection often demonstrates exceptional quantitative precision, especially for routine analyses of high-concentration analytes in pure solvents. UV detectors are concentration-sensitive devices whose peak areas are inversely proportional to the flow-rate, but they are not subject to the ionization suppression effects that can plague MS quantification [20]. For regulated pharmaceutical quality control where precision is paramount (e.g., potency specifications of 98.0-102.0%), the high precision of UV detection (<0.2% RSD) makes it the undisputed workhorse [1].
MS quantification can show more significant variation due to its destructive nature and progressive performance degradation as the source becomes contaminated [25]. Forum discussions highlight real-world challenges where HPLC-UV provided stable results (e.g., 50 ppm consistently), while MS quantification of the same sample varied widely (e.g., from 50 ppm to 15 ppm) on different days, likely due to source contamination from previous samples [25]. This underscores the importance of careful calibration and maintenance for reliable MS quantification.
Experimental Protocols and Methodologies
Representative HPLC-UV Methodology
A developed and validated HPLC-UV method for a novel aminothiazole (21MAT) exemplifies a robust protocol for analytical solutions [10]. The methodology employed an isocratic elution on a reverse-phase Phenomenex Luna C18 column (50 mm × 4.6 mm, 5 μm). The mobile phase consisted of 55% 0.1% v/v orthophosphoric acid in water and 45% orthophosphoric acid in acetonitrile, delivered at a flow rate of 1 mL/min. Detection was performed at 272 nm. This method was partially validated as per industrial standards and proved suitable for quantifying the analyte in various in vitro experimental samples, demonstrating the application of UV detection for compound-specific analysis in drug discovery [10].
Another study detailing the determination of diclofenac in microdialysis samples used HPLC with UV detection at 280 nm. While this method achieved a limit of quantification of 10 ng/mL, it ultimately failed to reliably determine diclofenac in biological matrices, producing both false positive and false negative results. This limitation underscores a key weakness of UV detection when applied to complex biological samples where interfering compounds may co-elute with the target analyte [24].
Representative LC-MS/MS Methodology
The same research group that developed the HPLC-UV method for 21MAT also established a complementary LC-MS/MS method for quantification in rat plasma, highlighting the progression to more complex matrices [10]. The bioanalytical method used protein precipitation for sample extraction. Chromatographic separation was achieved on a reverse-phase Waters Xterra RP C18 column (150 mm × 4.6 mm, 5 μm) with a mobile phase consisting of a mixture of 95:5% v/v methanol:acetonitrile and 0.1% v/v formic acid, along with 15% of 5 mM ammonium formate solution, at a flow rate of 1 mL/min.
The mass spectrometric detection employed electrospray ionization (ESI) in multiple reaction monitoring (MRM) mode. The method was fully validated according to regulatory guidelines, with all parameters—including specificity, selectivity, accuracy, precision, recovery, and stability—evaluated in rat plasma. The method demonstrated linearity over a wide concentration range of 1.25–1250 ng/mL, showcasing the superior sensitivity and specificity required for bioanalytical applications [10].
Table 2: Essential Research Reagent Solutions for HPLC-UV and HPLC-MS
| Reagent/Consumable | Function in Analysis | Example from Literature |
|---|---|---|
| Reverse-Phase C18 Column | Separates compounds based on hydrophobicity. | Phenomenex Luna C18 (HPLC-UV), Waters Xterra RP C18 (LC-MS) [10] |
| Ammonium Formate/Formic Acid | MS-compatible mobile phase modifiers that enhance ionization. | 5 mM Ammonium formate with 0.1% formic acid [10] |
| Orthophosphoric Acid | UV-compatible mobile phase modifier for pH control. | 0.1% v/v orthophosphoric acid in water [10] |
| Methanol & Acetonitrile (HPLC/MS Grade) | Organic solvents for the mobile phase. | Used in both HPLC-UV and LC-MS methods [10] |
| Perchloric Acid with Dithiothreitol (DTT) | Protein precipitation and stabilization agent in sample preparation. | Used in RBC lysate preparation for azathioprine metabolite analysis [26] |
Detection Workflows and Decision Pathways
The fundamental operational differences between concentration-sensitive and mass-sensitive detectors lead to distinct analytical workflows. The following diagram illustrates the basic signaling pathways for both UV and MS detection.
Diagram 1: Fundamental signaling pathways for UV and MS detectors.
For researchers deciding between these technologies, the following decision pathway can guide the selection process based on analytical needs and constraints.
Diagram 2: Detector selection decision pathway for analytical applications.
Application Context in Pharmaceutical Research
In pharmaceutical specificity testing and drug development, the choice between HPLC-UV and HPLC-MS is often dictated by the stage of research and the specific analytical question. HPLC-UV remains the gold standard for quality control laboratories due to its high precision, reliability, and lower operational costs [1]. It is exceptionally well-suited for the analysis of drug substances and products where chromophores are present, and concentrations are relatively high, such as in potency assays (specifications of 98.0-102.0%) and related substance tests per ICH guidelines [1].
HPLC-MS, particularly tandem MS (MS/MS), has become indispensable in earlier research stages. Its superior sensitivity and selectivity make it ideal for detecting and characterizing low-level impurities and degradants [13], identifying metabolites in complex biological matrices like plasma [10] [24], and conducting high-throughput ADMET (Absorption, Distribution, Metabolism, Excretion, and Toxicity) screening [10]. While MS can be less precise for quantifying high concentrations and requires more expertise to operate and maintain, its ability to provide definitive structural information often makes it the only viable tool for specific research applications [25] [21].
The comparison between concentration-sensitive UV detectors and mass-sensitive MS detectors reveals a clear landscape of complementary strengths. HPLC-UV provides robust, precise, and cost-effective quantification for chromophoric compounds, making it ideal for regulated quality control environments. In contrast, HPLC-MS offers unparalleled sensitivity, selectivity, and structural elucidation capabilities, indispensable for research involving trace analysis, complex matrices, and unknown identification. The choice is not a matter of which technology is universally superior, but rather which is optimally suited to the specific analytical requirements, sample characteristics, and operational constraints of the pharmaceutical research or testing program.
The Critical Role of Specificity in Pharmaceutical Impurity Profiling and Stability-Indicating Assays
Specificity is a fundamental parameter for any analytical method used in pharmaceutical development. It is the ability to measure the analyte of interest accurately and specifically in the presence of other components that may be expected to be present, such as impurities, degradation products, and excipients [27]. For stability-indicating assays and impurity profiling, which are mandatory for regulatory compliance, specificity ensures that the active pharmaceutical ingredient (API) can be resolved from all potential impurities and degradants, providing a true representation of drug product quality and stability [28] [27]. This guide objectively compares the specific capabilities of two core analytical techniques—High-Performance Liquid Chromatography with Ultraviolet detection (HPLC-UV) and High-Performance Liquid Chromatography with Mass Spectrometric detection (HPLC-MS)—in achieving this critical requirement.
Technique Comparison: HPLC-UV vs. HPLC-MS
The choice between HPLC-UV and HPLC-MS has significant implications for the selectivity, sensitivity, and reliability of impurity profiling. The table below summarizes the core differences between these two techniques.
Table 1: Core Characteristics of HPLC-UV and HPLC-MS for Impurity Profiling
| Characteristic | HPLC-UV | HPLC-MS |
|---|---|---|
| Detection Principle | Absorption of ultraviolet or visible light by chromophores [23] | Measurement of mass-to-charge ratio (m/z) of ionized analytes [23] |
| Primary Selectivity Basis | Retention time and UV spectrum [23] | Retention time and molecular mass (and fragmentation pattern with MS/MS) [29] |
| Sensitivity | Good for chromophoric compounds [23] | Inherently higher; can detect components with poor chromophores and co-eluting compounds at levels of 0.1% [23] |
| Quantitative Precision | High (0.1–0.5% RSD); entire sample passes through the flow cell [28] [25] | Can be lower than UV (<1% RSD difficult); analysis is destructive and instrument performance can degrade [28] [25] |
| Handling Co-elution | Limited ability; similar retention times and UV spectra make distinction extremely difficult [23] | High ability; can distinguish co-eluting peaks based on mass difference, even with identical retention times [23] |
| Information Output | Chromatogram with peak retention time and area [27] | Chromatogram and mass spectrum providing structural information [30] |
Experimental Data and Case Studies
Direct Comparison of Performance
A direct comparative study of diclofenac analysis in microdialysis samples found that while both methods offered low limits of quantification, the HPLC-UV method failed to determine diclofenac reliably in biological matrices, yielding both false positive and false negative results. In contrast, HPLC-MS was deemed "clearly superior" due to its more selective detection, increased sensitivity, and shorter run times [24].
Impurity Profiling with HPLC-MS
Hyphenated techniques like LC-MS are pivotal for modern impurity profiling. In the analysis of the antimalarial drug lumefantrine, HPLC-DAD/UV-ESI/ion trap/MS was used to establish a comprehensive impurity profile. This approach enabled the identification and characterization of several new impurities, including a specified degradant (desbenzylketo derivative, DBK), which would have been far more challenging with UV detection alone [30]. The workflow exemplifies the power of coupled techniques: UV detection provides quantification, while MS detection delivers identification [30].
Stability-Indicating Methods and Genotoxic Impurity Control
The development of a stability-indicating UHPLC-UV-MS method for lenalidomide highlights MS's critical role in ensuring drug safety. The method was designed to separate the API from eleven potential impurities. Notably, it was validated to monitor a genotoxic impurity (Impurity G) at a control limit of 60 ppm, aligning with the stringent requirements of ICH M7 guidelines. The mass spectrometer provides the specificity and sensitivity needed to reliably detect and identify such hazardous impurities at very low levels, a task that pushes UV detection to its limits [29].
Essential Workflows and Research Toolkit
Impurity Profiling and Identification Workflow
The general workflow for impurity profiling using hyphenated techniques involves sample preparation, chromatographic separation, and parallel detection to enable both quantification and identification.
The Scientist's Toolkit: Key Reagents and Materials
The table below lists essential materials and reagents commonly used in developing and executing HPLC-UV and HPLC-MS methods for impurity profiling, based on the protocols cited.
Table 2: Essential Research Reagents and Materials for Impurity Profiling
| Item | Function / Application | Example from Literature |
|---|---|---|
| C18 Reversed-Phase Column | The most common stationary phase for separating compounds based on hydrophobicity [28]. | Purospher STAR RP-18 [30]; Chromolith HighResolution RP-18 [31] |
| Acetonitrile & Methanol | Organic modifiers used in the mobile phase to control elution strength in reversed-phase HPLC [28]. | Used in gradient elution for lumefantrine [30] and lenalidomide [29] analysis. |
| Acid Additives (Formic, Acetic) | Mobile phase additives that improve peak shape by suppressing silanol interactions and controlling ionization [28]. | 0.1% formic acid in lenalidomide method [29]. |
| Ammonium Acetate / Formate | Volatile buffers compatible with MS detection; provide pH control without causing ion source contamination [29]. | Ammonium acetate buffer in ezetimibe and flibanserin methods [27]. |
| Solid-Phase Extraction (SPE) | A sample preparation technique to clean up and concentrate analytes from complex matrices like serum [31]. | Monolithic C18-silica disk cartridge (MonoSpin C18) for serum drug analysis [31]. |
| Forced Degradation Reagents | Chemicals used in stress testing to intentionally degrade a drug and generate potential impurities for method validation [27]. | HCl, NaOH, H₂O₂ used for hydrolytic and oxidative stress studies [29]. |
The choice between HPLC-UV and HPLC-MS for impurity profiling is not a matter of one being universally "better" than the other, but rather of selecting the right tool for the specific analytical challenge. HPLC-UV remains a highly reliable, precise, and cost-effective workhorse for quantifying APIs and major impurities, especially in well-defined and controlled environments [28]. However, for methods requiring unambiguous identification of unknown impurities, resolution of complex co-eluting peaks, or detection of non-chromophoric and genotoxic impurities at very low levels, HPLC-MS is unequivocally superior [24] [23] [29]. The trend towards hyphenated UHPLC-UV-MS systems offers a powerful compromise, leveraging the robust quantification of UV with the exceptional specificity of MS to create truly comprehensive and stability-indicating methods that meet modern regulatory standards [29].
For researchers and scientists in drug development, selecting the appropriate analytical technique is pivotal for generating reliable and meaningful data. High-Performance Liquid Chromatography (HPLC) is a cornerstone technology, yet the choice of detector fundamentally impacts method capabilities and limitations. This guide provides an objective comparison between UV and Mass Spectrometry (MS) detection, focusing on two inherent challenges: detecting compounds with weak UV chromophores and mitigating matrix effects. These factors are critical for method specificity, accuracy, and successful application in regulatory submissions.
The "matrix effect" is a well-known phenomenon where components in the sample other than the analyte can alter the detector's response, potentially compromising quantification accuracy. This is particularly challenging in complex matrices like plasma, where interfering compounds can co-elute with the analyte [32]. Furthermore, the fundamental requirement for a compound to possess a chromophore for UV detection presents a significant limitation for certain molecules in drug discovery [23].
Technical Comparison: HPLC-UV vs. HPLC-MS
The core differences between HPLC-UV and HPLC-MS stem from their fundamental detection principles. UV detection relies on the absorption of ultraviolet light by analytes, while MS detection separates and detects ions based on their mass-to-charge ratio (m/z). This distinction leads to a clear divergence in their strengths and weaknesses, particularly regarding the challenges of chromophores and matrix interference.
Table 1: Core Technical Characteristics and Performance Data
| Feature | HPLC-UV | HPLC-MS/MS |
|---|---|---|
| Detection Principle | Absorption of UV-Vis light by chromophores [32] | Measurement of mass-to-charge ratio (m/z) of ions [12] |
| Analyte Requirement | Must contain a UV-absorbing chromophore [23] | Must be capable of ionization |
| Specificity | Lower; relies on retention time and UV spectrum, which can be similar for different compounds [23] | Higher; identifies analytes based on molecular mass and fragmentation pattern [12] |
| Sensitivity (LOQ) | Higher limits of quantification (e.g., 0.5-10 ng for phenolic compounds [33]) | Lower limits of quantification (e.g., 0.007-6.67 ng for phenolic compounds [33]) |
| Quantitative Precision (RSD%) | Generally better; average precision for peak area: ~2.5% [14] | Can be more variable; average precision for peak area: ~6.8% [14] |
| Susceptibility to Matrix Effects | Subject to solvatochromism, where the matrix alters UV absorptivity [32] | Highly susceptible to ionization suppression/enhancement, especially with ESI [32] [34] |
| Structural Information | Limited; provides UV spectrum | Rich; provides molecular weight and fragment patterns for structural elucidation [13] [12] |
Experimental Data and Methodologies
Case Study: Impurity Characterization in Trimethoprim
A comparative study characterized impurities in trimethoprim tablets using an in-line LC-UV-MS system. While chemical noise was higher in full-scan LC-MS, low-level impurities were better detected by MS when modern software algorithms like the "component detection algorithm" (CODA) were employed. Crucially, LC-MS provided simultaneous determination of the molecular masses and structural information of the impurities, a capability not available with UV detection alone [13].
Protocol Summary:
- System: In-line LC-UV-MS with atmospheric pressure chemical ionization (APCI).
- Chromatography: Reversed-phase gradient HPLC.
- Data Analysis: Use of CODA and "Contour" chromatogram algorithms for LC-MS data processing to enhance detection of low-abundance components.
Case Study: Quantification of Phenolic Compounds in Apple Juice
A validation study comparing UHPLC-UV and UHPLC-MS/MS for polyphenol quantification provides robust performance data. The results demonstrated an excellent correlation between both methods for major compounds. However, the MS method showed significantly lower Limits of Detection (LOD) and Quantification (LOQ), making it more suitable for trace analysis. The study also noted that inter-day precision (RSD%) was slightly higher for the MS method, consistent with earlier findings on repeatability [33].
Table 2: Validation Data from Polyphenol Quantification Study [33]
| Validation Parameter | UHPLC-UV Performance | UHPLC-MS/MS Performance |
|---|---|---|
| Linearity (R²) | > 0.990 | > 0.989 |
| Limit of Detection (LOD) | 0.33 - 4 ng | 0.003 - 2 ng |
| Limit of Quantification (LOQ) | 0.5 - 10 ng | 0.007 - 6.67 ng |
| Intra-day Precision (RSD%) | < 4.0% (for most compounds) | < 5.8% (for most compounds) |
| Inter-day Precision (RSD%) | 2.6% - 11.6% | 3.0% - 10.0% |
| Recovery (%) | 94.3% - 110.4% | 91.2% - 113.3% |
Protocol Summary:
- Sample Prep: Apple juice diluted with an equal volume of MeOH with 1% acetic acid for stability.
- Chromatography: UHPLC separation over 35 minutes to resolve major phenolic compounds.
- UV Detection: PDA detector.
- MS Detection: ESI-triple quadrupole in Selected Reaction Monitoring (SRM) mode.
Assessing and Mitigating Matrix Effects
Matrix effects are a critical method validation parameter, especially for LC-MS. The following workflow is commonly used for their assessment and mitigation.
The internal standard method, particularly using a stable isotope-labeled analog of the analyte, is one of the most potent ways to compensate for matrix effects. This standard experiences nearly identical ionization suppression/enhancement as the analyte, allowing for accurate correction [32] [34]. Other strategies include improving sample clean-up to remove interfering compounds and optimizing chromatographic conditions to separate the analyte from the region of ion suppression [34].
The Scientist's Toolkit: Essential Research Reagents & Materials
Table 3: Key Reagents and Materials for HPLC-UV and HPLC-MS Analysis
| Item | Function / Purpose | Considerations for Use |
|---|---|---|
| Stable Isotope-Labeled Internal Standard | Compensates for variable MS matrix effects and losses during sample preparation [32] [34]. | Ideally, the isotope label should be 4+ Da mass shift from the analyte. Should be added to the sample as early as possible in preparation. |
| High-Purity Mobile Phase Additives | Used in LC-MS mobile phases to facilitate analyte ionization and maintain system cleanliness. | MS-grade formic acid, ammonium formate, and ammonium acetate are common. Avoid non-volatile buffers (e.g., phosphate) which can contaminate the ion source [10]. |
| Protein Precipitation Solvents | A rapid sample clean-up technique for biological matrices like plasma. | Solvents like acetonitrile or methanol with 0.1% formic acid are typical. Can concentrate matrix phospholipids, potentially worsening ME [34]. |
| Solid-Phase Extraction (SPE) Cartridges | A more selective sample clean-up method to remove matrix interferences. | Choice of sorbent (e.g., C18, ion-exchange) is analyte-dependent. Can significantly reduce matrix effects if interfering compounds are selectively removed [34]. |
| Blank Matrix | Essential for method development and validation to assess specificity and matrix effects. | Used in the post-extraction spike method to calculate Matrix Factor (MF). For endogenous analytes, a surrogate matrix may be required [34]. |
The choice between HPLC-UV and HPLC-MS is not a matter of one being universally superior, but rather of selecting the right tool for the specific analytical question and context.
- HPLC-UV remains a robust, cost-effective choice for quantifying analytes with good chromophores in relatively clean matrices, offering excellent quantitative precision and operational simplicity [14]. Its key limitations are its inability to detect molecules without a chromophore and its lower specificity in complex samples.
- HPLC-MS provides superior specificity, sensitivity, and the ability to characterize chemical structure [13] [12] [23]. It is the definitive solution for detecting weak or non-chromophoric compounds. However, this power comes with increased complexity, cost, and a heightened susceptibility to matrix effects that must be carefully managed through rigorous method validation and the use of techniques like internal standardization [32] [34].
For researchers, the decision pathway is clear: UV detection is sufficient for many routine analyses of well-characterized compounds. In contrast, MS is indispensable for method development of complex molecules, trace-level impurity profiling, and bioanalytical work in complex matrices, where its advantages in specificity and sensitivity are critical.
Application-Based Selection: Implementing HPLC-UV and HPLC-MS in Real-World Scenarios
In the rigorously controlled environment of pharmaceutical quality control (QC), High-Performance Liquid Chromatography with Ultraviolet detection (HPLC-UV) remains a cornerstone technique for the stability testing and assay of active pharmaceutical ingredients (APIs). Its position, however, exists within a broader analytical landscape that increasingly includes sophisticated techniques like HPLC coupled with Mass Spectrometry (HPLC-MS). HPLC-UV's dominance is no accident; it offers a powerful combination of precision, robustness, and regulatory acceptance that makes it indispensable for routine QC laboratories. A fundamental strength lies in its exceptional quantitative precision, with relative standard deviations (RSDs) for peak areas routinely achievable at <0.1% in ultra-high-performance liquid chromatography (UHPLC) formats and between 0.2–0.3% for standard HPLC, a level of reproducibility that is paramount for establishing product shelf life [35]. Furthermore, HPLC-UV methods are celebrated for their robustness, yielding highly reproducible assays across different laboratories, instruments from various vendors, and columns from different batches [35].
Despite these strengths, the technique's limitations, particularly its reliance on chromophores and lower specificity compared to MS detection, define its appropriate application scope. This guide provides an objective comparison between HPLC-UV and HPLC-MS, framing them within the context of specificity testing research to help scientists select the optimal tool for high-precision QC applications.
Technique Comparison: HPLC-UV vs. HPLC-MS
The choice between HPLC-UV and HPLC-MS is a critical one, hinging on the specific requirements of the analysis. The core difference lies in the detection principle: UV detectors measure a compound's ability to absorb ultraviolet light, while mass spectrometers separate and detect ions based on their mass-to-charge ratio. This fundamental distinction leads to a clear divergence in strengths and applications.
Table 1: Core Characteristics of HPLC-UV and HPLC-MS
| Characteristic | HPLC-UV | HPLC-MS |
|---|---|---|
| Detection Principle | Concentration-sensitive [20] | Mass-flux sensitive [20] |
| Specificity | Moderate (based on retention time and UV spectrum) | High (based on retention time, mass, and fragmentation pattern) |
| Sensitivity (LOQ) | ~0.01% for impurities (e.g., 10 ng/mL for diclofenac) [24] [35] | Superior (e.g., 1 ng/mL for diclofenac) [24] |
| Linear Dynamic Range | Wide (e.g., 10–100 µg/mL for Levetiracetam) [9] | Wide, but can be affected by ion suppression |
| Impact of Flow Rate | Peak area is inversely proportional to flow-rate fluctuations [20] | Peak area is independent of flow-rate [20] |
| Best Applications | API assay, dissolution testing, content uniformity, stability-indicating methods for formulated products | Bioanalysis, impurity identification, trace analysis, metabolomics, complex matrices |
For specificity testing, the superior performance of HPLC-MS becomes evident in complex matrices. A direct comparative study on diclofenac in microdialysis samples concluded that HPLC-MS is clearly superior to HPLC-UV due to a much more selective detection, as the HPLC-UV method produced both false positive and false negative results in biological matrices [24]. HPLC-MS provides an additional dimension of specificity through fragmentation, allowing for the definitive identification of unknown impurities or degradants that co-elute with other compounds, a task where HPLC-UV may struggle.
Experimental Data and Performance Comparison
Quantitative data from direct comparative studies highlights the performance gap and the respective suitability of each technique.
Table 2: Quantitative Performance Comparison from Literature
| Study Context | HPLC-UV Performance | HPLC-MS Performance | Reference |
|---|---|---|---|
| Diclofenac in Microdialysis | LLOQ: 10 ng/mL; Accuracy: 94.0–126.7% | LLOQ: 1 ng/mL; Accuracy: 89.3–110.9% | [24] |
| Repeatability (Peak Area RSD) | RSDs ranged from 1.2% to 3.1% (at 500 ng level) | RSDs ranged from 0.5% to 1.8% (at 100 ng level) | [20] |
| Simultaneous API Assay (Piracetam, Gabapentin, Levetiracetam) | Linear range: 10.0–100.0 µg/mL; Successful for formulated product assay | Not Applicable (Method not needed for this QC application) | [9] |
| Analysis of Fat-Soluble Vitamins | Precision: 2–4% (Recovery studies) | Precision: 6–7% (with particle beam ionization) | [20] |
The data confirms that while HPLC-MS generally offers lower limits of quantification and excellent precision, HPLC-UV can demonstrate exceptional precision in its domain of application, sometimes even surpassing early MS interfaces as seen in the vitamin analysis [20]. For the simultaneous assay of three neuromodulating drugs in their pharmaceutical formulations, a well-developed HPLC-UV method was entirely sufficient, demonstrating its enduring power for routine QC of APIs [9].
Experimental Protocols for HPLC-UV in QC
Stability-Indicating Assay for a Tablet Formulation
The chromatograms and operating conditions from a stability study are exemplary of a standard, yet highly effective, stability-indicating HPLC-UV method [35].
- **
- Column: 100 mm × 3.0 mm, 2-µm dp ACE Excel 2 C18.
- Mobile Phase: A: 20 mM ammonium formate (pH 3.7); B: 0.05% formic acid in acetonitrile.
- Gradient: 5→15% B in 2 min, 15→40% B in 10 min, 40→90% B in 1 min.
- Flow Rate: 0.8 mL/min.
- Temperature: 40 °C.
- Detection: UV absorbance at 280 nm.
- Injection Volume: 3 µL.
- Sample Preparation: Tablet extract in 20% acetonitrile in 0.1 N HCl.
This method successfully separated the API from its process impurities (diastereomers) and key degradants, enabling precise tracking of their levels over time to establish product shelf life [35].
Simultaneous Assay of Multiple APIs
A published multi-task HPLC-UV method for Piracetam (PIR), Gabapentin (GBP), and Levetiracetam (LEV) showcases the technique's capability for product quality checks [9].
- **
- Column: 250 mm × 4.6 mm, 5.0 µm Inertsil ODS-3 C18.
- Mobile Phase: Isocratic mixture of methanol and water (15:85, v/v).
- Flow Rate: 1.5 mL/min.
- Temperature: Ambient.
- Detection: UV at 210.0 nm.
- Injection Volume: 20.0 µL.
- Linearity: 10.0–100.0 µg/mL for PIR and LEV; 30.0–1000.0 µg/mL for GBP.
The method was validated and successfully applied for the determination of the drugs in their respective pharmaceutical formulations, content uniformity, and dissolution testing [9].
The Scientist's Toolkit: Essential Reagents and Materials
Table 3: Key Research Reagent Solutions for HPLC-UV Method Development
| Item | Function / Application | Example from Literature |
|---|---|---|
| C18 Reverse-Phase Column | The workhorse stationary phase for separating a wide range of non-polar to moderately polar compounds. | Inertsil ODS-3 C18, 250 × 4.6 mm, 5.0 µm [9] |
| ACE Excel 2 C18 Column | A modern, high-efficiency UHPLC column for faster and higher-resolution separations. | 100 mm × 3.0 mm, 2-µm dp [35] |
| Ammonium Formate Buffer | A volatile buffer salt compatible with MS detection; provides pH control for separation of ionizable compounds. | 20 mM ammonium formate (pH 3.7) [35] |
| Formic Acid | A common mobile phase additive to improve chromatographic peak shape and provide a source of protons in positive ion MS. | 0.05% formic acid in acetonitrile [35] |
| HPLC-Grade Methanol & Acetonitrile | High-purity solvents used as the organic modifier in the mobile phase to elute compounds from the column. | Used in isocratic (15:85 v/v MeOH:H₂O) [9] and gradient elution [35] |
| Derivatization Reagent (e.g., Benzoyl Isocyanate) | Used to introduce a chromophore into molecules with low UV absorptivity, enabling their detection. | Used for sterol analysis to form UV-absorbing carbamates [5] |
Method Selection and Workflow
The decision to use HPLC-UV or HPLC-MS is not merely a question of which is "better," but which is the most fit-for-purpose. The following workflow visualizes the key decision points.
The field of liquid chromatography continues to evolve, with trends pointing toward greater digitization, sustainability, and performance. The Pistoia Alliance's methods database project is pioneering instrument and vendor-agnostic digital transfer of machine-readable HPLC methods using the Allotrope Data Format [36]. This initiative aims to eliminate manual data entry, reduce errors, and improve method reproducibility, directly benefiting standardized QC workflows. Furthermore, the drive for green analytical chemistry is leading to the development of more sustainable methods, such as those using greener derivatization reagents or reduced solvent consumption [9] [5].
In conclusion, HPLC-UV remains a powerful, robust, and precise tool for the QC laboratory, particularly for the stability testing and assay of active ingredients in formulated products. Its strengths of exceptional quantitative precision, robustness, and lower operational complexity make it the default choice for many high-precision routine applications. HPLC-MS, with its superior specificity and sensitivity, is the unequivocal technique for challenging analyses involving complex matrices, structural elucidation, and trace-level quantification. The informed scientist must therefore consider the specific analytical question, matrix, and regulatory requirements to select the most appropriate and effective tool, leveraging the enduring strengths of HPLC-UV while recognizing the powerful capabilities of HPLC-MS.
High-performance liquid chromatography (HPLC) coupled with different detection systems is fundamental to modern bioanalysis, enabling the quantification of drugs and metabolites in complex biological matrices. The selection between ultraviolet detection (UV) and tandem mass spectrometry (MS/MS) represents a critical decision point that balances selectivity, sensitivity, cost, and operational requirements. While HPLC-UV relies on the detection of a compound's inherent absorbance of ultraviolet light, HPLC-MS/MS identifies compounds based on their mass-to-charge ratio and fragmentation patterns, offering an additional dimension of specificity [24] [31].
This comparison guide objectively evaluates the performance of these two techniques within the context of specificity testing research. For drug development professionals and researchers, understanding the distinct capabilities, limitations, and appropriate application domains of each technology is essential for designing reliable bioanalytical methods, particularly when quantifying target analytes in challenging matrices like plasma, tissue homogenates, and other biological fluids.
Performance Comparison: Key Technical Differences
The fundamental differences in detection principles between HPLC-UV and HPLC-MS/MS translate directly into divergent performance characteristics, especially when dealing with complex biological samples.
Table 1: Direct Comparison of HPLC-UV and HPLC-MS/MS Performance Characteristics
| Performance Parameter | HPLC-UV | HPLC-MS/MS |
|---|---|---|
| Selectivity & Specificity | Low to Moderate. Based on retention time and UV spectrum; susceptible to matrix interference [24]. | Very High. Based on retention time, parent ion, and fragment ion(s); highly specific via MRM [24] [37]. |
| Sensitivity (LLOQ) | Moderate. Typically in the low ng/mL range (e.g., 10 ng/mL for diclofenac) [24]. | High to Very High. Typically in pg/mL to low ng/mL range (e.g., 1 ng/mL for diclofenac, 0.1 ng/mL for blonanserin) [24] [37]. |
| Analytical Run Time | Longer. Often requires longer run times for sufficient separation of interfering peaks. | Shorter. Faster analysis possible due to superior selectivity (e.g., 2.4 min for PPD, 4 min for blonanserin) [37] [38]. |
| Sample Preparation | Can be more complex. Often requires extensive sample clean-up (e.g., SPE) to reduce matrix interference [31]. | Can be simpler. Techniques like protein precipitation may be sufficient (e.g., for blonanserin) [37]. |
| Operational Cost & Maintenance | Lower. Robust instrumentation, lower initial investment, and simpler maintenance [31]. | Higher. High initial cost, requires specialized operational skills and frequent maintenance [31] [25]. |
| Data Reliability in Complex Matrices | Can be unreliable. Potential for both false positive and false negative results due to co-eluting compounds [24]. | Superior. High specificity minimizes false results, ensuring accurate quantification [24]. |
A pivotal comparative study on the determination of diclofenac in microdialysis samples starkly highlights these performance gaps. The study found that while both methods could be validated with acceptable accuracy, the HPLC-UV method failed in practice when applied to the biological matrix, yielding both false positive and false negative results. In contrast, HPLC-MS/MS was deemed "clearly superior" due to its more selective detection, increased sensitivity, and shorter run times [24].
Experimental Protocols and Methodologies
Representative HPLC-MS/MS Protocol for Drug Quantification in Plasma
The following detailed methodology for the simultaneous determination of blonanserin and its metabolite N-desethyl blonanserin in rat plasma exemplifies a modern, robust HPLC-MS/MS bioanalytical method [37].
- Instrumentation: The analysis was performed using a Shimadzu 20A HPLC system coupled with a Shimadzu LCMS-8040 triple-quadrupole mass spectrometer. Separation was achieved on an Agilent Eclipse Plus C18 column (4.6 × 100 mm, 3.5 μm) maintained at 35°C [37].
- Mobile Phase: A mixture of mobile phase A (methanol and water, 75:25 v/v, with 5 mM ammonium formate) and mobile phase B (acetonitrile with 0.1% formic acid) in a ratio of 15:85 was used. The flow rate was 0.5 mL/min, and the total run time was 4 minutes [37].
- Sample Preparation: A simple protein precipitation procedure was employed. A 100 μL plasma sample was mixed with 20 μL of a deuterated internal standard (N-desethyl blonanserin-d8, 100 ng/mL) and 500 μL of acetonitrile. The mixture was vortexed, centrifuged, and the supernatant was injected [37].
- MS Detection: The mass spectrometer operated in positive electrospray ionization (ESI+) and Multiple Reaction Monitoring (MRM) mode. The specific transitions monitored were m/z 368.10 → 296.90 for blonanserin, m/z 340.15 → 297.05 for N-desethyl blonanserin, and m/z 348.15 → 302.05 for the internal standard [37].
- Validation: The method was validated per guidelines, demonstrating a linear range of 0.1–100.0 ng/mL for both analytes, with accuracy and precision well within acceptance criteria, proving its suitability for a pharmacokinetic study [37].
Representative HPLC-UV Protocol for Therapeutic Drug Monitoring (TDM)
A validated HPLC-UV protocol for routine TDM of drugs like lamotrigine and voriconazole demonstrates the technique's practical application in a clinical setting [31].
- Instrumentation: Analysis was conducted on a Hitachi Chromaster system with a diode-array detector. Separation was performed on a Chromolith HighResolution RP-18 column (100 mm × 4.6 mm i.d.), known for its high efficiency and low backpressure, at 40°C [31].
- Sample Preparation: To enhance selectivity, a solid-phase extraction (SPE) clean-up was essential. Filtered patient serum (150 μL) was loaded onto a monolithic C18-silica disk cartridge (MonoSpin C18). After washing with water, the analyte was eluted with an aqueous solution of 50% acetonitrile [31].
- Detection: The UV detector was set at optimal wavelengths for each drug (e.g., 210 nm for carbamazepine, 305 nm for voriconazole). The method was validated and showed good correlation with both immunoassay and HPLC-MS/MS results for the drugs tested, supporting its use for in-hospital TDM where MS is unavailable [31].
The workflow diagram below illustrates the core procedural steps for both HPLC-UV and HPLC-MS/MS bioanalysis, highlighting their similarities and key differences in the detection phase.
The Scientist's Toolkit: Essential Research Reagent Solutions
Successful bioanalytical method development relies on a suite of key reagents and materials. The following table details essential components and their functions based on the protocols examined.
Table 2: Key Research Reagents and Materials for HPLC-MS/MS Bioanalysis
| Reagent / Material | Function in Bioanalysis | Example from Literature |
|---|---|---|
| Triple Quadrupole Mass Spectrometer | Provides highly selective and sensitive detection via MRM; considered the gold standard for quantitative bioanalysis. | Shimadzu LCMS-8040 [37], API 4000 [38]. |
| C18 Reversed-Phase Chromatography Column | Workhorse column for separating analytes based on hydrophobicity; available in various lengths and particle sizes. | Agilent Eclipse Plus C18 [37], Zorbax C18 [38]. |
| Deuterated Internal Standard (IS) | Corrects for variability in sample preparation and ionization efficiency; improves accuracy and precision. | N-desethyl blonanserin-d8 [37], clopidogrel-d4 [39]. |
| Mass Spectrometry-Grade Solvents & Additives | High-purity solvents and volatile additives (e.g., ammonium formate, formic acid) ensure minimal background noise and stable ionization. | Acetonitrile with 0.1% formic acid [37], 10 mmol/L acetic acid [38]. |
| Solid-Phase Extraction (SPE) Cartridges | For selective sample clean-up and pre-concentration of analytes, reducing matrix effects and improving method robustness. | Monolithic C18-silica disk cartridge (MonoSpin C18) [31]. |
The choice between HPLC-UV and HPLC-MS/MS for specificity testing in bioanalysis is unequivocally dictated by the analytical challenge and required data integrity. HPLC-MS/MS is the unequivocally superior technology for applications demanding high specificity, sensitivity, and reliability in complex matrices like plasma, as proven by its ability to avoid the false results associated with HPLC-UV [24]. Its power lies in the MRM technique on triple quadrupole instruments, which provides a definitive fingerprint for the target analyte, effectively isolating it from biological background noise.
However, HPLC-UV retains a valuable role in clinical settings. For therapeutic drug monitoring (TDM) of specific medications at sufficiently high concentrations and in laboratories where capital and operational costs are primary constraints, a well-optimized HPLC-UV method with rigorous sample clean-up can provide clinically actionable results [31]. Ultimately, the decision is a trade-off: HPLC-MS/MS offers uncompromising data quality for critical research and development, while HPLC-UV provides a cost-effective, practical solution for dedicated, routine analyses where its limitations are not a prohibitive factor.
High-Performance Liquid Chromatography (HPLC) is a cornerstone analytical technique for separating, identifying, and quantifying components in complex mixtures, playing an indispensable role in pharmaceutical, environmental, and biological research [40]. Two critical decisions in HPLC method development are the choice of elution mode—isocratic or gradient—and the selection of a detection system, typically Ultraviolet (UV) or Mass Spectrometric (MS) detection. The optimal workflow is not a one-size-fits-all solution but depends on a synergistic relationship between the elution technique and the detector's fundamental operating principles.
Isocratic elution employs a constant mobile phase composition throughout the chromatographic run. This simplicity makes it straightforward to implement and reproducible, often requiring less sophisticated equipment [41] [40]. In contrast, gradient elution involves a systematic alteration of the mobile phase composition, usually by increasing the concentration of a stronger solvent over time. This approach enhances separation efficiency for complex mixtures by providing sharper peaks, improved resolution, and reduced analysis times for compounds with a wide range of polarities [41] [42] [40].
The choice of detector further influences method development. HPLC-UV, using a concentration-sensitive detector, is a robust and cost-effective workhorse in many laboratories [31] [20]. HPLC-MS, a mass-flux sensitive detector, offers superior sensitivity and selectivity, particularly for identifying unknown compounds or analyzing substances with low UV absorbance [31] [20]. Understanding the interplay between these elution and detection modes is crucial for developing efficient, reliable, and fit-for-purpose analytical methods. This guide provides an objective comparison to inform these critical decisions.
Fundamental Principles and Comparison
Defining the Elution Modes
The core difference between isocratic and gradient elution lies in the stability of the mobile phase environment during the analytical run.
Isocratic Elution utilizes a single solvent or a consistent solvent mixture for the entire separation process [41] [40]. This constant composition is ideal for separating compounds with similar chemical properties and polarities, as it provides a stable and predictable environment for analyte-stationary phase interactions. Its benefits include lower operational costs, shorter method development times, and consistent reproducibility, making it a prime choice for routine analyses of simpler samples [40].
Gradient Elution dynamically changes the solvent strength by progressively varying the mobile phase composition, typically starting with a weaker solvent and gradually introducing a stronger one [41] [42] [40]. This approach is essential for solving the "general elution problem," where a sample contains components with a broad range of affinities for the stationary phase. It enhances peak capacity, reduces the run times for strongly retained compounds, and provides greater flexibility in optimizing separations for complex mixtures [41] [40].
Key Operational Differences
The choice between isocratic and gradient elution has direct implications for the chromatographic output and operational workflow. The table below summarizes the core distinctions.
Table 1: Core Operational Differences Between Isocratic and Gradient Elution
| Parameter | Isocratic Elution | Gradient Elution |
|---|---|---|
| Mobile Phase | Constant composition | Systematically changing composition |
| Peak Shape | Later-eluting peaks exhibit broadening [41] | Uniformly spaced peaks with consistent widths [41] |
| Analysis Speed | Can be slow for strongly retained analytes | Faster for mixtures with a wide retention range [41] [40] |
| Method Development | Simpler and more straightforward [40] | More complex, requires optimization of gradient profile [40] |
| Instrumentation | Less sophisticated; single pump sufficient | Requires sophisticated instrumentation for precise solvent mixing [41] |
| Cost | Lower operational cost and solvent consumption [40] | Higher operational cost and complexity |
Defining the Detection Systems
The detector transforms the physical separation of compounds into a quantifiable signal, and its type fundamentally affects the method's capabilities.
HPLC-UV (Ultraviolet Detection) is a concentration-sensitive detector. Its response (peak area) is inversely proportional to the mobile phase flow rate [20]. It is ubiquitous in analytical laboratories due to its reliability, relatively low cost, and ease of use. However, it provides limited structural information and requires the analytes to possess a chromophore [31] [20].
HPLC-MS (Mass Spectrometric Detection) is a mass-flux sensitive detector. Its response is largely independent of the mobile phase flow rate, as it measures the mass of the analyte entering the detector per unit time [20]. It offers unparalleled selectivity and sensitivity, enables compound identification and confirmation, and is ideal for compounds lacking a strong chromophore. Its drawbacks include high instrumentation and maintenance costs, and it can be more susceptible to ion suppression from complex matrices [31].
Key Detection Performance Characteristics
The inherent differences between UV and MS detectors lead to variations in quantitative performance, as evidenced by comparative studies. The following table summarizes key findings from a controlled investigation comparing the two detection methods [14].
Table 2: Comparison of Quantitative Performance between UV and MS Detection [14]
| Performance Parameter | HPLC-UV | HPLC-MS (APCI) |
|---|---|---|
| Repeatability of Retention Time | High precision (~0.2-0.3% RSD) | Similar high precision (~0.2-0.3% RSD) |
| Repeatability of Peak Area | Generally better precision | Less precise compared to UV |
| Average Precision of Peak Area | ~2.5% RSD | ~6.8% RSD |
| Flow Rate Sensitivity | Peak area inversely proportional to flow rate [20] | Peak area largely independent of flow rate [20] |
| Structural Information | Limited (UV spectrum) | Detailed (molecular mass, fragmentation pattern) |
Method Development Workflow
Navigating the choice between isocratic and gradient elution for a given detection system follows a logical decision tree. The following workflow provides a strategic approach for method development.
Workflow Decision Logic
The pathway illustrated above is governed by a few critical questions:
- What is the sample complexity? For simple mixtures with fewer than ten components and similar polarities, isocratic elution is often sufficient and preferable for its simplicity [41] [43]. For complex samples, or those with components spanning a wide range of hydrophobicities, gradient elution is necessary to achieve adequate resolution in a reasonable time [41] [40].
- What are the detection requirements? If the goal is purely quantitative analysis and the target analytes have good UV chromophores, HPLC-UV is a robust and cost-effective choice [31]. If compound identification, confirmation, or analysis of substances with poor UV absorption is required, HPLC-MS is indispensable [31] [20].
- Is speed a critical factor? While gradient elution is often faster for complex mixtures, the requirement for column re-equilibration between runs must be factored into the total cycle time [41] [44].
Starting with a Scouting Gradient
A highly recommended first step in method development, regardless of the final goal, is to perform a initial "scouting" run using a broad linear gradient (for example, from 5% to 100% organic solvent in 10-20 minutes) [43]. This single run provides a wealth of information:
- It reveals the number of components and the overall purity of the sample.
- It estimates the retention range of all analytes.
- It helps determine the optimal elution mode. A common guideline suggests that if the sample components elute within a window of less than 20% of the total gradient run time, isocratic elution may be suitable. If they are spread over more than 40% of the run, gradient elution is typically required [44].
Experimental Protocols and Data
Protocol for a Potency Assay using Isocratic HPLC-UV
The following protocol, adapted from a therapeutic drug monitoring (TDM) study, exemplifies a robust isocratic method for quantifying specific drugs in serum [31].
- Objective: To quantify anticonvulsant drugs (e.g., phenytoin, carbamazepine) in patient serum for TDM.
- Sample Preparation: Patient serum is filtered and then purified using a solid-phase extraction (SPE) cartridge with a monolithic C18-silica disk. The cartridge is preconditioned, loaded with the sample, washed with water, and the analyte is eluted with an aqueous solution of 50% acetonitrile [31].
- HPLC-UV Conditions:
- Column: Reversed-phase C18 column (e.g., Chromolith HighResolution RP-18e, 100 mm × 4.6 mm) [31].
- Mobile Phase: Isocratic elution with a predetermined constant mixture of aqueous buffer and organic solvent (e.g., acetonitrile or methanol). The exact ratio is optimized to yield retention factors (k) between 1 and 5 for the analytes of interest.
- Flow Rate: 1.0 mL/min [31].
- Temperature: 40°C.
- Detection: UV detection at the analyte's λmax (e.g., 220-280 nm).
- Injection Volume: 10-20 µL.
- Key Data: This method demonstrated excellent correlation with established immunoassay and LC-MS/MS methods, with precision and accuracy meeting validation criteria, confirming its suitability for routine in-hospital TDM [31].
Protocol for an Impurity/Purity Profiling using Gradient HPLC-MS
This protocol is typical for stability-indicating methods or the analysis of complex samples, such as novel chemical entities in drug development [10] [45].
- Objective: To separate and quantify a novel aminothiazole compound and its potential impurities in rat plasma or formulation samples [10].
- Sample Preparation: For plasma samples, protein precipitation is employed using a mixture of organic solvents. The sample is vortexed and centrifuged, and the supernatant is injected [10].
- LC-MS/MS Conditions:
- Column: Reversed-phase C18 column (e.g., Waters Xterra RP C18, 150 mm × 4.6 mm, 5 µm) [10].
- Mobile Phase: A: 0.1% Formic acid in water; B: Acetonitrile (or a mixture of acetonitrile and methanol).
- Gradient Program: A multi-segment linear gradient is used. For example: 0 min: 20% B, 10 min: 80% B, 12 min: 80% B, 12.1 min: 20% B, followed by a re-equilibration period [10] [45].
- Flow Rate: 1.0 mL/min.
- Temperature: 40°C.
- Detection: Tandem Mass Spectrometry with Electrospray Ionization (ESI) in Multiple Reaction Monitoring (MRM) mode.
- Key Data: The developed method was validated over a linear range of 1.25–1250 ng/mL, with accuracy between 95-105% and precision (RSD) <5%, demonstrating high sensitivity and specificity for early-stage pharmacokinetic studies [10].
The Scientist's Toolkit: Essential Research Reagents and Materials
Successful method development and execution rely on a set of core materials. The following table details key solutions and their functions.
Table 3: Essential Reagents and Materials for HPLC-UV and HPLC-MS Method Development
| Item | Function / Purpose | Application Notes |
|---|---|---|
| C18 Reversed-Phase Column | The most common stationary phase for separating a wide range of non-polar to moderately polar compounds. | Available in various lengths and particle sizes. Short columns (e.g., 50 mm) for fast isocratic methods; longer columns (e.g., 150 mm) for complex gradient separations [43]. |
| Acetonitrile & Methanol (HPLC Grade) | Primary organic solvents for the mobile phase. | Acetonitrile offers lower viscosity and backpressure. Methanol is a weaker eluent but can offer different selectivity. |
| Water (HPLC Grade) | The aqueous component of the mobile phase. | Must be high-purity to minimize baseline noise, especially in gradient elution and MS detection. |
| Acid Additives (e.g., Formic Acid, TFA) | Modifies mobile phase pH to suppress ionization of acidic/basic analytes, improving peak shape and retention. | Formic acid is volatile and preferred for LC-MS. Trifluoroacetic acid (TFA) is strong but can cause ion suppression in MS [43]. |
| Ammonium Acetate / Formate | A common volatile buffer for controlling pH in LC-MS compatible methods. | Helps maintain consistent retention times for ionizable compounds without contaminating the MS ion source. |
| Solid-Phase Extraction (SPE) Cartridges | For sample clean-up and pre-concentration of analytes from complex matrices like serum or plasma. | Monolithic C18 cartridges enable rapid processing, as used in the TDM protocol [31]. |
| Protein Precipitation Solvents | For deproteinizing biological samples (e.g., plasma) prior to analysis. | Typically, organic solvents like acetonitrile or methanol are used [10]. |
The experimental data and protocols highlight a critical, and sometimes counterintuitive, synergy between elution mode and detection type. While HPLC-MS is often perceived as the more powerful technique, the quantitative precision of peak areas can be superior in HPLC-UV under stable flow conditions [20] [14]. This makes a well-developed isocratic HPLC-UV method an excellent choice for high-precision quantitative analysis of simpler mixtures, such as potency assays or therapeutic drug monitoring of specific compounds [31].
Conversely, gradient elution's primary strength is its ability to manage complexity and reduce analysis time for mixtures with a wide retention range [41] [40] [44]. This power is fully leveraged when coupled with the identification and confirmation capabilities of MS detection. The combination of gradient elution and HPLC-MS is the undisputed approach for challenging applications like impurity profiling, metabolomics, and the analysis of unknown samples, where both separation power and definitive compound identification are required [10].
In conclusion, the decision between isocratic and gradient elution for UV and MS detection is not a matter of choosing a superior technology, but of selecting the most appropriate tool for the analytical problem.
- For routine, quantitative analysis of well-defined, simpler mixtures, isocratic HPLC-UV offers a robust, cost-effective, and highly precise solution.
- For method scouting and high-throughput analysis of samples with unknown or wide-ranging polarity, a generic broad gradient is the most efficient starting point [43].
- For complex mixtures requiring maximum resolution, peak capacity, and definitive analyte identification, gradient HPLC-MS is the essential and powerful combination.
Therefore, a modern method development workflow should begin with a clear assessment of the sample and the analytical goal, followed by a strategic scouting run to guide the selection of an elution and detection strategy that is both efficient and fit-for-purpose.
In pharmaceutical research and drug development, the analysis of compounds lacking strong ultraviolet (UV) chromophores presents a significant analytical challenge. High-performance liquid chromatography with ultraviolet detection (HPLC-UV) has long been the workhorse of analytical laboratories, but its fundamental limitation lies in its inability to detect molecules that do not contain structural features that absorb UV light efficiently [46]. This shortcoming is particularly problematic for many pharmaceuticals, excipients, carbohydrates, lipids, natural products, and impurities that are transparent to conventional UV detection [47] [48].
The need to analyze such compounds has driven the development of alternative detection techniques that operate on different principles. This guide provides an objective comparison of three prominent alternative detectors: Charged Aerosol Detection (CAD), Evaporative Light Scattering Detection (ELSD), and Vacuum Ultraviolet Detection (VUV). Within the broader context of comparing HPLC-UV and HPLC with mass spectrometry (HPLC-MS) for specificity testing, understanding the capabilities of these detectors is crucial for selecting the appropriate analytical tool. While HPLC-MS offers superior sensitivity and selectivity for many applications, its high cost, operational complexity, and sometimes inferior quantitative precision compared to HPLC-UV make these alternative detectors valuable options for many routine applications [14] [31] [21].
Operating Principles and Instrumentation
The fundamental mechanisms of CAD, ELSD, and VUV differ significantly from UV-based detection, each with unique advantages and limitations for analyzing compounds with weak chromophores.
Charged Aerosol Detection (CAD)
CAD is an aerosol-based detector that generates a response independent of a compound's chemical structure. The process begins with the nebulization of the HPLC eluent into fine droplets, followed by evaporation of the mobile phase in a heated tube under a stream of nitrogen. This leaves dried analyte particles, which are then charged by a secondary stream of nitrogen that has passed over a high-voltage, positively charged corona wire. The resulting charge is proportional to the quantity of the analyte and is measured by a highly sensitive electrometer. A key advantage of this mechanism is that the charging process is largely independent of chemical structure, leading to more uniform response factors across different analytes compared to other techniques [47].
Evaporative Light Scattering Detection (ELSD)
ELSD also employs an aerosol-based mechanism. Similar to CAD, the column effluent is nebulized and the mobile phase is evaporated, leaving dried analyte particles. These particles then pass through a light beam (typically a laser), and the scattered light is detected by a photomultiplier tube or a photodiode. The intensity of the scattered light is related to the size and number of the particles. However, unlike CAD, the relationship between the amount of analyte and the detected signal is more complex and non-linear. The magnitude of scattered light varies exponentially with particle size, and the physicochemical properties of the analytes (such as refractive index, light absorption, and fluorescence) can impact the response, leading to greater variability in response factors between different compounds [49] [47].
Vacuum Ultraviolet Detection (VUV)
VUV detection operates on a principle closer to traditional UV spectroscopy but in a previously inaccessible region of the electromagnetic spectrum. It detects analytes by measuring their absorption of light in the vacuum ultraviolet range (approximately 120-240 nm). In this region, almost every molecule absorbs light because the energy corresponds to electronic transitions in single bonds, double bonds, and non-bonding electrons. The VUV detector acquires full-spectrum data across multiple bands, providing a unique level of spectral selectivity that can be used for compound identification and to deconvolve co-eluting peaks. Critically, it follows Beer-Lambert law, yielding a linear response across a broad dynamic range [50].
The following diagram illustrates the core operational workflows for the three detector types:
Comparative Performance Data
The selection of an appropriate detector depends heavily on its performance characteristics for a given application. The following tables summarize key quantitative metrics and general performance attributes for CAD, ELSD, and VUV detectors, based on published data and manufacturer specifications.
Table 1: Quantitative Performance Metrics for CAD, ELSD, and VUV
| Performance Parameter | Charged Aerosol Detector (CAD) | Evaporative Light Scattering Detector (ELSD) | Vacuum Ultraviolet Detector (VUV) |
|---|---|---|---|
| Typical Limits of Detection (LOD) | 10-fold better than ELSD [47] | Higher than CAD (little signal for particles <50 nm) [47] | Information Missing |
| Dynamic Range | ~4 orders of magnitude [47] | ~2 orders of magnitude [47] | Broad (follows Beer's Law) [50] |
| Linearity Range | ~2 orders of magnitude [47] | ~1 order of magnitude (requires log transformation) [47] | Linear (follows Beer's Law) [50] |
| Precision (Peak Area RSD) | Generally better precision and accuracy than ELSD [47] | Lower precision than UV and CAD; affected by analyte properties [14] [47] | Information Missing |
| Response Uniformity | High (independent of chemical structure) [47] | Variable (affected by refractive index, absorption) [47] | Universal (every molecule is a chromophore) [50] |
Table 2: General Characteristics and Operational Requirements
| Characteristic | Charged Aerosol Detector (CAD) | Evaporative Light Scattering Detector (ELSD) | Vacuum Ultraviolet Detector (VUV) |
|---|---|---|---|
| Detection Principle | Electrical charge of aerosol particles [47] | Light scattering by aerosol particles [49] [47] | Absorption in VUV region [50] |
| Dependence on Chromophore | None | None | None (universal) [50] |
| Mobile Phase Requirements | Volatile phases and additives [47] | Volatile phases and additives [47] | Compatible with most standard HPLC phases [50] |
| Gas Supply | Nitrogen [47] | Nitrogen [49] | Not required |
| Destructive to Analyte? | Yes | Yes [49] | No |
| Key Advantage | Superior sensitivity, wide dynamic range, uniform response [47] | Proven utility for compounds like carbohydrates [49] | High spectral selectivity for identification, linear response [50] |
Experimental Protocols and Methodologies
Implementing these detectors requires careful method development. Below are detailed protocols and considerations for each technique, drawn from experimental data and application notes.
Protocol for Charged Aerosol Detection (CAD)
Instrumentation and Setup: A Thermo Scientific Vanquish HPLC system coupled with a Vanquish Horizon CAD is a typical setup. The CAD requires a nitrogen gas source from a generator or cylinder. Key instrumental parameters to optimize include the Evaporation Temperature (often tested between 24°C and 48°C), the Power Function Value (PFV) (a data acquisition parameter typically between 0.8 and 1.6 used to optimize linearity), and the mobile phase flow rate [46].
Mobile Phase and Column Selection:
- Mobile Phase: Must be volatile. Common choices are mixtures of water with acetonitrile (ACN), methanol (MeOH), or acetone, often modified with 0.1% (v/v) formic acid or volatile buffers like ammonium acetate or ammonium formate [47] [46]. Acetone has been shown to be a potential "green" alternative to ACN for some CAD applications [46].
- Column: Standard reversed-phase C18 columns are widely used. For challenging separations, alternative chemistries like pentafluorophenyl (PFP) or HILIC columns can be employed [48].
Method Optimization:
- A response surface methodology (RSM) can be used to systematically optimize parameters like evaporation temperature, PFV, and mobile phase composition for maximum sensitivity and linear response [46].
- To achieve uniform response across analytes of different volatility (e.g., a homologous series of fatty acids), mixed quantitative structure–property relationship (QSPR) modeling can be used to understand and predict CAD behavior [46].
Protocol for Evaporative Light Scattering Detection (ELSD)
Instrumentation and Setup: An ELSD (e.g., from Biotage or other vendors) is connected post-column. The critical parameters are the nebulizer gas flow rate (usually nitrogen), the evaporation tube temperature, and the gain setting of the photomultiplier.
Mobile Phase and Column Selection:
- Mobile Phase: As with CAD, only volatile buffers and solvents can be used. Non-volatile additives will create a high background signal and baseline noise [49] [47].
- Column: Compatible with all standard HPLC column chemistries.
Application-Specific Considerations:
- In flash column chromatography, the flow can be split post-column, with a minor portion directed to the destructive ELSD and the majority sent to the fraction collector [49].
- Due to its non-linear, sigmoidal response curve, calibration typically requires analyzing standards at multiple concentrations and using logarithmic transformation or power function regression to create a calibration curve [47].
Protocol for Vacuum Ultraviolet Detection (VUV)
Instrumentation and Setup: The VUV Analytics Hydra detector integrates with most standard HPLC systems. It does not require gas supplies. The primary parameters to set are the data acquisition rate and the wavelength ranges to be monitored.
Mobile Phase and Column Selection:
- Mobile Phase: Offers greater flexibility than aerosol-based detectors. Many common HPLC solvents, including water, methanol, and acetonitrile, are transparent in large regions of the VUV spectrum, allowing for their use [50].
- Column: Works with any standard HPLC column.
Data Analysis and Peak Identification:
- The detector captures full VUV spectra (120-240 nm) for each data point, creating a three-dimensional data set (time, absorbance, wavelength) [50].
- This spectral data allows for peak deconvolution of co-eluting compounds and can be used for compound identification by matching against a spectral library, adding a layer of selectivity similar to MS in some applications [50].
Applications in Pharmaceutical Analysis
The detectors compared in this guide are critical for specific, challenging applications in drug development and quality control.
- Impurity Profiling: CAD has been successfully applied to profile impurities in active pharmaceutical ingredients (APIs) with weak chromophores, such as acarbose, where it demonstrated superior performance compared to UV detection at low wavelengths [48]. Its uniform response is a major advantage for quantifying impurities for which reference standards are unavailable.
- Carbohydrate and Sugar Analysis: ELSD has a long history of use in analyzing carbohydrates, which lack chromophores, in both drug substances and excipients. It is particularly useful in purification workflows like flash chromatography [49].
- Lipid and Fatty Acid Analysis: Both CAD and ELSD are extensively used for lipid analysis. Studies show that CAD response for homologous series of fatty acids can be accurately modeled, facilitating reliable quantification [46].
- Excipient Characterization: The universal nature of VUV detection makes it ideal for characterizing complex excipient mixtures, such as surfactants and polymers, which often have poor UV absorbance.
The Scientist's Toolkit: Essential Research Reagent Solutions
Successful implementation of these detection technologies requires the use of specific, high-quality reagents and materials. The following table details key items and their functions.
Table 3: Essential Research Reagents and Materials
| Item | Function/Application | Critical Notes |
|---|---|---|
| HPLC-Grade Volatile Buffers (e.g., Ammonium Formate, Ammonium Acetate) | Mobile phase additive for pH control in CAD and ELSD [46]. | Must be volatile; non-volatile salts (e.g., phosphate) will foul aerosol-based detectors. |
| High-Purity Nitrogen Gas Supply | Gas for nebulization and evaporation in CAD and ELSD [47]. | Purity is critical for stable baseline and low noise. Gas generators or high-purity cylinders are used. |
| Volatile Acids (e.g., Formic Acid, Trifluoroacetic Acid (TFA)) | Mobile phase modifier to improve ionization in CAD and chromatography [48] [46]. | TFA must be used with caution in CAD as non-volatile ions can accumulate. |
| Specialized HPLC Columns (e.g., PFP, HILIC, Graphitized Carbon) | Stationary phases for separating challenging, non-chromophoric analytes [48]. | Provides orthogonal selectivity to C18 for complex mixtures. |
| 2-Chloro-1-methylquinolinium tetrafluoroborate (CMQT) | Derivatizing agent to introduce a UV chromophore for HPLC-UV analysis [51]. | An alternative strategy for enabling UV detection of specific functional groups (e.g., thiols). |
The analysis of compounds with weak chromophores remains a central challenge in pharmaceutical sciences. While HPLC-MS is a powerful and sensitive technique, Charged Aerosol Detection (CAD), Evaporative Light Scattering Detection (ELSD), and Vacuum Ultraviolet Detection (VUV) offer robust, and often more accessible, alternatives. CAD generally provides superior sensitivity, a wider dynamic range, better precision, and more uniform response compared to ELSD. VUV offers unique advantages in selectivity and compound identification based on spectral libraries, without the need for volatile mobile phases.
The choice of detector is not one-size-fits-all and must be guided by the specific analytical requirements, including the need for sensitivity, linearity, universality, and compatibility with existing methods and regulations. By understanding the principles, performance data, and methodological requirements outlined in this guide, researchers and drug development professionals can make an informed decision to overcome the limitations of traditional UV detection.
The analysis of complex natural products, such as polyphenols, presents significant challenges for researchers and drug development professionals. These compounds often exist in intricate matrices with structurally similar analogs, requiring analytical techniques that offer high resolution, sensitivity, and specificity. The choice between Ultra-High-Performance Liquid Chromatography coupled with Ultraviolet detection (UHPLC-UV) and UHPLC coupled with tandem mass spectrometry (UHPLC-MS/MS) represents a critical methodological crossroads in phytochemical analysis and pharmaceutical development [52]. This case study provides a structured comparison of these two dominant analytical platforms, evaluating their performance characteristics for the simultaneous quantification of polyphenols. Within the broader thesis on HPLC-UV versus HPLC-MS for specificity testing, this analysis highlights how technological selection directly influences data quality, methodological robustness, and practical application in research and development settings. The evolution of these technologies has been driven by increasing demands for sensitivity and selectivity across various fields, particularly in pharmaceutical research where the need to detect increasingly potent compounds at lower concentrations continues to push technological boundaries [21].
Technical Principles and Instrumentation
UHPLC-UV Fundamentals
Ultra-High-Performance Liquid Chromatography with Ultraviolet detection (UHPLC-UV) operates on the principle of separating compounds based on their differential partitioning between a stationary phase and a pressurized mobile phase, followed by detection through ultraviolet light absorption. Modern UHPLC systems significantly enhance traditional HPLC by operating at substantially higher pressures (up to 1300-1500 bar), using columns packed with smaller particles (often sub-2-μm), and delivering improved resolution, speed, and sensitivity [50] [35]. Detection occurs when analyte molecules containing chromophores absorb UV light at specific wavelengths, with the absorbance being proportional to concentration according to Beer-Lambert law. The prominence of UHPLC-UV stems from its robust applicability to diverse analyte types, excellent precision for quantitative analysis, and relative operational simplicity compared to more complex detection systems [35].
UHPLC-MS/MS Fundamentals
UHPLC-MS/MS combines the superior separation power of UHPLC with the exceptional detection capabilities of tandem mass spectrometry. This hyphenated technique separates compounds chromatographically before ionizing them, typically using electrospray ionization (ESI) or atmospheric pressure chemical ionization (APCI) [53] [54]. The resulting ions are filtered by a first mass analyzer (quadrupole Q1), fragmented in a collision cell (Q2) using inert gas, and the product ions are separated in a second mass analyzer (quadrupole Q3) before detection [54]. This process, particularly when operated in Multiple Reaction Monitoring (MRM) mode, provides unparalleled specificity by tracking specific precursor-product ion transitions unique to each compound [54]. The technology has become the gold standard for bioanalytical testing due to its unmatched sensitivity and specificity, particularly for complex matrices [35] [55].
Visualizing the Core Analytical Workflow
The fundamental workflow for both UHPLC-UV and UHPLC-MS/MS analyses follows a logical progression from sample preparation to data analysis, with the critical difference occurring at the detection stage.
Experimental Comparison: Methodologies and Protocols
UHPLC-UV Methodology for Polyphenol Analysis
A representative UHPLC-UV method for polyphenol quantification employs a reversed-phase separation strategy. The analytical protocol typically utilizes a C18 column (e.g., 100-150 mm × 2.1 mm, 1.7-1.8 μm particle size) maintained at 40-45°C [35]. The mobile phase commonly consists of acidified water (0.1% formic acid) as component A and acidified acetonitrile (0.1% formic acid) as component B, with a gradient elution program optimized for polyphenol separation: starting from 5-10% B, increasing to 30-40% B over 10-15 minutes, then to 90-95% B for column cleaning [35] [56]. Flow rates typically range from 0.2-0.4 mL/min with injection volumes of 1-5 μL. Detection employs a photodiode array (PDA) or UV detector monitoring at specific wavelengths characteristic of different polyphenol classes: 280 nm for flavan-3-ols and hydroxybenzoic acids, 320 nm for hydroxycinnamic acids, and 360-370 nm for flavonoids [35]. Sample preparation involves solid-phase extraction (SPE) with C18 or polymeric cartridges to concentrate analytes and remove interfering compounds, followed by reconstitution in the initial mobile phase composition.
UHPLC-MS/MS Methodology for Polyphenol Analysis
The UHPLC-MS/MS approach for polyphenol analysis employs similar chromatographic conditions but with mass spectrometric detection optimized for polyphenol characterization. A validated method for oxygen heterocyclic compounds (including polymethoxyflavones) demonstrates a 16-minute analysis using a UHPLC BEH Shield RP18 column (1.7 μm, 100 × 2.1 mm) at 45°C with a mobile phase of 0.1% formic acid in water (A) and 0.1% formic acid in acetonitrile (B) at a flow rate of 0.32 mL/min [56]. The mass spectrometric detection utilizes electrospray ionization (ESI) in positive or negative mode, with source and desolvation temperatures of 150°C and 300-500°C, respectively [56]. Cone and desolvation gas flows (typically nitrogen) are set at 150 L/h and 800 L/h, respectively. Detection employs Multiple Reaction Monitoring (MRM) mode with specific precursor-product ion transitions for each polyphenol, optimized via direct infusion of standard solutions [54] [56]. For complex matrices, sample preparation incorporates advanced techniques such as liquid-liquid extraction or selective solid-phase extraction to minimize matrix effects that can suppress or enhance ionization [21].
The Scientist's Toolkit: Essential Research Reagents and Materials
Table 1: Essential Research Reagents and Materials for UHPLC Polyphenol Analysis
| Item | Function | Specific Examples |
|---|---|---|
| UHPLC System | High-pressure fluid delivery and sample introduction | Agilent Infinity III, Waters Acquity, Shimadzu i-Series [50] |
| Analytical Column | Compound separation based on chemical properties | C18, BEH Shield RP18 (1.7-1.8 μm particles) [56] |
| Mass Spectrometer | Ionization, mass filtering, and detection | Triple quadrupole (TQ) MS with ESI/APCI sources [50] [54] |
| UV/PDA Detector | Detection of chromophore-containing compounds | Diode array detector monitoring 200-600 nm [35] |
| Mobile Phase Components | Liquid medium for compound elution | Water, methanol, acetonitrile with modifiers (formic acid) [56] |
| Solid-Phase Extraction (SPE) | Sample clean-up and analyte concentration | C18, polymeric, or mixed-mode cartridges [55] |
| Reference Standards | Method calibration and compound identification | Certified polyphenol standards with >95% purity [56] |
Performance Comparison and Analytical Data
Quantitative Performance Metrics
Direct comparison of key analytical performance metrics reveals fundamental differences between the two techniques, particularly in sensitivity, selectivity, and dynamic range.
Table 2: Performance Comparison of UHPLC-UV and UHPLC-MS/MS for Polyphenol Analysis
| Performance Parameter | UHPLC-UV | UHPLC-MS/MS |
|---|---|---|
| Typical Sensitivity (LOD) | Nanogram (ng) to low picogram (pg) range [35] | Picogram (pg) to femtogram (fg) range, 1000x improvement over UV [21] |
| Selectivity | Limited by chromophore similarity and co-elution [35] | Excellent via MRM transitions; distinguishes co-eluting compounds [54] |
| Dynamic Range | ~3 orders of magnitude [35] | 3-5 orders of magnitude (e.g., 0.500-1000 nM demonstrated) [57] |
| Analytical Run Time | 20-40 minutes for complex separations [35] | 10-20 minutes with faster cycles due to superior selectivity [55] [56] |
| Matrix Effects | Minimal impact on UV absorption | Significant ion suppression/enhancement possible; requires management [21] |
| Structural Information | Limited to UV spectrum and retention time | Detailed structural data via fragmentation patterns [53] |
| Quantitative Reproducibility | Excellent (RSD < 0.5% for retention time) [35] | Good to excellent with proper internal standardization (RSD 1-5%) [56] |
Analysis of Specific Compound Classes
For polymethoxyflavones (a class of polyphenols) in grapefruit essential oils, UHPLC-MS/MS demonstrates exceptional performance with limits of detection ranging from 6×10⁻⁸ to 1.5×10⁻⁶ mg/g and limits of quantification from 2×10⁻⁷ to 5×10⁻⁶ mg/g [56]. The method exhibited excellent linearity (R² > 0.99 for all analytes) with intra- and interday precision (% RSD) ranging from 1.43-3.59% and 2.16-6.90%, respectively [56]. In environmental pharmaceutical monitoring, UHPLC-MS/MS methods achieve limits of detection as low as 100-300 ng/L for compounds like carbamazepine and caffeine in water samples, with precision (RSD) below 5.0% and accuracy (recovery rates) ranging from 77-160% [55]. Comparable UHPLC-UV methods typically achieve limits of detection in the low μg/L range for similar applications, representing a 1000-fold sensitivity difference [21].
Visualizing Technique Selection Logic
The choice between UHPLC-UV and UHPLC-MS/MS depends on multiple analytical and practical considerations, which can be visualized as a decision pathway.
Application Scenarios and Regulatory Considerations
Ideal Application Domains
UHPLC-UV remains the technique of choice for quality control laboratories in pharmaceutical and nutraceutical industries where well-characterized compounds are analyzed at relatively high concentrations, methods are standardized, and high precision with minimal operational complexity is required [35]. Its exceptional precision and robustness make it indispensable for stability-indicating assays where tracking changes in impurity profiles over time requires highly reproducible data across different laboratories and instruments [35]. UHPLC-MS/MS dominates applications requiring maximum sensitivity and specificity, including bioanalytical studies (drug metabolism and pharmacokinetics), environmental monitoring of trace contaminants, analysis of complex natural product mixtures, and clinical diagnostics where unambiguous identification is critical [55] [54]. The technology is particularly valuable for method development and screening applications where comprehensive information is needed for unknown or partially characterized samples [53].
Regulatory and Validation Aspects
For regulated environments, both techniques require rigorous validation following guidelines such as the FDA's Bioanalytical Method Validation or ICH Q2(R2) [55] [57]. UHPLC-UV methods demonstrate excellent inter-laboratory reproducibility, a critical factor for pharmacopeial methods and quality control applications [35]. UHPLC-MS/MS methods must specifically address matrix effects, ion suppression, and stability of analytical response through appropriate internal standardization (preferably stable isotope-labeled analogs) and matrix-matched calibration [54] [21]. A validated UHPLC-MS/MS method for trans-ISRIB quantification exemplifies this approach, demonstrating high specificity, precision, accuracy, and recovery across a wide calibration range (0.500-1000 nM) with a short 4-minute run time [57].
The simultaneous quantification of polyphenols benefits from both UHPLC-UV and UHPLC-MS/MS platforms, with the optimal choice being application-dependent. UHPLC-UV provides robust, cost-effective analysis for quality control and standardized methods where compounds are well-separated and present at moderate concentrations. UHPLC-MS/MS offers unparalleled sensitivity and specificity for research, development, and complex analytical challenges, particularly with low-abundance analytes in complex matrices. For drug development professionals, the strategic approach involves using UHPLC-MS/MS for discovery-phase research and method development, while implementing UHPLC-UV for routine quality control and stability testing once methods are validated. The continuing evolution of both technologies, including improved detector designs for UHPLC-UV and more robust, user-friendly interfaces for UHPLC-MS/MS, ensures that both platforms will remain essential tools in the analytical scientist's arsenal for specificity testing research and beyond.
Troubleshooting Common Specificity Challenges in HPLC-UV and HPLC-MS
Resolving Co-elution and Matrix Effects in Complex Samples
In the analysis of complex samples, from plant extracts to biological matrices, co-elution and matrix effects represent the most significant hurdles to achieving accurate and reliable quantification. Co-elution occurs when multiple compounds exit the chromatography column simultaneously, preventing individual detection. Matrix effects, particularly in mass spectrometry, arise when co-eluting substances from the sample itself alter the ionization efficiency of target analytes, leading to signal suppression or enhancement [58]. These phenomena are not merely inconveniences; they directly compromise data integrity, affecting everything from fundamental research to drug development and quality control. The choice of detection system—High-Performance Liquid Chromatography with Ultraviolet detection (HPLC-UV) or with Mass Spectrometric detection (HPLC-MS)—fundamentally determines how an analytical method confronts these challenges. This guide provides a objective, data-driven comparison of these two pillars of modern analysis, offering a clear framework for selecting the optimal technique for specificity testing in complex matrices.
HPLC-UV vs. HPLC-MS: A Technical Comparison
The core difference between these techniques lies in their detection principles. HPLC-UV identifies compounds based on their absorption of ultraviolet light at specific wavelengths, while HPLC-MS separates and identifies compounds based on their mass-to-charge ratio (m/z). This fundamental distinction dictates their respective strengths and vulnerabilities in managing complex samples.
Table 1: Core Characteristics of HPLC-UV and HPLC-MS
| Feature | HPLC-UV | HPLC-MS/MS |
|---|---|---|
| Detection Principle | UV-Vis Light Absorption | Mass-to-Charge Ratio (m/z) |
| Inherent Selectivity | Low to Moderate | Very High |
| Primary Challenge with Co-elution | Inability to distinguish compounds with similar retention times and UV spectra [33] | Ability to distinguish co-eluting compounds via unique mass transitions [21] |
| Primary Matrix Effect | Signal contribution from co-eluting impurities, leading to overestimation [33] [11] | Ion suppression/enhancement in the ESI source, leading to inaccurate quantification [59] [58] |
| Typical Workflow | Simpler, more straightforward | More complex, requires optimization of MS parameters |
| Cost | Lower capital and operational cost | Significantly higher capital and operational cost |
Quantitative Performance Data
Direct comparative studies provide the most compelling evidence for the capabilities and limitations of each technique.
Analysis of Polyphenols in Apple Juice
A seminal study comparing UHPLC-UV and UHPLC-MS/MS for the quantification of 15 phenolic compounds in apple juice revealed critical performance differences [33].
Table 2: Method Validation Data for Polyphenol Analysis in Apple Juice [33]
| Parameter | UHPLC-UV | UHPLC-MS/MS (SRM Mode) |
|---|---|---|
| Linear Range | Broad | Broad |
| Correlation (r²) | >0.990 | >0.989 |
| Limit of Detection (LOD) | 0.33 - 4 ng | 0.003 - 2 ng |
| Limit of Quantification (LOQ) | 0.5 - 10 ng | 0.007 - 6.67 ng |
| Precision (Intra-day RSD%) | < 4.0% (for most compounds) | < 5.8% (for most compounds) |
| Recovery Rate | 94.3 - 110.4% | 91.2 - 113.3% |
While both methods were validated as suitable for genetic studies, the MS/MS method demonstrated superior sensitivity with significantly lower LODs and LOQs. Furthermore, the study noted that for five major compounds, the UV detector produced an overestimation compared to the MS analyzer. This was attributed to undetected co-elution, where UV-absorbing compounds that were invisible to the mass spectrometer (or vice versa) contributed to the signal, skewing quantification [33].
Analysis of Levofloxacin in Composite Scaffolds
A comparison study for determining Levofloxacin released from a complex mesoporous silica/nano-hydroxyapatite composite scaffold further highlights the selectivity issue [11]. The study found that HPLC-UV was "not accurate" for measuring the drug concentration in this complex matrix due to impurity interference. In contrast, HPLC provided a accurate quantification, as it could selectively detect the levofloxacin signal amidst the co-eluting scaffold components. The recovery rates for low, medium, and high concentrations were more consistent and closer to 100% with HPLC, underscoring its superiority in complex matrices where co-elution is likely [11].
Experimental Protocols for Specificity Testing
Protocol for HPLC-UV Specificity Assessment
This protocol is designed to identify potential co-elution in HPLC-UV methods [33] [11].
- Step 1: Chromatographic Separation. Perform analysis on a representative sample using a UHPLC or HPLC system with a Photo-Diode Array (PDA) detector. A C18 column (e.g., 100-250 mm x 4.6 mm, sub-2 µm or 5 µm particle size) is typical. Use a mobile phase gradient optimized for the target analytes, such as a water/acetonitrile system with 0.1% formic acid.
- Step 2: Peak Purity Analysis. Using the PDA detector software, acquire spectra across the entire peak profile of each analyte. The software will compare spectra from the upslope, apex, and downslope of the peak. A pure peak will have a high purity factor (e.g., >990), indicating spectral homogeneity. A low purity factor suggests the presence of multiple, co-eluting compounds.
- Step 3: Method Validation with Spiked Samples. Validate the method by spiking the sample matrix with known concentrations of the target analytes. Calculate recovery rates. Overestimation or inconsistent recovery, as seen in [33], can be a red flag for co-elution not detected by purity analysis.
Protocol for HPLC-MS/MS Specificity and Matrix Effect Evaluation
This protocol assesses specificity and quantifies the impact of matrix effects [58].
- Step 1: Confirm Specificity with MS/MS. Analyze samples using an HPLC system coupled to a triple quadrupole mass spectrometer. The first quadrupole (Q1) selects the precursor ion of the analyte, the second (Q2) fragments it, and the third (Q3) monitors one or more specific product ions. This Selected Reaction Monitoring (SRM) or Multiple Reaction Monitoring (MRM) mode provides high specificity, as a compound is identified by both its parent and fragment masses [33].
- Step 2: Post-Column Infusion for Matrix Effect Visualization. This technique graphically reveals ion suppression/enhancement zones [58].
- Prepare a neat solution of the analyte and infuse it directly into the MS source via a syringe pump, providing a constant signal.
- Simultaneously, inject a blank, extracted sample matrix onto the HPLC column and run the gradient method.
- Monitor the analyte signal from the infusion. Any dip (suppression) or peak (enhancement) in the baseline corresponds to the elution time of matrix components that interfere with ionization.
- Step 3: Post-Extraction Spiking for Quantitative Matrix Effect. This method provides a numerical value for matrix effects (ME%) [58].
- Extract a blank matrix (e.g., plasma, urine, plant extract) using the intended sample preparation protocol.
- Spike a known concentration of analyte into the purified blank extract (Sample A).
- Prepare a reference solution at the same concentration in pure mobile phase (Sample B).
- Analyze both and calculate the matrix effect as: ME% = (Peak Area of Sample A / Peak Area of Sample B) x 100%. An ME% of 100% indicates no effect; <100% indicates suppression; >100% indicates enhancement.
Diagram 1: Specificity testing workflows for HPLC-UV and HPLC-MS. The pathways illustrate the distinct experimental approaches required to address the unique challenges of each technique.
The Scientist's Toolkit: Essential Research Reagents and Materials
Successful method development for complex samples requires careful selection of materials and technologies.
Table 3: Essential Toolkit for HPLC-UV and HPLC-MS Analysis
| Category / Item | Function & Importance | Application Notes |
|---|---|---|
| Chromatography Column: C18 | Standard reversed-phase column for separating a wide range of analytes. | Core component for both HPLC-UV and HPLC-MS [33] [11]. |
| Mobile Phase Additive: Formic Acid | Volatile acid that improves chromatographic peak shape and enhances ionization in positive ESI mode. | Critical for MS compatibility; avoids non-volatile salt buildup in ion source [60] [61]. |
| Sample Prep: Solid-Phase Extraction (SPE) | Purifies and concentrates samples, removing salts, proteins, and other interferents. | Key strategy for reducing matrix effects in HPLC-MS by cleaning the sample [21] [58]. |
| Internal Standard: Stable-Labeled Analogue | Compound identical to the analyte but with isotopic labels (e.g., ²H, ¹³C). | Corrects for variable analyte recovery and matrix effects in HPLC-MS quantification [59] [58]. |
| Advanced Column: Pentafluorophenyl (PFP) | Provides alternative selectivity (dipole-dipole, π-π interactions) for hard-to-separate compounds. | Useful for separating complex mixtures of emerging contaminants with diverse polarities [61]. |
| Interface Technology: Radial Flow Stream (RFS) Splitting | A column end-fitting that splits flow, sending only the efficient central portion to the MS. | New technology that increases throughput and reduces pressure, improving MS coupling [62]. |
The choice between HPLC-UV and HPLC-MS for resolving co-elution and matrix effects is not a matter of declaring one universally superior. Instead, it is a strategic decision based on the analytical problem. HPLC-UV remains a robust, cost-effective solution for relatively simple matrices or for high-concentration analytes where runtime and cost are primary concerns. However, its vulnerability to UV-based co-elution is a significant limitation. HPLC-MS/MS, with its superior selectivity and sensitivity, is the unequivocal choice for the most challenging applications, including trace analysis in biological and environmental samples. Its primary challenge, matrix effects, can be systematically managed through rigorous method development, including effective sample clean-up and the use of internal standards.
The future of the technique lies in continued innovation at the interface between chromatography and mass spectrometry. Technologies like radial flow splitting [62] and the development of more robust and selective stationary phases [61] promise to further enhance throughput and resolution. For the researcher, a deep understanding of the fundamental principles and limitations outlined in this guide is the first and most critical step toward generating reliable, high-quality data that can withstand the complexities of the most demanding samples.
The choice between high-performance liquid chromatography with ultraviolet detection (HPLC-UV) and HPLC with mass spectrometric detection (HPLC-MS) represents a fundamental compromise in analytical method development. While HPLC-UV detectors are concentration-sensitive instruments whose response is inversely proportional to mobile phase flow rate, HPLC-MS detectors are mass-sensitive and generally unaffected by flow-rate fluctuations [20]. This fundamental difference extends to their tolerance for mobile phase additives, creating a significant divergence in optimal method development strategies. The composition of the mobile phase, particularly the selection of buffers and pH modifiers, becomes a critical factor that dictates not only chromatographic performance but also detection compatibility. For HPLC-MS methods, this necessitates the exclusive use of volatile buffer systems that can be efficiently desolvated and ionized without contaminating the sensitive ion source or suppressing analyte signal [63] [64]. This guide provides an objective comparison of mobile phase optimization for both detection platforms, supported by experimental data, to inform specificity testing in pharmaceutical research.
Detector Fundamentals and Mobile Phase Implications
HPLC-UV Detection Principles and Requirements
The ubiquitous UV spectrophotometric detector provides minimal structural information but offers robust quantitative performance for chromophoric compounds. Its operation as a concentration-sensitive detector means that peak areas are inversely proportional to mobile phase flow-rate [20]. This detector is relatively tolerant of both volatile and non-volatile mobile phase additives, allowing the use of phosphate buffers, ion-pairing reagents, and other additives that provide excellent buffering capacity across a wide pH range. The primary mobile phase consideration for UV detection is typically UV transparency at the detection wavelength.
HPLC-MS Detection Principles and Requirements
Mass spectrometric detection provides detailed molecular information and structural characterization capabilities essential for identifying unknowns and selectively quantifying target analytes [20] [65]. The MS detector's response depends on efficient ionization of analyte molecules, a process severely compromised by non-volatile mobile phase components. These non-volatile additives accumulate in the ion source, causing contamination, signal suppression, and increased instrumental downtime [63] [64]. Consequently, HPLC-MS methods require volatile buffers that can be completely evaporated during the ionization process.
Table 1: Fundamental Differences Between HPLC-UV and HPLC-MS Detection Systems
| Characteristic | HPLC-UV | HPLC-MS |
|---|---|---|
| Detection Principle | Concentration-sensitive | Mass-sensitive |
| Flow Rate Effect on Peak Area | Inversely proportional | Independent |
| Structural Information | Minimal (UV spectrum) | Detailed (mass, fragmentation) |
| Tolerance for Non-volatile Additives | High | Very Low (source contamination) |
| Compatible Buffer Systems | Volatile and non-volatile (phosphate, etc.) | Volatile only (ammonium salts, etc.) |
| Typical Application | Quantitation of known chromophores | Identification, selective quantitation |
Comparative Performance Data: Precision, Sensitivity, and Specificity
Direct comparisons of HPLC-UV and HPLC-MS performance reveal context-dependent advantages. A study examining the repeatability of benzamide, caffeine, and paracetamol analyses found that retention time precision was comparable between techniques, with relative standard deviations (RSDs) of 0.2-0.3% for both systems [20]. However, the study noted that peak area precision was often superior in HPLC-UV, particularly for compounds with strong UV chromophores.
A 2019 clinical study comparing meropenem and piperacillin analyses in critically ill patients demonstrated that after correcting for a systematic bias of approximately 10% for piperacillin, both methods showed comparable results with respect to clinical decision limits [66]. Measurement discrepancies ≥25% between LC-MS/MS and HPLC-UV analyses were observed in only ≈4-6% of all samples, indicating that HPLC-UV can serve as an adequate therapeutic drug monitoring methodology when MS expertise is unavailable [66].
For specificity, however, HPLC-MS demonstrates clear advantages in complex matrices. The MS detector's ability to discriminate analytes based on mass rather than retention time alone makes it significantly less susceptible to matrix interferences [65] [67]. This is particularly valuable in drug metabolism and pharmacokinetic studies where metabolites must be identified and quantified against a background of endogenous compounds [65] [68].
Table 2: Quantitative Performance Comparison from Experimental Studies
| Performance Metric | HPLC-UV Results | HPLC-MS Results | Experimental Context |
|---|---|---|---|
| Retention Time RSD | 0.2-0.3% [20] | 0.2-0.3% [20] | Benzamide, caffeine, paracetamol |
| Peak Area RSD | 1.2-3.1% (500 ng) [20] | 0.5-1.8% (100 ng) [20] | Benzoic and cinnamic acid derivatives |
| Measurement Discrepancies | Reference method [66] | ≈4-6% ≥25% difference [66] | Meropenem/piperacillin in patient samples |
| Specificity in Complex Matrices | Limited by chromophores | High (mass-based detection) | Drug metabolite identification [65] |
| Sensitivity | Limited for poor UV absorbers | Excellent for ionizable compounds | Gibenclamide analysis [20] |
Volatile Buffer Systems for HPLC-MS: Composition, Preparation, and Optimization
Common Volatile Buffer Systems and Their Properties
Volatile buffers for HPLC-MS must satisfy two competing requirements: sufficient buffering capacity at the desired pH and complete volatility to prevent MS source contamination. The following systems represent the most widely adopted options:
- Ammonium Formate/Formic Acid: Useful pH range of 2.8-4.8, ideal for positive ion mode ESI [63]
- Ammonium Acetate/Acetic Acid: Effective between pH 3.8-5.8 and 8.2-10.2 [63]
- Ammonium Bicarbonate/Carbonate: Suitable for pH ranges 5.9-6.9 and 8.8-9.8 [63] [64]
For IEX separations of monoclonal antibodies, researchers have successfully employed systems combining 10 mM ammonium acetate + 10 mM acetic acid as eluent A with 50 mM ammonium acetate + 50 mM ammonium carbonate as eluent B, creating a simultaneous ionic strength and pH gradient that maintains MS compatibility [64].
Critical Buffer Optimization Parameters
Method development with volatile buffers requires careful attention to several key parameters:
- Ionic Strength: Total ionic strength should typically exceed 70 mM at elution for adequate peak shape in IEX separations, but should be minimized to maintain MS sensitivity [64]
- Buffer Capacity: Should be maintained above 6 mM to ensure stable pH control during separation [64]
- pH Considerations: The apparent pH of hydro-organic mobile phases differs significantly from aqueous measurements due to the effect of organic modifiers on acid dissociation constants [69]
Practical Buffer Preparation Guidelines
- Prepare buffers by weight/volume for maximum reproducibility rather than relying solely on pH meter readings [69]
- Filter all mobile phases through 0.2 μm membranes to remove particulate matter
- Use HPLC-MS grade solvents and additives to minimize background contamination
- Avoid trifluoroacetic acid (TFA) despite its volatility, as it causes significant ion suppression in positive ESI mode and is difficult to remove from the MS source [63]
HPLC-UV vs. HPLC-MS Buffer Selection
Experimental Protocols for Mobile Phase Optimization and Method Comparison
Protocol 1: Systematic Comparison of HPLC-UV and HPLC-MS Performance
This protocol outlines a standardized approach for comparing detector performance under optimized mobile phase conditions for each system.
Materials and Equipment:
- HPLC system with binary pump, autosampler, and column thermostat
- UV/Vis detector or diode array detector (DAD)
- Mass spectrometer with atmospheric pressure ionization source (ESI or APCI)
- Analytical column suitable for both detection modes (e.g., C18, 100 × 2.1 mm, 1.7-2.6 μm)
- Test compounds representing different chemical classes (e.g., benzamide, caffeine, paracetamol) [20]
Mobile Phase Preparation:
- HPLC-UV: Prepare aqueous phase with 10-50 mM potassium phosphate buffer, pH-adjusted as needed
- HPLC-MS: Prepare aqueous phase with 10-50 mM ammonium acetate or ammonium formate, pH-adjusted with acetic acid or formic acid
- Organic phase: HPLC-MS grade acetonitrile or methanol for both systems
Experimental Procedure:
- Condition each system with respective mobile phases until stable baseline achieved
- Inject test mixture (n=5 replicates) using identical chromatographic conditions (column, flow rate, temperature, gradient)
- Record retention times, peak areas, peak widths, and signal-to-noise ratios
- Calculate repeatability metrics (RSD%) for retention time and peak area [20]
- Compare sensitivity using limit of detection (LOD) and limit of quantitation (LOQ)
Protocol 2: Development of MS-Compatible IEX Method for mAb Charge Variants
This specialized protocol addresses the challenge of coupling ion-exchange chromatography with mass spectrometry for monoclonal antibody characterization.
Materials and Equipment:
- UHPLC system capable of generating precise low-flow gradients
- Mass spectrometer with extended mass range
- Weak cation-exchange column (e.g., 50 × 2 mm, 5 μm)
- Monoclonal antibody reference standard
- Volatile salts: ammonium acetate, ammonium carbonate [64]
Mobile Phase Preparation:
- Eluent A: 10 mM ammonium acetate + 10 mM acetic acid (pH ~5.2)
- Eluent B: 50 mM ammonium acetate + 50 mM ammonium carbonate
- Prepare both eluents using gravimetric methods for maximum reproducibility
Chromatographic Conditions:
- Column temperature: 25-30°C
- Flow rate: 0.3-0.4 mL/min
- Injection volume: 1-5 μL (1 mg/mL mAb solution)
- Gradient program: 0-100% B over 8-10 minutes [64]
Method Optimization:
- Systematically vary ammonium carbonate concentration in Eluent B (10-100 mM) while holding acetate constant
- Evaluate retention, peak shape, and selectivity for mAb variants
- Optimize gradient steepness to balance resolution and analysis time
- Transfer method to MS detection and optimize source parameters
The Scientist's Toolkit: Essential Reagents and Materials
Table 3: Key Research Reagents for Mobile Phase Optimization
| Reagent/Material | Function/Application | Critical Considerations |
|---|---|---|
| Ammonium Acetate | Volatile buffer component | Useful pH ranges: 3.8-5.8 and 8.2-10.2 [63] |
| Ammonium Formate | Volatile buffer component | Preferred for positive ion ESI in acidic conditions [63] |
| Ammonium Carbonate | Volatile alkaline buffer | Essential for IEX-MS of mAbs; provides NH₄⁺ counterions [64] |
| Formic Acid | pH modifier for acidic conditions | Slightly stronger than acetic acid; improves peak shape [63] |
| Acetic Acid | pH modifier for mild acidity | Standard acidifier for positive ion mode LC-MS [63] |
| Ammonium Hydroxide | Volatile base for alkaline pH | Useful for negative ion mode applications [63] |
| PFP Stationary Phase | Alternative separation mechanism | Provides orthogonal selectivity for complex samples [61] |
| IEX-MS Column | MS-compatible ion-exchange column | Enables direct coupling of IEX with MS detection [64] |
The optimization of mobile phase composition for detector compatibility represents a critical step in analytical method development. HPLC-UV methods benefit from the flexible use of non-volatile buffers with excellent buffering capacity across a wide pH range, often delivering superior peak area precision for chromophoric compounds. In contrast, HPLC-MS methods require volatile buffer systems that inevitably constrain the usable pH range and buffering capacity but provide unparalleled specificity and sensitivity for complex applications.
For specificity testing in drug development, HPLC-MS is generally preferred due to its mass-based detection that confidently discriminates between analytes and interfering substances, particularly crucial for metabolite identification in biological matrices [65] [67]. However, for routine quality control or therapeutic drug monitoring of compounds with strong UV chromophores, HPLC-UV with volatile buffers can provide adequate performance with potentially lower operational costs and complexity [66].
The ongoing development of novel volatile buffer systems and MS-compatible stationary phases continues to narrow the performance gap between these detection platforms. Future advancements will likely focus on expanding the usable pH range of volatile buffers while maintaining their essential compatibility with mass spectrometric detection.
Addressing Signal Drift, Baseline Noise, and Peak Tailing in HPLC-UV
In the realm of pharmaceutical analysis, High-Performance Liquid Chromatography with Ultraviolet detection (HPLC-UV) remains a cornerstone technique for specificity testing in drug development. However, analysts routinely grapple with technical challenges including signal drift, baseline noise, and peak tailing that can compromise data integrity. These issues become particularly significant when evaluating method suitability against more advanced techniques like Liquid Chromatography-Mass Spectrometry (LC-MS). Signal drift refers to gradual baseline shifts over time, baseline noise encompasses random signal fluctuations, and peak tailing describes asymmetric peak shapes that reduce separation efficiency [70] [71]. This guide objectively compares HPLC-UV with HPLC-MS, providing experimental protocols and quantitative data to inform analytical strategies within drug development workflows.
Fundamental Principles and Comparative Advantages
Detection Mechanisms: UV versus MS
The fundamental differences between HPLC-UV and HPLC-MS detection principles dictate their respective applications and limitations in pharmaceutical analysis.
HPLC-UV relies on the absorption of ultraviolet light by chromophores in analyte molecules. This concentration-sensitive detection method provides excellent precision for compounds with suitable UV-absorbing functional groups [20]. Its robustness and relatively low operational cost make it ideal for quality control environments where regulated methods demand high precision [35].
HPLC-MS operates on mass-to-charge ratio separation of ionized molecules, making it a mass-flux sensitive detection system [54] [20]. This fundamental difference means MS response factors can vary significantly between compounds and is more susceptible to matrix effects that cause ion suppression, though its unparalleled specificity for compound identification is invaluable for structural confirmation [54].
Applicability Domains in Pharmaceutical Analysis
The suitability of each technique varies significantly based on the analytical question being addressed:
HPLC-UV excels in quantitative analysis of known compounds with strong chromophores, particularly in finished product quality control where its exceptional precision (often <0.5% RSD for peak areas) and robustness are paramount [35] [20]. Its ability to provide highly reproducible data across different laboratories and instrument vendors makes it indispensable for regulated testing environments [35].
HPLC-MS demonstrates superiority in applications requiring definitive compound identification, trace analysis in complex matrices, and methods where compounds lack strong chromophores [54]. It has become the standard for bioanalytical testing (drugs in biological fluids), trace residue analysis in food and environmental samples, and life science research where its specificity and sensitivity provide distinct advantages [35] [54].
Table 1: Comparative Analysis of HPLC-UV and HPLC-MS Characteristics
| Parameter | HPLC-UV | HPLC-MS |
|---|---|---|
| Detection Principle | Concentration-sensitive [20] | Mass-flux sensitive [20] |
| Precision (Peak Area RSD) | ~2.5% on average [14] [20] | ~6.8% on average [14] [20] |
| Specificity | Moderate (based on retention time and UV spectrum) | High (based on mass-to-charge ratio and fragmentation pattern) |
| Linear Dynamic Range | Typically 10³-10⁴ | Typically 10³-10⁵ |
| Sample Throughput | High for automated QC methods [35] | Moderate, limited by MS scan cycles and equilibration |
| Operational Costs | Moderate | High (equipment, maintenance, expertise) |
| Ideal Application Scope | Quality control of known compounds, stability testing [35] | Structural confirmation, trace analysis, complex matrices [54] |
Troubleshooting HPLC-UV Technical Challenges
Understanding and Controlling Peak Tailing
Peak tailing represents a frequent challenge in HPLC-UV that directly impacts data quality. The asymmetry factor (As) quantifies tailing, with values of 0.9-1.2 generally considered acceptable for new columns based on manufacturer quality control specifications [70]. As tailing increases to approximately 2.0, concerns grow despite regulatory allowances, while tailing factors of 4.0 create significant analytical problems including integration inconsistencies, elevated detection limits, reduced resolution requiring longer run times, and compromised peak purity assessment [70].
The primary causes of peak tailing include secondary interactions with metallic impurities in column silica, acidic silanol groups, and improper mobile phase chemistry [70]. Practical solutions involve using high-purity type-B silica columns and optimizing mobile phase parameters including sufficient buffer concentration and appropriate pH control to minimize undesirable interactions [70].
Table 2: Impact of Peak Tailing on HPLC-UV Analytical Parameters
| Tailing Factor (As) | Classification | Impact on Detection Limit | Integration Reliability | Resolution Requirement |
|---|---|---|---|---|
| 0.9-1.2 | Acceptable [70] | Normal | Excellent | Standard |
| ≈2.0 | Undesirable [70] | Moderately increased | Reduced | Increased |
| ≈4.0 | Unacceptable [70] | More than doubled [70] | Poor | Significantly increased |
Managing Baseline Noise and Signal Drift
Baseline irregularities in HPLC-UV represent critical diagnostic indicators of system health. The signal-to-noise (S/N) ratio quantitatively expresses baseline quality, with limits of detection (LOD) and quantification (LOQ) typically defined at S/N ratios of 3:1 and 10:1, respectively [71]. Understanding noise characteristics helps identify underlying causes:
- Random high-frequency noise often stems from electronic sources or detector lamp issues [71]
- Regular sinusoidal patterns frequently indicate improper mobile phase mixing [71]
- Irregular baseline disturbances may signal bubble formation from inadequate degassing or column dewetting [71]
Strategic approaches to minimize noise include using acetonitrile instead of methanol as organic modifier (particularly at wavelengths <220 nm), selecting low-UV-absorbing buffers like ammonium formate instead of citrate, ensuring proper degassing, optimizing detector slit width settings, and replacing aging lamp sources [71].
Addressing Signal Drift Challenges
Signal drift manifests as gradual baseline shifts over time and can arise from multiple sources:
- Temperature fluctuations in column compartment or detector flow cell
- Mobile phase composition changes due to evaporation or inadequate mixing
- Detector lamp intensity decay over operational lifetime
- Column conditioning issues in gradient separations
Mitigation strategies include maintaining consistent temperature control, using mobile phase reservoirs with minimal headspace, implementing lamp usage tracking with scheduled replacement, and ensuring adequate equilibration time between gradient runs.
Experimental Protocols for Method Optimization
Protocol for Peak Tailing Investigation
Objective: Systematically identify and resolve causes of peak tailing in HPLC-UV methods.
Materials: High-purity type-B C18 column (e.g., Phenomenex Luna C18, 50 × 4.6 mm, 5 μm); ammonium formate or ammonium acetate buffer; acetonitrile (HPLC grade); test analyte solutions [70] [10].
Method:
- Prepare mobile phase with 20 mM ammonium formate (pH 3.7) and acetonitrile (45:55, v/v) at flow rate of 1.0 mL/min [10]
- Set column temperature to 25°C and detection wavelength to 272 nm
- Inject test solution and calculate asymmetry factor (As) = B/A, where A is front half-width and B is back half-width at 10% peak height [70]
- If As > 1.5, systematically adjust mobile phase pH between 3.0 and 4.5 in 0.5 unit increments
- Evaluate buffer concentration from 10-50 mM while monitoring tailing improvement
- Confirm resolution with closely eluting peaks meets required criteria (typically >1.5)
Expected Outcomes: Implementation of this protocol typically reduces tailing factors to <1.5 through optimized secondary interaction suppression, with verification via resolution measurements between critical peak pairs.
Protocol for Signal-to-Noise Optimization
Objective: Maximize S/N ratio for improved detection sensitivity in HPLC-UV assays.
Materials: Degassed mobile phase; in-line degasser; post-column static mixer; certified reference standard [71].
Method:
- Establish baseline with mobile phase flowing at method-specified conditions
- Measure peak-to-peak noise (N) over approximately 10-minute baseline segment
- Inject standard to determine analyte signal height (S)
- Calculate S/N ratio and compare against system suitability criteria (typically >10 for LOQ)
- If S/N inadequate, implement optimization sequence:
- Verify mobile phase degassing efficiency
- Install 10-50 μL volume static mixer between pump and column
- Adjust detector time constant or data acquisition rate (target 20-25 data points across peak) [71]
- Increase slit width setting (e.g., from 4 nm to 8 nm) to enhance signal intensity [71]
- Evaluate alternative buffers with lower UV cutoffs (e.g., formate instead of acetate)
- Re-measure S/N ratio after each modification
Expected Outcomes: This systematic approach typically achieves 2-5 fold S/N improvement, enabling reliable quantification at lower concentrations with verified precision through replicate injections.
Comparative Quantitative Performance Assessment
Precision and Repeatability Data
Direct comparison of HPLC-UV and HPLC-MS performance reveals technique-specific advantages. A systematic study evaluating retention time, peak area, and column efficiency for probe compounds demonstrated that retention time precision was equivalent between techniques (0.2-0.3% RSD for successive injections) [14] [20]. However, significant differences emerged in quantitative precision, with HPLC-UV demonstrating approximately 2.5% RSD for peak areas versus 6.8% for HPLC-MS under comparable conditions [14] [20]. This precision advantage makes HPLC-UV particularly valuable for quality control applications where quantitative reproducibility is paramount.
Sensitivity and Specificity Considerations
While HPLC-MS generally offers superior absolute sensitivity (often at ng/mL or pg/mL levels), the practical sensitivity of HPLC-UV remains sufficient for many pharmaceutical applications, typically achieving limits of quantification around 0.01% for impurity testing [35]. Specificity presents a more complex comparison: HPLC-UV specificity derives from retention time alignment with reference standards and UV spectral matching, whereas HPLC-MS provides structural confirmation through mass-to-charge ratio and fragmentation patterns [54]. For stability-indicating methods, HPLC-UV successfully quantifies all components (API and related substances) when compounds contain chromophores and adequate chromatographic separation is achieved [35].
Table 3: Application-Based Technique Selection Guide
| Pharmaceutical Application | Recommended Technique | Justification |
|---|---|---|
| Stability Testing | HPLC-UV [35] | Excellent precision for tracking degradants over time [35] |
| Dissolution Testing | HPLC-UV | High throughput, cost-effectiveness for known compounds |
| Impurity Profiling | HPLC-MS [54] | Structural elucidation of unknown impurities |
| Bioanalytical Studies | HPLC-MS [54] | Sensitivity in complex matrices, definitive metabolite ID |
| Raw Material ID | HPLC-UV | Sufficient for known materials, cost-efficient |
| Forced Degradation | Complementary use | HPLC-UV for quantification, HPLC-MS for degradation product identification |
The Scientist's Toolkit: Essential Research Reagent Solutions
Table 4: Key Reagents and Materials for HPLC-UV Method Development
| Reagent/Material | Function | Application Notes |
|---|---|---|
| High-Purity Type-B Silica Columns | Minimize secondary interactions with metallic impurities [70] | Essential for basic compounds to reduce tailing |
| Ammonium Formate/Acetate Buffers | Volatile mobile phase modifiers | MS-compatible; lower UV cutoff than phosphate |
| Trifluoroacetic Acid (TFA) | Ion-pairing agent for improved peak shape | Use at 0.1% for protein separations; may suppress MS signal |
| Derivatization Reagents (e.g., CMQT) | Enhance UV detectability [51] | Critical for compounds lacking chromophores |
| In-Line Degassers | Remove dissolved gases | Reduce baseline noise from bubble formation [71] |
| Post-column Static Mixers | Improve mobile phase homogeneity | Minimize noise from improper mixing [71] |
Integrated Workflow for HPLC-UV Problem Resolution
The systematic approach to addressing HPLC-UV technical challenges requires logical progression through diagnostic and corrective actions. The following workflow represents an optimized troubleshooting pathway:
HPLC-UV remains an indispensable analytical technique in pharmaceutical research despite the advanced capabilities of HPLC-MS. Through systematic management of peak tailing, baseline noise, and signal drift, HPLC-UV delivers exceptional quantitative precision, robustness, and cost-effectiveness for routine analysis. The complementary nature of these techniques enables comprehensive analytical strategies: HPLC-UV provides superior quantitative precision for quality control, while HPLC-MS offers definitive compound identification and trace analysis. Understanding their respective strengths allows researchers to deploy each technique strategically throughout the drug development pipeline, from early discovery through commercial quality control, ensuring data integrity while optimizing resource allocation. Future developments will likely focus on further integration of these complementary platforms, leveraging the quantitative strengths of HPLC-UV with the specificity of HPLC-MS in hybrid workflows that maximize analytical confidence throughout the pharmaceutical development lifecycle.
Managing Ion Suppression and Enhancing Sensitivity in HPLC-MS
Liquid chromatography-mass spectrometry (LC-MS) has become the reference technique for quantitative bioanalysis in drug development, pharmacokinetics, and biomarker research due to its unparalleled sensitivity and specificity [72]. However, its analytical performance is critically dependent on effectively managing a pervasive phenomenon known as ion suppression [72] [73]. This matrix effect occurs when co-eluting compounds interfere with the ionization efficiency of target analytes, leading to decreased signal intensity, compromised quantification accuracy, and reduced analytical robustness [72] [73]. As regulatory expectations for sensitivity and reproducibility continue to rise, particularly for quantifying trace-level analytes in complex biological matrices, understanding and mitigating ion suppression has become essential for generating reliable data that supports confident scientific and regulatory decisions [72].
This challenge is especially pertinent when comparing the fundamental characteristics of HPLC-MS with its predecessor, HPLC-UV. While HPLC-UV detects analytes based on their light-absorbing properties, making it susceptible to interferences from any matrix components with chromophores, HPLC-MS was initially celebrated for its superior selectivity [73]. However, analysts now recognize that this selectivity can be profoundly compromised by ion suppression, wherein matrix components that may not even appear in the mass spectra can drastically alter ionization efficiency [73]. The following sections will objectively compare these techniques, provide experimental data demonstrating practical approaches to manage ion suppression, and detail advanced methodologies that enhance sensitivity for contemporary analytical applications.
HPLC-UV vs. HPLC-MS: A Performance Comparison for Specificity Testing
Fundamental Detection Principles and Specificity Implications
The core distinction between HPLC-UV and HPLC-MS lies in their detection mechanisms, which directly impact their specificity, sensitivity, and susceptibility to matrix effects. HPLC-UV operates on the principle of ultraviolet-visible spectroscopy, where analytes are detected based on their ability to absorb light at specific wavelengths after chromatographic separation [55]. This detection method is inherently susceptible to interference from any co-eluting compounds that absorb light at similar wavelengths, potentially leading to misidentification or inaccurate quantification [73]. In contrast, HPLC-MS separates compounds chromatographically and then ionizes them for detection based on their mass-to-charge ratio (m/z) [72]. The tandem mass spectrometry (MS/MS) capability, particularly when using Multiple Reaction Monitoring (MRM), provides an additional dimension of selectivity by monitoring specific precursor-to-product ion transitions, dramatically reducing background noise and enhancing confidence in analyte identification [72].
Comparative Performance Data
The theoretical advantages of HPLC-MS translate into quantifiable performance benefits, especially for complex matrices and trace-level analysis. The table below summarizes key comparative parameters based on validation data from recent applications.
Table 1: Performance Comparison Between HPLC-UV and HPLC-MS Methods
| Analytical Parameter | HPLC-UV Performance | HPLC-MS/MS Performance | Application Context |
|---|---|---|---|
| Detection Capability | Limited to µg/mL range [60] | ng/L to pg/mL range [72] [55] | Pharmaceutical analysis [60] vs. environmental monitoring [55] |
| Selectivity | Moderate (based on retention time & UV spectrum) [55] | High (based on mass, fragmentation, & retention time) [72] [55] | Analysis in complex biological/environmental matrices |
| Susceptibility to Matrix Effects | High (interference from any chromophore) [73] | Moderate (ion suppression from co-eluting ions) [73] | Bioanalysis [72], Environmental [55] [61] |
| Linear Dynamic Range | Limited (typically 2-3 orders of magnitude) | Wide (4-6 orders of magnitude) [72] | Quantification of analytes at varying concentrations |
| Sample Preparation Requirements | Often extensive to remove interferents [55] | Can be minimal, but optimized to reduce ion suppression [72] | Streamlined workflows for high throughput |
The data demonstrate that HPLC-MS/MS offers superior sensitivity and selectivity, making it particularly suitable for applications requiring trace-level detection in complex matrices. However, its vulnerability to ion suppression necessitates specific mitigation strategies that are less critical for HPLC-UV workflows.
Understanding and Mitigating Ion Suppression in HPLC-MS
Mechanisms and Causes of Ion Suppression
Ion suppression primarily occurs in the ion source of the mass spectrometer when co-eluting substances alter the droplet formation or droplet charging processes during electrospray ionization (ESI), thereby reducing the efficiency with which target analytes are transferred to the gas phase as ions [73]. These interfering substances can originate from the sample matrix itself (endogenous compounds like salts, phospholipids, or metabolites) or from exogenous sources such as reagents, solvents, or contaminants introduced during sample preparation [73]. The severity of ion suppression is influenced by multiple factors, including the composition of the mobile phase, ion source parameters (e.g., gas temperature and flow rates), and the physicochemical properties of both the analytes and the matrix components [72] [73].
Systematic Strategies for Ion Suppression Mitigation
Addressing ion suppression requires a holistic approach that spans the entire analytical workflow. The following strategies have proven effective:
Optimized Sample Preparation: Implementing selective extraction techniques such as solid-phase extraction (SPE) or protein precipitation can significantly remove interfering matrix components before analysis [72] [73]. The cleanliness of the extract is paramount; for instance, in the bioanalysis of antisense oligonucleotides, microflow LC-MS/MS sensitivity improvements were directly linked to sample cleanness [72].
Chromatographic Resolution: Improving the separation of analytes from matrix interferences is a fundamental strategy. This can be achieved by optimizing the chromatographic method to increase retention time differences or by using comprehensive two-dimensional liquid chromatography (LC×LC), which dramatically increases peak capacity and separation power [74]. Recent advancements in LC×LC have combined different separation mechanisms (e.g., reversed-phase with hydrophilic interaction liquid chromatography) to effectively resolve complex mixtures [74].
Mobile Phase and Instrument Optimization: Using volatile buffers (e.g., ammonium formate or acetate) instead of non-volatile salts or ion-pairing agents enhances spray stability and ionization efficiency [72] [75]. Regular maintenance and cleaning of the ion source and LC flow path are also crucial to prevent contamination buildup that exacerbates suppression [72].
Internal Standardization: The use of stable isotope-labeled internal standards (SIL-IS) is considered the gold standard for correcting variability in ionization efficiency and ion suppression, as they experience nearly identical matrix effects as the target analytes [76]. For non-targeted analyses, innovative workflows like the IROA TruQuant method use a library of stable isotope-labeled standards and companion algorithms to measure and correct for ion suppression across a wide range of metabolites [76].
The logical relationship and application priority of these strategies can be visualized in the following workflow:
Figure 1: A sequential workflow for mitigating ion suppression in HPLC-MS, prioritizing the most impactful strategies.
Experimental Protocols for Enhanced Sensitivity and Robustness
Protocol 1: Green UHPLC-MS/MS for Trace Pharmaceutical Monitoring
This protocol, adapted from a method for detecting pharmaceuticals in water, emphasizes sensitivity and sustainability with a short analysis time [55].
- Sample Preparation: Utilize solid-phase extraction (SPE) without an evaporation step to minimize solvent consumption and analyte loss. Reconstitute the extract directly in the initial mobile phase composition [55].
- Chromatographic Conditions:
- Column: Reversed-phase C18 column (e.g., 100 mm × 2.1 mm, 1.8 µm).
- Mobile Phase: (A) Water with 0.1% formic acid; (B) Acetonitrile with 0.1% formic acid.
- Gradient: Optimize for a rapid run (e.g., 10 minutes) with a steep gradient elution.
- Flow Rate: 0.3-0.4 mL/min.
- Column Temperature: 40-50°C.
- Mass Spectrometry:
- Ionization: Electrospray Ionization (ESI) in positive/negative switching mode.
- Detection: Multiple Reaction Monitoring (MRM).
- Source Parameters: Optimize desolvation temperature and gas flows for maximum ion yield.
- Validation Metrics: The method achieved Limits of Quantification (LOQ) at the ng/L level (e.g., 300 ng/L for carbamazepine), precision of <5.0% RSD, and recovery rates from 77-160% [55].
Protocol 2: Rapid LC-MS/MS for Bioanalysis of Ketamine and Metabolites
This protocol is designed for high-throughput clinical analysis, featuring minimal sample preparation and a short runtime [75].
- Sample Preparation: Implement a streamlined protein precipitation protocol using a small sample volume (e.g., 50-100 µL of plasma) [75].
- Chromatographic Conditions:
- Column: Reversed-phase C18 column.
- Mobile Phase: (A) Aqueous ammonium hydrogen carbonate solution; (B) Pure acetonitrile.
- Gradient: Employ a fast gradient for separation of ketamine, norketamine, and hydroxymetabolites within a few minutes.
- Mass Spectrometry:
- Ionization: Positive Electrospray Ionization (ESI+).
- Detection: MRM.
- Ion Source: Tune interface parameters (capillary voltage, nebulizing gas pressure) for optimal sensitivity [72].
- Performance: The method demonstrated linearity over 1-1000 ng/mL for ketamine, with high accuracy, precision, and consistent matrix effects, making it suitable for pharmacokinetic studies [75].
Advanced Solutions: Instrumentation and Research Toolkit
Key Research Reagent Solutions
Successful implementation of robust HPLC-MS methods relies on specific reagents and materials. The following table details essential components and their functions.
Table 2: Essential Research Reagents and Materials for HPLC-MS Method Development
| Item | Function/Application | Example from Literature |
|---|---|---|
| Stable Isotope-Labeled Internal Standards (SIL-IS) | Corrects for analyte loss during preparation and ion suppression during analysis [76]. | Ketamine-d4 for bioanalysis of ketamine [75]. |
| Hydrophilic-Lipophilic Balanced (HLB) SPE Sorbent | Extracts a broad range of analytes with diverse polarities from aqueous matrices [61]. | Used for concentrating emerging contaminants from water [61]. |
| Volatile Buffers (Ammonium Formate/Acetate) | Provides pH control without causing ion suppression; compatible with ESI [72] [75]. | Ammonium hydrogen carbonate in ketamine method [75]. |
| IROA Internal Standard (IROA-IS) Library | Enables ion suppression correction and normalization in non-targeted metabolomics [76]. | IROA TruQuant Workflow for measuring ovarian cancer cell response [76]. |
Instrumental and Analytical Workflow Innovations
Beyond reagents, technological advancements are key to enhancing sensitivity. The integration of comprehensive two-dimensional LC (LC×LC) with mass spectrometry significantly boosts separation power, reducing ion suppression by resolving analytes from complex sample matrices [74]. Furthermore, coupling LC×LC with ion mobility spectrometry (IMS) creates a four-dimensional separation platform (two retention times, one drift time, and m/z), further improving specificity for challenging applications [74]. For quantitative robustness, triple quadrupole (TQ) mass spectrometers operating in MRM mode remain the preferred platform due to their excellent selectivity and sensitivity [72].
Effectively managing ion suppression is not merely a troubleshooting exercise but a fundamental requirement for unlocking the full analytical potential of HPLC-MS. While the technique offers clear advantages over HPLC-UV in specificity, sensitivity, and dynamic range for research and drug development, its performance is inherently tied to the analyst's ability to mitigate matrix effects. A systematic approach—combining judicious sample clean-up, high-resolution chromatography, optimized MS parameters, and appropriate internal standardization—is essential for achieving the robustness, accuracy, and sensitivity demanded by modern bioanalysis and regulatory standards. The continued innovation in instrumentation, such as comprehensive 2D-LC and advanced correction algorithms, promises to further push the boundaries of what is detectable and quantifiable, solidifying the role of HPLC-MS as an indispensable tool in scientific discovery.
System Suitability Testing (SST) serves as a critical quality control measure in High-Performance Liquid Chromatography (HPLC) to verify that the entire analytical system—comprising the instrument, reagents, column, and analyst—is performing adequately for its intended purpose at the time of analysis [77] [78]. Unlike Analytical Instrument Qualification (AIQ), which proves an instrument operates as manufactured across defined ranges, SST is method-specific and must be performed each time an analysis is conducted, ensuring data reliability for that specific analytical run [78]. For regulated industries like pharmaceuticals, failure to meet pre-defined SST criteria necessitates discarding the entire assay run, underscoring its importance in guaranteeing the quality of analytical results [78].
SST parameters are established during method validation and monitor key aspects of chromatographic performance. These typically include precision, resolution, tailing factor, retention time, and plate number [77]. The fundamental purpose of these tests is to ensure that a method maintains its specificity, precision, and robustness throughout its lifecycle, providing confidence that results reported for actual samples are accurate and reliable [78].
Quantitative Comparison of HPLC-UV and HPLC-MS Performance
The choice between HPLC with Ultraviolet detection (HPLC-UV) and HPLC with Mass Spectrometric detection (HPLC-MS) involves significant trade-offs in specificity, precision, and cost, which must be evaluated against analytical requirements.
Specificity and Sensitivity
HPLC-MS offers superior specificity and sensitivity, particularly for complex biological matrices. Its ability to identify compounds based on mass-to-charge ratio makes it indispensable for applications requiring unambiguous compound identification, such as metabolomics or multiresidue analysis [35]. Furthermore, HPLC-MS is becoming a near-universal detection method for ionizable compounds, combining incredible speed, sensitivity, and selectivity [35].
HPLC-UV relies on chromatographic separation and UV absorption, which can be sufficient for less complex samples but may suffer from interference from co-eluting compounds that share similar chromophores [11].
Precision and Repeatability
A comparative study of the repeatability of quantitative data revealed that HPLC-UV generally provides better precision in peak areas compared to HPLC-MS. On average, the precision for UV peak area detection was 2.5%, versus 6.8% for MS detection [14]. The study noted that the response factor of the UV detector is more constant, likely because the HPLC flow-rate was sufficiently stable, whereas the MS detector response can be more variable [14].
Cost and Operational Considerations
HPLC-UV represents a more accessible and cost-effective technology. Its operational costs are lower, and it does not require the same level of specialist expertise as HPLC-MS, making it suitable for routine quality control in various settings [35] [79]. A practical HPLC-UV platform has been successfully implemented for in-hospital therapeutic drug monitoring of multiple drugs, demonstrating robust performance in a clinical environment without requiring special analytical techniques [79].
HPLC-MS involves significantly higher initial investment, maintenance costs, and operational complexity [35]. This has limited its widespread adoption for routine testing in general hospitals, where cost-effectiveness is a major consideration [79].
Table 1: Performance Comparison of HPLC-UV and HPLC-MS
| Parameter | HPLC-UV | HPLC-MS |
|---|---|---|
| Specificity | Moderate (based on retention time and UV spectrum) | High (based on mass-to-charge ratio) |
| Sensitivity | Moderate (typically µg/mL to ng/mL) | High (typically ng/mL to pg/mL) |
| Precision (Peak Area RSD) | ~2.5% [14] | ~6.8% [14] |
| Matrix Effect Resistance | Lower | Higher due to mass selectivity |
| Operational Cost | Lower | Significantly Higher |
| Technical Expertise Required | Moderate | High |
| Best Suited For | Routine quality control, stability testing, less complex matrices | Bioanalysis, trace analysis, complex matrices, metabolite identification |
Table 2: Application-Based Method Selection Guide
| Application Area | Recommended Technique | Rationale |
|---|---|---|
| Pharmaceutical Quality Control | HPLC-UV | Excellent precision, robustness, and cost-effectiveness for API and related substance quantification [35] |
| Therapeutic Drug Monitoring | HPLC-UV (for multi-drug platforms) [79] | Cost-effective for routine monitoring of established drugs with adequate separation |
| Bioanalytical Studies | HPLC-MS | Superior sensitivity and specificity for drugs in biological matrices [35] |
| Trace Residue Analysis | HPLC-MS | Unmatched sensitivity and confirmatory power for environmental, food, and forensic samples [35] |
| Stability-Indicating Assays | HPLC-UV | High precision for tracking degradant formation over time [35] |
Experimental Protocols and Case Studies
Case Study: Specificity in Drug Delivery System Analysis
A direct comparison study evaluated HPLC-UV and HPLC-MS for determining Levofloxacin released from mesoporous silica microspheres/nano-hydroxyapatite composite scaffolds, a complex drug-delivery system [11].
Experimental Protocol:
- HPLC Conditions: Sepax BR-C18 column (250×4.6 mm, 5 µm) maintained at 40°C with a mobile phase of 0.01 mol/L KH₂PO₄, methanol, and 0.5 mol/L tetrabutylammonium hydrogen sulphate (75:25:4) at 1 mL/min flow rate [11].
- Detection: UV detection at 290 nm for HPLC-UV; mass spectrometric detection for HPLC-MS [11].
- Sample Preparation: Levofloxacin standards (0.05-300 µg/mL) in simulated body fluid with solid-phase extraction pretreatment [11].
Results and SST Parameters: The regression equation for HPLC was y=0.033x+0.010, with R²=0.9991, whereas that for UV-Vis was y=0.065x+0.017, with R²=0.9999 [11]. The recovery rates of low, medium, and high (5, 25 and 50 µg/mL) concentrations of Levofloxacin determined by HPLC were 96.37±0.50, 110.96±0.23 and 104.79±0.06%, respectively, whereas those for UV-Vis were 96.00±2.00, 99.50±0.00 and 98.67±0.06%, respectively [11].
The study concluded that HPLC is the preferred method for evaluating sustained release characteristics from composite scaffolds due to its superior accuracy in the presence of impurity interference, demonstrating the critical importance of specificity in method selection for complex formulations [11].
Protocol: System Suitability Testing for HPLC-UV
Sample Preparation: For reliable SST results, the sample and reference standard should ideally be dissolved in the mobile phase or a similar amount of organic solvent, with comparable concentrations between sample and reference standard [78]. When filtering samples, potential adhesion of the analyte to the filter must be considered, particularly at lower analyte concentrations [78].
Critical SST Parameters and Acceptance Criteria:
- Injection Repeatability: Unless otherwise specified, five replicates of a standard are used if a relative standard deviation (RSD) of maximum 2.0% is required, and six replicates for an RSD >2.0% [78]. The European Pharmacopoeia imposes stricter requirements, with a maximum repeatability of 1.27% allowed when the specification upper limit is 103.0% and six replicates are injected [78].
- Resolution (Rs): Essential for quantitation, resolution measures how well two peaks are separated by considering their retention times and widths at the bases [78]. A clean separation between peaks is always desired for accurate quantitation [78].
- Tailing Factor (Symmetry Factor): Peak tailing can affect the accuracy of a chromatographic system as peak integration becomes challenging [78]. It is essential to determine the location of the upslope and downslope to maintain accuracy [78].
- Plate Number (N): While sometimes included in SST, the column plate number's value as a system suitability parameter is debated. Resolution (Rs) is generally more informative since the absolute value of the plate number does not necessarily reflect the quality of the separation [80].
Diagram 1: System Suitability Testing Workflow. This diagram illustrates the decision process for verifying HPLC system performance before sample analysis.
The Scientist's Toolkit: Essential Research Reagents and Materials
Successful HPLC analysis, whether with UV or MS detection, requires specific reagents and materials to ensure method validity and reliability.
Table 3: Essential Research Reagents and Materials for HPLC Analysis
| Item | Function | Application Notes |
|---|---|---|
| HPLC Column | Stationary phase for compound separation | Selection depends on analyte; C18 common for reversed-phase [11] [79] |
| Mobile Phase Buffers | Create elution environment | Volatile buffers (ammonium formate/aceteate) preferred for HPLC-MS [35] |
| Reference Standards | System calibration and qualification | High-purity primary standards required; not from same batch as samples [78] |
| Solid-Phase Extraction (SPE) Cartridges | Sample clean-up and concentration | Monolithic C18-silica cartridges enable rapid pretreatment [79] |
| Internal Standards | Normalize analytical variability | Stable isotope-labeled analogs ideal for HPLC-MS; structural analogs for HPLC-UV [11] |
System Suitability Testing provides the fundamental assurance that HPLC methods, whether utilizing UV or MS detection, maintain their specificity, precision, and robustness throughout their operational life. The choice between HPLC-UV and HPLC-MS involves careful consideration of their respective strengths and limitations. HPLC-UV remains the workhorse for routine quality control, stability testing, and applications where cost-effectiveness and precision are paramount. In contrast, HPLC-MS provides unparalleled specificity and sensitivity for complex matrices, trace analysis, and compound identification. By implementing rigorous SST protocols tailored to the selected technology and analytical requirements, researchers and drug development professionals can ensure the generation of reliable, meaningful data that supports pharmaceutical development and quality assurance.
Validation and Strategic Comparison: Making the Data-Driven Choice
Within the framework of ICH Q2(R1), the validation of analytical procedures is paramount for ensuring the reliability and consistency of data in pharmaceutical development. Specificity, defined as the ability to assess unequivocally the analyte in the presence of components that may be expected to be present, is a foundational parameter among the validation characteristics. This guide provides an objective comparison of High-Performance Liquid Chromatography coupled with Ultraviolet detection (HPLC-UV) and with Mass Spectrometric detection (HPLC-MS) for specificity testing. The fundamental difference in their operation—HPLC-UV identifies compounds based on chromophoric properties, while HPLC-MS separates and identifies based on mass-to-charge ratio—dictates their performance in distinguishing analytes from impurities, degradants, or matrix components. As we explore the experimental data and validation protocols, this comparison will arm researchers and drug development professionals with the evidence needed to select the most appropriate technique for their specific analytical challenges.
Comparative Performance Data: HPLC-UV vs. HPLC-MS
A direct comparison of the quantitative data for key validation parameters reveals the distinct strengths and limitations of each technique. The following table summarizes experimental findings from comparative studies, which are crucial for evaluating specificity.
Table 1: Comparison of Validation Parameters for HPLC-UV and HPLC-MS
| Validation Parameter | HPLC-UV Performance | HPLC-MS Performance | Key Experimental Findings |
|---|---|---|---|
| Specificity/Selectivity | Relies on chromophore and retention time; can be compromised by co-elution [33]. | High selectivity from mass fragmentation; can resolve co-eluting peaks with different masses [13]. | In apple juice analysis, UV quantification showed overestimation for 5 compounds due to co-elution, an issue mitigated by MS [33]. |
| Precision (Peak Area RSD) | Excellent precision (~2.5% RSD on average) [20]. | Good precision (~6.8% RSD on average); can degrade with source contamination [20] [25]. | High analyte concentrations (e.g., 50 ppm) can contaminate the MS ion source, leading to greater variability between runs [25]. |
| Limit of Detection (LOD) | Higher LOD (e.g., 0.33-4 ng) [33]. | Superior sensitivity (e.g., 0.003-2 ng) [33]. | LC-MS demonstrated better detection of low-level impurities in trimethoprim tablets compared to LC-UV, even with higher chemical noise [13]. |
| Linearity | Excellent linearity (r² > 0.990) [33]. | Excellent linearity (r² > 0.989) [33]. | Both methods demonstrated wide linear ranges suitable for quantitative analysis in complex matrices like apple juice [33]. |
| Analyte Identification | Provides UV spectrum; limited structural information [20]. | Confirms identity via molecular mass and fragmentation pattern [13]. | LC-MS was employed to acquire fragmentation patterns for trimethoprim and its degradants, providing structural insight [13]. |
Beyond the data in Table 1, the repeatability of retention times is generally consistent and comparable between both detection methods, with short-term precision around 0.2–0.3% RSD [20]. However, a key practical difference lies in the detectors' response to flow-rate fluctuations. HPLC-UV is a concentration-sensitive detector, meaning peak areas are inversely proportional to flow-rate, whereas HPLC-MS is a mass-sensitive detector, with peak areas theoretically independent of flow-rate, though ionization efficiency can be flow-dependent [20].
Experimental Protocols for Specificity Assessment
Protocol for Specificity Testing via HPLC-UV
The following methodology, adapted from studies comparing impurity profiles, outlines a standard approach for establishing specificity using HPLC-UV.
- 1. Instrumentation: An HPLC system with a binary or quaternary pump, autosampler, column thermostat, and a Diode Array Detector (DAD) or variable wavelength UV detector is used. A common setup employs a reversed-phase C18 column (e.g., 150-250 mm x 4.6 mm, 5 µm) maintained at a stable temperature [13].
- 2. Sample Preparation: The analyte is spiked with known impurities and/or degradants (generated by stress conditions like acid/base, oxidative, thermal, or photolytic exposure). A placebo sample, containing all excipients but the active ingredient, is also prepared [13].
- 3. Chromatographic Analysis: The method should use a mobile phase and gradient optimized for the separation of the analyte from its potential impurities. A volatile buffer (e.g., ammonium acetate or formate) is recommended if follow-up analysis by LC-MS is anticipated.
- 4. Data Analysis and Specificity Verification: The chromatograms of the stressed analyte, placebo, and standard solution are compared. Specificity is demonstrated by baseline resolution between the analyte peak and all interference peaks (from impurities, degradants, or placebo). The use of a DAD detector is crucial for confirming peak purity by comparing UV spectra across the peak [33].
Protocol for Specificity Testing via HPLC-MS
The protocol for HPLC-MS builds upon the HPLC-UV method, leveraging the mass spectrometer's unique capabilities for unambiguous identification.
- 1. Instrumentation: The HPLC system is coupled to a mass spectrometer equipped with an atmospheric pressure ionization source like Electrospray Ionization (ESI) or Atmospheric Pressure Chemical Ionization (APCI). A triple quadrupole or ion trap mass analyzer is typical for such studies [33] [13].
- 2. Sample Preparation: Similar to the HPLC-UV protocol, but the samples must be compatible with MS detection. This often means avoiding non-volatile buffers and salts that can cause ion suppression and instrument contamination.
- 3. Chromatographic and Mass Spectrometric Analysis: The HPLC conditions may be identical to the UV method. The mass spectrometer is first used in full-scan mode to identify all ions present in the sample. For each component of interest, Selected Ion Monitoring (SIM) or Multiple Reaction Monitoring (MRM) is used for highly selective and sensitive detection [10] [33].
- 4. Data Analysis and Specificity Verification: Specificity is established by confirming that the chromatographic peak for the analyte is associated with the correct precursor and product ions and that these ions are distinct from those of any interferent. Co-elution is less problematic as long as the mass transitions are unique. Software algorithms like Component Detection Algorithm (CODA) can be used to mine data for low-level impurities [13].
Workflow for Method Selection and Specificity Assessment
The following diagram illustrates the logical decision-making process for selecting and applying HPLC-UV or HPLC-MS for specificity testing, based on the analytical requirements.
Diagram 1: Specificity Validation Workflow
The Scientist's Toolkit: Essential Research Reagents and Materials
The successful implementation of specificity tests relies on a suite of key reagents and materials. The following table details these essential components and their functions in the context of method validation.
Table 2: Key Research Reagent Solutions for Specificity Validation
| Item | Function in Specificity Testing | Example & Notes |
|---|---|---|
| Volatile Buffers | Maintain pH for separation without causing ion suppression in MS or clogging the instrument. | Ammonium formate/acetate (e.g., 5-20 mM, pH 3-5). Critical for LC-MS compatibility [33] [35]. |
| Reference Standards | To identify and quantify the analyte and its related substances; used for peak confirmation and purity assessment. | High-purity analyte and impurity standards. Essential for both HPLC-UV and HPLC-MS to confirm retention time and spectral/mass identity [10]. |
| Stressed Samples | Samples subjected to forced degradation to generate potential degradants for specificity assessment. | Produced via acid/base hydrolysis, oxidation, thermal, and photolytic stress. Used to demonstrate the stability-indicating property of the method [35]. |
| Chromatographic Column | The medium for separating the analyte from interferences; core to demonstrating specificity. | Reversed-Phase C18 columns (e.g., Phenomenex Luna, Waters Xterra). Dimensions (e.g., 150 mm x 4.6 mm, 5 µm) affect resolution [10] [33]. |
| Mass Spectrometry Tuning & Calibration Solutions | To ensure accurate mass measurement and optimal instrument sensitivity. | Vendor-specific solutions containing ions of known mass-to-charge ratio (e.g., sodium formate clusters). Required for routine performance verification of HPLC-MS [33]. |
The comparative data and protocols presented lead to clear, evidence-based recommendations for employing HPLC-UV and HPLC-MS in specificity validation. HPLC-UV is the recommended technique for routine, high-precision quantification in quality control environments, especially for release testing and stability studies where the analyte and impurities are well-characterized and exhibit good UV absorbance. Its superior precision and robustness make it ideal for this role [20] [35]. Conversely, HPLC-MS is indispensable during method development and for applications requiring unequivocal identification, such as characterizing unknown impurities or degradants, analyzing compounds in complex biological matrices, or when extreme sensitivity is required [33] [13]. Its ability to provide molecular weight and structural information via MS/MS fragmentation overcomes the primary limitation of UV detection.
Ultimately, the choice between HPLC-UV and HPLC-MS for specificity is not a question of which is universally better, but which is more fit-for-purpose. For many pharmaceutical applications, a complementary strategy is most powerful: using HPLC-MS for initial method development and impurity identification, followed by a transfer to a validated and robust HPLC-UV method for routine quality control testing. This hybrid approach leverages the unparalleled specificity of MS for discovery and the exceptional quantitative precision and practicality of UV for ongoing compliance and monitoring.
In the field of analytical chemistry, High-Performance Liquid Chromatography (HPLC) coupled with different detectors is a cornerstone technique for qualitative and quantitative analysis. The choice between ultraviolet (UV) and mass spectrometric (MS) detection is a critical one, influencing the reliability, cost, and applicability of an analytical method. This guide provides an objective, data-driven comparison of HPLC-UV and HPLC-MS, focusing on three fundamental performance metrics: sensitivity (as defined by Limit of Detection and Quantification), linearity, and precision. Understanding these differences is essential for researchers, scientists, and drug development professionals to select the most appropriate technique for their specificity testing research, ensuring data quality while optimizing resource allocation.
Comparative Data of HPLC-UV vs. HPLC-MS
The following tables summarize key validation parameters for both techniques, as reported in comparative studies for the analysis of various compounds.
Table 1: Comparison of Sensitivity and Linearity
| Analyte / Matrix | Technique | LOD | LOQ | Linearity Range | Correlation Coefficient (r²) | Citation |
|---|---|---|---|---|---|---|
| Phenolic Compounds in Apple Juice | UHPLC-UV | 0.33 - 4 ng | 0.5 - 10 ng | Not Specified | > 0.990 | [33] |
| UHPLC-MS/MS | 0.003 - 2 ng | 0.007 - 6.67 ng | Not Specified | > 0.989 | [33] | |
| Diclofenac Sodium in Dosage Form | HPLC-UV | 12.5 ng/mL | Not Specified | 10 - 200 µg/mL | > 0.998 | [81] |
| Cefquinome in Sheep Plasma | HPLC-UV | Not Specified | 0.02 µg/mL | 0.02 - 12 µg/mL | Not Specified | [82] |
| Tetracyclines in Medicated Feed | HPLC-DAD | 4.2 - 10.7 mg/kg | Not Specified | 0.01 - 0.3 mg/mL | Not Specified | [83] |
| LC-MS | 5.6 - 10.8 mg/kg | Not Specified | (100x dilution of DAD range) | Not Specified | [83] |
Table 2: Comparison of Precision and Accuracy
| Analyte / Matrix | Technique | Precision (Intra-day RSD%) | Precision (Inter-day RSD%) | Accuracy (% Recovery) | Citation |
|---|---|---|---|---|---|
| Phenolic Compounds in Apple Juice | UHPLC-UV | < 4.0% | 2.6 - 6.2% | 94.3 - 110.4% | [33] |
| UHPLC-MS/MS | < 5.8% | 3.0 - 10.0% | 91.2 - 113.3% | [33] | |
| Simple Organic Compounds | HPLC-UV | ~1% RSD (Peak Area) | Not Specified | Not Specified | [20] |
| HPLC-APCI-MS | ~1.5-2% RSD (Peak Area) | Not Specified | Not Specified | [20] | |
| Cefquinome in Sheep Plasma | HPLC-UV | < 5% (Intra & Inter-day) | < 5% (Intra & Inter-day) | 92.0 - 93.9% | [82] |
| Tetracyclines in Medicated Feed | HPLC-DAD | Not Specified | Not Specified | 72.2 - 101.8% | [83] |
| LC-MS | Not Specified | Not Specified | 45.6 - 87.0% | [83] | |
| Eight Coccidiostats in Beef | HPLC-MS/MS | Not Specified | Not Specified | > 70% | [84] |
| UPLC-MS/MS | Not Specified | Not Specified | > 70% | [84] |
Experimental Protocols for Comparison
To ensure a fair and accurate comparison between techniques, studies often employ parallel experimental protocols.
Protocol for Phenolic Compounds in Apple Juice
A study comparing the quantification of 15 major phenolic compounds in apple juice used the same UHPLC system and sample preparation for both UV and MS detection [33].
- Sample Preparation: Apple juice was diluted with an equal volume of MeOH with 1% acetic acid to enhance compound stability during analysis [33].
- Chromatography: Separation was achieved on a reversed-phase C18 column using a gradient elution with a total run time of 35 minutes, optimized to avoid co-elutions [33].
- Detection:
- Validation: Both methods were validated simultaneously for linearity, LOD, LOQ, precision, and recovery using the same standard solutions and spiked samples [33].
Protocol for Tetracyclines in Medicated Feed
A comparison of HPLC-DAD and LC-MS for determining tetracyclines used a single extraction protocol [83].
- Extraction: Feed samples were extracted with a mixture of acetonitrile and 0.01 M citric buffer (pH 3.0) by shaking, centrifugation, and filtration [83].
- Chromatography: Different columns and mobile phases were used for each detection method, tailored to the respective detector's requirements [83].
- Analysis: The same extracted sample was analyzed by both HPLC-DAD and LC-MS, with the latter requiring a 100-fold dilution of the extract prior to injection [83].
Decision Workflow: Selecting the Right Detector
The choice between HPLC-UV and HPLC-MS depends on the analytical requirements and constraints. The following diagram illustrates the key decision-making process.
The Scientist's Toolkit: Essential Research Reagents and Materials
Table 3: Key Reagents and Materials for HPLC-UV and HPLC-MS Analysis
| Item | Function in Analysis | Common Examples / Notes |
|---|---|---|
| HPLC-Grade Solvents | Mobile phase components; minimize background noise and system contamination. | Acetonitrile, Methanol, Water [82] [81] [83] |
| Buffers & Additives | Modify mobile phase pH and ionic strength to control retention, selectivity, and peak shape. | Trifluoroacetic Acid (TFA), Formic Acid, Ammonium Acetate, Phosphate buffers [20] [82] [83] |
| Analytical Standards | Used for calibration, quantification, and method validation. | Certified reference materials of target analytes (e.g., Cefquinome, Diclofenac Sodium) [82] [81] |
| Reverse-Phase C18 Column | The most common stationary phase for separating a wide range of analytes based on hydrophobicity. | Phenomenex Gemini C18, Thermo BDS C18, Zorbax Eclipse XDB-C18 [82] [83] |
| Solid-Phase Extraction (SPE) Cartridges | Sample clean-up and pre-concentration to reduce matrix effects and improve sensitivity. | Often used for complex biological matrices like plasma [82] |
| Syringe Filters | Removal of particulate matter from samples prior to injection to protect the HPLC system and column. | 0.45 µm or 0.22 µm Nylon or PTFE membranes [82] [83] |
| Internal Standard | Correction for variability in sample preparation and injection; crucial for high-precision LC-MS. | Stable Isotope-Labeled Analogs (for MS), structurally similar compounds (for UV) [81] |
Discussion of Comparative Data
Sensitivity (LOD and LOQ)
Mass spectrometry generally offers superior sensitivity, often achieving lower LOD and LOQ values than UV detection. This is because MS detectors can distinguish the analyte based on its mass-to-charge ratio, significantly reducing chemical noise from the matrix [33]. For instance, in the analysis of phenolic compounds, UHPLC-MS/MS achieved LODs as low as 0.003 ng, while UHPLC-UV LODs were in the range of 0.33-4 ng [33]. However, this is not universal. In one study on tetracyclines in feed, HPLC-DAD and LC-MS showed comparable LODs, which was attributed to the specific extraction protocol and potential matrix effects suppressing the MS signal [83]. This highlights that the overall method sensitivity is a product of both the detector and the sample preparation.
Linearity
Both HPLC-UV and HPLC-MS are capable of exhibiting excellent linearity over wide concentration ranges, often with correlation coefficients (r²) greater than 0.990 or even 0.998 [33] [81]. The key difference often lies in the width of the linear range. HPLC-MS can be susceptible to saturation effects at very high concentrations due to detector limitations, potentially narrowing its linear dynamic range compared to UV for some applications. Nonetheless, for most quantitative applications, including drug analysis in plasma, both techniques provide sufficiently linear responses [82] [85].
Precision
The precision of both techniques, when methods are properly optimized, is generally high and comparable. Studies often report Relative Standard Deviations (RSD%) of less than 5% for both intra-day and inter-day precision [82] [33]. It is important to note the fundamental difference in how the detectors respond to flow fluctuations: UV detectors are concentration-sensitive, so peak areas are inversely proportional to flow rate, whereas MS detectors are mass-sensitive, making peak areas independent of flow rate [20]. This inherent property can make MS detection less susceptible to certain types of instrumental noise, though in practice, well-controlled systems yield excellent precision for both.
Specificity and Matrix Effects
This is a domain where HPLC-MS holds a definitive advantage. HPLC-UV identifies compounds based on retention time and UV spectrum, which can be insufficient for confirming the identity of an analyte in a complex matrix where co-elution is possible [86]. HPLC-MS, particularly tandem MS (MS/MS), provides unequivocal identification based on molecular mass and fragmentation pattern, greatly enhancing specificity [86] [84]. A critical consideration for LC-MS is the "matrix effect," where co-eluting compounds can suppress or enhance the ionization of the analyte, leading to inaccurate results [33] [83]. The use of an internal standard, ideally a stable isotope-labeled version of the analyte, is essential to correct for this [86].
The choice between HPLC-UV and HPLC-MS is not a matter of one being universally superior to the other, but rather of selecting the right tool for the specific analytical problem.
- HPLC-UV is a robust, cost-effective, and readily available technology. It is an excellent choice for routine analysis of well-characterized compounds present at relatively high concentrations in simple matrices, where its precision and linearity are fully sufficient.
- HPLC-MS is the definitive technique for applications demanding high sensitivity, unambiguous identification, and analysis in complex matrices. Its power comes with higher operational costs, complexity, and the need to carefully manage matrix effects.
Researchers must weigh the requirements for sensitivity, specificity, and throughput against budgetary and operational constraints. The data and workflows presented in this guide provide a foundation for making an evidence-based decision to ensure the success of specificity testing research in drug development and beyond.
In the realm of high-performance liquid chromatography (HPLC), the choice of detection system is a critical determinant of the reliability and scope of analytical data. Two of the most prominent detection methodologies are ultraviolet (UV) detection and mass spectrometric (MS) detection. HPLC-UV employs a concentration-sensitive detector that measures the absorption of ultraviolet light by analytes as they pass through a flow cell [20]. Its widespread adoption is fueled by its robustness, cost-effectiveness, and excellent quantitative precision for compounds possessing a chromophore. In contrast, HPLC-MS is a mass-flux sensitive detector that identifies compounds based on their mass-to-charge ratio (m/z) following ionization [20] [87]. This capability provides unparalleled specificity and sensitivity, making it indispensable for identifying unknown compounds, confirming analyte identity, and conducting trace-level analysis in complex matrices such as biological fluids [12].
The fundamental difference in detection principle—concentration sensitivity versus mass sensitivity—is a primary source of the correlative and discrepant behaviors observed between the two techniques. The UV detector's response is inversely proportional to the mobile phase flow-rate, whereas the MS detector's peak area is theoretically independent of it, though its ionization efficiency can be flow-dependent [20]. Understanding the operating boundaries and inherent strengths of each detector is essential for selecting the appropriate tool for specificity testing in drug development and for correctly interpreting the resulting data, particularly when they disagree.
Performance Comparison: Quantitative Data and Specificity
Repeatability and Quantitative Precision
A direct comparison of the repeatability of quantitative data reveals a clear trend: HPLC-UV generally offers superior precision for peak area measurements under stable operating conditions. A controlled study measuring the precision of peak areas for a series of probe compounds found that the average precision for UV detection was 2.5%, compared to 6.8% for MS detection [14]. This difference is attributed to the more constant response factor of the UV detector when the HPLC flow-rate is stable. The repeatability of retention times, however, was nearly identical for both detection modes, with precisions of about 0.2–0.3% for short-term measurements [20].
The discrepancy in quantitative precision can be amplified in practice. For instance, a forum user reported a case where HPLC-UV provided stable results (around 50 ppm) for a molecule across different days, while HPLC-MS yielded highly variable data (50 ppm and 15 ppm) [25]. This inconsistency in MS data was attributed to the destructive nature of MS analysis and the potential for source contamination. Each analysis can gradually degrade the instrument's performance, especially when analyzing high-concentration samples (e.g., 50 ppm), which can contaminate the ion source and lead to declining response in subsequent runs [25].
Table 1: Comparison of Key Performance Indicators for HPLC-UV and HPLC-MS
| Performance Indicator | HPLC-UV | HPLC-MS |
|---|---|---|
| Typical Quantitative Precision (RSD%) | ~2.5% [14] | ~6.8% [14] |
| Detection Sensitivity | Good for chromophores | Excellent (trace levels) [12] |
| Structural Information | Limited (UV spectrum) | High (Molecular weight, fragmentation pattern) [13] [12] |
| Impact of Co-elution | Significant (Peak area distortion) | Can be mitigated with selective detection [33] |
| Susceptibility to Matrix Effects | Moderate | High (Ion suppression/enhancement) [33] |
Specificity and Identification Capabilities
When the analytical question shifts from "how much" to "what is it," the balance tips decisively in favor of HPLC-MS. The specificity of UV detection is limited, as many compounds may have similar UV spectra, and co-eluting compounds can lead to inaccurate quantitation due to overlapping signals [33]. MS detection, by providing molecular weight and structural information, excels in characterizing impurities and degradants. A study on trimethoprim tablets demonstrated that LC-MS could successfully characterize impurities and degradants, providing fragmentation patterns that offered insight into their structures—a task that is challenging for LC-UV alone [13].
Furthermore, MS detection is far more effective at detecting compounds with poor UV absorbance. In a study on glibenclamide, LC-MS provided more accurate, specific, and precise results than fluorescence detection, largely because the analyte has a small absorption coefficient, making HPLC-UV impractical [20]. Modern high-resolution MS (HRMS) instruments, such as Time-of-Flight (ToF) or Orbitrap systems, further enhance this capability by providing accurate mass measurement, which allows for the deduction of molecular formulas for unknown compounds [12].
Experimental Protocols and Methodologies
Representative Experimental Workflow
A typical protocol for comparing HPLC-UV and HPLC-MS performance, or for using them in concert, involves several key stages. The following diagram outlines the general workflow for analyzing a pharmaceutical sample and reconciling data from both techniques.
Detailed Methodological Considerations
Sample Preparation: For stability, especially in large batches, samples are often prepared in acidified methanol (e.g., with 1% acetic acid) and stored at 4°C in the autosampler to maintain analyte integrity over the analysis period [33].
Chromatographic Separation: Both detection methods can use the same core HPLC system and column. A common setup involves an Agilent TC-C18 column with a mobile phase consisting of methanol and water, sometimes acidified (e.g., with orthophosphoric acid to pH 3.5) to improve peak shape [88]. The column effluent is often split to direct a portion to the UV detector and a portion to the MS interface.
Instrumental Parameters:
- HPLC-UV: A variable wavelength UV detector or a photodiode array (PDA) detector is used. The wavelength is set based on the analyte's maximum absorption (e.g., 241 nm for repaglinide) [88].
- HPLC-MS: An atmospheric pressure chemical ionization (APCI) or electrospray ionization (ESI) source is common. The mass analyzer (e.g., triple quadrupole) is typically operated in Selected Reaction Monitoring (SRM) mode for quantification or full-scan mode for identification [33]. Key parameters to optimize include gas flows, source temperature, and collision energies.
Method Validation: Both methods are validated according to International Conference on Harmonization (ICH) guidelines, assessing linearity, precision, accuracy (recovery), limit of detection (LOD), and limit of quantitation (LOQ) [88]. For instance, a method for repaglinide showed excellent linearity (r² > 0.999) for both UV and HPLC-MS, with accuracy (recovery) close to 100% for both [88].
The Scientist's Toolkit: Essential Research Reagents and Materials
The following table details key consumables and equipment essential for conducting HPLC-UV and HPLC-MS analyses in a pharmaceutical research context.
Table 2: Essential Research Reagents and Materials for HPLC-UV and HPLC-MS Analysis
| Item | Function/Purpose | Example from Literature |
|---|---|---|
| Reverse-Phase C18 Column | The core stationary phase for separating analytes based on hydrophobicity. | Agilent TC-C18 (250 mm × 4.6 mm, 5 µm) [88] |
| HPLC-Grade Methanol & Water | The primary components of the mobile phase; high purity is critical to reduce background noise. | Mobile phase: Methanol:Water (80:20 v/v) [88] |
| Ammonium Acetate / Formate | Volatile buffers for mobile phase, essential for MS compatibility to prevent source contamination. | 20 mM ammonium formate in mobile phase [35] |
| Acetic / Formic Acid | Mobile phase additives to control pH and improve ionization efficiency in MS. | 0.05% formic acid in acetonitrile [35] |
| Reference Standards | Highly purified analytes used for instrument calibration, method development, and identification. | Repaglinide reference standard for calibration [88] |
| Syringe Filters | For clarifying sample solutions prior to injection to protect the column and instrumentation. | Sample filtration after extraction [88] |
Decision Framework: When to Use UV or MS Detection
The choice between HPLC-UV and HPLC-MS is a compromise of various advantages and drawbacks [20]. The following decision pathway provides a logical framework for selecting the appropriate detection method based on the analytical goal.
HPLC-UV is the recommended choice for routine, high-precision quantification of known compounds with good UV absorbance in relatively pure matrices. It is ideal for quality control labs where cost-effectiveness, robustness, and excellent precision are paramount, such as in stability-indicating assays for drug substances and products [35].
HPLC-MS is the superior technique for tasks requiring high sensitivity (e.g., bioanalysis, trace impurities), definitive identification of unknowns, or analysis of compounds with weak or no chromophores [20] [12]. Its power is also evident in characterizing complex mixtures, such as impurity and degradant profiles, where it can provide structural information that UV detection cannot [13].
A combined HPLC-UV-MS system offers the most comprehensive solution. This approach leverages the superior quantitative precision of UV for major components (e.g., the active pharmaceutical ingredient) while simultaneously using MS to identify and quantify co-eluting impurities or degradants that may not be fully resolved or may have poor UV response [33]. This is particularly valuable during method development and for in-depth specificity testing.
HPLC-UV and HPLC-MS are complementary analytical techniques, each with a distinct and vital role in pharmaceutical research. UV detection remains the workhorse for routine, high-precision quantification in quality control environments due to its robustness and excellent repeatability. Mass spectrometry, with its superior specificity and sensitivity, is the definitive tool for identification, structural elucidation, and trace analysis. The observed discrepancies between their datasets are not merely artifacts but are logical consequences of their differing operating principles and susceptibilities to factors like ion suppression, source contamination, and co-elution. A profound understanding of these factors, coupled with the strategic application of each technology as outlined in this guide, empowers scientists to make informed decisions, ensure data integrity, and effectively advance drug development projects.
High-Performance Liquid Chromatography (HPLC) serves as a foundational analytical technique in modern laboratories, with detection capability often determining its application scope. Two dominant detection methods—Ultraviolet (UV) and Mass Spectrometric (MS) detection—offer distinct advantages and limitations across various analytical scenarios. HPLC-UV employs a concentration-sensitive detector that measures the absorption of ultraviolet light by analytes, while HPLC-MS utilizes a mass-sensitive detector that identifies compounds based on their mass-to-charge ratio [20] [89]. This objective comparison examines these technologies within specificity testing research, focusing on instrumentation costs, solvent consumption, operational complexity, and analytical performance to guide researchers, scientists, and drug development professionals in selecting the appropriate technology for their specific applications.
The fundamental distinction between these detection systems lies in their operating principles and the type of information they provide. HPLC-UV detection is based on the Beer-Lambert law, where analyte concentration correlates directly with absorbance at specific wavelengths [90]. This reliable, straightforward principle has made UV detection a workhorse in quality control environments for decades. In contrast, HPLC-MS detection ionizes analyte molecules and separates them according to their mass-to-charge ratios, providing structural information and heightened specificity that surpasses what retention time alone can offer [89]. This capability has positioned MS detection as indispensable in research applications requiring compound identification, metabolomics, and trace analysis in complex matrices.
Instrumentation and Operational Cost Analysis
The financial implications of implementing HPLC-UV versus HPLC-MS span initial capital investment, ongoing operational expenses, and maintenance requirements, creating substantially different cost structures that significantly influence instrument selection.
Capital Investment and Maintenance
HPLC-UV systems represent a more accessible financial entry point, with complete systems typically requiring a lower initial investment compared to MS-based platforms. The operational simplicity of UV detectors translates to lower maintenance costs and less specialized service requirements [35]. These systems primarily consist of a deuterium lamp, flow cell, and photodiode, components that are relatively economical to maintain and replace [90].
In contrast, HPLC-MS systems command a premium price point, often costing 3-5 times more than comparable HPLC-UV configurations. This cost differential stems from the sophisticated components required for mass analysis, including the ion source, mass analyzer, and detector, all of which must operate under high vacuum conditions maintained by specialized pumping systems [89]. The operational complexity extends to maintenance requirements, with MS systems needing more frequent calibration, specialized technical expertise, and higher-cost replacement parts, contributing to a significantly higher total cost of ownership.
Solvent Consumption and Environmental Considerations
Solvent consumption represents a substantial portion of operational costs in HPLC, with significant implications for both economics and environmental sustainability. Traditional HPLC methods using 4.6 mm i.d. columns typically operate at flow rates of 1.0-1.5 mL/min, resulting in substantial solvent consumption over time [91]. However, modern approaches demonstrate that strategic downsizing of column dimensions can dramatically reduce this footprint.
Table 1: Solvent Consumption Comparison by Column Internal Diameter
| Column I.D. (mm) | Flow Rate (mL/min) | Solvent Use per Injection | Reduction vs. 4.6 mm |
|---|---|---|---|
| 4.6 (Standard) | 1.000 | 100% (Reference) | - |
| 3.0 | 0.425 | ~40% | 60% reduction |
| 2.1 | 0.208 | ~20% | 80% reduction |
As illustrated in Table 1, transitioning from conventional 4.6 mm i.d. columns to 2.1 mm i.d. formats reduces solvent consumption by approximately 80% [91]. This reduction aligns with the principles of green chemistry, minimizing environmental impact while simultaneously lowering operational costs. These benefits apply equally to both HPLC-UV and HPLC-MS systems, though MS detection particularly benefits from lower flow rates due to enhanced ionization efficiency in electrospray ionization (ESI) interfaces [91].
Analytical Performance Comparison
The selection between HPLC-UV and HPLC-MS often hinges on required analytical performance characteristics, including specificity, sensitivity, precision, and accuracy, each demonstrating significant differences between the two detection methods.
Specificity and Structural Elucidation
HPLC-MS provides superior specificity through its ability to differentiate compounds based on mass-to-charge ratios and fragmentation patterns. This capability is particularly valuable when analyzing compounds in complex matrices where co-elution may occur, as MS detection can resolve analytes that UV detection might confuse [33]. The tandem mass spectrometry (MS/MS) capabilities of modern systems further enhance specificity by providing structural information through controlled fragmentation, enabling confident compound identification and confirmation [65].
HPLC-UV specificity relies primarily on retention time and UV spectral matching, which can be adequate for well-characterized compounds in relatively simple matrices but may prove insufficient for complex samples. Diode array detectors (DAD) improve upon single-wavelength detection by capturing full spectra, enabling peak purity assessment and spectral matching against libraries [90]. Nevertheless, compounds with similar structures and UV spectra may co-elute without detection, potentially compromising accurate quantification without the orthogonal identification provided by MS.
Sensitivity and Detection Limits
Mass spectrometry generally offers superior sensitivity, with detection limits typically 10-1000 times lower than those achievable with UV detection, depending on the compound and ionization efficiency [33]. This enhanced sensitivity makes HPLC-MS particularly valuable for trace analysis applications such as quantifying low-abundance metabolites, detecting pharmaceutical impurities, or monitoring environmental contaminants.
UV detection sensitivity varies significantly based on a compound's molar absorptivity at the monitoring wavelength. Compounds with strong chromophores (e.g., aromatic rings, conjugated systems) may be detectable at nanogram levels, while those with weak UV absorption require alternative detection strategies [20]. The fundamental limitation of UV detection remains its inability to detect compounds lacking chromophores, a restriction not shared by MS detection.
Precision and Quantitative Performance
Despite its advantages in specificity and sensitivity, HPLC-MS generally demonstrates lower precision in quantitative measurements compared to HPLC-UV. A comprehensive comparison study reported average precision for UV peak area detection at 2.5% RSD (Relative Standard Deviation) versus 6.8% RSD for MS detection [20] [14]. This difference stems from the MS detector's sensitivity to fluctuations in ionization efficiency, which can be influenced by mobile phase composition, flow rate variations, and matrix effects [20].
HPLC-UV systems demonstrate exceptional precision in retention times (typically <0.1-0.3% RSD) and peak areas, making them well-suited for quality control environments where reproducible quantification is paramount [20] [35]. This reliability is evidenced in pharmaceutical stability studies, where HPLC-UV consistently generates highly reproducible data capable of tracking minute changes in drug impurity profiles over time [35].
Table 2: Analytical Performance Comparison Between HPLC-UV and HPLC-MS
| Performance Parameter | HPLC-UV | HPLC-MS |
|---|---|---|
| Specificity | Moderate (retention time + UV spectrum) | High (mass-to-charge ratio + fragmentation) |
| Sensitivity | Compound-dependent (ng level) | Generally higher (pg-fg level) |
| Precision (Peak Area) | ~2.5% RSD [20] [14] | ~6.8% RSD [20] [14] |
| Linear Dynamic Range | Typically 10³-10⁴ | Typically 10²-10³ |
| Matrix Effects | Minimal to moderate | Significant, requires management |
Operational Complexity and Workflow Considerations
Beyond analytical performance, practical implementation factors significantly influence the suitability of each technique for specific laboratory environments and applications.
Method Development and Validation
HPLC-UV methods typically involve straightforward development, with optimization focusing on chromatographic separation through mobile phase composition, column selection, and gradient profile. UV detection is generally more robust to minor method variations, making methods more transferable between instruments and laboratories [35].
HPLC-MS method development adds layers of complexity, requiring optimization of ionization parameters, mass transitions (for MS/MS), and careful management of matrix effects that can suppress or enhance ionization [33] [65]. Mobile phase selection is constrained by MS compatibility, requiring volatile additives such as ammonium formate or acetate instead of the phosphate buffers commonly used in HPLC-UV [20]. These factors extend development time and require more specialized expertise, but yield methods with superior specificity for complex applications.
Operational Workflow and Sample Throughput
The operational workflow for HPLC-UV is generally more streamlined, with faster system equilibration and less stringent requirements for mobile phase preparation. The robustness of UV detection makes it particularly suitable for high-throughput environments where continuous operation and minimal downtime are essential [35].
HPLC-MS workflows typically involve more elaborate system preparation, including extended vacuum stabilization, mass calibration, and potentially more complex sample preparation to mitigate matrix effects [65]. While modern systems have improved considerably in robustness, MS-based methods remain more susceptible to operational interruptions and require more highly trained personnel. However, for targeted applications in regulated environments, both systems can be validated to provide reliable, reproducible results.
Diagram 1: HPLC-UV vs. HPLC-MS Selection Guide. This decision workflow assists researchers in selecting the appropriate detection method based on specific analytical requirements and constraints.
Applications in Specificity Testing Research
The distinct characteristics of HPLC-UV and HPLC-MS make each technique particularly suited for different applications within specificity testing research and drug development.
Pharmaceutical Quality Control and Stability Testing
HPLC-UV remains the dominant technique for pharmaceutical quality control and stability testing, where its exceptional precision, robustness, and cost-effectiveness align perfectly with application requirements [35]. In stability-indicating assays, HPLC-UV reliably quantifies active pharmaceutical ingredients and their degradants with precision sufficient to track minute changes over time, directly supporting shelf-life determinations [35]. The technique's ability to provide highly reproducible data across different laboratories and instrument platforms makes it ideal for regulated environments where method transfer and compliance are critical considerations.
Bioanalytical and Metabolite Studies
HPLC-MS excels in bioanalytical applications where specificity and sensitivity requirements surpass UV capabilities. The analysis of drugs and their metabolites in biological matrices represents a prime application for LC-MS, as the technique can resolve analytes from complex endogenous compounds that would interfere with UV detection [65]. The MS capability to monitor multiple reaction transitions enables simultaneous quantification of parent drugs and their metabolites, providing comprehensive ADME (Absorption, Distribution, Metabolism, and Excretion) profiles that are essential in modern drug development [65].
Natural Product Analysis and Complex Matrices
The analysis of natural products and complex botanical extracts presents particular challenges where HPLC-MS provides distinct advantages. A comparative study of polyphenol quantification in apple juice demonstrated that while both techniques showed excellent correlation for major compounds, HPLC-MS provided superior capability for detecting minor components and resolving co-eluting compounds [33]. However, the study also noted that matrix effects could cause overestimation of certain compounds with MS detection, highlighting the importance of appropriate calibration approaches [33].
Experimental Protocols and Methodologies
To illustrate the practical implementation of both techniques, representative experimental protocols highlight key methodological considerations.
HPLC-UV Method for Stability-Indicating Assay
A validated UHPLC-UV method for pharmaceutical stability testing employed the following parameters [35]:
- Column: 100 mm × 3.0 mm, 2-μm dp C18 stationary phase
- Mobile Phase: 20 mM ammonium formate (pH 3.7) as aqueous component and 0.05% formic acid in acetonitrile as organic modifier
- Gradient Program: Multisegment gradient from 5% to 90% organic modifier over 13 minutes
- Flow Rate: 0.8 mL/min at 450 bar pressure
- Detection: UV absorbance at 280 nm
- Temperature: 40°C
- Injection Volume: 3 μL
This method successfully separated an active pharmaceutical ingredient from its process impurities and degradants, demonstrating the precision of HPLC-UV with retention time RSDs <0.1% and robust quantification of impurities at levels as low as 0.01% [35].
HPLC-MS/MS Method for Polyphenol Quantification
A comparative UHPLC-MS/MS method for phenolic compounds in apple juice utilized these conditions [33]:
- Column: Not specified in excerpt, but typically C18 chemistry
- Mobile Phase: Combination of aqueous solvent (likely acidified water) and organic modifier (acetonitrile or methanol) with volatile modifiers
- Gradient Program: 35-minute total run time with segmented MS data acquisition
- Ionization: Electrospray ionization (ESI) in negative mode for phenolic compounds
- Mass Analysis: Triple quadrupole operating in Selected Reaction Monitoring (SRM) mode
- Data Acquisition: Divided into three segments to avoid sugar signals in early elution and optimize detection of polar and non-polar phenolics
This method provided excellent sensitivity with LOD values significantly lower than HPLC-UV, though with slightly higher inter-day RSD (3.0-10.0%) compared to the UV method [33].
Research Reagent Solutions
Table 3: Essential Research Reagents and Materials for HPLC-UV and HPLC-MS
| Reagent/Material | Function in HPLC-UV | Function in HPLC-MS | Key Considerations |
|---|---|---|---|
| Ammonium Formate/Acetate | Volatile buffer for separation | MS-compatible buffer for separation | Preferred over phosphate for MS |
| Formic Acid | Mobile phase modifier | Ionization enhancer in ESI+ | Typically 0.05-0.1% concentration |
| Methanol/Acetonitrile | Organic mobile phase component | Organic mobile phase component | HPLC-grade purity required |
| C18 Stationary Phase | Reversed-phase separation | Reversed-phase separation | Various particle sizes (1.7-5μm) |
| Internal Standards | Correction for injection volume variation | Correction for matrix effects in ionization | Stable isotope-labeled for MS preferred |
The choice between HPLC-UV and HPLC-MS represents a strategic decision balancing analytical requirements against practical constraints. HPLC-UV offers exceptional precision, lower operational complexity, and reduced costs, making it ideal for quality control environments, stability testing, and applications involving known compounds with adequate chromophores. Conversely, HPLC-MS provides superior specificity and sensitivity, enabling compound identification, trace analysis, and complex matrix applications that surpass UV capabilities.
Modern trends toward miniaturization and sustainability benefit both techniques, with reduced column dimensions significantly decreasing solvent consumption and operational costs [91]. The decision framework presented in this analysis empowers researchers and drug development professionals to make informed selections based on their specific analytical needs, budgetary constraints, and operational capabilities, ensuring appropriate technology implementation for successful specificity testing research.
The coupling of High-Performance Liquid Chromatography (HPLC) with different detection systems forms the backbone of analytical characterization in modern laboratories. While HPLC separates the components of a mixture, the detector is responsible for revealing their identity and quantity. The choice between the ubiquitous Ultraviolet-Visible (UV) detector and the powerful Mass Spectrometric (MS) detector is a critical one, impacting everything from method development cost and complexity to the fundamental nature and reliability of the resulting data [92]. This guide provides an objective, data-driven comparison of HPLC-UV and HPLC-MS to help researchers and drug development professionals select the optimal technique based on their specific application needs and available resources.
The core distinction lies in what each detector measures. An HPLC-UV system detects the absorption of ultraviolet or visible light by a compound, which is a function of its chromophores. It is primarily a concentration-sensitive detector [62]. In contrast, an HPLC-MS system destroys the analyte during analysis, ionizing it and measuring its mass-to-charge ratio (m/z). It is fundamentally an mass-sensitive detector [25]. This fundamental difference dictates their respective strengths, limitations, and ideal application domains.
Technical Principles and Performance Comparison
How the Detectors Work
HPLC-UV operates on a straightforward principle. After separation in the column, the analyte passes through a flow cell where it is exposed to UV light. Compounds containing chromophores absorb this light at specific wavelengths, and the detector measures this absorption, producing a chromatogram where peak area is proportional to concentration [92]. It is a non-destructive technique, meaning the analyte remains intact for potential subsequent analysis [25].
HPLC-MS is more complex. The effluent from the HPLC column is introduced into an ion source, most commonly Electrospray Ionisation (ESI), where the analyte is converted into gas-phase ions. These ions are then sorted by their mass-to-charge ratio in a mass analyzer, such as a quadrupole [93]. Unlike UV detection, MS is a destructive technique; the analyte is consumed during the ionization and detection process. This can lead to gradual performance degradation as more samples are run, necessitating careful monitoring and source cleaning [25].
Comparative Performance Data
The following table summarizes key performance characteristics based on comparative studies, providing a quantitative basis for decision-making.
Table 1: Direct performance comparison between HPLC-UV and HPLC-MS based on experimental data
| Performance Metric | HPLC-UV | HPLC-MS | Experimental Context |
|---|---|---|---|
| Quantitative Precision | ~2.5% RSD (peak area) [14] | ~6.8% RSD (peak area) [14] | Comparative study of probe compounds; UV precision was generally better. |
| Limit of Detection (LOD) | Higher (e.g., 0.33-4 ng) [33] | Lower (e.g., 0.003-2 ng) [33] | Validation for phenolic compounds in apple juice; MS offers superior sensitivity. |
| Limit of Quantification (LOQ) | Higher (e.g., 0.5-10 ng) [33] | Lower (e.g., 0.007-6.67 ng) [33] | Same study as above; MS can quantify smaller amounts. |
| Analyte Stability | Stable response; lamp ages over years [25] | Performance degrades with analyte consumption & source contamination [25] | Forum discussion noting MS area counts can fall with replicate injections. |
| Tolerance to High Concentrations | Excellent for pure analytes [25] | Poor; high concentrations (e.g., 50 ppm) can contaminate ion source [25] | Analysis of a single molecule at 50 ppm; MS is better suited for trace analysis. |
Specificity and the Matrix Effect
A critical consideration in method development is specificity—the ability to accurately measure the analyte in the presence of other components.
HPLC-UV Specificity: Relies on chromatographic separation and selective wavelength detection. Specificity can be compromised if other compounds co-elute with the analyte and absorb at the same wavelength, leading to inaccurate quantification [33]. For simple matrices or pure compounds, this is often sufficient, but for complex samples like biological fluids or plant extracts, co-elution is a significant risk.
HPLC-MS Specificity: Offers a higher degree of specificity by using the mass-to-charge ratio as a second dimension of identification. The technique excels at distinguishing co-eluting compounds, provided they have different masses. Tandem MS (MS/MS), using a triple quadrupole in Multiple Reaction Monitoring (MRM) mode, further enhances specificity by monitoring a specific precursor ion and a unique product ion fragment [93].
The "matrix effect" is a major challenge in LC-MS, particularly with ESI. Co-eluting compounds from the sample matrix can suppress or enhance the ionization of the analyte, leading to inaccurate results [94]. While HPLC-UV is also susceptible to matrix interference from co-eluting chromophores, the effect on MS is often more pronounced and variable. Advances like UPLC with better chromatographic resolution can significantly reduce matrix effects by separating analytes from interferences more effectively [94].
Decision Framework and Experimental Considerations
Selection Workflow
The following diagram outlines a logical decision pathway for selecting between HPLC-UV and HPLC-MS based on application requirements.
Key Experimental Protocols from Literature
To ground the framework in practical science, below are summaries of key experimental methodologies from comparative studies.
Protocol 1: Comparing Repeatability of Quantitative Data [14]
- Objective: To directly compare the repeatability of retention times, peak efficiencies, and peak areas for HPLC-UV and HPLC-MS.
- Chromatography: Three groups of conventional, mostly basic analytes were separated under different experimental conditions.
- Detection: The same HPLC system was coupled to both a UV detector and an Atmospheric Pressure Chemical Ionization (APCI) mass spectrometric detector.
- Key Findings: While retention time repeatability was similar, peak area precision was significantly better for UV detection (2.5% on average) than for MS (6.8%). The study concluded that the UV detector's response factor was more constant.
Protocol 2: Quantifying Polyphenols in Complex Apple Juice Matrix [33]
- Objective: To develop and validate rapid UHPLC methods for quantifying 15 major phenolic compounds in apple juice using UV and MS/MS detection.
- Sample Prep: Juice was diluted with an equal volume of MeOH with 1% acetic acid to improve compound stability during analysis.
- Chromatography: UHPLC separation with a 35-minute run time to minimize co-elutions.
- Detection: Simultaneous quantification using a UV-PDA detector and an ESI-triple quadrupole mass analyzer in Selected Reaction Monitoring (SRM) mode.
- Validation: Both methods were validated for linearity, LOD, LOQ, precision, and recovery. MS detection provided lower LODs and LOQs, but UV showed excellent correlation for major compounds and was deemed fit-for-purpose for the genetic study.
Protocol 3: Addressing Matrix Effects in Pharmaceutical Analysis [94]
- Objective: To evaluate and compare matrix effects in the analysis of pharmaceuticals in surface water using HPLC-MS/MS and UPLC-MS/MS.
- Method: A group of 9 pharmaceuticals was analyzed in environmental water samples.
- Findings: Substantial matrix effects were observed with HPLC-MS/MS, requiring standard addition for accurate quantification. With UPLC-MS/MS, due to better resolution and narrower peaks, analytes co-eluted less with interferences, nearly eliminating matrix effects and allowing the use of simpler internal standardization.
The Scientist's Toolkit: Essential Research Reagents and Materials
Table 2: Key reagents, materials, and equipment for HPLC-UV and HPLC-MS workflows
| Item | Function / Description | Application Notes |
|---|---|---|
| LCMS Grade Solvents | High-purity solvents (acetonitrile, methanol, water) with minimal volatile additives. | Critical for MS to prevent ion suppression and source contamination [62]. |
| Structural Analogue Internal Standards | A compound with a structure and ionization behavior similar to the analyte. | Used in HPLC-MS to correct for variable matrix effects and ion suppression [94]. |
| Radial Flow Stream (RFS) End Fittings | A column fitting that splits flow, sending only the central portion to the detector. | Can increase HPLC efficiency and throughput to MS by managing mobile phase flow [62]. |
| Biocompatible LC Systems | HPLC systems with flow paths made of MP35N, gold, ceramic, or PEEK. | Essential for analyzing biomolecules or using high-salt/pH mobile phases in biopharma QC [50]. |
| Syringe Pumps | Provide precise, pulseless flow for sample introduction or mobile phase delivery. | Used for low-flow applications and to minimize background noise in both HPLC and MS [92]. |
The choice between HPLC-UV and HPLC-MS is not a question of which technology is universally superior, but which is most appropriate for a specific analytical problem. HPLC-UV remains a robust, cost-effective, and highly precise workhorse for quantifying known compounds in relatively simple matrices or at higher concentrations, making it ideal for quality control and standardized assays. HPLC-MS is the unequivocal choice for applications requiring definitive identification, structural elucidation, unparalleled sensitivity for trace analysis, and dealing with complex sample matrices, despite its higher cost, complexity, and potential for matrix effects.
The presented decision framework, supported by experimental data and protocols, provides a logical pathway for researchers to make this critical selection. By carefully considering the requirements for identification, sensitivity, matrix complexity, and available resources, scientists can confidently choose the detection method that will deliver the most reliable and meaningful data for their specificity testing research.
Conclusion
The choice between HPLC-UV and HPLC-MS for specificity testing is not a matter of one technique being universally superior, but rather of selecting the right tool for the specific analytical question. HPLC-UV remains a robust, cost-effective, and highly precise workhorse for quality control environments where analytes have strong chromophores and methods require exceptional reproducibility. In contrast, HPLC-MS provides unparalleled specificity, sensitivity, and definitive analyte identification for complex matrices, trace analysis, and compounds lacking a strong UV chromophore. The future of specificity testing lies in the intelligent application of these techniques, often in a complementary manner, alongside emerging technologies like vacuum ultraviolet detection and increased automation. By understanding their comparative strengths and validation requirements, scientists can reliably generate data that accelerates drug development and ensures product quality and safety.
References
- 1. Ultraviolet Detectors: Perspectives, Principles, and Practices [https://www.chromatographyonline.com/view/ultraviolet-detectors-perspectives-principles-and-practices]
- 2. How HPLC Detectors Work [https://www.thermofisher.com/us/en/home/industrial/chromatography/chromatography-learning-center/liquid-chromatography-information/hplc-system-components/how-hplc-detectors-work.html]
- 3. HPLC UV detection [https://www.elementlabsolutions.com/uk/chromatography-blog/post/hplc-uv-detection]
- 4. The LCGC Blog: UV Detection for HPLC—Fundamental ... [https://www.chromatographyonline.com/view/lcgc-blog-uv-detection-hplc-fundamental-principle-practical-implications-0]
- 5. Development of an improved and greener HPLC-DAD method ... [https://pubs.rsc.org/en/content/articlehtml/2025/ra/d5ra04381f]
- 6. High-performance liquid chromatograph with mass ... [https://www.mpi-bremen.de/en/HPLCMS.html]
- 7. HPLC-MS Analysis | Laboratory Testing Services [https://measurlabs.com/methods/liquid-chromatography-mass-spectrometry-hplc-ms/]
- 8. Use of high performance liquid chromatography-mass ... - PMC [https://pmc.ncbi.nlm.nih.gov/articles/PMC9426999/]
- 9. A sustainable multi-task HPLC–UV method for ... [https://www.nature.com/articles/s41598-025-07502-8]
- 10. Development and validation of HPLC-UV and LC-MS ... [https://pmc.ncbi.nlm.nih.gov/articles/PMC11546340/]
- 11. Comparison of high-performance liquid chromatography ... [https://pmc.ncbi.nlm.nih.gov/articles/PMC6425260/]
- 12. Why Use Liquid Chromatography-Mass Spectrometry? [https://www.ppd.com/blog/why-use-liquid-chromatography-mass-spectrometry-in-drug-discovery-and-development/]
- 13. Comparison between liquid chromatography-UV detection ... [https://pubmed.ncbi.nlm.nih.gov/12350089/]
- 14. Comparison of the Repeatability of Quantitative Data ... [https://pubmed.ncbi.nlm.nih.gov/10757294/]
- 15. Development and Validation of a High-Performance Liquid ... [https://pmc.ncbi.nlm.nih.gov/articles/PMC12061375/]
- 16. High-Throughput Experimentation: Where Does Mass ... [https://www.chromatographyonline.com/view/high-throughput-experimentation-where-does-mass-spectrometry-fit]
- 17. HPLC-MS/MS for Hit Generation - Assay Guidance Manual [https://www.ncbi.nlm.nih.gov/books/NBK126175/]
- 18. Practical Comparison of Different Approaches to Speed Up ... [https://www.chromatographyonline.com/view/practical-comparison-different-approaches-speed-lc-separations-0]
- 19. Preparing Samples for HPLC-MS/MS Analysis [https://www.organomation.com/preparing-samples-for-hplc-ms/ms-analysis]
- 20. Journal of Chromatography A [https://www.sciencedirect.com/science/article/abs/pii/S0021967399013278]
- 21. HPLC vs MS: Sensitivity and Selectivity Comparison [https://eureka.patsnap.com/report-hplc-vs-ms-sensitivity-and-selectivity-comparison]
- 22. The Different Types of HPLC Detectors [https://scioninstruments.com/us/blog/the-different-types-of-hplc-detectors/]
- 23. 3 reasons why you should upgrade from UV detection to ... [https://www.microsaic.com/2019/09/10/3-reasons-why-you-should-upgrade-from-uv-detection-to-mass-spectrometry/]
- 24. Comparison of UV and tandem mass spectrometric ... [https://pubmed.ncbi.nlm.nih.gov/14623601/]
- 25. Different results from HPLC and MS [http://www.chromforum.org/viewtopic.php?t=122286]
- 26. Development and validation of a novel HPLC-UV method ... [https://www.sciencedirect.com/science/article/pii/S2405844023010770]
- 27. Choices of chromatographic methods as stability indicating ... [https://pmc.ncbi.nlm.nih.gov/articles/PMC8027279/]
- 28. Development of Stability-Indicating Analytical Procedures ... [https://www.chromatographyonline.com/view/development-of-stability-indicating-analytical-procedures-by-hplc-an-overview-and-best-practices]
- 29. Development and validation of stability-indicating UHPLC ... [https://www.sciencedirect.com/science/article/abs/pii/S0731708525000986]
- 30. Stability-indicating HPLC-DAD/UV-ESI/MS impurity profiling of ... [https://pmc.ncbi.nlm.nih.gov/articles/PMC3059303/]
- 31. Evaluation of the clinical and quantitative performance ... [https://pmc.ncbi.nlm.nih.gov/articles/PMC10544152/]
- 32. Matrix Effects on Quantitation in Liquid Chromatography [https://www.chromatographyonline.com/view/matrix-effects-on-quantitation-in-liquid-chromatography-sources-and-solutions]
- 33. Comparison of Two Methods, UHPLC-UV and UHPLC-MS/ ... [https://pmc.ncbi.nlm.nih.gov/articles/PMC6270524/]
- 34. Compensate for or Minimize Matrix Effects? Strategies ... [https://pmc.ncbi.nlm.nih.gov/articles/PMC7412464/]
- 35. The Essence of Modern HPLC: Advantages, Limitations ... [https://www.chromatographyonline.com/view/essence-modern-hplc-advantages-limitations-fundamentals-and-opportunities]
- 36. The Pistoia Alliance's methods database project [https://www.sciencedirect.com/science/article/pii/S0731708525002481]
- 37. A Simple and Sensitive HPLC-MS/MS Assay for the ... [https://pmc.ncbi.nlm.nih.gov/articles/PMC9010218/]
- 38. LC–MS/MS quantification of 20(S)-protopanaxadiol in ... [https://www.nature.com/articles/s41598-025-01432-1]
- 39. Development and validation of an HPLC–MS/MS method ... [https://www.sciencedirect.com/science/article/pii/S2211383515001586]
- 40. Gradient vs. Isocratic - HPLC Elution Modes [https://lifesciences.danaher.com/us/en/products/chromatography-columns/topics/gradient-vs-isocratic-elution-hplc.html]
- 41. Isocratic Vs. Gradient Elution in Chromatography [https://www.phenomenex.com/knowledge-center/hplc-knowledge-center/isocratic-vs-gradient-elution-when-to-use-each?srsltid=AfmBOorHfZmHMZRwpf5jsvv-XQvpiuK1ivM8FfLWamgi2fnK1_ToUSt9]
- 42. When is Gradient Elution Better than Isocratic Elution? [https://www.biotage.com/blog/when-is-gradient-elution-better-than-isocratic-elution]
- 43. A Three-Pronged Template Approach for Rapid HPLC ... [https://www.chromatographyonline.com/view/three-pronged-template-approach-rapid-hplc-method-development-0]
- 44. Isocratic and gradient elution chromatography [https://www.sciencedirect.com/science/article/abs/pii/S002196730600166X]
- 45. HPLC-UV Method Development [https://www.nebiolab.com/hplc-uv-method-development-testing-9-articles-in-formulation/amp]
- 46. Charged aerosol detector response modeling for fatty acids ... [https://pmc.ncbi.nlm.nih.gov/articles/PMC8281619/]
- 47. CAD vs ELSD: Which HPLC Detector Is Your Better Option? [https://www.thermofisher.com/blog/analyteguru/cad-vs-elsd-which-hplc-detector-is-your-better-option/]
- 48. Alternative methods to assess the impurity profile of a ... [https://pubmed.ncbi.nlm.nih.gov/36150297/]
- 49. Detecting the undetectable in flash column ... [https://www.biotage.com/blog/detecting-the-undetectable-in-flash-column-chromatography-part-2]
- 50. New HPLC, MS, and CDS Products from 2024–2025 [https://www.chromatographyonline.com/view/new-hplc-ms-and-cds-products-from-2024-2025-a-brief-review]
- 51. Versatile High-Performance Liquid Chromatography and ... [https://pmc.ncbi.nlm.nih.gov/articles/PMC12348203/]
- 52. A comprehensive review-current development in ... [https://www.sciencedirect.com/science/article/pii/S2211715625003248]
- 53. Liquid Chromatography Mass Spectrometry (LC-MS) [https://www.eag.com/techniques/mass-spec/liquid-chromatography-mass-spectometry-lc-ms/]
- 54. LC-MS/MS in the Clinical Laboratory – Where to From Here? [https://pmc.ncbi.nlm.nih.gov/articles/PMC3052391/]
- 55. Development and validation of a green/blue UHPLC-MS ... [https://www.nature.com/articles/s41598-025-15614-4]
- 56. An Ultrahigh-Performance Liquid Chromatography ... [https://pmc.ncbi.nlm.nih.gov/articles/PMC12268736/]
- 57. Development and validation of a UHPLC-MS/MS method ... [https://www.sciencedirect.com/science/article/pii/S1570023225000212]
- 58. Review Matrix effects: the Achilles heel of quantitative high ... [https://www.sciencedirect.com/science/article/abs/pii/S0009912004003364]
- 59. Comparison of matrix effects in HPLC-MS/MS and UPLC ... [https://pubmed.ncbi.nlm.nih.gov/18343682/]
- 60. HPLC-MS standardization and validation methods for ... [https://www.sciencedirect.com/science/article/pii/S2405844025003433]
- 61. Development of an Efficient HPLC-MS/MS Method for the ... [https://www.mdpi.com/2297-8739/12/10/257]
- 62. Improving the performance of HPLC–MS using radial flow ... [https://pmc.ncbi.nlm.nih.gov/articles/PMC12227357/]
- 63. Volatile Buffer pH Ranges for LCMS & ELSD Detectors [https://www.nestgrp.com/protocols/trng/buffer.shtml]
- 64. Optimizing MS-Compatible Mobile Phases for IEX ... [https://www.chromatographyonline.com/view/optimization-ms-compatible-mobile-phases-iex-separation-monoclonal-antibodies-0]
- 65. High-performance liquid chromatography–tandem mass ... [https://pmc.ncbi.nlm.nih.gov/articles/PMC2359828/]
- 66. Comparative LC-MS/MS and HPLC-UV Analyses of ... [https://pubmed.ncbi.nlm.nih.gov/31532096/]
- 67. LC/MS Applications in Drug Development [https://www.bioagilytix.com/blog/lc-ms-applications-in-drug-development/]
- 68. Principles and applications of LC-MS in new drug discovery [https://pubmed.ncbi.nlm.nih.gov/16253874/]
- 69. Comparing volatile and non-volatile buffer systems in UPLC [https://www.sciencedirect.com/science/article/abs/pii/S0021967325002997]
- 70. Tailing Comparisons [https://www.sepscience.com/tailing-comparisons-7219]
- 71. The LCGC Blog: HPLC Diagnostic Skills–Noisy Baselines [https://www.chromatographyonline.com/view/lcgc-blog-hplc-diagnostic-skills-noisy-baselines]
- 72. Optimizing LC‑MS/MS Sensitivity: Strategies to Overcome ... [https://biotech-spain.com/en/articles/optimizing-lc-ms-ms-sensitivity-strategies-to-overcome-ion-suppression-and-boost-robustness-in-bioanalysis/]
- 73. Ion suppression; A critical review on causes, evaluation ... [https://www.sciencedirect.com/science/article/abs/pii/S0039914013001975]
- 74. HPLC 2025 Preview: Boosting the Separation Power of LC ... [https://www.chromatographyonline.com/view/boosting-the-separation-power-of-lc-lc]
- 75. Development and Validation of a Rapid LC–MS/MS Method ... [https://pmc.ncbi.nlm.nih.gov/articles/PMC12280840/]
- 76. Ion suppression correction and normalization for non- ... [https://www.nature.com/articles/s41467-025-56646-8]
- 77. System Suitability in HPLC Analysis [https://www.pharmaguideline.com/2017/09/system-suitability-in-hplc-analysis.html]
- 78. What are system suitability tests (SST) of analytical methods? [https://mpl.loesungsfabrik.de/en/english-blog/method-validation/sst]
- 79. Evaluation of the clinical and quantitative performance of a ... [https://jphcs.biomedcentral.com/articles/10.1186/s40780-023-00298-7]
- 80. Column Plate Number and System Suitability [https://www.chromatographyonline.com/view/column-plate-number-and-system-suitability-1]
- 81. Development and validation of a new HPLC analytical ... [https://pmc.ncbi.nlm.nih.gov/articles/PMC6323142/]
- 82. Development and Validation of a High-Performance Liquid ... [https://pmc.ncbi.nlm.nih.gov/articles/PMC3028820/]
- 83. Comparison of HPLC–DAD and LC–MS Techniques for the ... [https://link.springer.com/article/10.1007/s10337-021-04058-3]
- 84. Development and comparison of HPLC-MS/MS and UPLC ... [https://www.sciencedirect.com/science/article/abs/pii/S1570023217320846]
- 85. Rapid, Accurate and Precise Quantitative Drug Analysis [https://pubmed.ncbi.nlm.nih.gov/16204806/]
- 86. Analytical Method Validation: Back to Basics, Part II [https://www.chromatographyonline.com/view/analytical-method-validation-back-basics-part-ii]
- 87. How to Read LC-MS Chromatograms [https://www.news-medical.net/life-sciences/How-to-Read-LC-MS-Chromatograms.aspx]
- 88. Comparison of UV spectrophotometry and high ... [https://pmc.ncbi.nlm.nih.gov/articles/PMC3658086/]
- 89. Basic Principles of LC, HPLC, MS, & MS [https://chemyx.com/resources/knowledge-base/general-syringe-pump-info/basic-principles-hplc-ms-lc-ms/?srsltid=AfmBOoqEA6AKq2bOUlSfoOAuKCwMtnmXmTC2bDhBSj0jW0lgiuWVr_CL]
- 90. How It Works: UV Detection for HPLC [https://www.chromatographyonline.com/view/how-it-works-uv-detection-hplc-0]
- 91. Applying Sustainability Concepts to Modern Liquid ... [https://www.chromatographyonline.com/view/applying-sustainability-concepts-modern-liquid-chromatography]
- 92. Basic Principles of LC, HPLC, MS, & MS [https://chemyx.com/resources/knowledge-base/general-syringe-pump-info/basic-principles-hplc-ms-lc-ms/?srsltid=AfmBOorgEHlgkoy8534QLDK5ZxTvAVLzlIEvQjiyDS32o1Ow8HOcbODc]
- 93. Principles and Applications of Liquid Chromatography ... [https://pmc.ncbi.nlm.nih.gov/articles/PMC2643089/]
- 94. Comparison of Matrix Effects in HPLC-MS/MS and UPLC ... [https://www.sciencedirect.com/science/article/pii/S1044030508000585]