Intermediate Precision Testing Between Analysts: A Complete Guide for Robust Analytical Methods
This article provides a comprehensive guide to intermediate precision testing with a specific focus on variability between analysts, a critical component of analytical method validation in pharmaceutical development and quality...
Intermediate Precision Testing Between Analysts: A Complete Guide for Robust Analytical Methods
Abstract
This article provides a comprehensive guide to intermediate precision testing with a specific focus on variability between analysts, a critical component of analytical method validation in pharmaceutical development and quality control. It covers foundational principles, step-by-step methodology, common troubleshooting strategies, and validation requirements aligned with ICH and FDA guidelines. Designed for researchers, scientists, and drug development professionals, this resource aims to equip laboratories with the knowledge to ensure method reliability, facilitate successful technology transfers, and maintain regulatory compliance during clinical trials and commercialization.
Understanding Intermediate Precision: The Foundation of Reliable Analytical Results
Defining Intermediate Precision in Analytical Chemistry
In analytical chemistry, the reliability of data is paramount. Intermediate precision is a critical validation parameter that quantifies the variability in analytical results when the same method is applied within a single laboratory under changing but controlled conditions [1]. This measure sits between repeatability (identical conditions) and reproducibility (different laboratories) in the precision hierarchy [2]. For research focused on testing variability between analysts, understanding and controlling intermediate precision is fundamental to ensuring that methodological performance remains consistent despite normal operational variations.
Core Concepts and Definitions
What is Intermediate Precision?
Intermediate precision, occasionally termed "within-lab reproducibility," expresses the precision obtained within a single laboratory over an extended period (typically several months) [2]. It measures an analytical method's robustness by incorporating variations that realistically occur during routine operation, including different analysts, equipment, reagent batches, and environmental conditions [1] [3]. Unlike repeatability, which represents the smallest possible variation under identical conditions, intermediate precision accounts for more variables and thus yields a larger standard deviation [2].
The Precision Hierarchy: Repeatability, Intermediate Precision, and Reproducibility
The relationship between different precision measures is best understood hierarchically:
- Repeatability: The closeness of agreement between results under identical conditions (same analyst, instrument, and short time period). It represents the best-case scenario for method variability [2] [4].
- Intermediate Precision: The precision under varying conditions within the same laboratory. It includes the effects of different days, analysts, equipment, and calibration events [1] [4].
- Reproducibility: The precision between different laboratories, capturing the maximum expected method variability [2] [4].
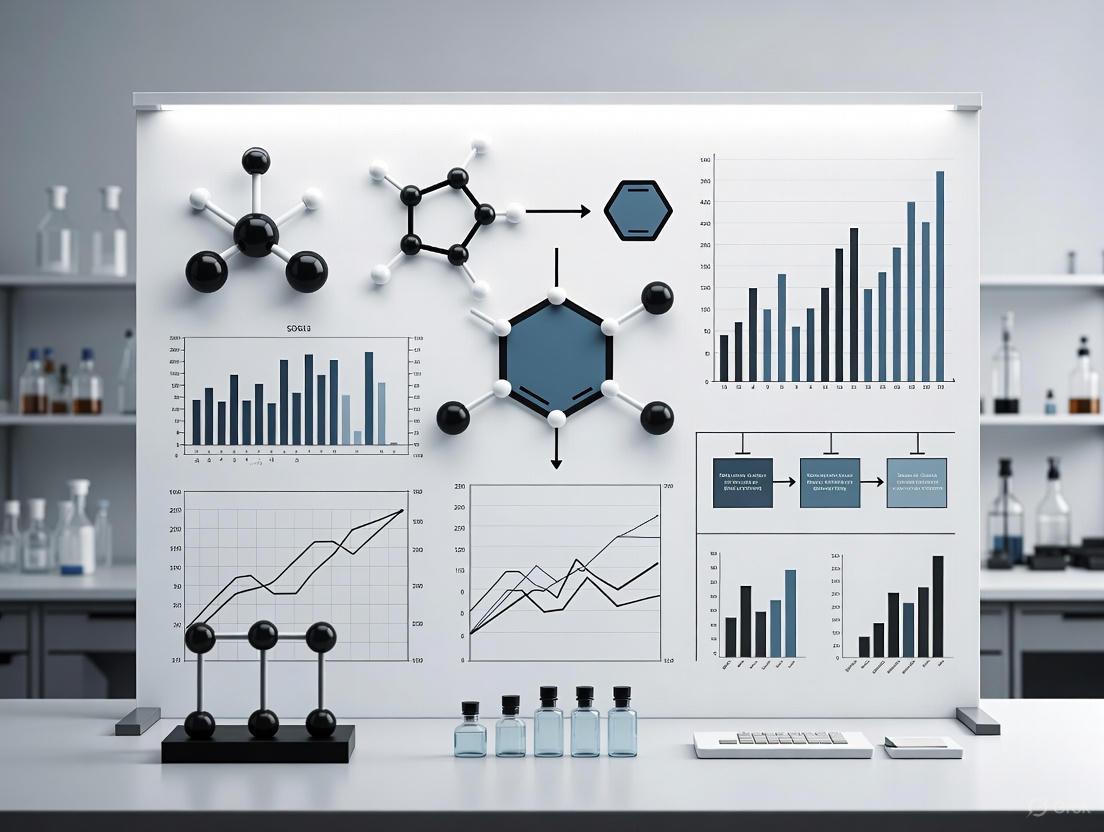
The following diagram illustrates this hierarchical relationship and the factors affecting each level of precision:
Experimental Protocols for Intermediate Precision Assessment
Standardized Methodology
A well-designed intermediate precision study follows a structured experimental approach. According to ICH Q2(R2) guidelines, a matrix approach is encouraged where multiple variables are evaluated simultaneously rather than in isolation [3]. A typical protocol involves:
Experimental Design: Two or more analysts independently perform replicate analyses (typically n=6) of the same homogeneous sample on different days [1] [5]. Each analyst uses their own standards and solutions, and may use different instruments or HPLC systems [5].
Sample Preparation: Analysts prepare test samples to represent typical analytical scenarios, often at concentrations near critical decision levels [4]. For drug substances, this may involve comparison with reference materials; for drug products, accuracy is evaluated using synthetic mixtures spiked with known quantities [5].
Data Collection: Results are collected systematically, recording all varying conditions (day, analyst, instrument) alongside measurement results [1]. The entire analytical procedure should be replicated from sample preparation to final result recording [4].
Statistical Analysis: Calculate the standard deviation or relative standard deviation (RSD%) across all results obtained under the varying conditions [1] [3].
Experimental Workflow
The following diagram outlines the key steps in conducting an intermediate precision study:
Quantitative Data and Comparison
Factors Influencing Intermediate Precision
Multiple laboratory factors contribute to variability in intermediate precision studies. The table below summarizes these key factors and their potential impact:
Table 1: Factors Affecting Intermediate Precision in Analytical Chemistry
| Factor Category | Specific Variables | Impact on Precision |
|---|---|---|
| Personnel | Different analysts, technique variability, sample preparation skills | Training and experience significantly affect consistency; proper documentation minimizes operator-dependent variations [1]. |
| Instrumentation | Different equipment, calibration status, maintenance records | Proper calibration and maintenance prevent drift and reduce noise; instrument-to-instrument variability contributes significantly [1] [6]. |
| Temporal Effects | Different days, weeks, or months; environmental fluctuations | Laboratory temperature, humidity, and other environmental changes over time introduce variability [2] [4]. |
| Reagents & Materials | Different batches of reagents, columns, consumables | Lot-to-lot variations in quality and performance affect results; using multiple batches during validation improves robustness [2] [3]. |
| Sample-Related | Sample stability, homogeneity, preparation techniques | Sample handling and storage conditions over extended studies impact result consistency [4]. |
Comparative Performance Data
The following table presents example data from simulated intermediate precision studies, demonstrating typical outcomes when analyzing the same sample under varying conditions:
Table 2: Example Intermediate Precision Data from Analyst Comparison Studies
| Analysis Conditions | Analyst 1 Results (Area Count) | Analyst 2 Results (Area Count) | Combined Data Set | Statistical Outcome |
|---|---|---|---|---|
| Same Day, Same Instrument | 98.7, 99.1, 98.9, 99.2, 98.8, 99.0 | 98.8, 99.0, 98.9, 99.1, 98.7, 99.2 | All 12 results | RSD = 0.18% (Excellent precision) |
| Different Days, Same Instrument | 98.5, 98.9, 98.7, 98.6, 99.0, 98.8 | 97.9, 98.3, 98.1, 98.0, 98.4, 98.2 | All 12 results | RSD = 0.41% (Acceptable precision) |
| Different Days, Different Instruments | 98.7, 99.1, 98.5, 98.9, 98.8, 99.0 | 95.2, 95.6, 94.9, 95.3, 95.1, 95.5 | All 12 results | RSD = 1.65% (Elevated due to instrument bias) |
Calculation Methodology
Intermediate precision is quantitatively expressed using the following statistical approach:
- Formula: σIP = √(σ²within + σ²between) [1]
- Standard Deviation (SD): Measures absolute variability around the mean
- Relative Standard Deviation (RSD%): Also called coefficient of variation (CV), calculated as (Standard Deviation / Mean) × 100% [1] [3]
The RSD% is particularly useful for comparing precision across different concentration levels and methods, as it normalizes the standard deviation to the mean value [3].
Essential Research Reagent Solutions
The following table details key materials and reagents required for robust intermediate precision studies:
Table 3: Essential Research Reagents and Materials for Intermediate Precision Studies
| Material/Reagent | Function in Precision Studies | Critical Quality Attributes |
|---|---|---|
| Reference Standards | Provides known concentration for accuracy assessment and calibration | Certified purity, stability, traceability to reference materials [5] |
| Chromatographic Columns | Separation component in HPLC/UPLC methods; different lots test robustness | Reproducible performance between lots, stable retention times, consistent efficiency [2] |
| Reagent Lots | Different batches test method robustness to supplier variations | Consistent quality, purity specifications, minimal lot-to-lot variability [2] [3] |
| Control Materials | Homogeneous, stable materials for repeated analysis over time | Homogeneity, stability throughout study period, matrix similar to test samples [4] |
| Mobile Phase Components | Critical for chromatographic separation; different preparation batches test robustness | Consistent pH, purity, preparation according to standardized procedures [1] |
Best Practices for Optimizing Intermediate Precision
Method Development Considerations
- Incorporate Robustness Testing: During method development, intentionally introduce minor variations in critical parameters (pH, temperature, flow rate) to identify factors most likely to affect precision [5].
- Define Acceptance Criteria Early: Establish predefined RSD% limits based on the method's intended purpose before commencing validation studies [1].
- Use a Matrix Approach: Rather than testing each variable in isolation, use experimental designs that evaluate multiple factors simultaneously for efficiency [3].
Quality Control Measures
- Implement Control Charts: Monitor intermediate precision over time using control charts with limits based on the intermediate precision standard deviation (σbr), not the repeatability standard deviation (σr) [4].
- Regular Proficiency Testing: Periodically analyze samples of known concentration to verify continued method performance [6].
- Document All Variations: Maintain detailed records of all conditions (analysts, instruments, reagent lots) during validation and routine use [1].
Intermediate precision represents a practical, real-world assessment of an analytical method's performance under normal laboratory variations. For research focused on testing variability between analysts, it provides crucial data on method robustness and transferability. Through carefully designed experiments that incorporate multiple analysts, instruments, and timeframes, laboratories can quantify this important performance characteristic and ensure their methods remain reliable despite the inevitable variations that occur in practice. Proper assessment of intermediate precision is not merely a regulatory requirement but a fundamental practice that builds confidence in analytical results and supports robust scientific decision-making in drug development and other critical applications.
Distinguishing Between Repeatability, Intermediate Precision, and Reproducibility
Precision is a fundamental parameter in analytical method validation, measuring the closeness of agreement between a series of measurements obtained from multiple sampling of the same homogeneous sample under specified conditions [7]. It quantifies the random error that can occur in an analytical method and answers the question of how close results are to each other [8]. In regulated environments such as pharmaceutical development, precision demonstrates that an analytical procedure provides reliable and consistent results during normal use, offering documented evidence that the method performs as intended for its application [5].
The validation of precision is particularly critical in pharmaceutical analysis and drug development, where analytical methods must control the consistency and quality of drug substances and products by measuring critical quality attributes [9]. Method precision directly impacts product acceptance and out-of-specification rates, making its proper evaluation essential for quality risk management [9]. The International Conference on Harmonization (ICH) guidelines break precision into three distinct hierarchical levels: repeatability, intermediate precision, and reproducibility [10] [5]. Understanding the differences between these levels, their testing methodologies, and their appropriate application is crucial for researchers, scientists, and drug development professionals responsible for ensuring the reliability of analytical data.
Theoretical Framework and Definitions
The Precision Hierarchy
Precision in analytical chemistry is conceptualized through a hierarchy of three distinct levels, each encompassing different sources of variability. This hierarchical structure progresses from the most controlled conditions to those incorporating multiple sources of variation, providing a comprehensive understanding of a method's performance characteristics [2] [7].
Repeatability represents the most fundamental level of precision, expressing the closeness of results obtained with the same sample using the same measurement procedure, same operators, same measuring system, same operating conditions, and same location over a short period of time, typically one day or one analytical run [2]. These conditions, known as repeatability conditions, are expected to yield the smallest possible variation in results [2]. Repeatability is also termed intra-assay precision and reflects the scatter of results when an analyst performs multiple measurements of a sample directly one after another under nearly identical conditions [8].
Intermediate Precision occupies the middle level in the precision hierarchy, reflecting within-laboratory variations over a longer period (generally at least several months) that include additional changing factors beyond repeatability conditions [2]. Unlike repeatability, intermediate precision accounts for variations such as different analysts, different calibrants, different reagent batches, different columns, different instruments of the same model, and different environmental conditions [2] [8]. These factors behave systematically within a day but act as random variables over extended periods. Consequently, intermediate precision values, expressed as standard deviation, are larger than repeatability standard deviations due to the additional sources of variability being accounted for [2].
Reproducibility represents the broadest level of precision, expressing the precision between measurement results obtained under different laboratory conditions [2]. Also called between-lab reproducibility, this level incorporates variations between different locations, different operators, different measuring systems, and potentially different measurement procedures [7]. Reproducibility conditions may also include environmental variations and instruments from different manufacturers, providing the most realistic assessment of a method's performance across multiple testing sites [8]. Reproducibility is typically assessed through collaborative interlaboratory studies and is essential for method standardization and methods used in more than one laboratory [2].
Conceptual Relationships
The relationship between these precision levels can be visualized as a hierarchical structure where each level incorporates additional sources of variability. The following diagram illustrates this relationship and the key factors affecting each precision level:
Comparative Analysis of Precision Levels
Direct Comparison of Key Characteristics
The table below provides a structured comparison of the three precision levels, highlighting their defining conditions, sources of variability, and typical applications:
Table 1: Comprehensive Comparison of Repeatability, Intermediate Precision, and Reproducibility
| Characteristic | Repeatability | Intermediate Precision | Reproducibility |
|---|---|---|---|
| Definition | Precision under identical conditions over short time interval [2] | Precision within a single laboratory over extended period with varying conditions [2] | Precision between different laboratories [2] |
| Testing Conditions | Same procedure, operator, instrument, location, short period [7] | Same laboratory but different days, analysts, equipment [7] | Different locations, operators, measuring systems [7] |
| Also Known As | Intra-assay precision, intra-serial precision [2] [8] | Within-lab reproducibility, inter-serial precision [2] [8] | Between-lab reproducibility, collaborative study precision [2] [5] |
| Time Frame | Short period (typically one day or one run) [2] | Longer period (several months) [2] | Extended period across multiple laboratories [7] |
| Key Variability Sources | Random variation within same analytical run [8] | Different analysts, days, calibrants, reagent batches, columns, instruments [2] | Different laboratories, operators, equipment, environments, procedures [7] |
| Scope of Application | Single laboratory under optimal conditions [2] | Single laboratory under normal operating variations [2] | Multiple laboratories, method standardization [2] |
| Expected Standard Deviation | Smallest variability [2] | Larger than repeatability [2] | Largest variability [7] |
| Regulatory Context | ICH Q2(R1) minimum: 9 determinations (3 concentrations × 3 replicates) or 6 at 100% [8] | ICH Q2(R1): typically 2 analysts, 2 days, 2 instruments with replicates [10] | ICH Q2A defines as collaborative studies between laboratories [10] |
Experimental Design and Data Analysis
The experimental approaches for evaluating each precision level differ significantly in their design and complexity. The following table summarizes the key methodological aspects for each precision type:
Table 2: Experimental Protocols and Data Analysis Methods for Precision Assessment
| Aspect | Repeatability | Intermediate Precision | Reproducibility |
|---|---|---|---|
| Minimum Experimental Design | 9 determinations over 3 concentration levels or 6 at 100% test concentration [5] [8] | 2 analysts on 2 different days with replicates at minimum 3 concentrations [10] | Collaborative studies among multiple laboratories with standardized protocol [10] |
| Common Statistical Measures | Standard deviation, relative standard deviation (%RSD) [5] | Standard deviation, %RSD, confidence intervals, variance component analysis [10] [5] | Standard deviation, %RSD, confidence intervals [5] |
| Data Presentation | % RSD of replicate measurements [5] | % difference in mean values between analysts, statistical testing (e.g., t-test) [5] | Standard deviation, relative standard deviation, confidence interval [5] |
| Variance Components | Unexplained random error [10] | Analyst-to-analyst, day-to-day, instrument-to-instrument variability [8] | Laboratory-to-laboratory, method-to-method differences [7] |
| Acceptance Criteria Evaluation | Repeatability % Tolerance = (Stdev × 5.15)/(USL-LSL) [9] | Combined variance components relative to specification tolerance [9] | Agreement between laboratories within predefined limits [9] |
Experimental Protocols and Methodologies
Protocol for Repeatability Assessment
Repeatability testing follows a standardized protocol to ensure consistent evaluation across different methods and laboratories. According to ICH Q2(R1) guidelines, repeatability should be determined with a minimum of nine determinations covering the specified range of the procedure (three concentrations with three replicates each) or a minimum of six determinations at 100% of the test concentration [5] [8]. The experimental workflow involves:
Sample Preparation: Prepare a homogeneous sample representative of the typical test material. For assays requiring multiple concentration levels, prepare samples at three different concentrations across the method range (e.g., 80%, 100%, 120% of target concentration) [5].
Analysis Conditions: All analyses must be performed by the same analyst using the same instrument, reagents, and calibration standards within a short time frame, typically one day or one analytical run [2] [7]. Environmental conditions should remain constant throughout the analysis.
Replicate Measurements: For each concentration level, perform a minimum of three independent replicate measurements. If using the six determinations at 100% approach, perform six independent replicate measurements at the target concentration [8].
Data Analysis: Calculate the mean, standard deviation, and relative standard deviation (%RSD) for the results at each concentration level and for the overall dataset. The %RSD is calculated as (standard deviation/mean) × 100 [5].
Acceptance Criteria: For analytical methods, repeatability should consume ≤25% of the specification tolerance, calculated as (Stdev Repeatability × 5.15)/(USL-LSL) for two-sided specifications [9].
Protocol for Intermediate Precision Assessment
Intermediate precision evaluation incorporates variability factors encountered during routine method use within a single laboratory. The experimental design should enable estimation of different variance components [10]:
Experimental Design: Implement a structured design that varies key factors including:
Sample Analysis: Analyze a minimum of three concentration levels (e.g., 80%, 100%, 120%) with multiple replicates per level. The same homogeneous sample should be used across all variations to ensure comparability [10].
Data Collection: Collect results from all combinations of the varied factors. A complete design would include two analysts each performing analysis on two different days using two different instruments with replicate measurements at each concentration level [10].
Statistical Analysis:
- Perform variance component analysis to partition variability into its constituent sources (analyst, day, instrument, and residual error) [10]
- Calculate overall intermediate precision standard deviation
- Compare means between analysts using statistical tests (e.g., Student's t-test) [5]
- Report %RSD and confidence intervals for the combined data [5]
Acceptance Criteria: The overall intermediate precision should demonstrate that the method produces consistent results under normal laboratory variations, with no single factor (e.g., analyst) showing statistically significant bias that impacts method suitability [5].
Protocol for Reproducibility Assessment
Reproducibility studies represent the most comprehensive precision assessment through interlaboratory collaboration:
Study Design: Develop a standardized protocol detailing all aspects of the analytical method, including sample preparation, instrumentation conditions, calibration procedures, and data analysis methods [7]. This protocol should be distributed to all participating laboratories.
Laboratory Selection: Include a sufficient number of laboratories (typically 5-10) representing different geographical locations and equipment platforms [7]. Laboratories should have appropriate expertise but not necessarily prior experience with the specific method.
Sample Distribution: Provide all participating laboratories with identical, homogeneous test samples with known concentrations or properties. Samples should be stable for the duration of the study and properly packaged to ensure integrity during shipping [7].
Data Collection: Each laboratory performs the analysis according to the standardized protocol, typically including multiple replicate measurements at various concentration levels. Results are returned to the coordinating laboratory for statistical analysis [7].
Statistical Analysis:
- Calculate overall mean, standard deviation, and %RSD across all laboratories
- Perform analysis of variance (ANOVA) to separate between-laboratory and within-laboratory variability
- Assess potential outliers using appropriate statistical tests
- Establish reproducibility limits for the method [7]
Acceptance Criteria: Reproducibility is considered acceptable when results from all participating laboratories fall within predetermined agreement limits, demonstrating that the method produces consistent results regardless of testing location [7].
The Scientist's Toolkit: Essential Materials for Precision Studies
Key Research Reagent Solutions
Table 3: Essential Materials and Reagents for Precision Assessment Studies
| Item | Function in Precision Studies | Critical Quality Attributes |
|---|---|---|
| Certified Reference Materials | Provide known concentration analyte for accuracy and precision determination [5] | Certified purity, stability, traceability to reference standards |
| Chromatographic Columns | Separate analytes from matrix components; different columns test method robustness [2] | Lot-to-lot reproducibility, stationary phase consistency, retention characteristics |
| Analytical Grade Solvents and Reagents | Sample preparation, mobile phase composition, extraction [2] | Purity, low UV absorbance, lot-to-lot consistency, expiration dating |
| System Suitability Standards | Verify chromatographic system performance before precision studies [5] | Stability, reproducibility, representative of analyte properties |
| Stable Homogeneous Sample Material | Ensure consistent test material across all precision evaluations [7] | Homogeneity, stability, representative of actual samples |
| Calibrators | Establish quantitative relationship between instrument response and concentration [2] | Accuracy, precision, traceability, stability |
Instrumentation and Software Requirements
Precision studies require appropriate instrumentation and software tools to generate reliable data:
- HPLC/UHPLC Systems: High-performance liquid chromatography systems with consistent performance; multiple instruments of the same model for intermediate precision testing [5]
- Mass Spectrometers: LC-MS systems for specific detection and peak purity assessment, providing unequivocal identification [5]
- Photodiode Array Detectors: UV-Vis detectors for spectral comparison and peak purity evaluation [5]
- Statistical Software Packages: Programs such as Minitab for variance component analysis and calculation of precision metrics [10]
- Electronic Laboratory Notebooks: Documentation systems for recording experimental parameters and raw data [5]
Application in Pharmaceutical Development and Regulation
Role in Analytical Method Validation
Precision assessment forms a critical component of analytical method validation within pharmaceutical development and quality control. The ICH Q2(R1) guideline provides the foundational framework for validation characteristics, including precision [10]. In this context:
- Precision data supports claims of accuracy and linearity, demonstrating that a method produces reliable results consistently [10]
- Method precision directly impacts product quality assessment, as excessive method error increases out-of-specification rates and provides misleading information about product quality [9]
- The relationship between precision and accuracy is crucial; a method must be precise to claim accuracy, but precision alone does not guarantee accurate results [8] [11]
- Precision evaluation should be performed across the specified range of the method to ensure consistent performance at different analyte concentrations [5]
Setting Acceptance Criteria
Establishing scientifically justified acceptance criteria for precision parameters is essential for method validation:
- Repeatability: Recommended acceptance criteria for analytical methods is ≤25% of tolerance, calculated as (Stdev Repeatability × 5.15)/(USL-LSL) for two-sided specifications [9]
- Intermediate Precision: Should demonstrate that combined variability components do not significantly impact the method's ability to consistently measure analyte concentration within specification limits [9]
- Reproducibility: For collaborative studies, results should fall within predetermined agreement limits across participating laboratories [7]
Traditional measures such as %RSD and % recovery should be considered report-only parameters rather than primary acceptance criteria, with evaluation relative to product specification tolerance providing more meaningful assessment of method suitability [9].
Understanding the distinctions between repeatability, intermediate precision, and reproducibility is essential for proper analytical method validation in pharmaceutical research and development. These three hierarchical levels of precision provide complementary information about method performance under different conditions, from optimal controlled environments to real-world variations across multiple laboratories. The experimental protocols and statistical approaches for each level differ significantly, requiring appropriate design and execution to generate meaningful data. As analytical methods play a critical role in assessing drug product quality and ensuring patient safety, comprehensive precision validation demonstrating that methods are suitable for their intended purpose remains fundamental to pharmaceutical development and regulation. Through proper implementation of precision studies and scientifically justified acceptance criteria, researchers and drug development professionals can ensure the generation of reliable, meaningful analytical data throughout the product lifecycle.
Why Analyst Variation is a Critical Component of Intermediate Precision
In the rigorous world of analytical science, the validation of a method assures that it is suitable for its intended purpose. Precision, a cornerstone of method validation, is traditionally examined at three levels: repeatability, intermediate precision, and reproducibility [12]. While repeatability expresses precision under the same operating conditions over a short interval, and reproducibility captures precision between different laboratories, intermediate precision occupies a critical middle ground. It expresses the within-laboratory variations that occur due to changes such as different days, different analysts, and different equipment [13] [10]. Among these factors, the variation introduced by different analysts is not merely one component among many; it is a critical source of random error that directly tests the robustness of an analytical procedure in a real-world laboratory setting.
This guide objectively explores why analyst-to-analyst variation is a pivotal component of intermediate precision. We will compare scenarios where analyst variation is and is not a significant factor, provide detailed experimental protocols for its evaluation, and present data to help laboratories ensure their methods remain reliable in the hands of any qualified scientist.
Understanding Intermediate Precision and Its Components
A Framework for Precision
Intermediate precision evaluates the variability in results generated by various influences within a single laboratory that are expected to occur during future routine analysis [3]. The goal is to quantify the degree of scatter in the results due to underlying random errors under these varying, but normal, conditions [13]. The International Council for Harmonisation (ICH) Q2(R1) guideline defines it as a parameter that expresses these within-laboratory variations, and it may also be known as within-laboratory reproducibility or inter-assay precision [13].
The following diagram illustrates the relationship between different precision components and where analyst variation fits into this structure:
Why Analyst Variation Demands Special Attention
Analyst variation is critical because it introduces a human factor that can systematically influence results through subtle differences in technique. While other factors like instrument variation may be more mechanical, analyst variation encompasses a range of technique-dependent variables that are difficult to fully standardize. For example, in the preparation of urinary extracellular vesicle (uEV) samples, procedural errors were found to primarily affect uEV counting and protein quantification, highlighting how sample handling—a process directly controlled by the analyst—can be a major source of variability [14].
When assessing intermediate precision, the combined variability is typically expressed as the Relative Standard Deviation (RSD), which is usually larger than the RSD observed for repeatability experiments alone due to the incorporation of these additional variable conditions [13]. The influence of the analyst can manifest in several ways, from sample preparation and instrument calibration to data interpretation and calculations.
Comparative Experimental Data: The Impact of Analyst Variation
To truly understand the impact of analyst variation, consider the following comparative data generated from content determination experiments of a drug substance. The following table summarizes results from two different experimental scenarios:
Table 1: Comparison of Analyst Variation Under Different Experimental Conditions
| Experimental Condition | Analyst | Mean Content (mg) | Standard Deviation (SD) | Relative Standard Deviation (RSD) | Overall Intermediate Precision (RSD) |
|---|---|---|---|---|---|
| Same Instrument [13] | Analyst 1 | 1.46 | 0.019 | 1.29% | 1.38% |
| Analyst 2 | 1.48 | 0.008 | 0.55% | ||
| Different Instruments [13] | Analyst 1 | 1.46 | 0.019 | 1.29% | 4.09% |
| Analyst 2 | 1.35 | 0.008 | 0.56% |
Data Interpretation and Analysis
In the first scenario, both analysts used the same instrument. While their mean results were quite similar, the variation in Analyst 1's results was noticeably higher (RSD of 1.29% vs. 0.55%), possibly due to differences in operational technique [13]. However, the overall intermediate precision RSD of 1.38% was still acceptable, indicating that the method was sufficiently robust to accommodate the minor operational differences between these two analysts when using a consistent instrument.
The second scenario reveals a more profound insight. Here, Analyst 2 used a different instrument, and while this analyst maintained a high level of personal precision (RSD of 0.56%), their mean result was significantly lower [13]. This systematic shift resulted in an overall intermediate precision RSD of 4.09%, which would likely be unacceptable for most analytical methods. This demonstrates a critical finding: analyst variation can interact with other variables (like instrument differences) to produce compounded effects that might not be apparent when studying factors in isolation. An analyst's technique might be perfectly adequate on one instrument but introduce significant bias on another.
Methodologies for Evaluating Analyst Variation
Standard Experimental Protocol
A robust approach to quantifying analyst variation follows a structured protocol designed to isolate and measure its contribution to overall method variability.
Table 2: Key Research Reagent Solutions for Intermediate Precision Studies
| Item Category | Specific Examples | Function in Experiment |
|---|---|---|
| Chromatography Systems | HPLC-1, HPLC-2, HPLC-3 [12] | Separation and quantification of analytes; testing instrument-to-instrument variability. |
| Analytical Instruments | Nanoparticle Tracking Analysis (NTA), Dynamic Light Scattering (DLS) [14] | Characterizing biophysicochemical properties of particles like size and concentration. |
| Statistical Software | Minitab [10] | Performing Analysis of Variance (ANOVA) and calculating variance components. |
| Sample Processing Materials | Silicon carbide (SiC) sorbent, Polyethylene glycol (PEG) polymer [14] | Isulating analytes of interest (e.g., extracellular vesicles) from biological samples. |
Step 1: Experimental Design. Two or more analysts independently perform the analysis. Each analyst should conduct a minimum of six measurements each [13]. The experiment should be designed to cover the entire analytical method range, typically testing at three concentration levels (e.g., 50%, 100%, and 150%) [12]. To properly assess intermediate precision, these tests should be conducted over an extended period, such as on different days [13].
Step 2: Data Collection. Each analyst generates a set of results, such as Area Under the Curve (AUC) in chromatography or particle concentration in bioanalytical methods. It is crucial that all analysts follow the same standard operating procedure (SOP) for the method.
Step 3: Statistical Analysis. The data is analyzed using Analysis of Variance (ANOVA) [12] [10]. ANOVA is a robust statistical tool that allows for the simultaneous determination of intermediate precision and repeatability. It goes beyond a simple RSD calculation by helping to partition the total variability into its respective components, such as the variance due to the analyst versus the inherent repeatability variance [12] [10].
The workflow for this evaluation process is systematic and can be visualized as follows:
The Power of ANOVA in Detecting Analyst Effects
Relying solely on the overall Percent RSD to evaluate intermediate precision has limitations, as it may obscure systematic differences. ANOVA offers a more powerful alternative [12]. For instance, in a study comparing AUC results from three different HPLCs, the overall RSD was a seemingly acceptable 1.99%. However, a one-way ANOVA revealed a statistically significant difference among the mean AUCs. A post-hoc test (like Tukey's test) pinpointed that one specific HPLC instrument was consistently yielding higher values than the other two [12]. This level of diagnostic insight—identifying not just that variability exists, but where it comes from—is crucial for troubleshooting and improving a method, and it cannot be derived from a simple RSD value.
The evidence clearly demonstrates that analyst variation is not just a checkbox in a validation protocol; it is a critical component of intermediate precision that directly probes a method's robustness for real-world use. The interaction between an analyst's technique and other variables like instrumentation can create compounded effects that significantly impact results. To ensure reliable method performance, it is imperative to:
- Use a Matrixed Experimental Approach: Instead of studying analyst variation in isolation, use an experimental design that incorporates multiple analysts, days, and instruments simultaneously, as encouraged by ICH guidelines [13] [3].
- Employ ANOVA for Analysis: Move beyond simple RSD calculations and use ANOVA to statistically decompose variability and identify significant sources of error, such as systematic differences between analysts or instruments [12] [10].
- Focus on the Interaction of Factors: Recognize that the analyst's influence is often most pronounced when interacting with other factors. A method that seems robust when one factor is changed at a time may fail when multiple variables change, as is normal in a working lab.
By rigorously evaluating and understanding the role of the analyst, laboratories can develop more robust analytical methods, ensure the generation of reliable data, and maintain the highest standards of quality in drug development and scientific research.
In the realm of pharmaceutical development and quality control, demonstrating that an analytical method is reliable and fit for purpose is paramount. Method validation provides documented evidence that the analytical procedure consistently produces results that meet the pre-defined specifications for its intended use. Among the various validation parameters, precision holds critical importance as it quantifies the random variation in measurements. Precision itself is not a single characteristic but is stratified into three distinct tiers: repeatability, intermediate precision, and reproducibility [2] [7].
Intermediate precision occupies a unique and crucial position in this hierarchy. It serves as a bridge between the ideal, controlled conditions of repeatability and the broad, inter-laboratory scope of reproducibility. Specifically, intermediate precision measures the variation in results observed when the same analytical method is applied to the same homogeneous sample within the same laboratory, but under changing conditions such as different days, different analysts, or different equipment [1] [2]. This article delves into the role of intermediate precision as a cornerstone of robust method validation and its direct implications for ongoing quality control, providing a structured comparison of regulatory guidelines and detailed experimental protocols.
Theoretical Foundation: The Precision Hierarchy
To fully appreciate the role of intermediate precision, one must understand its relationship to the other measures of precision. The hierarchy defines the conditions under which variability is assessed, with each level incorporating more potential sources of variation.
The relationship between the different precision measures is hierarchical, with each level introducing more sources of variability, as visualized above. Repeatability represents the best-case scenario for a method's performance, demonstrating precision under identical conditions where the same operator uses the same instrument and reagents over a short period, typically one day [2] [7]. It provides the smallest possible estimate of a method's random variation.
Intermediate precision expands upon this by assessing the impact of factors that can change within a single laboratory over a longer period. These factors include different analysts, different instruments from the same type, different batches of reagents, and different days [5] [1]. The value of intermediate precision, expressed as a standard deviation, is therefore typically larger than that of repeatability, as it accounts for more random effects [2]. It reflects the realistic variability a laboratory can expect during routine operation.
At the top of the hierarchy, reproducibility quantifies the precision between measurement results obtained in different laboratories, often using different equipment and reagents [2] [7]. This provides the most comprehensive estimate of a method's variability and is crucial for methods intended for use across multiple sites, such as in collaborative studies or for standardizing methods [5].
Regulatory Framework and Guidelines
The validation of analytical procedures, including the assessment of precision, is governed by international and regional guidelines. While these guidelines are largely harmonized, understanding their nuances is essential for global compliance.
Table 1: Comparison of Regulatory Guidelines on Precision Terminology and Emphasis
| Guideline | Primary Precision Terminology | Key Emphasis and Notes |
|---|---|---|
| ICH Q2(R1) [15] | Intermediate Precision | The internationally recognized gold standard. Employs a science- and risk-based approach. |
| USP <1225> [15] | Ruggedness | "Ruggedness" is often used synonymously with intermediate precision. Places strong emphasis on System Suitability Testing (SST). |
| European Pharmacopoeia [15] | Intermediate Precision | Fully adopts ICH Q2(R1) principles. Provides supplementary guidance on specific techniques like chromatography. |
| Japanese Pharmacopoeia [15] | Intermediate Precision | Largely harmonized with ICH but may be more prescriptive, with a strong focus on robustness. |
The International Council for Harmonisation (ICH) Q2(R1) guideline is the cornerstone for analytical method validation and is the most widely referenced framework globally [5] [15]. It defines the key parameters and provides a structured approach to validation. As illustrated in Table 1, other major regulatory bodies, including the United States Pharmacopeia (USP), the European Pharmacopoeia (Ph. Eur.), and the Japanese Pharmacopoeia (JP), align their requirements closely with ICH Q2(R1), ensuring a high degree of international harmonization [15].
A notable difference in terminology exists in the USP, which historically used the term "ruggedness" to describe the same concept that ICH defines as "intermediate precision" [5] [15]. Ruggedness was defined as the degree of reproducibility of results under a variety of normal expected conditions, such as different analysts and laboratories [5]. While the term is still found in USP contexts, the ICH terminology of "intermediate precision" is becoming universally adopted, and the concept is addressed directly in the ICH Q2(R1) guideline [5].
Designing an Intermediate Precision Study
A well-designed intermediate precision study is critical for generating meaningful data that accurately reflects the method's routine performance. The design should be science- and risk-based, focusing on the factors most likely to impact the method's results [16].
Key Factors and Experimental Design
The first step is to identify the variables that pose the highest risk to method performance. Common factors included in an intermediate precision study are:
- Analyst: Different analysts performing the analysis to capture variability in technique and sample preparation [5] [1].
- Day: Conducting analyses on different days to account for variations in environmental conditions (e.g., temperature, humidity) and reagent stability [1] [2].
- Instrument: Using different calibrated instruments of the same type to capture instrument-to-instrument variability [1] [17].
A robust approach to evaluating these factors is through an experimental design matrix, such as a full or partial factorial design [17]. This involves systematically rotating the factors of interest. A simple yet effective design for a single product batch is illustrated in the table below. This design efficiently generates data that can be analyzed using Analysis of Variance (ANOVA) to determine the contribution of each factor to the total variability.
Table 2: Example Experimental Execution Matrix for Intermediate Precision [17]
| Run Number | Analyst | Day | Instrument | Sample Result (%) |
|---|---|---|---|---|
| 1 | Analyst A | Day 1 | Instrument 1 | 98.7 |
| 2 | Analyst A | Day 1 | Instrument 2 | 99.1 |
| 3 | Analyst A | Day 2 | Instrument 1 | 98.5 |
| 4 | Analyst A | Day 2 | Instrument 2 | 98.9 |
| 5 | Analyst B | Day 1 | Instrument 1 | 99.2 |
| 6 | Analyst B | Day 1 | Instrument 2 | 98.8 |
| 7 | Analyst B | Day 2 | Instrument 1 | 98.4 |
| 8 | Analyst B | Day 2 | Instrument 2 | 99.0 |
Statistical Analysis and Calculation
The data collected from the experimental matrix is used to calculate the overall intermediate precision. The results are typically expressed as a Relative Standard Deviation (RSD%) or Coefficient of Variation (CV%) [5] [1].
A more advanced statistical method for analyzing the data is a mixed-linear model analysis [17]. This model treats the factors (e.g., Analyst, Day, Instrument) as random effects and quantifies the variance contributed by each component. The formula for the model can be represented as: Output Variable = Mean + Instrument + Operator + Day + Residual [17]
The overall intermediate precision is then calculated by combining the variances from these components. The standard deviation for intermediate precision (σIP) is derived using the formula: σIP = √(σ²within + σ²between) [1]
The final result is reported as %RSD = (σ_IP / Overall Mean) x 100 [1]. This overall CV% represents the expected analytical variability of the method during routine use.
Table 3: Example Mixed Linear Model Results for an ELISA Test Method [17]
| Variance Component | Standard Deviation (SD) | Coefficient of Variation (CV%) |
|---|---|---|
| Instrument | 10.5 | 11.6% |
| Operator | 0.0 | 0.0% |
| Day | 0.0 | 0.0% |
| Residual | 10.5 | 11.6% |
| Overall Intermediate Precision | 13.2 | 14.6% |
The Scientist's Toolkit: Essential Reagents and Materials
The reliability of an intermediate precision study is contingent on the quality and consistency of the materials used. The following table details key reagent solutions and materials essential for conducting these studies, particularly for chromatographic or biopharmaceutical methods.
Table 4: Key Research Reagent Solutions and Materials for Validation
| Item | Function in Intermediate Precision Study |
|---|---|
| Certified Reference Material (CRM) | Provides an accepted reference value to establish trueness and evaluate the method's accuracy and precision over time [18]. |
| Placebo Mixture | Used in specificity testing to verify that the excipients do not interfere with the quantification of the analyte, ensuring the method's accuracy [18]. |
| System Suitability Test (SST) Solutions | A mixture of critical analytes used to verify that the chromatographic system (or other instrumentation) is performing adequately at the time of the test [15]. |
| Stable Control Material | A homogeneous and stable sample, often derived from a real product batch or synthesized, which is analyzed repeatedly across the different conditions to generate the precision data [17]. |
| Different Batches of Reagents/Solvents | Intentionally using different lots of critical reagents to incorporate this potential source of variability into the intermediate precision estimate [2]. |
Interpreting Results and Impact on Quality Control
The outcome of an intermediate precision study has direct and practical implications for both the validity of the method and its future application in quality control.
Setting Acceptance Criteria
Acceptance criteria for intermediate precision must be scientifically justified and related to the method's intended use. The overall %RSD is judged against pre-defined limits. While these limits are method-specific, they are often derived from the product's specifications and the required analytical capability [17]. For example, a method with wider specifications may tolerate a higher %RSD, whereas a method for a potency assay with narrow specifications would require a much lower %RSD.
Industry often uses general benchmarks for guidance. An intermediate precision result with a %RSD of ≤ 2.0% is typically considered excellent, while values between 2.1% and 5.0% are generally acceptable for many assay methods. Results ranging from 5.1% to 10.0% may be marginal, and anything >10.0% is often unacceptable for a quantitative method, unless justified for trace analysis [1].
Application in Routine Quality Control and Lifecycle Management
Intermediate precision is often considered the most important performance characteristic because it represents the laboratory reliability expected on any given day during routine use [17]. It provides a realistic estimate of the analytical variability that will contribute to the overall observed variability of the product.
This understanding is critical for quality control. The observed variability in product testing results is a combination of the true process variability from manufacturing and the analytical variability from the test method [17]. The relationship is expressed as: [Observed Process Variability]² = [Actual Process Variability]² + [Test Method Variability]² [17]
By knowing the test method variability (from the intermediate precision study), a company can more accurately estimate the true process variability. This knowledge is essential for setting meaningful control limits and for investigating out-of-specification (OOS) results, as it helps determine if a shift in data is likely due to a change in the manufacturing process or is within the expected noise of the analytical method.
Intermediate precision is not merely a regulatory checkbox but a fundamental component of a robust analytical procedure. It provides a realistic estimate of a method's performance under the normal variations encountered within a laboratory. A well-executed intermediate precision study, based on a risk-designed experiment and sound statistical analysis, provides confidence in the reliability of day-to-day results. Furthermore, by quantifying the analytical method's contribution to overall variability, it becomes an indispensable tool for setting realistic specifications, monitoring production process capability, and ensuring that patient safety and product efficacy are maintained through scientifically sound quality control.
Executing Robust Intermediate Precision Studies: A Step-by-Step Protocol
In the rigorous world of pharmaceutical development and analytical science, the reliability of data is not just a goal but a fundamental requirement. The design of a statistically sound experiment, particularly for validation parameters like intermediate precision, serves as the bedrock for generating trustworthy and meaningful results. Intermediate precision measures the consistency of analytical results when the same method is applied within the same laboratory but under different conditions, such as different analysts, different instruments, or on different days [19]. It is a core component of method validation, ensuring that data is reliable not just under ideal, static conditions, but under the normal, variable conditions of a working laboratory.
This guide provides a structured framework for designing experiments to assess intermediate precision, with a specific focus on quantifying variability between different analysts. By objectively comparing experimental outcomes, we can dissect the sources of variability and build a compelling case for the robustness of an analytical method.
Core Concepts: Precision in Method Validation
To design a sound experiment, one must first precisely understand what is being measured. In analytical method validation, precision is investigated at multiple levels, with intermediate precision being a crucial bridge between repeatability and reproducibility [5].
The following table clarifies the hierarchy of precision measurements, a framework supported by international guidelines such as ICH Q2(R1) [5].
Table 1: Levels of Precision in Analytical Method Validation
| Precision Level | Definition | Testing Conditions | Goal |
|---|---|---|---|
| Repeatability | Closeness of results from repeated analyses under identical conditions over a short time [2]. | Same analyst, same instrument, same day. | Assess the smallest possible variation (inherent method noise) [2]. |
| Intermediate Precision | Variability within a single laboratory over a longer period, accounting for changes in random factors [2]. | Different analysts, different instruments, different days [19]. | Evaluate method stability under typical lab variations (e.g., between analysts) [19]. |
| Reproducibility | Precision between measurement results obtained in different laboratories [2]. | Different labs, equipment, analysts [19]. | Assess method transferability for global use (e.g., collaborative trials) [19]. |
It is critical to distinguish precision from accuracy, as they describe different aspects of reliability. Accuracy refers to the closeness of a measurement to the true or accepted value, while precision refers to the closeness of agreement between repeated measurements [20]. A method can be precise (consistent) without being accurate (correct), and vice-versa. In the context of intermediate precision, we are solely focused on consistency—the random error of the method—and not its systematic error (bias) [21].
Experimental Design for Intermediate Precision
Defining Factors and Levels
A well-designed experiment for intermediate precision deliberately introduces and controls specific variables, known as factors, to quantify their individual and combined effects on the results. The core factors involved in an intermediate precision study, especially one focusing on analyst variability, are outlined below.
Diagram 1: Experimental factors and levels for an intermediate precision study. The study systematically varies key factors like analyst, day, and instrument to measure their effect on the analytical result.
Protocol for an Intermediate Precision Study
The following workflow provides a detailed, step-by-step protocol for executing an intermediate precision study. This methodology is aligned with regulatory guidance and industry best practices [5] [22].
Diagram 2: A standardized workflow for conducting an intermediate precision study, from planning to conclusion.
Step 1: Define Scope and Acceptance Criteria Before beginning, clearly define the study's goal (e.g., to quantify analyst-to-analyst variability) and set pre-defined acceptance criteria. For quantitative assays, a relative standard deviation (%RSD) of less than 15% is often used as a benchmark for precision [22].
Step 2: Prepare Test Samples Prepare a single, large, homogenous pool of the test sample at one or more concentration levels (e.g., 80%, 100%, 120% of target). Aliquoting from this pool ensures that any observed variability stems from the analytical process itself, not from the sample [5].
Step 3: Execute Experimental Runs The experimental runs should reflect the factors and levels defined in Diagram 1.
- Two Analysts: Each analyst should be a qualified operator but working independently.
- Six Replicates: Each analyst prepares and analyzes six independent samples from the homogenous pool.
- Different Days: The analyses should be conducted over at least three different days (e.g., two runs per analyst per day) to incorporate day-to-day variability [5].
Step 4: Collect and Analyze Data For each analysis, record the primary measured response (e.g., potency, peak area, concentration).
- Descriptive Statistics: Calculate the mean, standard deviation (SD), and %RSD for the results from each analyst separately, and for the combined dataset.
- Analysis of Variance (ANOVA): Use a one-way ANOVA to statistically determine if the difference between the analysts' means is significant, or if the variability is random.
Step 5: Draw Conclusion Compare the overall %RSD from the combined data to the pre-defined acceptance criterion. If the %RSD is within the limit, the method is considered to have acceptable intermediate precision. The ANOVA results help pinpoint if a specific factor (like the analyst) is a major source of bias.
Case Study: Instrument Performance Comparison
To illustrate the practical application of this experimental design, we can examine data from a technical note on a CE-SDS assay for protein analysis. The study evaluated the intermediate precision of a BioPhase 8800 system using Native Fluorescence Detection (NFD), a relevant comparison for laboratories considering this technology.
Table 2: Quantitative Comparison of Intermediate Precision in a CE-SDS Assay
| Performance Metric | Intra-Capillary Precision (Repeatability) | Inter-Capillary Precision (Intermediate Precision) |
|---|---|---|
| Relative Migration Time (%RSD) | < 0.1% | < 0.1% |
| Corrected Peak Area (Heavy Chain) (%RSD) | < 0.4% | < 0.3% |
| Key Experimental Parameters | Details | |
| System | BioPhase 8800 with Native Fluorescence Detection (NFD) | [23] |
| Sample | Reduced IgG Control Standard | [23] |
| Runs | 6 injections per sample well | [23] |
| Implication | The extremely low %RSD values for both intra and inter-capillary testing demonstrate high sensitivity and exceptional robustness, minimizing variability from the instrument itself. |
This data shows that the system itself contributes minimal variability, which is a critical foundation. When the instrument's inherent precision is this high, a subsequent study focusing on analyst variability can be designed with greater confidence, as significant results are more likely to be attributable to the human factor rather than the equipment.
The Scientist's Toolkit: Essential Research Reagents and Materials
The integrity of an intermediate precision study depends on the quality and consistency of the materials used. The following table lists key reagents and their critical functions in ensuring reliable results.
Table 3: Essential Research Reagent Solutions for Robust Assays
| Reagent / Material | Function in the Experiment |
|---|---|
| Reference Standard (RS) | A well-characterized substance used to calibrate the assay and serve as a benchmark for comparing test samples; its purity and stability are paramount [22]. |
| Master Cell Bank | A single batch of cells used as a source for all experiments, ensuring biological consistency in cell-based assays across the entire validation lifecycle [22]. |
| BioPhase CE-SDS Protein Analysis Kit | A kit-based workflow providing pre-defined reagents and protocols to facilitate consistency and overall data reproducibility in protein characterization studies [23]. |
| Internal Standard | A compound added at a known concentration to samples to correct for variations in sample preparation or instrument response, improving accuracy and precision [23]. |
| SDS Sample Buffer | Creates a uniform environment for protein denaturation and imparts a negative charge, allowing separation based on molecular weight rather than charge [23]. |
Designing a statistically sound experiment for intermediate precision is a systematic process that requires careful planning of factors, levels, and replicates. By deliberately introducing controlled variations—such as having two analysts perform multiple independent runs over different days—scientists can accurately quantify the robustness of an analytical method. This approach, supported by clear protocols and the use of high-quality, consistent reagents, generates defensible data that meets regulatory standards. Mastering this discipline is not merely about compliance; it is about building a foundation of unwavering confidence in the data that drives critical decisions in drug development and beyond.
In the pharmaceutical and biopharmaceutical industries, demonstrating control over analytical methods is a fundamental regulatory requirement. Intermediate precision testing specifically investigates the reliability of an analytical method when used by multiple analysts, on different instruments, and across various days within the same laboratory [2] [19]. It measures the method's consistency under the normal, expected variations of a routine laboratory environment [1]. The organization of data collected from multiple analysts during these studies is not merely an administrative task; it is the foundation for robust, defensible, and scientifically sound method validation. Proper data structuring directly impacts the ability to accurately calculate precision, identify sources of variability, and provide evidence of a method's suitability for its intended use, thereby supporting drug development and quality control [5] [24].
This guide objectively compares the data organization practices underpinning successful intermediate precision studies against common but less rigorous approaches. The supporting "experimental data" presented are the resulting outcomes and metrics, such as Relative Standard Deviation (RSD%), which are direct consequences of the data collection and organization strategy employed.
Core Concepts: Precision in Analytical Method Validation
Understanding the hierarchy of precision is essential for designing appropriate data collection studies. The key terms are often confused but represent distinct levels of variability [19] [1].
- Repeatability expresses the precision under the same operating conditions over a short period of time. It represents the smallest possible variation in results, typically obtained by the same analyst using the same equipment and reagents in a single day [2] [5].
- Intermediate Precision measures the variability within a single laboratory over a longer period (e.g., several months) and accounts for changes such as different analysts, equipment, reagent batches, and columns [2]. Factors that are constant within a day but vary over time are captured here, making it a more realistic assessment of a method's routine performance [2] [1].
- Reproducibility refers to the precision between different laboratories, often assessed during collaborative studies when a method is transferred to a new site or for standardization purposes [2] [19].
The following workflow outlines the strategic process for planning and executing a study to assess intermediate precision between multiple analysts.
Comparative Analysis: Data Organization Strategies
The structure and management of raw data collected during an intermediate precision study are pivotal. The following table compares a suboptimal, ad-hoc approach against a best-practice, structured strategy.
Table 1: Comparison of Data Organization Strategies for Multi-Analyst Studies
| Aspect | Common (Ad-hoc) Approach | Best Practice (Structured) Approach | Impact on Intermediate Precision Assessment |
|---|---|---|---|
| Data Recording | Data scattered across paper notebooks or individual electronic files (e.g., Excel) with inconsistent formats [24]. | Use of a centralized, standardized template (e.g., predefined spreadsheet or LIMS) with locked data fields for all analysts [24]. | Best Practice ensures consistency, eliminates transcription errors, and allows for seamless data aggregation and analysis. |
| Sample & Meta-data Tracking | Incomplete or inconsistent logging of critical meta-data (e.g., reagent lot numbers, instrument IDs, specific column details) [1]. | Systematic recording of all meta-data alongside analytical results in a structured format (e.g., a single table). | Best Practice enables root cause analysis if variability is high. Without meta-data, investigating the source of precision failure is difficult [5]. |
| Result Aggregation | Manual compilation of results from various sources, increasing the risk of omissions and errors. | Automated or streamlined aggregation from a single source of truth, preserving data integrity. | Best Practice reduces administrative error, saving time and ensuring the dataset for statistical calculation is complete and accurate. |
| Statistical Calculation | Calculations performed on a subset of data or without properly grouping data by the variables being tested (analyst, day, instrument). | Calculation of precision metrics (e.g., RSD%) using analysis of variance (ANOVA) that accounts for within-group and between-group variances [24] [1]. | Best Practice provides a true measure of intermediate precision by correctly partitioning variability from different sources, leading to a more accurate and reliable %RSD [5]. |
Supporting Experimental Data and Outcomes
The choice of data organization strategy directly influences the reliability of the final precision metrics. A well-executed study following a structured design will yield data that can be confidently used for statistical evaluation.
Table 2: Example Experimental Design and Resulting Data for an Intermediate Precision Study
| Day | Analyst | Instrument ID | Sample Result 1 (%) | Sample Result 2 (%) | Sample Result 3 (%) | Mean (%) | Standard Deviation (SD) |
|---|---|---|---|---|---|---|---|
| 1 | Anna | HPLC-01 | 98.7 | 99.1 | 98.9 | 98.9 | 0.20 |
| 1 | Ben | HPLC-02 | 99.1 | 98.5 | 98.7 | 98.8 | 0.31 |
| 2 | Anna | HPLC-02 | 98.5 | 98.9 | 98.6 | 98.7 | 0.21 |
| 2 | Ben | HPLC-01 | 98.9 | 99.2 | 98.8 | 99.0 | 0.21 |
Calculation of Intermediate Precision (as RSD%):
- Overall Mean: 98.85%
- Overall Standard Deviation: 0.23%
- Intermediate Precision (RSD%): (0.23 / 98.85) * 100 = 0.23%
This calculated RSD% of 0.23% would then be compared against pre-defined acceptance criteria to determine the method's performance. Well-organized data, as shown in this table, is a prerequisite for this calculation.
Essential Protocols for Intermediate Precision Testing
A robust intermediate precision study requires a meticulously planned experimental protocol. The following section outlines a detailed methodology based on regulatory guidance and industry best practices [5] [24] [25].
Detailed Experimental Methodology
The goal of this protocol is to quantify the method's variability when operational conditions change within the same laboratory.
- Protocol Development: Before initiation, a detailed validation protocol must be written and approved. This document defines the objective, experimental design, acceptance criteria (e.g., RSD% for intermediate precision should not exceed 2.0%), and statistical methods for evaluation [5] [25].
- Experimental Design:
- Analysts: A minimum of two different analysts should perform the analysis.
- Instruments: Use at least two different HPLC or LC-MS systems of the same model and configuration.
- Timeframe: The study should be conducted over a minimum of two different days [24] [1].
- Sample Preparation: Each analyst should independently prepare their own standards and sample solutions from the same homogeneous batch of drug substance or product. This is critical for capturing variability in sample preparation technique [5].
- Replicates: For each combination of analyst, instrument, and day, a minimum of three replicate injections or sample preparations of the same sample should be performed.
- Execution: The study is carried out according to the designed matrix. All critical meta-data, as outlined in Table 2, must be recorded contemporaneously.
- Statistical Analysis:
- Data is collated into a structured format.
- Intermediate Precision Calculation: The preferred statistical method is Analysis of Variance (ANOVA). ANOVA partitions the total variability in the data into components attributable to the different factors (e.g., between analysts, between days, random error) [24]. The intermediate precision standard deviation (σIP) can be calculated by combining the relevant variance components: σIP = √(σ²within + σ²between) [1].
- The result is typically expressed as a percentage relative standard deviation (%RSD) of the combined data, which provides a clear, relative measure of the total within-laboratory variability [5] [1].
The logical relationships and decision points within the data analysis phase are critical for correct interpretation.
The Scientist's Toolkit: Key Reagents and Materials
The reliability of an intermediate precision study is contingent on the quality and consistency of the materials used. The following table details essential research reagent solutions and their critical functions.
Table 3: Essential Research Reagent Solutions for Analytical Method Validation
| Item | Function & Importance in Intermediate Precision |
|---|---|
| Reference Standard | A highly characterized substance of known purity and identity used to prepare calibration standards. Its quality is paramount for achieving accurate and precise results across all analysts [5]. |
| Chromatographic Column | The specific column (e.g., C18, 150mm x 4.6mm, 5μm) is a critical method parameter. Using columns from different manufacturing lots during the study helps assess the method's robustness to this variable [2] [5]. |
| HPLC-Grade Solvents & Reagents | High-purity mobile phase components (e.g., acetonitrile, methanol, water, buffers) are essential to minimize baseline noise and unpredictable analyte response, which can contribute to variability [5]. |
| System Suitability Test (SST) Solutions | A standardized mixture containing the analyte and known impurities used to verify that the chromatographic system is performing adequately at the start of each sequence. Consistent SST results across analysts and days are a prerequisite for a valid precision study [5] [25]. |
The organization of data collected from multiple analysts is a critical determinant in the successful assessment of a method's intermediate precision. As demonstrated, a structured approach—characterized by centralized data recording, comprehensive meta-data tracking, and rigorous statistical analysis using ANOVA—provides a reliable and defensible measure of a method's real-world performance within a laboratory. In contrast, ad-hoc data collection methods introduce unnecessary risk and uncertainty. For researchers and drug development professionals, adopting these best practices in data organization is not merely a procedural recommendation but a fundamental component of ensuring data integrity, regulatory compliance, and the ultimate reliability of analytical methods used to guarantee drug quality and patient safety.
In the pharmaceutical industry, demonstrating that an analytical method produces reliable and consistent results is a cornerstone of quality control. This is particularly critical when the same method is used across different analysts, instruments, or days. The concept of intermediate precision specifically evaluates the variability in results generated by these different influences within a single laboratory that are expected to occur during future routine analysis [13]. It is also known as within-laboratory reproducibility or inter-assay precision [13] [3]. To objectively assess and compare a method's performance, two primary statistical approaches are employed: Variance Components Analysis and the Relative Standard Deviation (RSD%). This guide provides an objective comparison of these two calculation methods, framing the discussion within the context of a broader thesis on intermediate precision testing between analysts.
Methodologies: Experimental Protocols for Intermediate Precision
To generate data for an intermediate precision study, a structured experiment must be designed to capture the various sources of variability present in a laboratory setting.
Core Experimental Protocol
The following protocol is aligned with the matrix approach encouraged by the ICH Q2(R1) guideline, where multiple influencing factors can be varied simultaneously rather than studied one-by-one [13].
- Sample Selection: Prepare a homogeneous and stable test sample (e.g., a drug substance or product with a known concentration) to be analyzed throughout the study.
- Experimental Matrix: Define the factors to be varied. A comprehensive study should include:
- Analyst: At least two different analysts.
- Time: Analysis performed on at least two different days.
- Equipment: Use of at least two different analytical instruments or high-performance liquid chromatography (HPLC) systems.
- Other Factors: Optionally, different batches of reagents or columns can be included.
- Replication: Each analyst should perform a series of replicate measurements (e.g., n=6) for the sample on each day and with each instrument [13].
- Data Collection: All results (e.g., content in mg) are recorded in a structured table, grouping the data by the varying factors.
Workflow Visualization
The following diagram illustrates the logical workflow for designing, executing, and analyzing an intermediate precision study.
Calculation Methods and Data Comparison
The data collected from the experimental protocol is processed using two distinct statistical approaches to quantify precision.
Relative Standard Deviation (RSD%)
The Relative Standard Deviation, also called the coefficient of variation, is a standardized measure of dispersion. It is calculated as the ratio of the standard deviation to the mean, expressed as a percentage [26].
- Formula: RSD% = (Standard Deviation / Mean) × 100% [26]
- Application: For an intermediate precision study, the standard deviation and mean are calculated using all data points collected across all varying conditions (e.g., 12 measurements from two analysts) [13]. The resulting single RSD% value provides an overall measure of variability relative to the mean of the results.
Variance Components Analysis (VCA)
Variance Components Analysis is a statistical model that deconstructs the total observed variability in the data into independent contributions from specific sources of variation (e.g., analyst, day, instrument, and random error).
- Method: Typically performed using specialized statistical software, ANOVA (Analysis of Variance) techniques are used to estimate the variance attributed to each factor included in the experimental design.
- Output: The analysis provides numerical estimates for the variance components (e.g., σ²analyst, σ²day, σ²_error). The square root of the sum of these components gives the total standard deviation, which can be used to calculate an overall RSD%.
Quantitative Data Comparison
The table below summarizes a hypothetical dataset and compares the outcomes of the two calculation methods. Scenario B demonstrates how a systematic difference (e.g., from a different instrument) impacts the results.
Table 1: Intermediate Precision Study Data and Metric Comparison
| Scenario & Data Source | Measurement Values (mg) | Mean (mg) | Standard Deviation (SD, mg) | RSD% | Key Variance Components (Estimated) |
|---|---|---|---|---|---|
| Analyst 1 | 1.44, 1.46, 1.45, 1.49, 1.45, 1.44 | 1.46 | 0.019 | 1.29 | |
| Analyst 2 (Same Inst.) | 1.49, 1.48, 1.49, 1.47, 1.48, 1.49 | 1.48 | 0.008 | 0.55 | |
| Scenario A: Combined Data | All 12 values from above | 1.47 | 0.020 | 1.38 | σ²analyst: 0.0001σ²error: 0.0003 |
| Analyst 2 (Diff. Inst.) | 1.35, 1.34, 1.35, 1.36, 1.34, 1.35 | 1.35 | 0.008 | 0.56 | |
| Scenario B: Combined Data | All 12 values from above | 1.40 | 0.057 | 4.09 | σ²analyst: 0.0001σ²instrument: 0.0028σ²_error: 0.0003 |
Data structure and values for Scenarios A and B are adapted from published examples [13]. Variance components are illustrative estimates.
Comparative Analysis: RSD% vs. Variance Components
The choice between RSD% and VCA depends on the objective of the precision study.
Table 2: Objective Comparison of RSD% and Variance Components Analysis
| Feature | Relative Standard Deviation (RSD%) | Variance Components Analysis (VCA) |
|---|---|---|
| Primary Function | Provides a single, overall measure of relative variability [26]. | Decomposes total variability into specific sources of variation. |
| Output | A single percentage value. | Multiple variance estimates (e.g., for analyst, day, residual error). |
| Ease of Calculation | Simple to compute manually or with basic software [26]. | Requires specialized statistical software and knowledge. |
| Key Advantage | Simple, universally understood, excellent for high-level comparison [26]. | Identifies the root causes of variability, enabling targeted improvement. |
| Key Limitation | Does not identify which factors are contributing to the variability. | More complex to design, execute, and interpret. |
| Best Application | Setting overall acceptance criteria; comparing precision across different methods or processes [26]. | Troubleshooting variable methods; optimizing procedures to reduce major sources of error. |
The Scientist's Toolkit: Essential Research Reagents and Materials
The following table details key materials and solutions required for conducting a robust intermediate precision study, specifically for a content determination assay.
Table 3: Essential Research Reagent Solutions for Intermediate Precision Studies
| Item | Function & Importance in Intermediate Precision Testing |
|---|---|
| Drug Substance/Product Reference Standard | A well-characterized, high-purity material that serves as the test sample. Its homogeneity and stability are critical for attributing variability to the method and not the sample. |
| HPLC-Grade Solvents | High-purity solvents (e.g., water, acetonitrile, methanol) used for mobile phase and sample preparation. Different lots may be varied to test this influence. |
| Buffer Salts | For preparing pH-controlled mobile phases (e.g., phosphate, acetate buffers). Different analysts' preparations can introduce variability. |
| Analytical Columns | Different lots of the same type of HPLC column may be varied to assess their contribution to overall precision. |
| Calibrated Instruments | Multiple analytical instruments (e.g., HPLC systems, balances, pH meters) of the same model are used to quantify instrument-to-instrument variability. |
Establishing Scientifically Justified Acceptance Criteria for Analyst Variability
In the pharmaceutical industry, the reliability of analytical data is paramount. Analyst variability is a key component of intermediate precision, which expresses the precision within a single laboratory over an extended period, accounting for changes in analysts, equipment, calibrants, and other operational conditions [2]. Unlike repeatability, which measures the closeness of results under the same conditions over a short period, intermediate precision captures the realistic variation encountered during routine method use, making it a more comprehensive measure of method robustness [2]. Establishing scientifically justified acceptance criteria for this variability is not merely a regulatory formality; it is a critical exercise in quality risk management that directly impacts product quality decisions, out-of-specification (OOS) rates, and the overall reliability of data used in drug development and release [9].
The foundation for setting these criteria lies in understanding how method performance characteristics—specifically bias and precision—influence the quantitation of drug substances and products. As shown in Equation 1, the reported product mean is a function of the true sample mean plus the inherent method bias [9]. Furthermore, every individual reportable result incorporates both method bias and method repeatability (Equation 2) [9]. Therefore, controlling and justifying the allowable contribution of method error, including that originating from different analysts, is essential for building robust product knowledge and ensuring consistent product quality throughout its lifecycle.
Key Validation Parameters and Criteria Setting
Core Performance Parameters
When assessing the variability introduced by different analysts, the primary performance parameters under evaluation are accuracy (bias) and precision. The relationship between these parameters and the product's specification limits forms the basis for scientifically sound acceptance criteria [9].
Accuracy/Bias: This refers to the difference between the measured value and a known reference or true value. In the context of analyst variability, it assesses whether different analysts produce results that are consistently centered around the true value. The recommended acceptance criterion for bias in analytical methods is ≤ 10% of the product specification tolerance (the difference between the Upper and Lower Specification Limits) [9]. This is calculated as:
- Bias % of Tolerance = (Bias / Tolerance) * 100 [9]
Precision (Repeatability & Intermediate Precision): Precision measures the closeness of agreement between a series of measurements obtained from multiple sampling of the same homogeneous sample under the prescribed conditions [2].
- Repeatability expresses the variation under the same conditions (same analyst, same equipment, short period of time) and represents the smallest possible variation [2].
- Intermediate Precision includes more variables, such as different analysts, different days, and different equipment, and thus will have a larger standard deviation than repeatability [2]. The recommended acceptance criterion for repeatability is ≤ 25% of the product specification tolerance [9]. This is calculated as:
- Repeatability % Tolerance = (Standard Deviation Repeatability * 5.15) / (USL - LSL) for two-sided specification limits [9].
Table 1: Summary of Recommended Acceptance Criteria for Analytical Methods
| Performance Characteristic | Recommended Acceptance Criterion | Basis of Calculation |
|---|---|---|
| Accuracy/Bias | ≤ 10% of Tolerance | Bias / (USL - LSL) * 100 |
| Precision (Repeatability) | ≤ 25% of Tolerance | (StdDev * 5.15) / (USL - LSL) |
| Precision (Intermediate Precision) | To be established case-by-case, but greater than repeatability. | Incorporates analyst, day, and instrument variability [2]. |
The Risk-Based Approach to Setting Criteria
Setting acceptance criteria should be a risk-based decision made on a case-by-case basis, justified by supporting data from method validation or pre-transfer studies [27]. The decision must consider the intended use of the method, the homogeneity of the test sample, the precision of the method, and the anticipated bias between different analysts or laboratories [27]. The overarching principle is that the analytical method should not consume an excessive portion of the product specification tolerance, thereby ensuring that the OOS rate is controlled and that the data generated is truly reflective of product quality [9].
Traditional measures like % Coefficient of Variation (%CV) can be misleading. A method might appear to perform poorly at low concentrations based on %CV when it is actually fit-for-purpose, or appear acceptable at high concentrations when it is actually unsuitable relative to the specification limits it must control [9]. Evaluating method error relative to the specification tolerance provides a more direct understanding of the method's impact on product quality decisions.
Experimental Design and Methodology
A robust experimental design is crucial for accurately quantifying analyst variability and demonstrating that the method is suitably controlled.
Protocol for Assessing Analyst Variability
The following protocol provides a detailed methodology for an intermediate precision study focusing on analyst variability.
- Objective: To quantify the variability in assay results attributable to different analysts and to verify that the total error (bias + precision) lies within pre-defined, justified acceptance criteria.
- Sample Preparation:
- Prepare a single, homogeneous batch of a drug product or a standard solution of the drug substance with a known target concentration (e.g., 100% of label claim).
- The sample must be both random and representative to ensure that any failure to meet acceptance criteria is due to method performance and not sample variability [27].
- Experimental Procedure:
- Number of Analysts: Select a minimum of two (recommended three) qualified analysts.
- Replication: Each analyst should prepare and analyze the sample in triplicate on three separate days (a total of 9 analyses per analyst).
- Independence: Analysts should work independently, using different analytical equipment (e.g., HPLC systems, balances) where possible, and different batches of reagents and columns to fully capture the components of intermediate precision [2].
- Analysis: Follow the validated analytical procedure (e.g., HPLC, dissolution) exactly as written.
- Data Analysis:
- Calculate the mean and standard deviation for each analyst's data set.
- Perform a nested (hierarchical) analysis of variance (ANOVA) to decompose the total variability into its components: within-analyst (repeatability) and between-analyst variability [27].
- Calculate the overall mean and the intermediate precision (total within-lab variability).
- Assess bias by comparing the overall mean to the known reference value.
- Compare the calculated bias and precision against the pre-defined acceptance criteria (e.g., % of specification tolerance).
The following workflow diagram illustrates the key stages of this experimental protocol:
Data Presentation and Statistical Analysis
Proper data presentation and statistical analysis are critical for interpreting the results of an analyst variability study and making scientifically defensible conclusions.
Representative Data Table
The following table presents a model data set from a hypothetical analyst variability study for an assay method with specification limits of 90.0% to 110.0% (a tolerance of 20.0%).
Table 2: Example Data from an Analyst Variability Study for a Drug Assay
| Analyst | Day | Replicate 1 (%) | Replicate 2 (%) | Replicate 3 (%) | Mean (%) | Standard Deviation (%) |
|---|---|---|---|---|---|---|
| A | 1 | 99.5 | 101.2 | 100.8 | 100.5 | 0.87 |
| A | 2 | 100.1 | 99.8 | 101.0 | 100.3 | 0.62 |
| A | 3 | 98.9 | 100.5 | 99.7 | 99.7 | 0.81 |
| B | 1 | 102.1 | 101.5 | 103.0 | 102.2 | 0.76 |
| B | 2 | 101.8 | 102.5 | 101.2 | 101.8 | 0.65 |
| B | 3 | 100.9 | 102.0 | 101.5 | 101.5 | 0.55 |
| C | 1 | 98.5 | 99.0 | 98.2 | 98.6 | 0.40 |
| C | 2 | 99.1 | 98.4 | 99.6 | 99.0 | 0.60 |
| C | 3 | 98.0 | 99.3 | 98.7 | 98.7 | 0.65 |
Statistical Analysis and Interpretation
From the data in Table 2, a nested ANOVA can be performed. The following table summarizes the key outcomes and their comparison to the recommended acceptance criteria.
Table 3: Statistical Summary and Comparison to Acceptance Criteria
| Statistical Parameter | Calculated Value | Acceptance Criterion | Status |
|---|---|---|---|
| Overall Mean (Grand Mean) | 100.4% | N/A | N/A |
| Reference/Target Value | 100.0% | N/A | N/A |
| Bias (Absolute) | 0.4% | ≤ 10% of Tolerance (≤ 2.0%) | Pass |
| Repeatability (Std Dev) | 0.71% | ≤ 25% of Tolerance (≤ 5.0%) | Pass |
| Intermediate Precision (Std Dev) | 1.35% | Established based on risk | To be assessed |
| Between-Analyst Variability | Significant (p < 0.05) | To be minimized and justified | Needs Review |
Interpretation: While the method demonstrates acceptable bias and repeatability against the specification tolerance, the statistical analysis reveals significant variability between analysts. Analyst B consistently reports higher results (~101.8%) compared to Analyst C (~98.8%). This indicates that the analytical procedure may be sensitive to an operator-influenced step. The investigation should focus on identifying the root cause, such as differences in sample preparation technique, injection volume, or data interpretation, followed by procedural clarification and re-training before the method is considered robust.
The Scientist's Toolkit: Essential Research Reagents and Materials
The following table details key materials and solutions essential for conducting a robust analyst variability study.
Table 4: Essential Research Reagent Solutions and Materials
| Item | Function / Purpose |
|---|---|
| Certified Reference Standard | Provides a known concentration and purity against which accuracy (bias) is measured. It is the cornerstone for quantifying method trueness [9]. |
| Qualified Drug Substance/Product | A homogeneous and well-characterized sample that is both random and representative, used to test the method performance under real-world conditions [27]. |
| HPLC/UPLC Grade Solvents | High-purity solvents are used for mobile phase and sample preparation to minimize baseline noise and interference, ensuring method precision and accuracy. |
| Specialized Chromatographic Columns | Different batches or columns of the same type are used to assess the robustness of the separation and its contribution to intermediate precision [2]. |
| System Suitability Test (SST) Solutions | A mixture of analytes and/or impurities used to verify that the chromatographic system is performing adequately at the start of the analytical run. |
Establishing scientifically justified acceptance criteria for analyst variability is a fundamental component of analytical method validation and technology transfer. By moving beyond traditional %CV and anchoring criteria to product specification tolerance, organizations can directly link method performance to product quality risk [9]. A well-designed study that quantifies intermediate precision through a nested ANOVA provides a clear picture of the method's robustness in the hands of multiple analysts [2]. When variability exceeds acceptable limits, a structured investigation must be triggered to identify the assignable cause—be it training, procedure, or equipment—ensuring continuous improvement and ultimate reliability of the analytical data used to make critical decisions in drug development [27]. This systematic approach ensures that analytical methods are not only validated but are truly fit-for-purpose throughout their lifecycle.
In the pharmaceutical and drug development industries, the reliability of analytical data is paramount. Demonstrating that an analytical method produces consistent, reliable results is a fundamental requirement for regulatory compliance. This process, central to intermediate precision testing, assesses the variability in results introduced by changes in operational conditions such as different analysts, instruments, or days within a single laboratory [2]. Creating an audit-ready record for such testing requires a meticulously documented comparison of the method's performance under these varying conditions, providing objective evidence that the method is under control and fit for its intended purpose. This guide provides a structured approach to generating that essential documentation, objectively comparing performance data and embedding it within a robust, defensible record-keeping framework.
Core Concepts: Precision and Method Comparability
Levels of Precision
Understanding the hierarchy of precision is crucial for designing appropriate experiments and correctly interpreting data. The key levels are:
- Repeatability: Represents the smallest possible variation in results, obtained under repeatability conditions—the same measurement procedure, same operators, same measuring system, same operating conditions, and same location over a short period of time (e.g., one day or one analytical run) [2].
- Intermediate Precision: The precision obtained within a single laboratory over a longer period (e.g., several months), accounting for additional random variations such as different analysts, equipment, calibrants, and reagent batches [2]. Because it encompasses more sources of variability, its standard deviation is larger than that of repeatability.
- Reproducibility: Expresses the precision between measurement results obtained in different laboratories. While critical for method standardization, it is not always required for single-lab validation [2].
Assessing Method Comparability
A comparison of methods experiment is the primary tool for estimating systematic error, or bias, between a new method and a comparative method [28]. The core question is whether the two methods can be used interchangeably without affecting patient results or clinical decisions [29]. The outcome of this assessment determines if a method's performance, including its intermediate precision, is acceptable for its intended use.
Experimental Design for Robust Comparison
A well-designed experiment is the foundation of an audit-ready record. Careful planning minimizes ambiguity and ensures the data collected is sufficient to support scientific conclusions.
Key Design Considerations
The table below summarizes the critical parameters for a method comparison study, synthesized from established guidelines [28] [29].
Table 1: Key Experimental Design Parameters for Method Comparison
| Parameter | Recommendation | Rationale |
|---|---|---|
| Sample Number | Minimum of 40, preferably 100 patient specimens [28] [29]. | A larger sample size helps identify unexpected errors from interferences or sample matrix effects [29]. |
| Sample Selection | Cover the entire clinically meaningful measurement range. Quality of specimens (wide concentration range) is more important than a large number of randomly selected specimens [28] [29]. | Ensures the comparison is relevant across all potential result values and is not limited to a specific concentration. |
| Replication | Perform duplicate measurements for both the test and comparative method, ideally in different runs or different sample order [28] [29]. | Minimizes the impact of random variation and helps identify sample mix-ups or transposition errors. |
| Time Period | A minimum of 5 days, but preferably extended over a longer period (e.g., 20 days) with 2-5 specimens per day [28]. | Incorporates day-to-day variability, which is a key component of intermediate precision, and provides a more realistic performance assessment. |
| Sample Stability | Analyze test and comparative methods within two hours of each other, unless stability data indicates otherwise [28]. | Prevents observed differences from being attributed to specimen degradation rather than analytical error. |
Workflow for an Audit-Ready Comparison Study
The following diagram visualizes the end-to-end process for executing a method comparison study with audit-ready documentation.
Data Analysis and Statistical Evaluation
A robust data analysis strategy moves beyond simple correlation to provide actionable estimates of error.
Graphical Analysis: The First Essential Step
Visual inspection of data is critical for identifying patterns, biases, and potential outliers [28] [29].
- Scatter Plots: Plot the results from the new method (y-axis) against the comparative method (x-axis). This helps visualize the analytical range, linearity, and the general relationship between methods [28].
- Difference Plots (Bland-Altman): Plot the difference between the two methods (y-axis) against the average of the two methods (x-axis). This allows for a direct visual assessment of bias across the concentration range and helps spot any concentration-dependent trends [29].
Statistical Methods for Quantifying Error
Statistical calculations provide numerical estimates of systematic error. It is important to avoid common pitfalls, such as relying solely on correlation coefficients (r) or t-tests, as they are inadequate for assessing comparability [29].
- Linear Regression: For data covering a wide analytical range, linear regression is preferred. It provides a slope (proportional error), y-intercept (constant error), and the standard deviation of points around the line (sy/x). The systematic error (SE) at a critical medical decision concentration (Xc) is calculated as:
Yc = a + bXcSE = Yc - Xc[28]
- Average Difference (Bias): For a narrow analytical range, calculating the average difference (bias) between the two methods is often most appropriate. This is typically derived from a paired t-test analysis [28].
Table 2: Comparison of Statistical Methods for Method Comparison
| Method | Best Use Case | What It Provides | Common Pitfalls to Avoid |
|---|---|---|---|
| Linear Regression | Wide analytical range of data. | Estimates of constant error (intercept) and proportional error (slope). Allows calculation of SE at any decision level. | Correlation coefficient (r) only measures linear association, not agreement. A high r does not mean methods are comparable [29]. |
| Average Difference (Bias) | Narrow analytical range (e.g., electrolytes like sodium). | A single estimate of the average systematic error between the two methods. | A paired t-test may not detect a clinically significant difference if the sample size is too small, or may flag a statistically significant but clinically irrelevant difference if the sample size is very large [29]. |
| Difference Plots (Bland-Altman) | Any range; used alongside statistical methods. | Visual representation of agreement, bias, and trends. Helps identify outliers and non-uniform dispersion. | Should not be used as a standalone statistical test; it is a graphical aid for interpretation. |
The Audit-Ready Record: Documentation and Reporting
The final report must tell a complete, coherent story of the experiment, from objective to conclusion, allowing an auditor to easily understand what was done, why, and what the results mean.
Essential Elements of the Report
A comprehensive, audit-ready record should include:
- Clear Statement of Purpose and Acceptance Criteria: Define the objective (e.g., "to evaluate the intermediate precision of Method X and its bias against Reference Method Y") and pre-defined, justified performance specifications [29] [30].
- Detailed Experimental Protocol: Document all parameters from Table 1, including sample description, number of replicates, analysts involved, instruments used, and the time frame [30].
- Complete Raw Data: All original data must be present, traceable, and organized. This allows for independent verification of the results and statistical analysis [30].
- Data Analysis and Statistics: Include all graphs (scatter, difference plots) and statistical outputs (regression parameters, bias, standard deviations) with clear interpretations [28] [29].
- Evidence of Addressed Findings: If this is a recurring study, document how previous audit findings or method deficiencies have been assessed and remediated [30].
The Scientist's Toolkit: Key Reagents and Materials
Table 3: Essential Research Reagent Solutions for Method Comparison Studies
| Item | Function in Experiment | Considerations for Audit-Readiness |
|---|---|---|
| Patient Specimens | The primary material for evaluating method performance across a biologically relevant range. | Document source, selection criteria, and stability data. Coverage of the clinical range is critical [29]. |
| Reference Standard | Provides the "true" value for calibration and trueness assessment. | Certificate of Analysis (CoA) with established traceability must be retained. |
| Quality Control (QC) Materials | Monitors the stability and performance of the analytical system throughout the study. | Document levels, expected ranges, and all results obtained during the study period to demonstrate system control. |
| Reagents & Solvents | Essential components for the analytical reaction (e.g., LC-MS mobile phases, enzymes). | Record vendor, lot numbers, and preparation dates. Different lots should be intentionally introduced to test intermediate precision [2]. |
| Data Repository | A centralized system for storing all experimental data, protocols, and results. | Must be organized and secure, allowing for easy retrieval of requested documentation during an audit [30]. |
Pathway to a Successful Audit Outcome
Adherence to the following structured process ensures that the documentation itself becomes a tool for facilitating a smooth audit.
Creating an audit-ready record for intermediate precision and method comparison is an active, strategic process that begins at the experimental design stage. It requires a clear understanding of precision concepts, a rigorous experimental design that challenges the method with real-world variables, and the application of appropriate statistical tools to quantify performance. By systematically compiling this information into a comprehensive report that tells a complete story, researchers and drug development professionals can confidently demonstrate the reliability of their analytical methods. This not only ensures regulatory compliance but also underpins the integrity of the scientific data driving critical decisions in drug development.
Troubleshooting Failed Intermediate Precision: Case Studies and Solutions
In the pharmaceutical industry, the reliability of analytical data is paramount for ensuring drug efficacy, safety, and quality. Intermediate precision, a core validation parameter, measures the reproducibility of analytical results under varied conditions within the same laboratory, including different analysts, days, or instruments [5]. It is a subset of precision that specifically investigates the method's robustness to these expected variations [31] [32]. Excessive variability between analysts is a critical failure mode that can compromise method transfer, regulatory submissions, and the validity of stability and release data. Such variability often stems from inconsistent sample preparation, calibration practices, and environmental control, leading to significant operational and compliance risks [33].
This guide objectively compares the performance of different analytical methodologies and operational controls in managing analyst-induced variability. By synthesizing experimental data from validation studies and emerging assessment tools like the Red Analytical Performance Index (RAPI), we provide a framework for identifying, quantifying, and mitigating these common sources of error within the context of a broader thesis on intermediate precision testing [34] [35].
Core Principles and Regulatory Framework
Key Validation Parameters and Definitions
The International Council for Harmonisation (ICH) guidelines, specifically ICH Q2(R2), define the analytical performance characteristics required for method validation [31] [32]. Understanding these terms is essential for deconstructing variability:
- Accuracy: The closeness of agreement between a test result and the accepted reference value [31] [5].
- Precision: The closeness of agreement among a series of measurements from multiple sampling of the same homogeneous sample. Precision is considered at three levels [5]:
- Repeatability (intra-assay precision): Precision under the same operating conditions over a short interval.
- Intermediate Precision: Precision within-laboratory variations (e.g., different days, analysts, equipment).
- Reproducibility: Precision between different laboratories.
- Specificity: The ability to assess unequivocally the analyte in the presence of other components [31] [5].
- Robustness: A measure of the method's capacity to remain unaffected by small, deliberate variations in method parameters [31] [5].
The Evolving Regulatory Landscape: ICH Q2(R2) and Q14
The recent integration of ICH Q14 (Analytical Procedure Development) and the updated ICH Q2(R2) marks a significant shift from a one-time validation event to a holistic analytical procedure lifecycle approach [32]. This modernized framework emphasizes:
- Science- and Risk-Based Approaches: Encouraging a deeper understanding of the method and its potential variables [32].
- Analytical Target Profile (ATP): A prospective summary of the method's required performance characteristics, which guides development and validation [32].
- Enhanced Lifecycle Management: Facilitating post-approval changes with a more flexible, knowledge-driven control strategy [32].
This lifecycle model is crucial for proactively identifying and controlling sources of analyst variability during method development rather than merely detecting them during validation [36].
Quantitative Comparison of Method Performance and Variability
Case Study: HPLC-UV vs. LC-MS/MS for NSAID Determination
A comparative study of two methods for determining non-steroidal anti-inflammatory drugs (NSAIDs) in water illustrates how technique selection impacts variability and overall performance. The following table summarizes key validation data, highlighting parameters critical to assessing analyst variability [34].
Table 1: Comparative Analytical Performance Data for NSAID Determination in Water
| Validation Parameter | HPLC-UV Method | LC-MS/MS Method |
|---|---|---|
| Repeatability (%RSD) | 4.5% | 2.1% |
| Intermediate Precision (%RSD) | 7.8% | 3.5% |
| Trueness (Relative Bias, %) | -5.2% | -1.8% |
| LOQ (ng/L) | 500 | 50 |
| Linearity (R²) | 0.996 | 0.999 |
| Analyst-to-Analyst %-Difference | 8.5% | 3.2% |
Data Interpretation: The LC-MS/MS method demonstrates superior performance across all parameters, particularly those related to variability. The lower intermediate precision (%RSD) and significantly reduced analyst-to-analyst %-difference indicate it is less susceptible to minor technique differences between operators. This is often due to the higher specificity of MS detection, which reduces interference from sample matrices, a common source of inconsistent manual integration in HPLC-UV [34] [5].
Assessing Performance with the Red Analytical Performance Index (RAPI)
The Red Analytical Performance Index (RAPI) is a novel, open-source tool that consolidates ten key validation parameters into a single, quantitative score between 0 and 100, with a higher score indicating better analytical performance [34] [35]. It provides a standardized visual and numerical framework for method comparison.
Applying RAPI to the case study methods yields the following scores for critical precision parameters [34] [35]:
Table 2: RAPI Scoring for Critical Precision Parameters (Hypothetical Data)
| RAPI Parameter | HPLC-UV Method (Score /10) | LC-MS/MS Method (Score /10) |
|---|---|---|
| Repeatability | 5.0 | 8.5 |
| Intermediate Precision | 2.5 | 7.5 |
| Reproducibility | 2.5 | 7.5 |
| Trueness | 5.0 | 9.0 |
| Final RAPI Score (0-100) | 52 | 82 |
Data Interpretation: The RAPI score quantitatively confirms the superior and more robust performance of the LC-MS/MS method. The low scores for the HPLC-UV method in intermediate precision and reproducibility directly reflect the excessive variability between analysts observed in the raw data. The radial pictogram generated by RAPI software would visually highlight these areas as primary weaknesses, guiding investigators toward the more reliable method [35].
Experimental Protocols for Investigating Analyst Variability
Standard Protocol for Intermediate Precision Testing
A standard protocol for evaluating intermediate precision, in accordance with ICH Q2(R2), involves a structured experimental design [5]:
- Sample Preparation: A single, large batch of homogeneous, representative sample (e.g., drug product spiked with known impurities) is prepared.
- Analyst Selection: Two (or more) qualified analysts participate independently.
- Experimental Execution:
- Each analyst prepares sample solutions in replicate (a minimum of n=6 each at 100% test concentration).
- Analysts use different HPLC systems, if available.
- Analyses are performed on different days.
- Each analyst uses their own standards and reagents.
- Data Analysis:
- Calculate the %RSD for the results from each analyst (repeatability).
- Calculate the overall %RSD combining all results from all analysts (intermediate precision).
- Perform a statistical comparison (e.g., Student's t-test) of the mean values obtained by the two analysts to determine if a significant difference exists.
Novel Protocol: Estimating Variability from Routine Data
A recent methodology proposes estimating method variability, including analyst effects, directly from results generated during routine analysis, supporting continuous verification as per USP <1220> and ICH Q14 [36].
Workflow for Routine Data Analysis
Methodology Details [36]:
- Data Collection: Utilize historical or ongoing routine testing data, focusing on the primary analyte response (e.g., peak area ratio to an internal standard).
- Statistical Modeling: Apply analysis of variance (ANOVA) or statistical process control (SPC) charts to the data, grouping results by the responsible analyst.
- Output: The model quantifies the component of total method variability attributable to differences between analysts, providing a real-world estimate of its impact without dedicated, resource-intensive studies.
The Scientist's Toolkit: Essential Reagents and Materials
The following materials are critical for conducting robust intermediate precision studies and ensuring reproducible results across analysts.
Table 3: Essential Research Reagent Solutions for Precision Studies
| Item | Function & Importance in Variability Control |
|---|---|
| Certified Reference Standards | High-purity, well-characterized analyte standards are fundamental for accurate system calibration and for preparing known samples for precision studies. Their quality directly impacts trueness and inter-analyst bias [31]. |
| Class A Volumetric Glassware | High-accuracy flasks and pipettes are essential for consistent sample and standard preparation. Variability in glassware tolerances between analysts is a hidden source of error [33]. |
| Stable, Homogeneous Test Samples | A single, homogeneous batch of sample (e.g., drug substance or product) is mandatory for precision testing. Inhomogeneity can introduce uncontrollable variability that masks analyst-related effects [5]. |
| System Suitability Test (SST) Solutions | Specific test mixtures verify that the chromatographic system is performing adequately before analysis. Consistent SST failure can point to analyst-specific preparation issues or system drift [5]. |
| Certified Calibration Weights (e.g., Class E2/F1) | Regular calibration of analytical balances with traceable weights is non-negotiable. Drift in balance performance is a major, often overlooked, source of systematic error in sample preparation [37] [33]. |
Discussion and Path Forward
The data clearly demonstrates that method selection is a primary factor in controlling analyst variability. Advanced techniques like LC-MS/MS, with their inherent specificity, offer a more robust solution for challenging analyses. Furthermore, modern assessment tools like RAPI provide a powerful, standardized means of quantifying and visualizing this variability, making it easier to select the best-performing method during development and validation [34] [35].
Moving forward, laboratories should adopt the lifecycle approach championed by ICH Q14 and Q2(R2). This involves:
- Defining a clear Analytical Target Profile (ATP) that includes acceptable limits for intermediate precision.
- Using a risk-based approach to identify steps in the procedure most susceptible to analyst influence (e.g., manual extraction, mobile phase preparation).
- Implementing continuous verification strategies, such as the novel routine data analysis protocol, to monitor analyst-related variability throughout the method's lifetime [32] [36].
By combining robust method design, objective performance assessment with tools like RAPI, and proactive lifecycle management, laboratories can significantly reduce excessive variability between analysts, thereby enhancing data integrity, streamlining method transfer, and strengthening regulatory submissions.
Root Cause Analysis (RCA) is a systematic process for identifying the fundamental reasons behind problems or events [38]. In scientific laboratories and drug development, RCA moves beyond superficial symptoms to uncover underlying issues that, when resolved, prevent problem recurrence [38]. Within the context of intermediate precision testing between analysts, RCA provides a structured framework for investigating variability in analytical results. Intermediate precision (also called within-laboratory precision) measures precision under a defined set of conditions including same measurement procedure and same measuring system, but over an extended period of time and potentially including changes such as different analysts, calibrations, or reagent lots [2] [39]. When inconsistencies arise between analysts performing the same test method, RCA techniques help pinpoint the exact sources of variation, whether they stem from methodological interpretations, sample preparation techniques, training deficiencies, or environmental factors.
The core principles of effective Root Cause Analysis include focusing on systemic issues rather than individual blame, using evidence and data to support conclusions, and aiming for the deepest level cause that remains actionable [38]. For researchers and scientists, this methodology aligns perfectly with the scientific method, emphasizing data-driven investigation and systematic problem-solving. Applying RCA to analytical method validation ensures that issues identified during intermediate precision studies are not just temporarily patched but are permanently resolved through understanding and addressing their foundational causes, thereby enhancing data reliability and reproducibility in pharmaceutical research and development.
Comparative Analysis of Root Cause Analysis Techniques
Core RCA Methods and Their Applications
Multiple Root Cause Analysis techniques exist, each with unique strengths, limitations, and ideal application scenarios. Understanding these methods allows research teams to select the most appropriate approach for investigating intermediate precision issues. The most accessible and straightforward approaches include the "five whys" exercise, fishbone diagram, and circle map, all commonly used in various settings [40]. For more complex, high-risk investigations, advanced methods like Fault Tree Analysis provide greater analytical rigor.
The following table compares five powerful root cause analysis methods, examining their unique strengths, limitations, and ideal applications in scientific research:
Table 1: Comparison of Root Cause Analysis Techniques for Laboratory Investigation
| Method | Key Principle | Best For Scientific Applications | Key Limitations |
|---|---|---|---|
| 5 Whys Technique [41] [42] | Iterative questioning to drill down from problem to root cause | Simple, straightforward issues with likely linear causality; quick investigations of apparent anomalies | May oversimplify complex problems; depends heavily on facilitator knowledge; misses parallel causal paths |
| Fishbone Diagram (Ishikawa) [41] [42] | Visual mapping of potential causes across categories (e.g., Methods, Machines, People, Materials) | Complex problems with multiple potential causes; team brainstorming; categorizing sources of analytical variability | Doesn't inherently prioritize causes; may require additional analysis to distinguish significant causes |
| Fault Tree Analysis (FTA) [42] [43] | Top-down, deductive analysis using Boolean logic to map failure pathways | High-risk, complex systems; understanding multiple failure interactions; safety-critical processes | Requires significant expertise and time; complex trees difficult to develop and interpret |
| Change Analysis [42] | Compares current problematic situation with previous successful operations | Intermittent or sudden-onset problems; identifying impact of process changes, reagent lots, or personnel | Requires detailed change records; less effective for chronic, long-standing issues |
| Barrier Analysis [42] | Examines controls designed to prevent problems and identifies how they failed | Safety-critical processes; quality control failures; protocol adherence issues | May not identify underlying systemic causes beyond barrier failures |
Selection Criteria for Intermediate Precision Investigations
When investigating intermediate precision issues between analysts, the choice of RCA method depends on the complexity and nature of the observed variability. For straightforward issues where a direct causal chain is suspected, the 5 Whys technique provides a quick and uncomplicated approach [42]. For instance, if one analyst consistently obtains higher results in HPLC analysis, asking sequential "why" questions may reveal a simple calibration error or timing discrepancy.
For more complex variability issues with multiple potential contributors, the Fishbone Diagram offers a comprehensive framework [41] [42]. When intermediate precision studies reveal unexplained variability between analysts, brainstorming across categories such as Methods (variations in technique), Materials (reagent quality), People (training differences), Measurement (instrument calibration), and Environment (temperature/humidity fluctuations) can identify all potential sources of variation. This method is particularly valuable during method validation when establishing robustness and reliability of analytical procedures.
Change Analysis is particularly useful when a previously validated method begins showing unexpected variability between analysts [42]. By comparing the current problematic situation with earlier successful operations, laboratories can identify what has changed—whether in reagent suppliers, equipment, personnel, or environmental conditions—that might explain the precision issues.
RCA Training and Implementation Framework
Structured RCA Training Approach
Effective Root Cause Analysis requires proper training and structured implementation. Formal RCA training programs typically cover specific phases designed to institutionalize an operating system for structured problem-solving [38]. A comprehensive approach includes introductions to RCA concepts, team formation, problem definition and risk assessment, interim containment actions, cause determination, solution identification, implementation and validation, and finally, institutionalization of improvements [38].
Training delivers significant benefits including cost reduction through preventing recurring issues, improved data quality by eliminating sources of errors, enhanced operational efficiency by addressing systemic issues, and better decision-making through data-driven insights [38]. For research organizations, these benefits translate directly into more reliable analytical results, reduced method variability, and increased confidence in research outcomes.
Implementation Roadmap for Laboratories
Implementing Root Cause Analysis effectively for intermediate precision investigations follows a systematic process that has been refined through years of practice and application [38]. The following diagram illustrates the key phases of the RCA process tailored for analytical method variability investigations:
The process begins with defining the problem precisely using quantitative data from intermediate precision studies [38] [44]. This includes specifying the exact nature of the variability, its magnitude, and the conditions under which it occurs. The next phase involves collecting comprehensive data including method validation records, analyst training documentation, equipment logs, environmental monitoring data, and sample preparation records [38].
With data collected, teams identify possible causal factors using techniques like the 5 Whys or Fishbone Diagram [38] [44]. The most critical phase follows—determining the root cause(s)—by analyzing potential causes against the available evidence [38]. Once root causes are confirmed, the team develops and implements solutions such as modified procedures, enhanced training, or equipment adjustments [38] [44]. The final phase involves monitoring and validating the effectiveness of solutions through follow-up precision studies and ensuring sustained improvement [38].
Experimental Protocols for Intermediate Precision Testing
Standardized Intermediate Precision Study Design
Intermediate precision expresses the precision obtained within a single laboratory over a longer period of time (generally at least several months) and takes into account more changes than repeatability, including different analysts, different calibrants, different batches of reagents, and different columns [2]. A properly designed intermediate precision study incorporates intentional variation of these factors to evaluate their potential impact on analytical results.
The experimental protocol should include multiple analysts performing the same analytical method on homogeneous reference material or quality control samples over an extended period (typically several weeks to months). Each analyst should perform the analysis across multiple days using different instrument calibrations, different batches of critical reagents, and where applicable, different columns or consumable lots. The study design should balance the variations to enable statistical analysis of individual factors contributing to overall variability.
Data Collection and Analysis Methodology
Comprehensive data collection is essential for meaningful Root Cause Analysis of intermediate precision issues. The following table outlines key experimental data to collect during intermediate precision studies:
Table 2: Experimental Data Collection Framework for Intermediate Precision Studies
| Data Category | Specific Parameters | Measurement Frequency | Acceptance Criteria |
|---|---|---|---|
| Analytical Results | Peak area/height, retention time, calculated concentration, impurity percentage | Each sample analysis | Based on method validation specifications |
| Sample Preparation | Weight accuracy, dilution factors, extraction time/temperature, solvent batches | Each preparation | Standard operating procedure requirements |
| Instrument Parameters | Column temperature, flow rate, detection wavelength, pressure profiles | Each analysis | Method specifications ± defined ranges |
| Environmental Conditions | Laboratory temperature, humidity, light exposure | Continuous monitoring | Established control ranges (e.g., 20-25°C) |
| Reagent/Material Details | Lot numbers, expiration dates, supplier certifications, preparation dates | Each new lot/preparation | Quality control testing results |
| Analyst Information | Training records, experience level, specific technique variations | Per analyst participation | Completed method training certification |
Data analysis should include calculation of descriptive statistics (mean, standard deviation, relative standard deviation) for results grouped by analyst, day, instrument, and reagent lot. Statistical techniques such as Analysis of Variance (ANOVA) can help quantify the contribution of different factors to overall variability. Visual tools like control charts, histograms, and scatter plots facilitate pattern recognition and anomaly detection [45] [46].
Visualizing Root Cause Analysis for Analytical Variability
Fishbone Diagram for Analyst-Related Variability
When investigating intermediate precision issues between analysts, the Fishbone Diagram (Ishikawa Diagram) provides a comprehensive visual framework for categorizing potential causes [41] [42]. The following diagram illustrates common categories and specific factors that may contribute to analytical variability:
Data Visualization for Precision Studies
Effective graphical representation of precision data enhances understanding and facilitates Root Cause Analysis. Histograms display the distribution of analytical results, allowing visual comparison of data spread between different analysts [45] [46]. Frequency polygons can overlay results from multiple analysts on the same graph, highlighting differences in central tendency and variability [45] [46]. Control charts plot analytical results over time, with separate lines for different analysts, making systematic differences immediately apparent.
When preparing graphical representations of quantitative data from precision studies, several principles ensure clarity and accuracy: use appropriate scaling to avoid misinterpretation, include clear labels and units, employ consistent color schemes across related graphs, and provide sufficient contextual information to support correct interpretation [45]. For intermediate precision studies, side-by-side box plots effectively compare distribution characteristics across analysts, while scatter plots can reveal relationships between environmental factors and analytical results.
Essential Research Reagent Solutions for Precision Studies
Critical Materials and Their Functions
Well-characterized reference materials and high-quality reagents are fundamental for meaningful intermediate precision studies and subsequent Root Cause Analysis. The following table details essential research reagent solutions and their functions in precision investigations:
Table 3: Essential Research Reagent Solutions for Precision Studies
| Material Category | Specific Examples | Function in Precision Studies | Quality Considerations |
|---|---|---|---|
| Certified Reference Materials | USP reference standards, NIST traceable materials, certified purity compounds | Establish accuracy baseline, enable system suitability testing, provide comparison point for results | Documentation of traceability, certified uncertainty values, stability documentation |
| Chromatographic Materials | HPLC columns, guard columns, mobile phase solvents, buffers | Maintain separation performance, ensure retention time stability, control peak shape | Column certification, solvent purity grades, buffer preparation consistency |
| Sample Preparation Reagents | Extraction solvents, derivatization reagents, dilution solvents, internal standards | Control extraction efficiency, ensure reaction completeness, correct for procedural losses | Lot-to-lot consistency, expiration date monitoring, purity verification |
| Quality Control Materials | In-house reference standards, quality control samples at multiple concentrations, stability samples | Monitor analytical performance over time, detect systematic errors, validate method robustness | Homogeneity testing, stability studies, concentration assignment uncertainty |
| System Suitability Materials | Test mixtures, efficiency standards, tailing factor solutions | Verify instrument performance meets method requirements before sample analysis | Defined acceptance criteria, stability information, preparation consistency |
Material Management for Reduced Variability
Proper management of research reagents significantly reduces unnecessary variability in intermediate precision studies. Implementation of standardized procedures for reagent qualification, storage, and usage minimizes this potential source of variation. Key practices include maintaining comprehensive documentation of all materials (including lot numbers, expiration dates, and storage conditions), establishing qualification protocols for new reagent lots before use in critical studies, implementing proper inventory management systems to ensure material stability, and creating standardized preparation procedures for solutions and mobile phases.
For intermediate precision studies specifically, using single lots of critical reagents across all analysts eliminates one potential source of variability, allowing clearer identification of analyst-related effects. Alternatively, intentionally incorporating different reagent lots in the study design enables quantification of this factor's contribution to overall variability. The choice between these approaches depends on the study objectives—whether to maximize detection of analyst-related effects or to comprehensively evaluate overall method robustness.
Root Cause Analysis provides a systematic framework for investigating and resolving variability in analytical measurements, particularly intermediate precision differences between analysts. By applying structured RCA techniques such as the 5 Whys, Fishbone Diagrams, and Change Analysis, research scientists can move beyond superficial symptoms to identify fundamental causes of variability. Implementation of comprehensive RCA training programs establishes an organizational culture of systematic problem-solving and continuous improvement.
The integration of well-designed experimental protocols for intermediate precision testing with rigorous data collection and visualization enables evidence-based root cause identification. Proper selection and management of research reagent solutions further reduces extraneous variability, allowing clearer focus on analyst-related factors. Through consistent application of these principles and methodologies, drug development professionals and researchers can significantly enhance the reliability and reproducibility of analytical data, ultimately supporting robust scientific conclusions and regulatory decision-making.
Intermediate precision demonstrates the consistency of analytical results when an assay is performed under varied conditions within the same laboratory, such as by different analysts, on different days, or using different equipment [5]. It is a critical validation parameter for potency assays, which are legally required for the lot release of biologics and Advanced Therapy Medicinal Products (ATMPs) [47]. A failure in intermediate precision indicates that the assay's results are unacceptably sensitive to these normal operational variations, jeopardizing the reliability of potency data needed for batch release, stability testing, and ensuring patient safety [47] [48].
This case study examines a common challenge in bioassay development: resolving intermediate precision failure. Using a real-world example of a potency assay for an autologous CD34+ cell therapy (ProtheraCytes), we will objectively compare the performance of an initial manual method against an automated alternative, providing the experimental data and protocols that led to a successful resolution.
The Challenge: High Variability in a Manual VEGF ELISA
Background on the Original Potency Assay
The ProtheraCytes therapy promotes cardiac regeneration through angiogenesis, primarily via the secretion of Vascular Endothelial Growth Factor (VEGF) [49]. Therefore, the mechanism of action (MoA)-aligned potency assay was designed to quantify VEGF secreted by CD34+ cells during expansion. The initial development used a traditional manual ELISA method (QuantiGlo ELISA Kit) [49].
Emergence of the Intermediate Precision Problem
During validation, the manual ELISA method demonstrated unacceptably high variability. Coefficients of Variation (CVs) for some test samples were recorded at 18.4% and even 30.1% [49]. This level of imprecision, particularly between different analysts and runs, constituted a failure of intermediate precision. Such high CVs threatened the assay's ability to reliably distinguish potent product batches from sub-potent ones, risking its suitability for product release.
Table 1: Performance Comparison of Manual vs. Automated VEGF Assay
| Parameter | Manual ELISA | Automated ELLA System |
|---|---|---|
| Key Instrument | Traditional plate reader | ELLA system (Bio-Techne) |
| Throughput | Lower | Higher |
| Handling | Extensive manual steps | Fully automated |
| Max CV Observed | 30.1% | ≤ 15% |
| Typical CV Range | Not specified; included failures | 0.0% to 7.5% |
| Cross-contamination Risk | Higher | Lower (microfluidic cartridges) |
Systematic Investigation and Root Cause Analysis
The investigation into the precision failure focused on identifying sources of variability inherent in the manual method.
- Operator-Induced Variability: Manual ELISA involves numerous complex, multi-step procedures, including serial dilution, reagent transfer, washing, and incubation. Each step is a potential source of variation, especially between different analysts [47]. Slight differences in pipetting technique, incubation timing, or washing efficiency can significantly impact the final fluorescence readout.
- Sample Preparation Errors: The manual preparation of dilution series without independent replication can introduce errors that are difficult to control and statistically identify [47].
- Data Acquisition and Processing: The precision of the manual method may have been limited by the consistency of the plate-reading process and the manual data reduction steps.
The Solution: Transition to an Automated Immunoassay Platform
Experimental Protocol: Method Comparison and Validation
To mitigate the identified variability, the team developed and validated a new potency assay using the fully automated ELLA system (Bio-Techne) [49].
- Instrumentation: The ELLA system is an automated microfluidic immunoassay platform.
- Reagent Solutions: The key research reagent was the "Simple Plex Cartridge Kit, containing VEGF-A for use with Human Cell Supernatant" (Bio-Techne). This single-use cartridge contains all necessary antibodies and reagents for a quantitative sandwich ELISA [49].
- Experimental Workflow: The same set of cell culture supernatants from both AMI patients and healthy donors, previously analyzed with the manual ELISA, were re-analyzed using the ELLA system. This direct comparison was crucial for demonstrating parity in accuracy and superiority in precision [49].
- Validation Protocol: The VEGF quantification method using ELLA was formally validated according to ICH Q2(R2) guidelines. The parameters assessed included [49]:
- Specificity: Measured VEGF in unspiked culture medium was below the Lower Limit of Quantification (LLOQ).
- Linearity and Range: Demonstrated from 20 pg/mL to 2800 pg/mL (R² = 0.9972).
- Accuracy: Mean recoveries for each concentration were between 85% and 105%.
- Precision: This included repeatability (intra-assay precision) and intermediate precision (variation between analysts, days, and equipment).
Figure 1: Investigation and Resolution Workflow for Intermediate Precision Failure.
Key Research Reagent Solutions
The successful resolution depended on specific critical reagents and instruments.
Table 2: Essential Research Reagents and Instruments for the Automated Potency Assay
| Item | Function/Description | Role in Resolving Intermediate Precision |
|---|---|---|
| ELLA System (Bio-Techne) | Automated microfluidic immunoassay platform. | Eliminated manual pipetting, washing, and incubation steps, the primary sources of analyst-to-analyst variation. |
| Simple Plex VEGF-A Cartridge | Single-use microfluidic cartridge pre-coated with VEGF-A antibodies. | Standardized the entire immunoassay process, ensuring identical reaction conditions for every run. |
| Cell Culture Supernatant | Sample containing secreted VEGF from expanded CD34+ cells. | The biological matrix for which the assay was specifically validated. |
| Reference Standard | Well-characterized VEGF standard for calibration. | Enabled relative potency measurement, controlling for inter-assay variability [47]. |
Results: Quantitative Comparison of Assay Performance
The validation data from 38 clinical batches provided clear, quantitative evidence of the automated method's superior performance and robustness [49].
- Precision: The ELLA system dramatically reduced variability. All CVs for positive controls and patient samples were below 15%, with a range of 0.0% to 7.5% [49]. This met the pre-defined acceptance criteria for a precise method.
- Intermediate Precision: The method demonstrated that it was unaffected by normal laboratory variations. The validation confirmed intermediate precision ≤ 20%, proving the assay's robustness across different analysts and days [49].
- Assay Validity: All validation runs met strict system suitability criteria, including a correlation coefficient R² > 0.95 for the standard curve and control values falling within expected ranges [49].
Table 3: Summary of Validated Parameters for the Automated VEGF Potency Assay
| Validation Parameter | Result | Acceptance Criteria |
|---|---|---|
| Linearity Range | 20 - 2800 pg/mL | R² = 0.9972 |
| Repeatability Precision | CV ≤ 10% | Met |
| Intermediate Precision | CV ≤ 20% | Met |
| Accuracy (% Recovery) | 85% - 105% | Met |
| Specificity | [VEGF] in medium < LLOQ (2 pg/mL) | LLOQ = 20 pg/mL |
Discussion and Broader Implications
The successful resolution of the intermediate precision failure in this case study underscores several key principles in potency assay development for ATMPs.
- Automation as a Tool for Robustness: Transitioning from a manual ELISA to the automated ELLA system was the pivotal factor. The microfluidic cartridge design minimized manual handling, standardizing the entire process and effectively eliminating analyst-induced variability [49]. This demonstrates that technological innovation is a powerful strategy for mitigating bioassay variability.
- Adherence to a Phase-Appropriate Framework: The development and validation of this assay followed international guidelines (ICH Q2(R2), EMA, and FDA) [49] [48]. This highlights the non-negotiable requirement for a structured, regulatory-aligned approach to potency assay validation throughout the drug development process [47].
- Focus on the Mechanism of Action: The assay's success is also rooted in its direct link to the product's biological function—VEGF secretion for angiogenesis [49]. A well-understood MoA provides the scientific rationale for the assay format and increases regulatory confidence.
This case study aligns with industry-wide experiences. For instance, in the development of an Antibody-Drug Conjugate (ADC) potency assay, Sterling Pharma Solutions also reported controlled intermediate precision, with a %RSD of 4.5% achieved through careful management of cell banks and rigorous optimization of assay parameters like incubation time and cell density [50]. Similarly, the validation of a cell-based potency assay for the gene therapy Luxturna emphasized precision, achieving a pooled intermediate precision %GCV of 8.2% across multiple potency levels [51].
This case study demonstrates a successful pathway for resolving intermediate precision failure. The high variability (CVs up to 30.1%) of a manual VEGF ELISA was systematically addressed by implementing an automated, microfluidic immunoassay platform. The validated ELLA method demonstrated excellent precision, with CVs below 15% and confirmed intermediate precision of ≤ 20%, making it suitable for the release of a clinical-grade cell therapy product. The solution highlights the critical importance of automation, rigorous validation, and a science-driven, MoA-based approach in developing robust potency assays that meet the stringent requirements of modern biologics and ATMP development.
In the context of scientific research and drug development, the acronym CAPA can represent two distinct but potentially interconnected concepts. The first is the quality management mainstay, Corrective and Preventive Action, a systematic process for investigating and eliminating the causes of non-conformities. The second is a specialized laboratory technique, the Chloroalkane Penetration Assay, a quantitative method for measuring the cytosolic penetration of biomolecules [52] [53]. Both are critical for ensuring the reliability and validity of scientific data, particularly in studies involving analytical method validation and intermediate precision testing between analysts.
This guide explores both CAPA frameworks, focusing on their application in a research environment where demonstrating consistency across different analysts and instruments is paramount. A robust Corrective and Preventive Action system is essential for managing deviations in analytical methods, while the Chloroalkane Penetration Assay provides a precise tool for generating the data upon which these quality decisions are made.
CAPA in Quality Management: A Framework for Reliability
Core Principles and Process
A Corrective and Preventive Action (CAPA) system is a structured quality management process designed to identify, investigate, and resolve the root causes of existing problems (corrective action) and to prevent potential problems from occurring (preventive action) [54] [55] [56]. Its ultimate purpose is to move beyond superficial fixes and drive continuous improvement in processes and products, which is fundamental to regulatory compliance and research integrity [57] [56].
The process is typically broken down into a series of disciplined steps, often following methodologies like the 8D (Eight Disciplines) problem-solving approach [55]:
The CAPA workflow begins with planning and team formation (D0-D1), followed by a precise problem description (D2). Immediate containment actions are then applied (D3) before a deep root cause analysis is conducted (D4). The core of the process involves developing, implementing, and validating permanent corrective actions (D5-D6). It culminates by implementing systemic preventive actions (D7) and formally verifying effectiveness before closure (D8) [55].
CAPA Escalation and Risk-Based Triggers
A critical aspect of an efficient CAPA system is knowing when to initiate a formal process. The decision to escalate an issue to a CAPA should be guided by a risk-based matrix to avoid overloading the system with minor issues or neglecting major systemic problems [54] [58]. Common triggers include significant quality events, recurring non-conformities, and high-risk situations identified through trend analysis [55].
Key Escalation Criteria:
- Recurrence: A minor issue that happens repeatedly indicates an underlying systemic fault that requires a CAPA [55].
- Severity: Issues affecting product safety, performance, or regulatory compliance typically warrant a CAPA [55] [58].
- Impact: A problem affecting multiple products or processes suggests a broader weakness in the quality system [58].
The Chloroalkane Penetration Assay (CAPA): A Technical Deep Dive
The Chloroalkane Penetration Assay (CAPA) is a high-throughput, quantitative method that measures the extent to which a molecule of interest, such as a peptide, protein, or oligonucleotide, accesses the cytosol of a cell [52] [53]. Unlike other methods (e.g., flow cytometry without compartment specificity or confocal microscopy which is qualitative), CAPA specifically quantifies cytosolic localization, distinct from molecules trapped in endosomes, which are typically therapeutically inactive [52].
The Principle: The assay uses a cell line that stably expresses HaloTag, a modified bacterial haloalkane dehalogenase, exclusively in the cytosol. HaloTag reacts irreversibly and specifically with a chloroalkane ligand [52] [53].
- Pulse: Cells are incubated with the molecule of interest tagged with a chloroalkane group (ct-compound).
- Cytosolic Access: If the ct-compound reaches the cytosol, it covalently binds to and blocks the active sites of HaloTag.
- Chase: Cells are then treated with a cell-permeable, chloroalkane-tagged fluorescent dye (ct-dye).
- Quantification: The ct-dye can only bind to unblocked HaloTag sites. The resulting fluorescence, measured via flow cytometry, is therefore inversely proportional to the amount of ct-compound that reached the cytosol [53]. Data is fit to a sigmoidal dose-response curve, and the CP50 value—the concentration of ct-compound that blocks 50% of the HaloTag signal—is used as a quantitative measure of cytosolic penetration [53].
Detailed Experimental Protocol
The following workflow outlines the key steps in performing the Chloroalkane Penetration Assay, from cell preparation to data analysis.
Key Materials and Reagents:
- HaloTag-Expressing Cell Line: Engineered to express HaloTag anchored to the cytosolic face of the outer mitochondrial membrane [52].
- Chloroalkane-tagged (ct-) Compound: The molecule of interest (e.g., oligonucleotide, peptide) must be synthesized with a covalently attached chloroalkane tag [53].
- Chloroalkane-tagged Fluorescent Dye (ct-dye): A cell-permeable, fluorescent HaloTag ligand (e.g., Janelia Fluor dyes) [52].
- Flow Cytometer: For high-throughput, quantitative measurement of cellular fluorescence.
Step-by-Step Methodology:
- Cell Culture: Plate HaloTag-expressing cells at an appropriate density and allow them to adhere and grow under standard conditions [52].
- Pulse with ct-Compound: Incubate cells with a range of concentrations of the ct-compound for a defined period (e.g., 4 hours). Serum-free or serum-containing media can be used depending on the experimental question [53].
- Wash: Thoroughly wash the cells to remove any uninternalized ct-compound.
- Chase with ct-dye: Incubate cells with the cell-permeable ct-dye. This dye will label all HaloTag proteins that were not blocked by the ct-compound during the pulse phase.
- Fluorescence Measurement: Trypsinize the cells, resuspend them in an appropriate buffer, and analyze fluorescence using a flow cytometer. A minimum of 10,000 events per sample is recommended for statistical robustness.
- Data Analysis:
- Calculate the mean fluorescence intensity for each ct-compound concentration.
- Normalize data to control cells that were not pulsed with ct-compound (100% fluorescence) and cells treated with a saturating concentration of an unlabeled HaloTag ligand (0% fluorescence).
- Fit the normalized data to a sigmoidal dose-response curve.
- Calculate the CP50 value, which represents the concentration of ct-compound needed to reduce fluorescence by 50%, serving as a key metric for cytosolic penetration efficiency [53].
Comparative Analysis: CAPA vs. Alternative Methods
Quantitative Comparison of Cell Penetration Assays
The Chloroalkane Penetration Assay offers distinct advantages over traditional methods for measuring cellular internalization. The table below summarizes a direct comparison based on key performance parameters.
| Method | Measurement Type | Throughput | Compartment Specificity | Key Limitations |
|---|---|---|---|---|
| Chloroalkane Penetration Assay (CAPA) | Quantitative | High | Yes (Cytosol) | Requires covalent chloroalkane tagging; specialized cell line [52] [53]. |
| Flow Cytometry | Quantitative | High | No | Measures total cellular uptake, cannot distinguish cytosol from endosomes [52]. |
| Confocal Microscopy | Qualitative | Low | Yes | Subjective analysis; poor quantitation; low throughput [52]. |
| Mass Spectrometry | Quantitative | Medium | No | Requires complex sample prep; does not distinguish compartments [52]. |
| Reporter Gene Assays | Semi-Quantitative | High | Indirect | Signal amplification may not reflect actual concentration; indirect measure [52]. |
Application in Oligonucleotide Therapeutic Development
CAPA has been successfully applied to quantitatively compare the cytosolic penetration of various oligonucleotide therapeutic designs. For example, it has been used to evaluate the effects of:
- Backbone Modifications: Phosphorothioate (PS) backbones generally show better cytosolic penetration than phosphodiester (PO) backbones [53].
- Sugar Modifications: 2'-O-methyl (2'-OMe) modified oligonucleotides can exhibit superior CP50 values compared to 2'-O-methoxyethyl (2'-MOE) or DNA (2'-H) analogs within the same sequence [53].
- Modification Patterning: Alternating patterns of 2' modifications (e.g., 2-by-2 or 3-by-3) can significantly and sometimes unexpectedly impact cytosolic penetration, demonstrating a synergistic effect between modification type, number, and location [53].
This data provides crucial, quantitative insights that complement cellular activity assays, helping researchers deconvolute intrinsic potency from delivery efficiency.
The Scientist's Toolkit: Essential Reagents for CAPA
| Item | Function | Application Notes |
|---|---|---|
| HaloTag Cell Line | Provides cytosolic expression of the HaloTag protein for the assay. | Can be engineered in-house or obtained commercially; can be introduced via viral transduction (e.g., AAV) for use in difficult-to-transfect or therapeutically relevant cell types [53]. |
| Chloroalkane Tag | A small molecule ligand that irreversibly binds HaloTag; used to tag molecules of interest. | Must be covalently conjugated to the molecule being tested (e.g., oligonucleotide, peptide); linker chemistry should be considered to minimize impact on the molecule's properties [52] [53]. |
| HaloTag Ligand (Fluorescent) | Cell-permeable dye used to detect unblocked HaloTag after the pulse step. | Available in various fluorophores compatible with flow cytometers (e.g., Janelia Fluor 549, 646); choice depends on instrument laser and filter setup [52]. |
| Flow Cytometer | Instrument for quantifying fluorescence intensity of individual cells. | Enables high-throughput, quantitative data collection; a benchtop instrument is sufficient [52]. |
Interplay of CAPA and Intermediate Precision in Research
The two meanings of CAPA converge in the context of analytical method validation, particularly concerning intermediate precision. Intermediate precision measures the variability of an analytical method within the same laboratory under different conditions, such as different analysts, different days, or different instruments [19] [5]. This is a stricter test of a method's reliability than repeatability and is essential for ensuring that research findings are robust and not analyst-dependent.
A robust Corrective and Preventive Action process is the governance framework used when an investigation into method performance—such as unacceptably high variability in CP50 values between two analysts—reveals a systemic issue. The root cause might be a poorly defined step in the Chloroalkane Penetration Assay protocol. The ensuing CAPA would then involve corrective actions (e.g., retraining analysts, revising the SOP) and preventive actions (e.g., implementing more rigorous qualification of new analysts) to bring the intermediate precision within acceptable limits and prevent future occurrences [55] [58]. This ensures that quantitative data generated by the Chloroalkane Penetration Assay is reliable and reproducible, forming a solid foundation for critical decisions in drug development.
Strategies for Reducing Analyst-Induced Variation Through Standardization
In the context of intermediate precision testing, analyst-induced variation represents a critical component of the total variability observed in analytical results. Intermediate precision, occasionally referred to as within-lab reproducibility, expresses the precision obtained within a single laboratory over an extended period, specifically accounting for variations caused by different analysts, equipment, calibrants, and reagent batches [2]. Unlike repeatability, which captures the smallest possible variation under consistent conditions (same operator, same system, short time frame), intermediate precision intentionally incorporates these changing factors to provide a more realistic assessment of method robustness [2]. This distinction is paramount for researchers and drug development professionals who must ensure analytical methods remain reliable despite normal laboratory fluctuations.
The systematic reduction of analyst-induced variation is not merely a technical concern but a fundamental requirement for regulatory compliance and scientific credibility. When multiple analysts perform the same analytical procedure, differences in technique, interpretation, and execution can introduce significant variability that obscures true analytical results and compromises data integrity. This article provides a comprehensive comparison of standardization strategies designed specifically to minimize this analyst-induced component, thereby enhancing the reliability of intermediate precision data in pharmaceutical research and development.
Core Concepts and Definitions
Understanding the specific terminology of method validation is essential for implementing effective standardization strategies. The following definitions clarify key concepts relevant to variation reduction:
- Repeatability: Expresses the closeness of results obtained with the same sample using the same measurement procedure, same operators, same measuring system, same operating conditions, and same location over a short period of time (typically one day or one analytical run). This represents the smallest possible variation in results [2].
- Intermediate Precision (within-lab reproducibility): The precision obtained within a single laboratory over a longer period (several months) that accounts for additional variations including different analysts, different calibrants, different batches of reagents, and different equipment [2].
- Reproducibility: Expresses the precision between measurement results obtained in different laboratories. This is not typically the focus of single-lab validation but is crucial for method standardization across organizations [2].
- Analyst-Induced Variation: The component of total measurement variability attributable to differences in how individual analysts perform the analytical method, including technique, timing, interpretation, and manual operations.
Table 1: Precision Terminology in Method Validation
| Term | Scope of Variability | Key Variable Factors |
|---|---|---|
| Repeatability | Minimal variability; short timeframe | None; all conditions constant [2] |
| Intermediate Precision | Within-laboratory; longer timeframe | Analysts, equipment, reagent batches, calibration events [2] |
| Reproducibility | Between laboratories | Laboratory environment, equipment, training philosophies [2] |
Systematic Strategies for Reducing Analyst-Induced Variation
Comprehensive Standardization of Procedures
The foundation for minimizing analyst-induced variation lies in the comprehensive standardization of work instructions and analytical procedures. Standardized work instructions provide clear, detailed guidance to ensure each analyst performs tasks consistently and accurately, effectively eliminating variations caused by individual differences in technique or interpretation [59]. This approach requires developing meticulously documented procedures that specify not only the core analytical steps but also auxiliary factors such as environmental conditions, timing requirements, and equipment handling protocols. The creation of these standardized documents should be a collaborative process incorporating input from experienced analysts to ensure procedures are both technically sound and practically executable.
Implementation of standardized procedures extends beyond document creation to encompass regular review cycles that incorporate lessons learned from routine application and deviations. This dynamic approach to standardization ensures procedures remain current with technical advancements and operational experience. Furthermore, standardized procedures should include clear acceptance criteria for analytical results, providing objective benchmarks that all analysts can apply consistently when evaluating data quality. This eliminates subjective interpretation of results, which represents a significant source of analyst-induced variation, particularly for methods requiring judgment-based endpoint determinations or integration parameters in chromatographic analysis [60].
Structured Training and Certification Programs
A rigorous, standardized training and certification program represents one of the most effective strategies for minimizing skill-related variations between analysts. Structured training protocols ensure all personnel receive consistent instruction on both the theoretical principles and practical execution of analytical methods, creating a unified understanding and approach across the analytical team [60]. Effective training transcends simple demonstration, incorporating supervised hands-on practice, objective performance assessment, and formal certification against predefined competency standards. This systematic approach to capability development fosters a culture of technical excellence and consistent execution.
To sustain initial training benefits, organizations should implement ongoing proficiency testing where analysts periodically perform the method using reference standards, with results tracked and compared to ensure continued alignment and identify any emerging technique divergences [60]. This continuous development approach, combined with cross-training on multiple techniques, enhances overall team flexibility while maintaining methodological consistency. Engaging analysts in the training development process through peer-to-peer knowledge sharing further reinforces standardization by leveraging internal expertise and creating a collaborative environment focused on unified best practices [60].
Statistical Process Control and Monitoring
Statistical Process Control (SPC) provides a powerful, data-driven approach for monitoring analytical processes and detecting analyst-induced variations as they occur. Control charts serve as the primary SPC tool, graphically representing process data over time and enabling easy identification of patterns, trends, or shifts that may indicate emerging consistency issues between analysts [59]. By establishing statistical control limits based on historical performance data, these charts provide objective boundaries that define acceptable process variation, allowing for prompt investigation and corrective action when data points fall outside expected ranges [59].
The implementation of SPC for analytical methods requires an initial method capability analysis to establish baseline performance metrics and determine the inherent variability of the method under controlled conditions [59]. This baseline then serves as a reference point for ongoing monitoring, with control charts updated regularly with new analytical results. The systematic tracking of key parameters – including accuracy, precision, sensitivity, and system suitability results – provides a comprehensive view of method performance across different analysts and over time. When properly implemented, SPC transforms method monitoring from a reactive exercise to a proactive process, enabling early detection of analyst-related deviations before they impact data quality or regulatory compliance [59].
Table 2: Comparison of Variation Reduction Strategies
| Strategy | Key Components | Impact on Analyst-Induced Variation | Implementation Considerations |
|---|---|---|---|
| Procedure Standardization | Detailed work instructions; Clear acceptance criteria; Regular review cycles | High impact; Addresses technique and interpretation differences | Requires significant initial development; Needs version control |
| Structured Training | Standardized training materials; Hands-on certification; Ongoing proficiency testing | High impact; Equalizes skill and knowledge levels | Time-intensive; Requires dedicated training resources |
| Statistical Process Control | Control charts; Statistical control limits; Trend analysis | Medium-High impact; Detects emerging variations | Requires statistical expertise; Dependent on data quality |
| Continuous Improvement | Root cause analysis; Regular feedback loops; Process refinement | Medium impact; Addresses systemic issues | Cultural commitment required; Benefits realized long-term |
Experimental Protocol for Assessing Intermediate Precision
Study Design and Execution
A robust experimental protocol for evaluating intermediate precision specifically across different analysts requires meticulous design to isolate and quantify the analyst-induced component of total variability. The study should be conducted using homogeneous reference material of known composition and stability to ensure that observed variations originate from methodological or analyst factors rather than sample heterogeneity. A minimum of three different qualified analysts should participate, each performing the analysis across multiple days (typically 3-5 days) with multiple replicates per day (typically 3 replicates), following a pre-defined experimental design that randomizes sequence and timing to prevent confounding with other variables [2].
The execution phase requires strict adherence to the standardized analytical procedure without any modifications or deviations, as the objective is to measure variation under realistic conditions of use. Each analyst should work independently using dedicated instrument systems where possible, or the same instruments at different time periods, with all raw data and observations meticulously recorded in standardized formats. Critical method parameters that should be documented include sample preparation times, environmental conditions, instrument response characteristics, and any observations or difficulties encountered during analysis. This comprehensive data collection enables subsequent root cause analysis of any identified variations and provides insights for further method refinement or additional training needs [2].
Data Analysis and Interpretation
The statistical analysis of intermediate precision data should separately quantify the different components of variability, specifically distinguishing between analyst-to-analyst variation (systematic differences between analysts) and run-to-run variation (random variability within each analyst's results). A nested analysis of variance (ANOVA) design is typically employed for this purpose, providing separate variance estimates for each component. The total intermediate precision is then calculated by combining these variance components, typically reported as relative standard deviation to facilitate interpretation across different measurement scales [2].
Interpretation of results should focus not only on the total intermediate precision but specifically on the magnitude of analyst-induced variation relative to the repeatability component. A significant analyst component (typically indicated by a p-value <0.05 in the ANOVA) suggests that the method is sensitive to differences in analytical technique and would benefit from additional standardization or training. The experimental data should be presented in a structured format that clearly communicates both the statistical findings and their practical implications for method implementation and transfer. This comprehensive assessment provides the evidence base for evaluating the effectiveness of standardization strategies and identifying areas for further improvement [2].
Experimental Workflow and Data Presentation
Intermediate Precision Testing Workflow
The following workflow diagram illustrates the systematic process for designing, executing, and interpreting an intermediate precision study focused on analyst variation:
Comparative Data Presentation Framework
Effective presentation of quantitative data from precision studies requires clear, structured tables that enable straightforward comparison between different analysts and experimental conditions. The frequency table below demonstrates an appropriate format for presenting discrete numerical data from an intermediate precision study, incorporating both absolute and relative frequencies to facilitate comprehensive data interpretation [46] [61]:
Table 3: Sample Data Structure for Analyst Comparison Studies
| Analyst | Test Day | Replicate | Measured Value | Deviation from Mean | Within-Analyst Precision |
|---|---|---|---|---|---|
| Analyst A | Day 1 | 1 | [Value] | [Deviation] | [Precision metric] |
| Analyst A | Day 1 | 2 | [Value] | [Deviation] | [Precision metric] |
| Analyst A | Day 2 | 1 | [Value] | [Deviation] | [Precision metric] |
| Analyst B | Day 1 | 1 | [Value] | [Deviation] | [Precision metric] |
| Analyst B | Day 1 | 2 | [Value] | [Deviation] | [Precision metric] |
| Analyst B | Day 3 | 1 | [Value] | [Deviation] | [Precision metric] |
For continuous data, results should be grouped into appropriate class intervals with equal sizes to facilitate clear visualization and interpretation. The histogram provides the most appropriate graphical representation for this type of data, displaying the distribution of results across different value ranges while maintaining the numerical relationship between categories [46] [61]. When comparing results between multiple analysts, a comparative histogram or frequency polygon effectively illustrates both the central tendency and dispersion of each analyst's results, highlighting any systematic differences or outliers that require investigation [46].
Essential Research Reagent Solutions
The consistent performance of analytical methods across different analysts depends heavily on the quality and standardization of key reagents and materials. The following table details essential research reagent solutions that require careful standardization to minimize analyst-induced variation:
Table 4: Essential Research Reagent Solutions for Method Standardization
| Reagent/Material | Standardization Requirement | Impact on Analyst Variation |
|---|---|---|
| Reference Standards | Certified purity and traceability; Consistent sourcing | High impact; Variation in standard quality directly affects all results |
| Chromatographic Columns | Same manufacturer and lot; Consistent retention characteristics | Medium-High impact; Column performance affects separation and quantification |
| Mobile Phase Buffers | Standardized preparation procedure; Fixed pH and molarity | Medium impact; Inconsistent preparation affects retention time and peak shape |
| Extraction Solvents | Consistent purity grade; Standardized supplier specifications | Medium impact; Extraction efficiency affects recovery and sensitivity |
| Internal Standards | Consistent concentration; Identical sourcing across analysts | High impact; Normalization effectiveness depends on consistency |
| System Suitability Solutions | Identical composition; Standardized acceptance criteria | High impact; Critical for verifying system performance before analysis |
The systematic implementation of standardization strategies provides a powerful approach for reducing analyst-induced variation in intermediate precision testing. Through the combined application of comprehensive procedure standardization, structured training programs, and statistical process control, laboratories can significantly minimize the variability component attributable to different analysts while maintaining the realistic assessment of method robustness that intermediate precision requires. The experimental protocol and data presentation frameworks presented here offer practical guidance for researchers designing studies to quantify and minimize these variations, ultimately enhancing the reliability and credibility of analytical data in pharmaceutical development and regulatory submissions. As analytical methods grow increasingly complex, the continued refinement of these standardization approaches remains essential for ensuring data quality and accelerating drug development timelines.
Validation, Regulatory Requirements, and Industry Applications
Aligning with ICH Q2(R1) and Regional Guidelines (USP, JP, EU)
Analytical method validation is a critical component of pharmaceutical development and quality control, ensuring that analytical procedures are reliable, reproducible, and suitable for their intended purpose. The International Council for Harmonisation (ICH) Q2(R1) guideline serves as the foundational framework for validating analytical procedures, providing definitions and methodology for key validation parameters [15].
Regulatory bodies worldwide have largely adopted the principles of ICH Q2(R1), though regional guidelines from the United States Pharmacopeia (USP), Japanese Pharmacopoeia (JP), and European Union (EU) incorporate specific nuances and emphases reflective of their respective regulatory environments [15]. For researchers and drug development professionals, understanding both the harmonized principles and regional distinctions is essential for global compliance, particularly for critical parameters like intermediate precision testing between analysts [15].
This guide provides a detailed, objective comparison of these guidelines, supported by experimental data and structured protocols, to facilitate robust analytical method validation across different regulatory jurisdictions.
Core Principles and Key Parameter Comparison
The ICH Q2(R1) guideline, titled "Validation of Analytical Procedures: Text and Methodology," outlines the primary validation parameters required to demonstrate that an analytical procedure is suitable for its intended purpose [15] [62]. While the core principles are harmonized across USP, JP, and EU guidelines, key differences in terminology, scope, and emphasis exist.
Comparative Analysis of Validation Parameters
The following table summarizes the alignment and key distinctions between ICH Q2(R1), USP, JP, and EU guidelines [15].
| Validation Parameter | ICH Q2(R1) | USP <1225> | JP General Chapter 17 | EU / Ph. Eur. 5.15 |
|---|---|---|---|---|
| Accuracy | Supported | Supported | Supported | Supported |
| Precision | ||||
| - Repeatability | Supported | Supported | Supported | Supported |
| - Intermediate Precision | Supported | Termed "Ruggedness" | Supported | Supported |
| - Reproducibility | Supported | Supported | Supported | Supported |
| Specificity | Supported | Supported | Supported | Supported |
| Linearity | Supported | Supported | Supported | Supported |
| Range | Supported | Supported | Supported | Supported |
| Detection Limit (DL) | Supported | Supported | Supported | Supported |
| Quantitation Limit (QL) | Supported | Supported | Supported | Supported |
| Robustness | Supported | Supported | Stronger Emphasis | Stronger Emphasis |
| System Suitability Testing | (Implied) | Strong Emphasis | Stronger Emphasis | (Implied) |
| Primary Focus | General analytical procedures | Compendial methods | Regional regulatory standards | Specific analytical techniques |
Key Similarities and Differences
- Harmonized Core Parameters: All guidelines emphasize a core set of validation parameters: accuracy, precision (including repeatability, intermediate precision/ruggedness, and reproducibility), specificity, linearity, range, detection limit, quantitation limit, and robustness [15].
- Terminology Variations: A notable difference is that the USP uses the term "ruggedness" to describe the same concept that ICH, JP, and EU guidelines refer to as "intermediate precision"—the resistance of an analytical method to variations in normal laboratory conditions such as different analysts, instruments, or days [15].
- Regional Emphases: The USP places greater emphasis on system suitability testing (SST) as a prerequisite for method validation [15]. The JP and EU guidelines place a stronger emphasis on robustness, with the EU providing supplementary guidance for specific techniques like chromatography and spectroscopy, particularly for methods used in stability studies [15].
Experimental Protocols for Intermediate Precision Testing
Intermediate precision demonstrates the reliability of an analytical method under normal variations within a single laboratory, such as different analysts, equipment, days, and reagents [63]. A well-designed experimental setup is crucial for generating conclusive data.
Standard Experimental Design and Workflow
The following diagram illustrates a typical workflow for an intermediate precision study designed to account for multiple variables.
Detailed Methodology
A robust intermediate precision study should investigate the effect of deliberate variations in the analytical environment.
- 1. Study Setup: The experiment should include a minimum of 6 independent analytical runs performed under different conditions [63]. Each run should contain a minimum of 3 replicates to allow for statistical evaluation of both within-run and between-run variability [63].
- 2. Incorporating Variations: Each run should incorporate pre-defined variations. A sample experimental design is detailed in the table below [63].
| Run Number | Analyst | Instrument | HPLC Column | Day |
|---|---|---|---|---|
| 1 | Analyst A | Instrument 1 | Column 1 | Day 1 |
| 2 | Analyst A | Instrument 2 | Column 2 | Day 2 |
| 3 | Analyst A | Instrument 1 | Column 3 | Day 3 |
| 4 | Analyst B | Instrument 2 | Column 1 | Day 4 |
| 5 | Analyst B | Instrument 1 | Column 2 | Day 5 |
| 6 | Analyst B | Instrument 2 | Column 3 | Day 6 |
- 3. Execution: For each run, all solutions (e.g., reagents, reference standards) must be prepared fresh to ensure the runs are truly independent [63].
- 4. Data Analysis: Data from all runs and replicates are analyzed using Analysis of Variance (ANOVA). This statistical method separates the total variability in the data into two components [63]:
- Within-run variance: This represents the repeatability of the method.
- Between-run variance: This represents the variability introduced by the changing conditions (e.g., different analysts, instruments).
- The sum of the within-run and between-run variances is used to calculate the standard deviation and Relative Standard Deviation (RSD%) for intermediate precision [63].
Supporting Data and Statistical Evaluation
Proper statistical evaluation of the data collected from precision studies is essential to demonstrate that the method is suitable for its intended purpose.
Example Data Set and Calculation for an Active Ingredient
Assume a product specification of 70-130% for an active ingredient. A combined accuracy and repeatability study was conducted using 3 replicates at 3 concentration levels (70%, 100%, 130%) for a total of 9 determinations [63].
Table: Example Repeatability Data for an Active Ingredient Assay
| Concentration Level | Replicate 1 (%) | Replicate 2 (%) | Replicate 3 (%) | Mean (%) | Standard Deviation (SD) | RSD% |
|---|---|---|---|---|---|---|
| 70% | 71.5 | 70.8 | 72.1 | 71.5 | 0.65 | 0.91% |
| 100% | 101.2 | 99.5 | 100.3 | 100.3 | 0.85 | 0.85% |
| 130% | 128.9 | 129.5 | 131.0 | 129.8 | 1.06 | 0.82% |
- Statistical Evaluation: If an ANOVA test confirms that the mean values across concentration levels can be considered equal and that the variances are homogeneous (a condition known as homoscedasticity, which can be confirmed with a Levene's or Bartlett's test), it is permissible to pool all 9 data points to calculate an overall standard deviation and RSD% for repeatability [63]. If the means are not equal, ANOVA provides a pooled standard deviation, which represents the average precision across the reportable range of the method [63].
Example Data Set for an Impurity Method
For impurity methods, variability often increases with concentration (heteroscedasticity). In such cases, precision should be calculated individually for each concentration level, requiring 6 replicates per level for a reliable estimate [63].
Table: Example Repeatability Data for an Impurity Assay (Specification: NMT 1.5%)
| Spiked Level | 0.15% | 0.75% | 1.50% |
|---|---|---|---|
| Replicates (%) | 0.14, 0.16, 0.15, 0.13, 0.17, 0.15 | 0.72, 0.77, 0.74, 0.79, 0.71, 0.76 | 1.45, 1.52, 1.55, 1.48, 1.51, 1.49 |
| Mean (%) | 0.15 | 0.75 | 1.50 |
| Standard Deviation (SD) | 0.014 | 0.031 | 0.036 |
| RSD% | 9.3% | 4.1% | 2.4% |
The Scientist's Toolkit: Essential Research Reagent Solutions
The following table details key reagents and materials essential for conducting robust analytical method validation, particularly for precision studies.
| Item | Function in Validation | Critical Quality Attributes |
|---|---|---|
| USP Reference Standards | Highly characterized specimens used to qualify reagents and calibrate analytical instruments; essential for generating accurate and reproducible data [64]. | Certified purity and potency, traceability, stability. |
| Chromatographic Columns | Critical for separation performance in HPLC/UPLC methods; testing with different columns from different lots is part of robustness and intermediate precision testing. | Column chemistry (C18, C8, etc.), lot-to-lot reproducibility, particle size. |
| High-Purity Reagents & Solvents | Used for preparing mobile phases, sample solutions, and standards. Purity is vital to prevent interference, baseline noise, and false results. | HPLC/GC grade, low UV absorbance, low particulate content. |
| System Suitability Test Kits | Standardized materials used to verify that the chromatographic system is performing adequately before and during validation runs [15]. | Well-characterized resolution, tailing factor, and reproducibility. |
Successful analytical method validation for global markets requires a deep understanding of the harmonized principles of ICH Q2(R1) and the specific nuances of regional guidelines like USP, JP, and EU. While the core parameters are aligned, attention to differences in terminology—such as USP's "ruggedness"—and regional emphases on robustness and system suitability is critical.
For intermediate precision testing between analysts, a rigorously designed study using a matrix approach that incorporates multiple variables (analysts, instruments, days) is recommended. The use of statistical tools like ANOVA is indispensable for deconvoluting the sources of variability and providing a true measure of a method's precision. By adhering to these structured experimental protocols and utilizing high-quality reagent solutions, researchers can generate defensible data that ensures regulatory compliance and upholds the quality and safety of pharmaceutical products across all stages of development and manufacturing.
The Role of Intermediate Precision in Method Transfer and Cross-Validation
In the tightly regulated environments of pharmaceutical and biopharmaceutical development, the reliability of analytical data is non-negotiable. It forms the bedrock for critical decisions regarding product quality, safety, and efficacy. Two processes are fundamental to ensuring data integrity across different laboratories and instruments: method transfer, which is the qualified propagation of an analytical procedure from a transferring to a receiving laboratory, and cross-validation, the demonstration that different methods or sites produce comparable results when data are to be combined or compared [65] [66]. The successful execution of both these processes hinges on a thorough understanding of the method's performance characteristics, one of the most critical being intermediate precision.
Intermediate precision expresses the consistency of results within the same laboratory when variations are introduced in normal operating conditions, such as different analysts, different days, or different equipment [5]. It is a measure of a method's robustness against the minor, everyday fluctuations that occur in any laboratory setting. This article will objectively compare the role of intermediate precision as the connective tissue between successful method transfer and defensible cross-validation, providing structured experimental data and protocols to guide researchers and drug development professionals.
Core Concepts and Their Interrelationships
What is Intermediate Precision?
Intermediate precision is a subset of the broader performance characteristic "precision." While repeatability (intra-assay precision) assesses variation under identical conditions over a short time, intermediate precision investigates the impact of expected, routine changes [5]. As defined by the International Conference on Harmonization (ICH) Q2(R1) guidelines and reflected in industry practice, these changes typically include:
- Different Analysts: Assessing the method's sensitivity to individual technique.
- Different Days: Accounting for variations in environmental conditions and reagent preparation.
- Different Equipment: Evaluating the performance across instruments of the same type.
The outcome of an intermediate precision study is often expressed as the percent coefficient of variation (%CV) or relative standard deviation (%RSD) between the results obtained under these varied conditions [17]. A method with low intermediate precision (%CV) demonstrates that it is sufficiently robust to produce reliable results irrespective of normal laboratory variables, making it an ideal candidate for transfer to another site.
The Nexus with Method Transfer and Cross-Validation
Method transfer and cross-validation, though distinct, are both processes that depend on proving consistency of analytical results.
Method Transfer is a documented process that qualifies a receiving laboratory to use an analytical method that originated in a transferring laboratory. Its primary goal is to demonstrate that the method, when performed at the receiving lab, yields equivalent results to those from the transferring lab [65]. The most common approach for this is comparative testing, where both labs analyze the same set of samples and results are statistically compared [65].
Cross-validation is required "to demonstrate how the reported data are related when multiple bioanalytical methods and/or multiple bioanalytical laboratories are involved" in a single study or across studies where data will be combined to support regulatory decisions [66]. Unlike method transfer, it often involves comparing two fully validated methods.
Intermediate precision is the foundational dataset that predicts the success of these activities. A method with poor intermediate precision in the originating lab will almost certainly fail during transfer or generate irreconcilable differences during cross-validation. The following diagram illustrates this critical logical relationship.
Experimental Data and Comparative Analysis
A well-executed intermediate precision study does more than generate a single %CV; it dissects the method's variability into its constituent parts. This allows scientists to identify and mitigate the largest sources of error. The following table summarizes hypothetical but representative data from an intermediate precision study on a HPLC assay for a drug substance, analyzed using a mixed linear model [17].
Table 1: Component Analysis of Intermediate Precision in an HPLC Assay
| Variability Component | Standard Deviation | %CV | Contribution to Total Variance |
|---|---|---|---|
| Between-Analyst | 0.12 | 1.2% | 15% |
| Between-Day | 0.08 | 0.8% | 7% |
| Between-Instrument | 0.25 | 2.5% | 58% |
| Residual (Repeatability) | 0.15 | 1.5% | 20% |
| Total Intermediate Precision | 0.33 | 3.3% | 100% |
Acceptance Criterion: Total %CV ≤ 5.0%. The method is acceptable, but the between-instrument variation is a key risk.
The data reveals that the primary contributor to method variability is the between-instrument effect. While the total intermediate precision of 3.3% CV meets a typical acceptance criterion of ≤5.0%, this insight is critical. During method transfer, the receiving lab must use an instrument that is carefully qualified and cross-checked against the transferring lab's instrument. For cross-validation, if two different analytical platforms are being compared, this inherent instrument sensitivity must be explicitly considered in the statistical comparison.
Comparative Testing: The Bedrock of Method Transfer
The core experiment for most method transfers is a comparative testing study. The following table outlines a standard experimental design and a comparison of possible outcomes, demonstrating how intermediate precision directly influences the success of the transfer.
Table 2: Method Transfer by Comparative Testing - Experimental Design & Outcomes
| Aspect | Experimental Protocol | Outcome with Good IP | Outcome with Poor IP |
|---|---|---|---|
| Samples | A minimum of 3 batches of drug product (e.g., low, medium, high strength), analyzed in triplicate by both labs [65]. | Homogeneous samples ensure any difference is due to method performance, not sample variance. | Inhomogeneous samples confound results, making it impossible to attribute failure to the method. |
| Analysis | Both transferring (TL) and receiving (RL) labs analyze identical samples using the same analytical method [65]. | Results from TL and RL show high agreement. Statistical equivalence is demonstrated (e.g., via t-test, equivalence test). | Significant, consistent bias is observed between TL and RL results, leading to a failure of equivalence tests. |
| Data Comparison | Results are statistically compared using pre-defined acceptance criteria (e.g., ±2.0% for assay, F-test for precision) [65] [9]. | The difference in means between labs is <1.0%. The %RSD from the RL is comparable to the TL's intermediate precision. | The difference in means is >3.0%. The %RSD from the RL is significantly higher than the TL's intermediate precision, indicating a problem with method execution. |
| Interpretation | The receiving lab is qualified to run the method independently. | The transfer is successful. The RL demonstrates proficiency. | The transfer fails. Investigation and remedial action (e.g., retraining) are required. |
Practical Protocols for the Laboratory
Protocol for Executing an Intermediate Precision Study
A robust intermediate precision study requires careful planning. The following workflow provides a detailed, step-by-step protocol for laboratory implementation.
The Scientist's Toolkit: Essential Reagents and Solutions
The execution of these studies relies on a suite of high-quality materials and solutions. The following table details key items essential for conducting intermediate precision, method transfer, and cross-validation experiments.
Table 3: Key Research Reagent Solutions for Analytical Studies
| Item | Function & Importance | Technical Specification Example |
|---|---|---|
| Drug Substance Reference Standard | Serves as the primary benchmark for accuracy and calibration. Its purity is foundational to all quantitative results. | Purity ≥ 98.0% by HPLC, with well-characterized and controlled impurity profile. |
| Well-Characterized Sample Batches | Provides a consistent and homogeneous material for precision testing. Using a single batch isolates method variability from product variability. | A minimum of three batches representing the quality range (e.g., low, medium, high potency) [65]. |
| Qualified Chromatographic Columns | Ensures separation performance is consistent. Column-to-column variability is a known source of method imprecision. | Columns from at least two different manufacturing lots should be evaluated during robustness testing. |
| Standardized Mobile Phase Buffers | Critical for maintaining consistent chromatographic separation (e.g., retention time, resolution). pH variation is a major source of robustness failure. | pH specified to ±0.05 units; prepared with high-purity reagents and HPLC-grade water. |
| System Suitability Test (SST) Solutions | A quality control check for the entire analytical system before sample analysis. Ensures the system is performing as validated [5]. | A solution containing the analyte and critical impurities to verify resolution, tailing factor, and repeatability. |
In the end-to-end workflow of analytical method lifecycle management, intermediate precision is not merely a regulatory checkbox. It is a critical predictive tool and a leading indicator of success. A method characterized by strong intermediate precision provides confidence for seamless method transfer and forms a solid, defensible foundation for cross-validation exercises. By systematically deconstructing variability through well-designed experiments, as outlined in the protocols and data within this guide, scientists can proactively identify and control risks. This rigorous, data-driven approach ultimately ensures that the analytical results governing drug development and commercialization are reliable, comparable, and worthy of trust.
In the high-stakes landscape of pharmaceutical development, phase-appropriate validation represents a strategic framework for aligning analytical methodologies with the evolving regulatory and scientific requirements of a drug's lifecycle. This approach balances the competing demands of scientific rigor, regulatory compliance, and resource optimization as a compound progresses from initial discovery through commercial marketing [67]. With only an estimated 14% of products that enter clinical trials ultimately reaching commercialization, organizations must avoid overspending on analytical work in early phases while still generating quality results that meet core validation criteria at each development stage [67].
The fundamental principle of phase-appropriate validation acknowledges that the level of method characterization should correspond to the phase of development and the associated risk profile [22]. In early phases, methods must be "fit for purpose" to support initial safety assessments, while later phases require fully validated methods capable of ensuring consistent product quality for market approval [22]. This graded approach allows developers to generate sufficient data to make informed decisions without undertaking unnecessary analytical work that may become irrelevant if the drug candidate fails to progress.
The Validation Pathway Across Clinical Development Phases
Analytical Requirements by Development Phase
The journey of a drug candidate from preclinical testing to commercial application involves progressively stringent analytical requirements, with the level of formality, documentation, and validation increasing at each phase [67]. The following table summarizes the phase-appropriate validation standards throughout the development lifecycle:
| Development Phase | Assay Stage | Validation Standards & Requirements | Primary Clinical Purpose |
|---|---|---|---|
| Preclinical | Stage 1: Fit for Purpose | Scientifically sound methods providing reliable results for decision-making [22] | Screening or exploratory studies [22] |
| Phase 1 Clinical | Stage 1: Fit for Purpose | Accuracy, reproducibility, and biological relevance sufficient to support early safety and pharmacokinetic studies; analytical protocols in memo style with technical review [67] [22] | Early safety and dosing studies, process development [22] |
| Phase 2 Clinical | Stage 2: Qualified Assay | Intermediate precision, accuracy, specificity, linearity, range; alignment with ICH guidelines (e.g., ICH Q2(R2)); full quality assurance review [67] [22] | Dose optimization, safety, process development [22] |
| Phase 3 Clinical | Stage 3: Validated Assay | Validation meeting FDA/EMA/ICH guidelines, GMP/GLP standards, supported by detailed SOPs and QC/QA oversight; more formalized approach including expanded validation characteristics [67] [22] | Confirmatory efficacy and safety, lot release, stability [22] |
| Commercial | Stage 3: Validated Assay | Full validation with robustness testing, strict documentation, and compliance; methods tested by multiple analysts across multiple instruments [67] [22] | Lot release, stability, post-market testing [22] |
Regulatory Framework and Progression
The regulatory framework governing phase-appropriate validation evolves significantly throughout the development process. Before clinical trials begin, there are no formalized data requirements from regulators, though scientifically sound methods are still essential [67]. The Investigational New Drug (IND) application marks the transition to official regulatory oversight, with requirements intensifying through New Drug Applications (NDA) for small molecules or Biologics License Applications (BLA) for biologics [22].
Regulatory agencies including the FDA and EMA encourage a phase-appropriate approach through various guidance documents, such as the "Current Good Manufacturing Practice for Phase 1 Investigational Drugs" and "INDs for Phase 2 and Phase 3 Studies Chemistry, Manufacturing, and Controls Information" [68]. However, these guidelines often lack specific binding requirements, particularly for early-phase development, placing responsibility on sponsors to design appropriate validation strategies that meet both current regulatory expectations and long-term development goals [68].
Figure 1: Progression of Analytical Validation Through Drug Development Phases. This workflow illustrates the evolution of validation stringency from initial exploratory stages through commercial deployment, with corresponding color shifts indicating increasing regulatory rigor.
Intermediate Precision: A Cornerstone of Method Robustness
Conceptual Framework and Definition
Intermediate precision represents a critical validation parameter that evaluates method variability under conditions expected to occur within the same laboratory during routine operations [3]. According to ICH Q2(R2) guidelines, intermediate precision measures the impact of random future variations such as different analysts, days, instruments, reagent lots, and columns on analytical results [3]. Unlike repeatability (which assesses short-term variability under identical conditions) and reproducibility (which evaluates inter-laboratory variation), intermediate precision specifically addresses the within-laboratory variability that naturally occurs over an extended period [3] [5].
This parameter is particularly crucial in the context of phase-appropriate validation because its evaluation intensity increases with development phase. In early phases, a basic assessment may suffice, while for commercial methods, rigorous intermediate precision testing becomes essential to ensure consistent performance throughout the method's lifecycle [22]. The relative standard deviation (RSD) calculated for intermediate precision experiments is typically larger than for repeatability due to the incorporation of more variable conditions [3].
Experimental Design and Methodology
Establishing intermediate precision requires a systematic experimental approach that incorporates multiple variables. A standard protocol involves two analysts independently preparing and analyzing replicate sample preparations using different HPLC systems, reagents, and on different days [5]. Each analyst should prepare their own standards and solutions to introduce realistic variability into the testing process.
The experimental design for intermediate precision testing typically includes:
- Multiple Analysts: Typically two analysts performing identical tests independently
- Different Instruments: Utilizing different equipment of the same type and capability
- Varied Time Intervals: Conducting tests on different days to account for environmental fluctuations
- Reagent Lots: Using different lots of critical reagents to assess lot-to-lot variability
- Statistical Analysis: Results are typically reported as % RSD, with comparison of mean values between analysts
For a precise content determination, both analysts might perform six measurements each, with the resulting data evaluated through standard deviation and relative standard deviation calculations [3]. The ICH Q2(R2) guideline encourages a matrix approach rather than studying each variation individually, providing a more practical assessment of combined variables [3].
Experimental Protocols for Intermediate Precision Assessment
Comprehensive Testing Protocol
A robust intermediate precision study follows a structured protocol that incorporates multiple variables to thoroughly assess method robustness. The following detailed methodology ensures comprehensive evaluation:
Sample Preparation:
- Prepare a minimum of six independent sample preparations at 100% of the test concentration
- Use identical reference standards but different stock solutions prepared independently by each analyst
- Employ different lots of critical reagents where applicable
- Utilize different volumetric glassware and instruments for preparation
Instrumental Analysis:
- Two qualified analysts perform the analysis on different days
- Each analyst uses a different HPLC system with equivalent specifications
- Different columns from the same manufacturer (different lots) should be used
- Mobile phases should be prepared independently by each analyst
- System suitability tests are performed before each analysis session
Data Collection and Analysis:
- Each analyst performs a minimum of six injections per sample preparation
- Record peak responses (area, height) and calculate % RSD for each set
- Compare mean values between analysts using statistical tests (e.g., Student's t-test)
- The acceptance criteria typically require % RSD ≤ 2.0% for assay methods, with not more than 2.0% difference between analysts' mean results
Documentation:
- Comprehensive documentation of all experimental conditions
- Record analyst identification, instrument IDs, reagent lot numbers, and dates
- Document any deviations from the established procedure
Data Interpretation and Acceptance Criteria
Interpretation of intermediate precision data focuses on both individual and combined variability measures. The following parameters should be evaluated:
- Precision within each analyst: % RSD for each analyst's results should meet pre-defined criteria based on method type and phase
- Comparison between analysts: The difference in mean values between analysts should be statistically insignificant
- Overall intermediate precision: The combined % RSD from all measurements should demonstrate acceptable variability
For early-phase methods (Phase 1-2), acceptance criteria may allow % RSD < 30% for relative potency measurements comparing Reference Standard and Test Sample on the same plate [22]. For late-phase and commercial methods, criteria tighten significantly, with typical acceptance criteria of % RSD ≤ 2.0% for assay methods [5].
Figure 2: Intermediate Precision Assessment Workflow. This diagram outlines the systematic process for evaluating intermediate precision, from initial study design through final assessment against acceptance criteria.
The Scientist's Toolkit: Essential Reagents and Materials
Successful implementation of phase-appropriate validation requires specific materials and reagents that ensure method reliability and regulatory compliance. The following table details essential components of the validation toolkit:
| Tool/Reagent | Function in Validation | Phase-Appropriate Considerations |
|---|---|---|
| Reference Standards (RS) | Serves as benchmark for method qualification and validation; ensures accuracy and precision [22] | Early phase: may use in-house standards; Late phase: must use qualified/compendial standards [22] |
| Master Cell Bank | Provides consistent biological material for cell-based bioassays; ensures assay reproducibility [22] | Early phase: research cell banks; Late phase: GMP-grade Master Cell Banks with full characterization [22] |
| Chromatographic Columns | Critical for separation efficiency; impacts specificity, resolution, and peak symmetry [5] | Multiple column lots required for robustness testing in later phases; early phases may use single lots [3] |
| System Suitability Standards | Verifies chromatographic system performance before sample analysis [5] | Requirements become more stringent through development; full system suitability tests required for GMP [5] |
| Mass Spectrometry Detectors | Provides unequivocal peak purity information and structural confirmation [5] | Early phases: may use single detection; Late phases: orthogonal detection (PDA/MS) recommended [5] |
Comparative Analysis: Validation Approaches Across Organization Types
The implementation of phase-appropriate validation strategies varies significantly between large pharmaceutical companies and emerging biotech sponsors, each facing distinct challenges and leveraging different advantages:
Large Pharmaceutical Companies:
- Typically maintain comprehensive in-house expertise across all validation disciplines
- Implement standardized validation protocols across multiple product lines
- Focus on long-term commercial objectives with robust validation supporting full lifecycle management
- Possess established relationships with regulators facilitating alignment on validation strategies
Emerging Biotech Sponsors:
- Often rely on external consultants and CMOs for validation expertise and execution [68]
- Face funding limitations that may create tension between ideal and feasible validation approaches [68]
- May prioritize development milestones that enhance valuation for partnership or acquisition over commercial readiness [68]
- Require highly customized CMC programs that balance regulatory requirements with resource constraints [68]
For emerging companies, the reliance on Contract Manufacturing Organizations (CMOs) introduces both advantages and challenges. While CMOs provide specialized expertise, sponsors must provide vigilant oversight to ensure CMC activities remain on the critical path and avoid delays in regulatory submissions [68].
Phase-appropriate validation represents both a regulatory necessity and a strategic advantage in pharmaceutical development. By aligning validation activities with specific development phases, organizations can optimize resources while maintaining regulatory compliance throughout the drug development lifecycle. The graded approach—progressing from fit-for-purpose methods to fully validated assays—ensures that analytical activities remain proportional to product development stage and associated risks.
The successful implementation of this framework requires deep analytical chemistry expertise coupled with a global regulatory perspective to generate high-quality results that meet evolving standards [67]. As the industry continues to evolve with emerging therapies including biologics, gene therapies, and personalized medicines, phase-appropriate validation principles will remain essential for efficiently advancing promising drug candidates while ensuring product quality, patient safety, and regulatory success.
Comparing Intermediate Precision with Ruggedness and Reproducibility
In the field of analytical chemistry, particularly within pharmaceutical quality control, demonstrating the reliability of analytical methods is paramount. Precision—the closeness of agreement between independent test results—is a critical component of method validation, but it is evaluated at different levels to account for various sources of variability [5]. Three key concepts that describe precision under different conditions are intermediate precision, ruggedness, and reproducibility. Understanding their distinctions is essential for researchers, scientists, and drug development professionals designing validation protocols, especially for studies investigating variability between analysts.
This guide objectively compares these concepts, providing structured data, experimental methodologies, and visual workflows to support their application in a structured research environment.
Defining the Concepts
Intermediate Precision
Intermediate precision (also known as within-laboratory precision) measures the variability in analytical results when the same method is applied within the same laboratory but under different typical operating conditions [19] [2]. It reflects the method's performance under the normal variations encountered in day-to-day laboratory operations.
- Purpose: To evaluate the method's consistency and reliability when subjected to changes in factors such as different analysts, different instruments, different days, and different reagent batches [19] [1].
- Context: Confined to a single laboratory [19].
- Importance: Ensures that a method will produce reliable results despite the minor, expected fluctuations in personnel, equipment, and materials within one lab [69].
Ruggedness
Ruggedness is the degree of reproducibility of test results obtained by the analysis of the same samples under a variety of normal, expected conditions, such as different laboratories, analysts, instruments, or reagent lots [5] [70]. The term is historically used in United States Pharmacopeia (USP) guidelines.
- Relationship to Other Terms: The concept of ruggedness is largely encompassed by the more modern and harmonized terms intermediate precision (for within-lab variations) and reproducibility (for between-lab variations) as defined by the International Council for Harmonisation (ICH) [5] [70]. Its use is declining in favor of these more specific terms.
Reproducibility
Reproducibility assesses the precision of an analytical method under reproducibility conditions, which involve different laboratories [19] [2]. It represents the highest level of variability testing, capturing differences in location, equipment, and staff.
- Purpose: To demonstrate that the method can produce consistent and reliable results across different laboratories, which is critical for global method transfer, collaborative studies, and regulatory submission [19].
- Context: Always involves multiple, independent laboratories [19].
Comparative Analysis
The table below provides a structured, side-by-side comparison of the key characteristics of intermediate precision, ruggedness, and reproducibility.
Table 1: Key Characteristics of Precision Measures
| Feature | Intermediate Precision | Ruggedness | Reproducibility |
|---|---|---|---|
| Testing Environment | Same laboratory [19] | Same or different laboratories [5] | Different laboratories [19] |
| Primary Goal | Assess method stability under normal intra-lab variations (e.g., different analysts, days, equipment) [19] [1] | Assess the degree of reproducibility under a variety of normal, expected conditions [5] | Assess method transferability and performance across different labs and setups globally [19] |
| Typical Variations Included | Analyst, day, instrument, reagent lots, columns [19] [69] | Can include all factors in intermediate precision and reproducibility (e.g., labs, analysts, instruments, reagent lots) [5] | Laboratory location, equipment, environmental conditions, different analysts [19] |
| Regulatory & Standard Context | Defined in ICH Q2(R1); common in routine method validation [19] [5] | Historically defined in USP <1225>; term is falling out of favor to harmonize with ICH terminology [5] [70] | Defined in ICH Q2(R1) and ISO standards; often part of inter-laboratory or collaborative studies [19] [2] |
| Scope of Variability | Within-laboratory variability over an extended period [2] [39] | A broader, less specific term for reproducibility under varied conditions [5] | Between-laboratory variability [2] |
The following diagram illustrates the hierarchical relationship between these concepts based on the scope of conditions under which precision is evaluated.
Experimental Protocols and Data Presentation
Protocol for Intermediate Precision Testing
A robust intermediate precision study is typically designed using a balanced, fully nested experiment where one primary factor (e.g., analyst) is varied at a time [71].
Detailed Methodology:
- Define the Scope: Select the analytical method (e.g., HPLC assay for a drug product) and the quantitative response (e.g., % assay) to be evaluated [71].
- Select Variables: Choose the factors to incorporate, commonly different analysts and different days [1] [69].
- Experimental Design:
- Analyst A prepares and analyzes six independent sample preparations from a homogeneous batch on Day 1.
- Analyst B prepares and analyzes six independent sample preparations from the same batch on Day 2 [69].
- Both analysts use the same method but different HPLC instruments from the same lab, and prepare their own standards and solvents [5].
- Data Analysis:
- Calculate the mean and standard deviation for each analyst's results.
- The combined data from all 12 results is used to calculate the intermediate precision, often expressed as the Relative Standard Deviation (RSD%) [1]. The standard deviation for intermediate precision can be derived from the square root of the sum of the variances within and between the conditions [1].
Table 2: Example Intermediate Precision Dataset for an HPLC Assay
| Analyst | Day | Sample Results (% Assay) | Mean (%) | Standard Deviation (SD) | RSD% |
|---|---|---|---|---|---|
| Analyst A | 1 | 98.7, 99.1, 98.5, 98.9, 99.2, 98.8 | 98.87 | 0.25 | 0.25 |
| Analyst B | 2 | 99.1, 98.5, 98.9, 99.3, 98.7, 99.0 | 98.92 | 0.27 | 0.27 |
| Combined (Intermediate Precision) | - | All 12 results | 98.90 | 0.26 | 0.26 |
Protocol for Reproducibility Testing
Reproducibility is assessed through a collaborative inter-laboratory study [19] [2].
Detailed Methodology:
- Study Design: A central coordinating laboratory provides identical, homogeneous test samples and a detailed analytical procedure to multiple participating laboratories (e.g., Lab 1 and Lab 2) [5].
- Execution:
- Each laboratory has its own analyst perform the analysis independently.
- Each analyst prepares their own standards and solutions and uses their local equipment [5].
- Each laboratory analyzes a predefined number of replicates (e.g., n=6) of the sample.
- Data Analysis:
Table 3: Example Reproducibility Data from an Inter-laboratory Study
| Laboratory | Sample Results (% Assay) | Mean (%) | Standard Deviation (SD) |
|---|---|---|---|
| Lab 1 | 98.7, 99.1, 98.5, 98.9, 99.2, 98.8 | 98.87 | 0.25 |
| Lab 2 | 99.3, 98.6, 99.5, 99.0, 98.4, 99.1 | 98.98 | 0.41 |
| Combined (Reproducibility) | All 12 results | 98.93 | 0.33 |
Ruggedness and its Link to Risk Assessment
As ruggedness testing aims to identify factors that significantly affect a method's precision, a modern approach incorporates a risk-based methodology [72].
Detailed Methodology:
- Risk Identification: Use prior knowledge from method development to identify factors (e.g., mobile phase pH, column lot, analyst technique) that are likely to have a significant effect on method performance [72] [70].
- Experimental Design: Employ efficient screening designs (e.g., Plackett-Burman or fractional factorial designs) to deliberately vary multiple parameters within a realistic range simultaneously [72] [70].
- Analysis: The results are used to identify "special cause" variability from specific factors and to apportion "common cause" variability to understand which factors contribute most to overall method variability. This helps in determining if the method's precision is fit-for-purpose and which parameters need to be tightly controlled in the written procedure [72].
The workflow for designing and executing a ruggedness study is as follows:
The Scientist's Toolkit: Essential Materials for Precision Studies
The table below lists key reagents, materials, and instruments critical for conducting precision studies in analytical method validation, along with their specific functions.
Table 4: Essential Research Reagent Solutions and Materials
| Item | Function / Purpose in Precision Studies |
|---|---|
| Chemical Reference Standards | Provides an accepted reference value to establish accuracy and serve as a benchmark for evaluating precision across different conditions [69]. |
| High-Purity Solvents & Reagents | Ensure consistency in mobile phase and sample preparation; different batches/lots are used in ruggedness and intermediate precision testing [2] [70]. |
| Chromatographic Columns (Different Lots) | Different column lots are intentionally varied during robustness/ruggedness testing and are a common factor in intermediate precision evaluation [70]. |
| Calibrated Analytical Instruments | Core to all testing; using different, properly qualified instruments within the same lab is a key variable for intermediate precision [5] [1]. |
| System Suitability Test Solutions | A standardized mixture used to verify that the chromatographic system is adequate for the analysis before precision data is collected, ensuring day-to-day and instrument-to-instrument validity [5]. |
Within the framework of analytical method validation, intermediate precision, ruggedness, and reproducibility represent a spectrum of precision evaluation, from within-laboratory monitoring to between-laboratory standardization.
- Intermediate precision is a fundamental, non-negotiable component of method validation for any laboratory, ensuring results are reliable despite internal variations.
- Reproducibility is the most stringent test, critical for methods intended for transfer across global sites or for standardization in pharmacopoeias.
- Ruggedness, while a historically important concept, is effectively addressed through well-designed intermediate precision and robustness studies, with a modern, risk-based approach being the most efficient.
For researchers focused on intermediate precision testing between analysts, a carefully designed nested experiment, controlling for other variables, will yield the most meaningful data on which a method's real-world reliability within a single laboratory can be confidently established.
Leveraging Precision Data for Regulatory Submissions and Inspections
In the stringent world of pharmaceutical development, the reliability of analytical data is a critical pillar for successful regulatory submissions and inspections. Data precision, particularly intermediate precision, demonstrates that an analytical method can produce consistent results under the varying conditions typical of any laboratory's day-to-day operations. This consistency builds regulatory confidence that submitted data is trustworthy and that manufacturing processes are well-controlled, directly supporting inspection readiness and product approval [5] [12].
Precision in Analytical Method Validation: A Comparative Framework
Precision in analytical method validation is evaluated at multiple levels to ensure data reliability. The following table compares the key types of precision, their measurement environments, and their distinct roles in demonstrating data robustness.
| Precision Type | Testing Environment | Key Variables Assessed | Primary Goal |
|---|---|---|---|
| Repeatability | Same lab, identical conditions [19] [12] | Short time interval, same analyst, same equipment [5] [12] | Confirm method stability under ideal, unchanged conditions (intra-assay precision) [5]. |
| Intermediate Precision | Same lab, different normal conditions [19] [12] | Different days, different analysts, different instruments [5] [12] | Evaluate method's reliability under expected, within-lab variations (e.g., different shifts) [19]. |
| Reproducibility | Different laboratories [19] [12] | Different locations, equipment, and analysts [5] [12] | Assess method transferability and consistency across global sites (e.g., collaborative trials) [19]. |
Experimental Protocol for Determining Intermediate Precision
A robust intermediate precision study is designed to intentionally incorporate routine laboratory variables. Adopting a risk-based approach helps focus resources on the most critical factors that could affect the analytical procedure [12].
Study Design and Execution
A full or partial factorial design is recommended, where critical factors identified during method development are varied [12]. A typical protocol involves:
- Analysts: Two different analysts perform the analysis [12].
- Instruments: Two different High-Performance Liquid Chromatography (HPLC) systems are used [12].
- Time: Analyses are conducted on different days [12].
- Concentrations: The study should evaluate at least three concentration levels (e.g., 50%, 100%, and 150%) covering the specified method range (e.g., 80% to 120%) [12].
Each analyst independently prepares their own standards and sample solutions and uses a different HPLC system for the analysis [5].
Data Analysis and Statistical Evaluation
The resulting data, such as the Area Under the Curve (AUC), is analyzed to determine variability. While the Relative Standard Deviation (RSD) is a common metric, Analysis of Variance (ANOVA) is a more powerful statistical tool for intermediate precision assessment [12].
- Limitations of RSD: RSD provides an overall measure of variability but can obscure specific systematic errors. For example, a satisfactory overall RSD might hide the fact that one HPLC system consistently produces higher results than others [12].
- Advantages of ANOVA: A one-way ANOVA can determine if the differences between the means (e.g., the average results from Analyst 1/Day 1/System 1 vs. Analyst 2/Day 2/System 2) are statistically significant. If ANOVA indicates a significant difference, a post-hoc test like Tukey's test can identify which specific variable (e.g., a particular analyst or instrument) is the source of the variation [12].
This deeper analysis provides actionable insights, such as identifying an instrument that requires recalibration, which a simple RSD calculation would miss [12].
The Link to Regulatory Success and Inspection Readiness
In 2025, the FDA's inspection strategy has become more targeted, data-driven, and less forgiving of systemic compliance gaps [73]. Data integrity is a primary focus, with regulators emphasizing the ALCOA+ principles (Attributable, Legible, Contemporaneous, Original, Accurate, Complete, Consistent, Enduring, Available) [74] [75].
Building Confidence in Submissions
Intermediate precision directly demonstrates that your data is Accurate and Consistent (key ALCOA+ principles). Regulatory bodies like the FDA reject data they cannot trust [76]. A well-executed intermediate precision study shows that your method is under control, making the data it generates reliable evidence for decision-making on product safety and efficacy [75]. This is especially critical when using third-party testing labs, as sponsors are ultimately responsible for the accuracy of all data in their submissions [73] [76].
Navigating FDA Inspections
During inspections, investigators rigorously review data quality and integrity [73]. They are increasingly using post-market signals, like customer complaints, to trace problems back to potential weaknesses in design controls and process validation [73]. A robust analytical method, backed by a thorough intermediate precision study, serves as a key line of defense. It demonstrates that your quality system is proactive and that your product's critical quality attributes can be consistently and reliably measured, even with normal laboratory variations [77] [78].
The Scientist's Toolkit: Essential Research Reagent Solutions
The following materials and solutions are fundamental for conducting rigorous intermediate precision studies.
| Item | Function in Precision Studies |
|---|---|
| Reference Standard | A highly characterized substance used to prepare solutions of known concentration, serving as the baseline for accuracy and precision measurements. |
| Chromatographic Column | The heart of the HPLC system; its performance and consistency across different columns and lots is a critical variable in intermediate precision. |
| HPLC-Grade Solvents & Reagents | High-purity mobile phase components ensure consistent chromatographic behavior and prevent system variability caused by impurities. |
| System Suitability Test (SST) Solutions | A standardized mixture used to verify that the chromatographic system is operating within specified parameters before the analysis is run. |
| Certified Reference Material (CRM) | For some assays, a CRM from a national metrology institute may be used to provide an ultimate traceable standard for method validation. |
Note: The specific reagents and materials will vary based on the analytical method and the molecule being tested. The items above represent common critical components.
Conclusion
Intermediate precision testing between analysts is not merely a regulatory checkbox but a fundamental practice that ensures the reliability and robustness of analytical methods in real-world laboratory settings. A well-executed study provides critical data on method consistency, directly impacting product quality and patient safety. By integrating foundational knowledge, rigorous methodology, proactive troubleshooting, and strict adherence to validation guidelines, laboratories can significantly reduce variability, enhance data integrity, and facilitate successful method transfers. As regulatory expectations evolve and analytical technologies advance, a deep understanding of intermediate precision will continue to be a cornerstone of successful drug development and quality control, ultimately supporting the delivery of safe and effective therapeutics to market.
References
- 1. Understanding Intermediate Precision Definition - A How ... [https://altabrisagroup.com/intermediate-precision-definition/]
- 2. 4.1. Repeatability, intermediate precision and reproducibility [https://sisu.ut.ee/lcms_method_validation/41-precision-trueness-accuracy/]
- 3. What is Intermediate Precision in Analytical Method ... [https://www.linkedin.com/pulse/what-intermediate-precision-analytical-method-praveen-sharma-rejoc]
- 4. An analyst's guide to precision - Analytical ... Methods [https://pubs.rsc.org/en/content/articlehtml/2015/ay/c5ay90071a]
- 5. Analytical Method Validation: Back to Basics, Part II [https://www.chromatographyonline.com/view/analytical-method-validation-back-basics-part-ii]
- 6. in Precision Analytical Chemistry [https://www.numberanalytics.com/blog/precision-in-analytical-chemistry]
- 7. Precision [https://www.geoanalyst.org/precision/]
- 8. What is precision? - Lösungsfabrik [https://mpl.loesungsfabrik.de/en/english-blog/method-validation/what-is-precision]
- 9. Establishing Acceptance Criteria for Analytical Methods [https://www.biopharminternational.com/view/establishing-acceptance-criteria-analytical-methods]
- 10. Analytical Methods: A Statistical Perspective on the ICH ... [https://www.biopharminternational.com/view/analytical-methods-statistical-perspective-ich-q2a-and-q2b-guidelines-validation-analytical-methods]
- 11. Data Points: Fundamental Measurement Concepts [https://www.astm.org/news/measurement-concepts-mj23]
- 12. a robust statistical tool for determining intermediate ... [https://www.pharmabiz.com/PrintArticle.aspx?aid=175226&sid=9]
- 13. Intermediate precision - Lösungsfabrik [https://mpl.loesungsfabrik.de/en/english-blog/method-validation/intermediate-precision]
- 14. Defining Biological Variability, Analytical Precision and ... [https://pmc.ncbi.nlm.nih.gov/articles/PMC12086329/]
- 15. A Review: Comparison of ICH Guidelines on Analytical ... [https://www.linkedin.com/pulse/review-comparison-ich-guidelines-analytical-method-usp-shaikh-wzfjc]
- 16. Risk-Based Intermediate Precision Studies for Analytical ... [https://www.pharmtech.com/view/risk-based-intermediate-precision-studies-analytical-procedure-validation]
- 17. Formal Method Validation [https://www.biopharminternational.com/view/formal-method-validation]
- 18. Some good validation practices for analytical procedures [https://www.a3p.org/en/bonnes-pratiques-validation/]
- 19. Difference Between Reproducibility And Intermediate ... [https://pharmaguru.co/difference-between-reproducibility-and-intermediate-precision-in-analytical-method-validation/]
- 20. Accuracy and precision [https://en.wikipedia.org/wiki/Accuracy_and_precision]
- 21. Key Differences Between Precision and Accuracy Explained [https://sixsigmadsi.com/precision-and-accuracy/]
- 22. Selecting Bioanalytical Assays for FDA Approved Clinical ... [https://www.marinbio.com/company/selecting-bioanalytical-assays-fda-clinical-trials-commercialization/]
- 23. Intermediate precision study of the CE-SDS assay on ... [https://sciex.com/tech-notes/biopharma/intermediate-precision-study-of-ce-sds-assay-on-biophase8800-with-native-fluorescence-detection]
- 24. A Guide for Testing Biopharmaceuticals Part 1: General ... [https://www.biopharminternational.com/view/guide-testing-biopharmaceuticals-part-1-general-strategies-validation-extensions]
- 25. What are the differences and key steps in Analytical ... [https://resources.eirgenix.com/blog/method_dev_qual_validation]
- 26. Relative Standard Deviation: A Complete Guide to Process ... [https://www.6sigma.us/six-sigma-in-focus/relative-standard-deviation/]
- 27. Setting Acceptance Criteria for a Technology Transfer study [https://prismtc.co.uk/resources/blogs-and-articles/setting-acceptance-criteria-for-a-technology-transfer-study]
- 28. The Comparison of Methods Experiment [https://www.westgard.com/lessons/basic-method-validation/lesson23.html]
- 29. Statistical analysis in method comparison studies part one [https://acutecaretesting.org/en/articles/statistical-analysis-in-method-comparison-studies-part-one]
- 30. Audit Readiness - Guide for What to Do (& What NOT to Do) [https://linfordco.com/blog/audit-readiness-tips/]
- 31. ICH Guidelines for Analytical Method Validation Explained [https://amsbiopharma.com/ich-guidelines-analytical-method/]
- 32. ICH and FDA Guidelines for Analytical Method Validation [https://www.labmanager.com/ich-and-fda-guidelines-for-analytical-method-validation-34252]
- 33. Calibration Of Analytical Balances And Performance Checks [https://gmpinsiders.com/calibration-analytical-balances-performance-checks/]
- 34. The Red Component of Analytical Chemistry: Assessing ... [https://www.chromatographyonline.com/view/the-red-component-of-analytical-chemistry-assessing-the-performance-of-analytical-methods]
- 35. Red analytical performance index (RAPI) and software [https://pubs.rsc.org/en/content/articlehtml/2025/gc/d4gc05298f]
- 36. A practical approach to estimate analytical method ... [https://www.sciencedirect.com/science/article/pii/S0731708524003844]
- 37. Precision Balance Calibration for Labs and Industry [https://techmaster.us/precision-balance-calibration-service/]
- 38. Root Cause Analysis (RCA) Training [https://www.6sigma.us/root-cause-analysis-methods/]
- 39. Intermediate precision - Conditions of measurement [https://analyse-it.com/docs/user-guide/measurement-systems-analysis/precision/intermediate-precision]
- 40. Approaches to Root Cause Analysis [http://www.ed.gov/teaching-and-administration/lead-and-manage-my-school/state-support-network/ssn-resources/approaches-to-root-cause-analysis]
- 41. Root Cause Analysis: Definition, Examples & Methods [https://www.tableau.com/analytics/what-is-root-cause-analysis]
- 42. 5 Root-Cause Analysis Methods Compared [https://www.sqcentre.com/blog/5-root-cause-analysis-methods-compared-a-comprehensive-guide/]
- 43. 7 Powerful Root Cause Analysis Tools and Techniques [https://reliability.com/resources/articles/7-root-cause-analysis-tools/]
- 44. Root Cause Analysis Template: Find Effective Solutions ... [https://asana.com/resources/root-cause-analysis-template]
- 45. Presentation of Quantitative Data [https://ihatepsm.com/blog/presentation-quantitative-data]
- 46. Presenting Quantitative Data Graphically [https://courses.lumenlearning.com/waymakermath4libarts/chapter/presenting-quantitative-data-graphically/]
- 47. Potency Assay Variability Estimation in Practice - PMC [https://pmc.ncbi.nlm.nih.gov/articles/PMC11788244/]
- 48. Advancing Potency Assay Development for ... [https://pubmed.ncbi.nlm.nih.gov/40257954/]
- 49. Validation of a potency assay for CD34 + cell based therapy [https://www.nature.com/articles/s41598-025-14828-w]
- 50. Applying analytical method validation to cell-based ... [https://www.sterlingpharmasolutions.com/knowledge-hub/adc/cell-based-potency-assays/]
- 51. Development and Validation of Cell-Based Potency Assays ... [https://www.marinbio.com/development-and-validation-of-cell-based-potency-assays-for-aav-therapies-insights-from-a-commercial-aav-vector-study/]
- 52. Quantitative measurement of cytosolic penetration using ... [https://pmc.ncbi.nlm.nih.gov/articles/PMC7872221/]
- 53. Quantitative measurement of cytosolic and nuclear ... [https://pmc.ncbi.nlm.nih.gov/articles/PMC9252293/]
- 54. How to Optimize Your CAPA Escalation Process [https://blog.medpoint.com/how-to-optimize-your-capa-escalation-process]
- 55. Complete Guide to Corrective and Preventive Action (CAPA) [https://www.1factory.com/quality-academy/guide-capa.html]
- 56. CAPA Corrective and Preventive Action Guide | Process ... [https://www.bprhub.com/blogs/what-is-capa]
- 57. Optimize CAPA Process: Prevent FDA Recalls in Life ... [https://www.mastercontrol.com/gxp-lifeline/optimize-capa-process-for-fda-recall-management-in-life-sciences/]
- 58. A Few Quick Tips for CAPA System Success in 2025 [https://insider.thefdagroup.com/p/a-few-quick-capa-tips]
- 59. Proven Strategies for Minimizing Variability in Manufacturing [https://spc-software.us/proven-strategies-for-minimizing-variability-in-manufacturing]
- 60. How to Reduce Variation in Process Improvement Effectively [https://insight7.io/how-to-reduce-variation-in-process-improvement-effectively/]
- 61. Presenting data in tables and charts - PMC [https://pmc.ncbi.nlm.nih.gov/articles/PMC4008059/]
- 62. ICH Q2(R1) Validation of Analytical Procedures [https://www.gmp-compliance.org/guidelines/gmp-guideline/ich-q2r1-validation-of-analytical-procedures-text-and-methodology]
- 63. New ICH Q2 guideline: A closer look at study set-up and ... [https://www.linkedin.com/pulse/new-ich-q2-guideline-closer-look-study-set-up-m5kde]
- 64. USP Reference Standards [https://www.usp.org/reference-standards]
- 65. Analytical Method Transfer: Best Practices and Guidelines [https://www.labmanager.com/analytical-method-transfer-best-practices-and-guidelines-34130]
- 66. Cross-validation of pharmacokinetic assays post-ICH M10 is ... [https://pmc.ncbi.nlm.nih.gov/articles/PMC11749382/]
- 67. Making sense of phase ... - Sterling Pharma Solutions appropriate [https://www.sterlingpharmasolutions.com/knowledge-hub/analytical-services/phase-appropriate-analytical-methods/]
- 68. Developing a Phase CMC Program Appropriate [https://www.news-medical.net/whitepaper/20200722/Developing-a-Phase-Appropriate-CMC-Program.aspx]
- 69. Analytical Method Validation for Quality Assurance and ... [https://www.americanpharmaceuticalreview.com/Featured-Articles/569734-Analytical-Method-Validation-for-Quality-Assurance-and-Process-Validation-Professionals/]
- 70. Method Validation and Robustness [https://www.chromatographyonline.com/view/method-validation-and-robustness]
- 71. Reproducibility: What is it and How to Calculate it [https://www.isobudgets.com/reproducibility/]
- 72. Method ruggedness studies incorporating a risk based ... [https://pubmed.ncbi.nlm.nih.gov/21889624/]
- 73. FDA medical device inspections in 2025: What we're ... [https://www.hoganlovells.com/en/publications/fda-medical-device-inspections-in-2025]
- 74. Data Integrity in Regulatory Submissions: Best Practices for ... [https://aayutechnologies.com/blog/data-integrity-in-regulatory-submissions/]
- 75. The Role of Data Integrity in Regulatory Submission Success [https://www.freyrsolutions.com/blog/the-role-of-data-integrity-in-regulatory-submission-success]
- 76. FDA/Food, Drug & Device Advisory | Addressing Data ... [https://www.alston.com/en/insights/publications/2025/04/data-integrity-challenges-medical-devices]
- 77. FDA Inspection Readiness in 2025: A Complete Guide & ... [https://www.thefdagroup.com/blog/how-to-prepare-for-an-fda-inspection]
- 78. Clinical Trial Compliance: Preparing for FDA Inspection ... [https://www.srainternational.org/blogs/srai-news/2025/10/09/clinical-trial-compliance-fda-inspection-readiness]