LC-MS in Pharmaceutical Analysis: Essential Workflows, Advanced Applications, and Future Directions
This article provides a comprehensive overview of the indispensable role of Liquid Chromatography-Mass Spectrometry (LC-MS) in modern pharmaceutical analysis.
LC-MS in Pharmaceutical Analysis: Essential Workflows, Advanced Applications, and Future Directions
Abstract
This article provides a comprehensive overview of the indispensable role of Liquid Chromatography-Mass Spectrometry (LC-MS) in modern pharmaceutical analysis. Tailored for researchers, scientists, and drug development professionals, it explores the technique's foundational principles and historical development, details its critical applications from drug discovery to bioanalysis, and offers practical strategies for troubleshooting and optimizing sensitivity and robustness. Furthermore, it examines validation frameworks and compares advanced instrumentation, highlighting how innovations like multi-dimensional LC-MS and AI integration are shaping the future of drug development and precision medicine.
The Indispensable Role of LC-MS: From Core Principles to Pharmaceutical Revolution
Liquid chromatography–mass spectrometry (LC-MS) stands as a testament to the tremendous advancements in analytical methodologies, revolutionizing pharmaceutical analysis and life sciences research [1]. This powerful technique merges the superior physical separation capabilities of liquid chromatography with the exceptional mass analysis power of mass spectrometry, providing researchers with an unparalleled ability to study intricate mixtures, including pharmaceuticals, proteins, and biological matrices [1]. The historical development of LC-MS is marked by groundbreaking innovations, critical turning points, and its enduring impact on scientific discovery, particularly within pharmaceutical analysis workflows where it has become indispensable for drug discovery and development [2] [1] [3]. This application note traces the evolution of LC-MS from its conceptual origins to its current status as a cornerstone technology in pharmaceutical research, providing detailed experimental protocols and analytical frameworks for its application in modern drug development pipelines.
Historical Timeline and Instrumental Evolution
The development of LC-MS has profoundly impacted biological and analytical sciences, ushering in a new era of advanced analytical methodologies [1]. The integration of LC-MS was first conceptualized in the mid-20th century as the analytical chemistry community sought to develop a versatile tool for complex sample analysis [1]. Early breakthroughs in both fields laid the foundation for the development of LC-MS, merging the separation capabilities of LC with the structural elucidation power of MS.
Table 1: Key Historical Milestones in LC-MS Development
| Year | Instrument/Innovation | Significance | Impact on Pharmaceutical Analysis |
|---|---|---|---|
| 1970s | First Commercial LC-MS System | First combined LC-MS instrumentation utilizing quadrupole mass spectrometers [1] | Enabled real-time, accurate analysis of pharmaceutical compounds |
| 1989 | Thermospray LC-MS (Shimadzu LCMS-QP1000) | First thermospray-based interface became most popular LC-MS interface in 1990s [4] | Improved analysis of non-volatile and thermally labile pharmaceutical compounds |
| 2000 | LCMS-2010 | 10x higher sensitivity than earlier models through redesigned lens and spray systems [4] | Enhanced detection limits for trace drug metabolites and impurities |
| 2004 | LCMS-IT-TOF | World's first hybrid IT-TOF enabling structural analysis with MSn capabilities [4] | Advanced structural elucidation of drug metabolites and degradation products |
| 2010 | Triple Quadrupole Systems (LCMS-8030) | Japan's first triple quadrupole MS with fast polarity switching and MRM acquisition [4] | Revolutionized multi-component quantitative analysis in drug metabolism studies |
| 2013+ | Ultra-Fast MS Technologies | Game-changing sensitivity and speed for quantitative/qualitative analysis simultaneously [4] | Accelerated high-throughput screening in drug discovery pipelines |
| 2020s | Advanced Hybrid Systems (Orbitrap, TIMS) | Unprecedented resolution, sensitivity, and structural capabilities [5] [6] | Enabled characterization of complex biopharmaceuticals and proteoforms |
Throughout the 1980s and 1990s, the technology continued to evolve with the introduction of new ionization techniques that dramatically expanded LC-MS capabilities. Among the most important were electrospray ionization (ESI) and atmospheric pressure chemical ionization (APCI), both of which significantly enhanced sensitivity and widened the range of analytes that could be detected [1]. These techniques enabled the analysis of large, polar biomolecules such as proteins, peptides, and nucleic acids, marking a turning point for biomolecular research and pharmaceutical applications [1].
The subsequent development of tandem mass spectrometry (MS/MS) further enabled deeper structural analysis of molecules, facilitating the study of metabolites, proteins, and pharmaceuticals with greater precision [1]. To further improve sensitivity and metabolite quantification, advanced applications such as twin derivatization-based LC-MS (TD-LC-MS) and chemical isotope labelling (CIL)-based LC-tandem mass spectrometry (MS/MS) were introduced [1].
A significant revolution in LC-MS technology has been the dramatic increase in sensitivity and resolution [1]. Improved ion optics, mass analyzers, and detectors have enabled LC-MS systems to detect analytes at picogram and femtogram levels, facilitating trace molecule identification in complex matrices. This increased sensitivity has significantly benefited various pharmaceutical applications, including drug metabolite analysis and impurity profiling [1] [3].
Current Applications in Pharmaceutical Analysis
Small Molecule vs. Biopharmaceutical Analysis
LC-MS has become indispensable across the entire drug development continuum, though its application differs significantly between small molecule pharmaceuticals and biopharmaceuticals [2]. In small molecule pharmaceutical analysis, recent advancements have focused on simplifying analytical procedures through innovations including the reduction or elimination of sample preparation steps, simplified control and settings for MS devices, shortened analysis times, and the automation of analytical and data processing workflows [2]. High-throughput methods such as ultra-high-performance liquid chromatography (UHPLC) and core-shell particle separations are becoming essential to meet the growing demand for speed and efficiency throughout the drug development cycle [2].
In contrast, MS analysis plays a bigger role in the analysis of large-molecule drugs and biopharmaceuticals compared to small molecule drugs [2]. The biopharmaceutical industry is growing rapidly, especially in oncology, stemming from numerous innovations that have led to the creation of new drug modalities including gene and cell therapies, RNA drugs, and complex biologics [7]. However, the analytical development of these products presents unique challenges. Quantifying the products and components of conjugated molecular structures is vital for guiding therapeutic development for preclinical and clinical research, given their complexity [7].
Critical Workflows in Drug Development
Table 2: Key LC-MS Applications in Pharmaceutical Development Workflows
| Application Area | LC-MS Technique | Key Measurements | Impact on Drug Development |
|---|---|---|---|
| DMPK/ADME | Triple Quadrupole LC-MS/MS (MRM) | Metabolic stability, metabolite profiling, drug-drug interactions [3] | Prediction of human pharmacokinetics and toxicity risks |
| Therapeutic Drug Monitoring | High-throughput LC-MS/MS | Quantification of drugs and metabolites in biological matrices [8] | Personalized dosing regimens for improved efficacy/safety |
| Biopharmaceutical Characterization | High-resolution MS (Q-TOF, Orbitrap) | Amino acid sequence, post-translational modifications, higher-order structure [7] | Ensuring product quality, stability, and biological activity |
| Impurity and Degradant Profiling | LC-MS/MS with HRAM | Structural identification of process-related and degradation impurities | Meeting regulatory requirements for product safety |
| Biomarker Analysis | Multiplexed LC-MS/MS | Quantification of endogenous biomarkers in biological samples [1] | Patient stratification and pharmacodynamic response assessment |
Drug Metabolism and Pharmacokinetics (DMPK) represents a major area of use for LC-MS methods [3]. The biotransformation or metabolism of a drug candidate is a critical component to understanding the safety and dosing strategy for animal or human studies. LC-MS-based assays to evaluate absorption, distribution, metabolism, and excretion (ADME) properties can include in vitro metabolic stability, metabolite profiling and identification (in vitro and in vivo), prediction of drug-drug interactions, and monitoring circulating metabolites during human clinical studies [3]. These data assist drug developers with evaluating potential toxicity risks such as the formation of harmful metabolites. In combination with pharmacokinetic assays to measure exact drug concentrations in samples, metabolism assays also help predict the overall clearance and half-life [3].
For accurately quantifying biotherapeutics, target analytes (such as a protein or peptide) are selectively captured from complex samples using hybrid liquid chromatography-tandem mass spectrometry (LC-MS/MS) techniques [7]. This approach resembles conventional ligand binding assays (LBA), where hybrid LC-MS/MS only requires one antibody compared to traditional LBAs requiring two antibodies [7]. The two main techniques employed in conventional bioanalytical protocols for small molecules and biologics are LBA and LC-MS, though multiple LBA/LC-MS and hybrid LBA/LC-MS techniques have been used to measure complex large molecules [7].
Experimental Protocols
Protocol 1: LC-MS Method for Small Molecule Drug Metabolism Studies
This protocol describes a validated approach for assessing metabolic stability of small molecule drug candidates using LC-MS/MS, critical for candidate selection in early drug discovery.
Materials and Reagents
- Test compound dissolved in DMSO (10 mM stock solution)
- Human or rat liver microsomes (0.5 mg/mL protein concentration)
- NADPH regenerating system (Solution A: NADP+, Solution B: Glucose-6-phosphate, Solution C: Glucose-6-phosphate dehydrogenase)
- Magnesium chloride (0.1 M solution in buffer)
- Phosphate buffer (0.1 M, pH 7.4)
- Acetonitrile and methanol (LC-MS grade)
- Formic acid (LC-MS grade)
- Control compounds (e.g., Verapamil, Testosterone)
Instrumentation
- UHPLC system with binary pump, autosampler, and column compartment
- Triple quadrupole mass spectrometer with ESI source
- Analytical column: C18 reversed-phase column (100 × 2.1 mm, 1.7-1.8 μm)
- Positive and negative quality control samples
Procedure
- Incubation Preparation: Prepare incubation mixtures containing 0.1 M phosphate buffer (pH 7.4), liver microsomes (0.5 mg/mL final concentration), and test compound (1 μM final concentration). Pre-incubate for 5 minutes at 37°C.
- Reaction Initiation: Start reactions by adding NADPH regenerating system (1 mM NADP+, 10 mM glucose-6-phosphate, 1 U/mL glucose-6-phosphate dehydrogenase).
- Time Course Sampling: Withdraw aliquots at predetermined time points (0, 5, 15, 30, 45, 60 minutes) and quench with ice-cold acetonitrile containing internal standard.
- Sample Processing: Centrifuge quenched samples at 14,000 × g for 10 minutes to precipitate proteins. Transfer supernatant to LC-MS vials.
- LC-MS Analysis:
- Chromatography: Inject 5-10 μL onto UHPLC system. Use gradient elution with mobile phase A (0.1% formic acid in water) and B (0.1% formic acid in acetonitrile) at flow rate of 0.4 mL/min. Employ a linear gradient from 5% B to 95% B over 3.5 minutes, hold for 0.5 minutes, then re-equilibrate.
- Mass Spectrometry: Operate MS in multiple reaction monitoring (MRM) mode with ESI positive/negative ionization. Optimize compound-dependent parameters (DP, CE) for each analyte.
- Data Analysis: Plot natural logarithm of peak area ratio (analyte/IS) versus time. Calculate half-life (t₁/₂) and intrinsic clearance (Clᵢₙₜ) using standard equations.
Protocol 2: LC-MS Method for Biopharmaceutical Characterization
This protocol outlines an approach for characterizing monoclonal antibodies and other protein therapeutics using high-resolution LC-MS.
Materials and Reagents
- Intact protein or digested peptide samples
- Dithiothreitol (DTT) or tris(2-carboxyethyl)phosphine (TCEP)
- Iodoacetamide
- Trypsin or other proteolytic enzymes (e.g., Lys-C)
- Formic acid (LC-MS grade)
- Water and acetonitrile (LC-MS grade)
- Ammonium bicarbonate or other digestion buffer components
Instrumentation
- UHPLC system capable of nano-flow or capillary-flow rates
- High-resolution mass spectrometer (Q-TOF, Orbitrap, or timsTOF)
- reversed-phase column (nano-flow: 75 μm × 15 cm, 2 μm; capillary: 1.0 mm × 100 mm, 3.5 μm)
- Electrospray ionization source optimized for high molecular weight species
Procedure
- Sample Preparation (Intact Mass Analysis):
- Desalt protein using spin columns or dialysis into 0.1% formic acid.
- For reduced analysis, incubate with 10 mM DTT at 56°C for 30 minutes.
- For denatured analysis, use organic solvent or chaotropic agents.
Sample Preparation (Peptide Mapping):
- Denature protein in 6 M guanidine hydrochloride or 8 M urea.
- Reduce with 5 mM DTT at 56°C for 30 minutes.
- Alkylate with 15 mM iodoacetamide at room temperature for 30 minutes in the dark.
- Digest with trypsin (1:20 enzyme:substrate ratio) at 37°C for 4-16 hours.
- Quench with formic acid (1% final concentration).
LC-MS Analysis (Intact Protein):
- Chromatography: Use reversed-phase column with shallow gradient from 20% B to 50% B over 15-30 minutes (A: 0.1% FA in water; B: 0.1% FA in acetonitrile).
- Mass Spectrometry: Acquire data in full scan mode with m/z range 600-4000. Use deconvolution software to reconstruct intact mass.
LC-MS Analysis (Peptide Mapping):
- Chromatography: Inject digested peptides onto column equilibrated in 2% B. Apply gradient from 2% B to 35% B over 60 minutes, then to 80% B in 5 minutes.
- Mass Spectrometry: Acquire data in data-dependent acquisition (DDA) mode with survey scans at high resolution (60,000-120,000) and MS/MS scans for top N ions. Use both CID and HCD fragmentation if available.
Data Analysis:
- Process raw data using appropriate software for database searching, post-translational modification identification, and quantification.
- For intact analysis, use deconvolution algorithms to determine molecular weight.
- For peptide mapping, search data against protein sequence to confirm identity and modifications.
Essential Research Tools and Reagent Solutions
Table 3: Key Research Reagent Solutions for LC-MS Pharmaceutical Analysis
| Reagent/Category | Function/Application | Examples/Specifications |
|---|---|---|
| Chromatography Columns | Compound separation based on chemical properties | C18 reversed-phase (1.7-2μm particles); Ion-exchange; HILIC; Size exclusion |
| Ionization Sources | Sample ionization for mass analysis | Electrospray Ionization (ESI); Atmospheric Pressure Chemical Ionization (APCI) |
| Mass Analyzers | Separation and detection of ions by mass-to-charge ratio | Triple Quadrupole (QQQ) for quantitation; Time-of-Flight (TOF) for accurate mass; Orbitrap for high resolution; Ion Mobility for added separation |
| Sample Preparation Kits | Automated sample preparation for specific applications | Immunosuppressant TDM kits; Phospholipid removal plates; Solid-phase extraction cartridges |
| Internal Standards | Calibration and quantification reference | Stable isotope-labeled analogs of analytes; Chemical analogues for retention time monitoring |
| Mobile Phase Additives | Modify chromatography and enhance ionization | Formic acid; Ammonium acetate; Ammonium hydroxide; Trifluoroacetic acid (volatile modifiers) |
| Quality Controls | Method validation and performance verification | Certified reference materials; Spiked biological matrices; System suitability standards |
Workflow Visualization
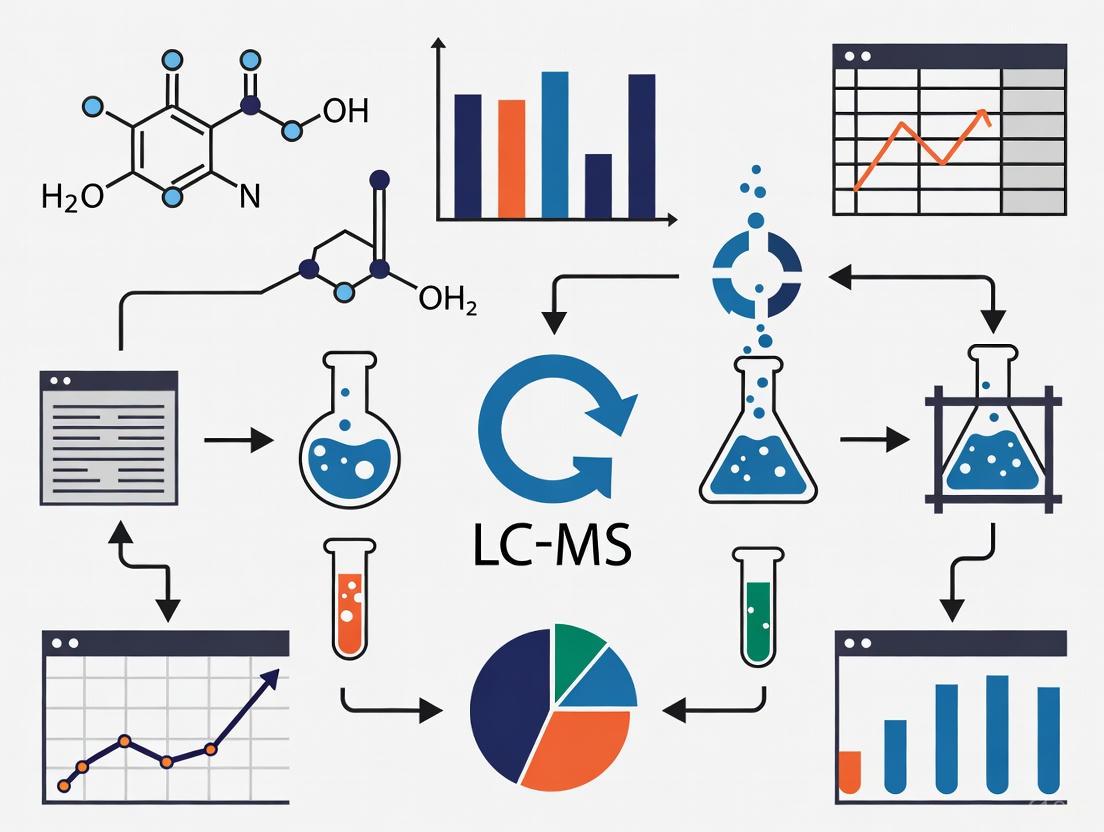
LC-MS Pharmaceutical Analysis Workflow
LC-MS System Components and Evolution
The evolution of LC-MS from its conceptual origins to its current status as a cornerstone technology represents one of the most significant advancements in analytical science. Modern LC-MS systems continue to evolve with increased sensitivity, resolution, and throughput becoming standard expectations [1]. The current market expansion, projected to reach $12.82 billion by 2029 with a compound annual growth rate of 13.5%, reflects the increasing reliance on this technology across pharmaceutical and biotechnology sectors [9].
Recent innovations showcased at ASMS 2025 highlight the continuing evolution of LC-MS technology. Bruker's introduction of the timsOmni mass spectrometer enables fast, high-sensitivity sequencing and structural analysis of functional proteoforms with unprecedented depth, addressing the critical challenge of annotation confidence in metabolomics [6]. Similarly, Thermo Fisher Scientific's Orbitrap Astral Zoom and Orbitrap Excedion Pro platforms offer enhanced speed, sensitivity, and flexibility for deeper quantitation and biomarker discovery [6]. Agilent's InfinityLab Pro iQ Series represents the trend toward intelligent, sustainable LC-MS systems with smaller footprints without performance sacrifices [6].
The integration of artificial intelligence and machine learning represents another frontier in LC-MS development [2]. Ongoing development of data analysis tools in biopharmaceutical analysis MS methods is needed to fully realize the potential of MS in this space [2]. Key computational tools include software for deconvolution, denoising, alignment, integration, quantitative analysis, and omics data processing. Although some work has been done to improve these tools for pharmaceutical analysis, new tools such as specific algorithms, machine learning, and artificial intelligence-based tools remain a work in progress [2]. These tools are expected to enhance high-throughput data processing, improve accuracy, and facilitate better data interpretation, ultimately contributing to the development of safer and more effective biopharmaceuticals [2].
The growing role of LC-MS in personalized medicine further demonstrates its evolving importance. In 2024, 72% of the more than 2.2 million personalized treatment tests performed worldwide utilized LC-MS methods for metabolic and genetic profiling [8]. In partnership with biotech companies, more than 120 novel LC-MS-based methods were introduced as part of companion diagnostics development, with the number of hospitals using LC-MS machines for personalized medication monitoring increasing by 18% to 2,400 establishments [8].
In conclusion, the journey of LC-MS from conceptualization to cornerstone technology has fundamentally transformed pharmaceutical analysis workflows. Its unparalleled specificity, sensitivity, and multiplex testing capabilities have made it indispensable across all stages of drug development, from early discovery to clinical monitoring [8] [1]. As technology continues to advance with improvements in instrumentation, data analysis, and automation, LC-MS is poised to maintain its critical role in driving pharmaceutical innovation and enabling the development of novel therapeutics for years to come.
The integration of chromatographic separation with mass spectrometric detection represents a cornerstone of modern analytical chemistry, particularly in pharmaceutical analysis. This synergy creates a powerful hyphenated technique where the whole is significantly greater than the sum of its parts. Liquid Chromatography-Mass Spectrometry (LC-MS) has established itself as one of the most versatile and powerful analytical techniques in drug research [10]. The combination of high-resolution chromatography with sensitive mass spectrometry has transformed the landscape of pharmaceutical analysis, enabling researchers to gain unprecedented insights into drug molecules [10].
Chromatography excels at separating complex mixtures into individual components, while mass spectrometry provides detailed molecular identification and quantification. When these techniques are coupled, researchers can resolve intricate biological samples and detect trace components with precise molecular information [10]. This capability has expanded the boundaries of drug research, offering a precise toolkit to explore and evaluate drug mechanisms in ways previously unattainable. The growing complexity of drug research, combined with increasing demands for precision medicine, underscores the need for such sophisticated analytical techniques throughout drug discovery, development, and personalized treatment [10].
Fundamental Principles of Chromatographic Separation
Chromatography is a physical separation method that distributes components of a mixture between two phases: a stationary phase and a mobile phase [10]. The fundamental principle relies on the differential affinities of compounds for these two phases, which causes them to migrate at different velocities and thus separate over time [10].
Chromatographic Techniques in Pharmaceutical Analysis
Several chromatographic techniques are commonly employed in pharmaceutical research, each with distinct advantages for specific applications:
Liquid Chromatography (LC): Particularly high-performance liquid chromatography (HPLC) and ultra-high-performance liquid chromatography (UHPLC), is one of the most widely used techniques in drug research [10]. LC is effective for separating a wide range of polar and non-polar compounds, including small molecules, peptides, and proteins. UHPLC improves upon HPLC by using smaller particle sizes and higher pressure, allowing for faster separation and greater resolution [10].
Gas Chromatography (GC): Primarily used for volatile compounds that are thermally stable [10]. It involves separation using a gaseous mobile phase and is widely used for analyzing small drug molecules with sufficient volatility.
Two-Dimensional Chromatography (2D-LC): Combines two different chromatographic separation mechanisms to achieve significantly greater separation power for highly complex mixtures that challenge single-dimension techniques [10].
The separation achieved by chromatography ensures that individual compounds enter the mass spectrometer at different times, reducing ion suppression and matrix effects that would otherwise complicate detection and quantification [11].
Fundamental Principles of Mass Spectrometric Detection
Mass spectrometry identifies and quantifies compounds based on their mass-to-charge ratio (m/z). The process typically involves three main stages: ionization, mass analysis, and detection [10].
Ionization Techniques
The first critical step in MS is converting neutral molecules into charged ions that can be manipulated by electromagnetic fields. Common ionization methods include:
Electrospray Ionization (ESI): Widely used for analyzing polar and ionic compounds such as drugs and their metabolites. It generates charged droplets in a high electric field, from which ions are released as the solvent evaporates [10]. ESI is particularly valuable for analyzing large biomolecules like proteins and peptides.
Atmospheric Pressure Chemical Ionization (APCI): Suitable for less polar compounds and works by creating ions through chemical reactions between the sample and a reagent gas in a corona discharge [10].
Matrix-Assisted Laser Desorption/Ionization (MALDI): Typically used for analyzing large biomolecules where a laser ionizes the sample embedded in a matrix, producing ions for mass analysis [10].
Mass Analyzers
Once ionized, the mass analyzer separates ions based on their mass-to-charge ratio. Several analyzer types offer different performance characteristics:
Quadrupole: Uses oscillating electric fields to filter ions based on their m/z ratio, offering good sensitivity and resolution across a wide range of compounds [10]. Triple quadrupole systems (QQQ) are particularly valuable for quantitative analysis.
Time-of-Flight (TOF): Measures the time ions take to travel a fixed distance, with lighter ions reaching the detector more quickly. This technique offers high resolution and a wide mass range [10].
Orbitrap: Traps ions in an electrostatic field and measures their oscillation frequency to determine m/z ratios. Orbitrap analyzers provide high resolution and mass accuracy, making them ideal for precise identification and discovery applications [10].
The Synergistic Interface: Connecting Separation to Detection
The interface between the chromatographic system and the mass spectrometer represents a critical engineering achievement that enables the seamless combination of these technologies. In LC-MS, the interface must efficiently remove the liquid mobile phase while transferring analytes to the gas phase for mass analysis - a process accomplished through sophisticated ionization sources like ESI and APCI [10].
This interface creates a powerful analytical synergy where:
- Chromatographic separation reduces sample complexity before introduction to the MS, minimizing ion suppression and matrix effects
- Mass detection provides specific identification for each chromatographically resolved component
- The combination enables both targeted quantification and untargeted discovery in complex matrices
The continuous improvement of instrumentation has been key to LC-MS's success [1]. Advancements in both LC and MS components have driven the evolution of this technology, with modern systems offering dramatically increased sensitivity and resolution [1].
Experimental Protocols for Pharmaceutical Applications
Protocol 1: Targeted Quantification of Small Molecule Pharmaceuticals Using Triple Quadrupole LC-MS
Application: Bioanalysis of drug compounds and metabolites in biological matrices
Materials and Equipment:
- Triple quadrupole LC-MS system (e.g., TSQ Altis, Quantis, or Endura) [12]
- UHPLC system with binary or quaternary pump
- C18 reversed-phase column (2.1 × 100 mm, 1.7-1.8 μm particle size)
- Appropriate pharmaceutical standards and internal standards
- Mobile phase A: 0.1% formic acid in water
- Mobile phase B: 0.1% formic acid in acetonitrile or methanol
Sample Preparation:
- Perform protein precipitation of plasma/serum samples using 3 volumes of organic solvent (acetonitrile or methanol) containing internal standard
- Vortex mix for 30 seconds and centrifuge at 14,000 × g for 10 minutes
- Transfer supernatant to autosampler vials for analysis
Chromatographic Conditions:
- Column temperature: 40-50°C
- Flow rate: 0.3-0.6 mL/min
- Injection volume: 1-10 μL
- Gradient program: 5-95% mobile phase B over 3-10 minutes depending on complexity
Mass Spectrometric Parameters:
- Ionization mode: ESI positive or negative depending on analyte
- Spray voltage: 3.0-3.5 kV (positive), 2.5-3.0 kV (negative)
- Vaporizer temperature: 300-400°C
- Sheath gas pressure: 40-50 arb units
- Auxiliary gas pressure: 10-20 arb units
- Multiple Reaction Monitoring (MRM) transitions optimized for each analyte
Data Analysis:
- Integrate chromatographic peaks for each MRM transition
- Calculate peak area ratios (analyte/internal standard)
- Generate calibration curves using weighted linear regression (1/x or 1/x²)
- Apply calibration model to quantify samples
Protocol 2: Untargeted Metabolomic Profiling Using UHPLC-Orbitrap MS
Application: Discovery of drug metabolites and biomarker identification
Materials and Equipment:
- High-resolution Orbitrap MS system (e.g., Orbitrap Exploris series, Q Exactive) [13]
- UHPLC system with quaternary pump and temperature-controlled autosampler
- HILIC and/or reversed-phase columns for complementary separation
- Mobile phases with volatile buffers (ammonium formate/acetate)
Sample Preparation:
- Prepare biological samples (urine, plasma, tissue homogenate) using protein precipitation or liquid-liquid extraction
- Consider chemical isotope labeling (CIL) for enhanced quantification [1]
- Use quality control samples (pooled from all samples) throughout analysis
Chromatographic Conditions:
- Utilize both reversed-phase and HILIC chromatography for comprehensive coverage
- Longer gradient programs (15-30 minutes) for enhanced separation
- Column temperature: 40-60°C
- Flow rate: 0.3-0.4 mL/min
Mass Spectrometric Parameters:
- Full scan MS data acquisition at high resolution (≥70,000 FWHM)
- Data-dependent MS/MS acquisition for top N ions
- Mass range: m/z 70-1000
- Collision energy: Stepped (20, 40, 60 eV)
Data Processing:
- Use software platforms (Compound Discoverer, XCMS, MS-DIAL) for peak picking, alignment, and normalization
- Perform multivariate statistical analysis (PCA, OPLS-DA) to identify significant features
- Annotate metabolites using accurate mass, MS/MS fragmentation, and database searching
Instrumentation and Research Reagent Solutions
LC-MS System Selection Guide
Table 1: Comparison of Triple Quadrupole LC-MS Systems for Pharmaceutical Analysis
| Parameter | TSQ Fortis | TSQ Endura | TSQ Quantis | TSQ Altis |
|---|---|---|---|---|
| Sensitivity | +++ | +++ | ++++ | +++++ |
| Resolution | ++ | ++ | ++ | +++ |
| Scan Speed | ++++ | +++ | ++++ | ++++ |
| Targeted Quantitation | Yes | Yes | Yes | Yes |
| Small Molecule Quantitation | Yes | Yes | Yes | Yes |
| High-Resolution SRM | ++ | ++ | ++ | +++ |
| Polarity Switching | + | + | + | + |
| Regulatory Compliance | Yes | Yes | Yes | Yes |
Table 2: Comparison of Orbitrap LC-MS Systems for Pharmaceutical Research
| Parameter | Q Exactive Plus MS | Orbitrap Exploris 120 MS | Orbitrap Exploris 240 MS | Orbitrap Exploris 480 MS |
|---|---|---|---|---|
| Resolving Power | 140,000 | 120,000 | 240,000 | 480,000 |
| Mass Accuracy | <1 ppm | <1 ppm (5 days with EASY-IC) | <1 ppm (5 days with EASY-IC) | <1 ppm |
| Scan Speed | 12 Hz | 22 Hz | 22 Hz | 40 Hz |
| Mass Range | m/z 50-6,000 | m/z 40-3,000 | m/z 40-6,000 | m/z 40-6,000 |
| Ideal Applications | Metabolomics, Lipidomics, Biopharma | Clinical Research, Food & Environmental Safety | Forensic Toxicology, Biopharma | Quantitative Proteomics, Biopharma R&D |
Essential Research Reagent Solutions
Table 3: Key Research Reagents for LC-MS Pharmaceutical Analysis
| Reagent Category | Specific Examples | Function in Analysis |
|---|---|---|
| Mobile Phase Modifiers | Formic acid, ammonium formate, acetic acid, ammonium acetate | Improve ionization efficiency and chromatographic separation |
| Internal Standards | Stable isotope-labeled analogs of analytes | Correct for matrix effects and variability in sample preparation and ionization |
| Protein Precipitation Reagents | Acetonitrile, methanol, sometimes with additives | Remove proteins from biological samples while maintaining analyte recovery |
| Solid Phase Extraction Sorbents | C18, mixed-mode cation/anion exchange, hydrophilic-lipophilic balance | Cleanup and concentrate analytes from complex matrices |
| Derivatization Reagents | Chemical isotope labeling (CIL) reagents [1] | Enhance detection sensitivity and enable precise quantification in metabolomics |
Data Analysis and Software Solutions
The complexity of LC-MS data, particularly in untargeted applications, requires sophisticated software tools for processing and interpretation.
Software Platforms for Different Applications
- Targeted Quantitation: Instrument vendor software (TraceFinder, LCQUAN) provides robust processing for regulated bioanalysis with MRM data [12]
- Proteomics: Platforms like MaxQuant, Proteome Discoverer, and Skyline support identification and quantification of proteins and peptides [14]
- Metabolomics: Tools including Compound Discoverer, XCMS, and MS-DIAL enable processing of complex untargeted datasets
- Pharmaceutical Impurities: Software with specialized algorithms for detecting and characterizing low-abundance impurities and metabolites
Advanced data analysis increasingly incorporates machine learning and artificial intelligence to improve compound identification, predict fragmentation patterns, and uncover subtle patterns in complex data sets [1].
Visualizing LC-MS Workflows
LC-MS Pharmaceutical Analysis Workflow
Synergy Between Chromatography and Mass Spectrometry
The powerful synergy between chromatographic separation and mass spectrometric detection has established LC-MS as an indispensable technology in pharmaceutical research and development. By combining the complementary strengths of both techniques, this hyphenated approach enables researchers to address complex analytical challenges throughout the drug development pipeline - from early discovery to clinical testing and quality control. Continuous advancements in instrumentation, methodology, and data analysis ensure that LC-MS will remain at the forefront of analytical science, driving innovation in pharmaceutical research and personalized medicine.
Liquid Chromatography-Mass Spectrometry (LC-MS) has become an indispensable tool in the pharmaceutical analysis workflow, providing the specificity, sensitivity, and throughput required for modern drug development [1]. The technique's power stems from the sophisticated integration of its core components: the liquid chromatography system, which separates complex mixtures, and the mass spectrometer, which identifies and quantifies the separated compounds [15]. This application note details the key instrumentation components—modern pumps, ionization sources, and mass analyzers—within the context of pharmaceutical analysis. It provides a structured comparison of current technologies, detailed experimental protocols for their application, and essential research reagent solutions, serving as a practical resource for researchers and scientists engaged in drug development.
Modern Instrumentation Components in LC-MS
The performance of an LC-MS system in pharmaceutical applications hinges on the advanced design and integration of its core components. This section summarizes the critical specifications of modern pumps, ionization sources, and mass analyzers in a structured format for easy comparison.
Table 1: Comparison of Modern HPLC/UHPLC Pump Systems
| Product/System Name | Maximum Pressure (bar) | Key Features | Pharmaceutical Application Suitability |
|---|---|---|---|
| Waters Alliance iS Bio HPLC [16] | 830 (12,000 psi) | Bio-inert design, MaxPeak HPS technology, instrument intelligence | Quality control of biopharmaceuticals |
| Shimadzu i-Series [16] | 700 (10,152 psi) | Compact, integrated design, eco-friendly, supports various detectors | General HPLC analysis, method development |
| Agilent 1290 Infinity III [16] | 1300 | Level sensing monitors, sample ID reader, maintenance software | High-throughput analysis, impurity profiling |
| Knauer Azura HTQC [16] | 1240 | Configured for high-throughput QC, high sample capacity | Quality control with short cycle times |
| Thermo Vanquish Neo [16] | Not Specified | Tandem direct injection workflow for parallel column operation | High-throughput screening in drug discovery |
Table 2: Key Ionization Sources and Their Applications
| Ionization Technique | Principle | Optimal Analyte Type | Common Pharmaceutical Applications |
|---|---|---|---|
| Electrospray Ionization (ESI) [15] | Soft ionization; produces multiply charged ions via electrospray | Polar, thermally labile molecules, large biomolecules (proteins, peptides, nucleic acids) | Analysis of biologics, metabolites, pharmacokinetic studies |
| Atmospheric Pressure Chemical Ionization (APCI) [15] | Soft ionization; gas-phase chemical ionization at atmospheric pressure | Less polar, low-to-medium molecular weight, semi-volatile compounds | Drug metabolism studies, analysis of small molecule APIs |
| Atmospheric Pressure Photoionization (APPI) [1] | Soft ionization; uses photon energy for ionization | Non-polar compounds (e.g., polyaromatic hydrocarbons) | Specialist application for non-polar analytes |
Table 3: Overview of Common Mass Analyzers in Pharmaceutical LC-MS
| Mass Analyzer Type | Key Principle | Key Features | Example Instrument (2024-2025) |
|---|---|---|---|
| Triple Quadrupole (QqQ) | Three quadrupoles in series for filtering and fragmentation | High sensitivity for targeted quantitation, excellent dynamic range | Sciex 7500+ MS/MS [16] |
| Time-of-Flight (TOF) | Measures ion flight time over a fixed distance | High resolution and mass accuracy, suitable for untargeted analysis | Bruker NeofleX Imaging Profiler [16] |
| Orbitrap | Measures ion oscillation frequency around a central electrode | Very high resolution and mass accuracy, high-throughput capabilities | Thermo Orbitrap-based workflows [17] |
| Quadrupole-TOF (Q-TOF) | Hybrid system combining quadrupole and TOF technologies | High resolution with MS/MS capability for structural elucidation | Sciex ZenoTOF 7600+ [16] |
| Ion Trap (IT) | Traps and ejects ions based on m/z using electric fields | Multiple stages of MS (MSn) for detailed structural studies | Not specified in latest data |
Experimental Protocols
Protocol 1: Targeted Quantitation of a Small Molecule API Using QqQ MS
1. Objective: To develop and validate a sensitive and specific LC-MS/MS method for the quantitative analysis of a small molecule active pharmaceutical ingredient (API) and its metabolites in biological matrices (e.g., plasma) for pharmacokinetic studies [18] [19].
2. Materials and Reagents:
- API Reference Standard
- Internal Standard (IS, preferably stable isotope-labeled)
- Mobile Phase A: 0.1% Formic acid in water [20]
- Mobile Phase B: 0.1% Formic acid in acetonitrile
- Biological Matrix: Control human plasma
- Solid-Phase Extraction (SPE) plates or materials for protein precipitation
3. Instrumentation:
- HPLC Pump: Agilent 1290 Infinity III UHPLC system (or equivalent) [16]
- Mass Spectrometer: Sciex 7500+ TQ MS/MS (or equivalent triple quadrupole) [16]
- LC Column: Advanced Materials Technology Halo C18, 2.7 µm, 2.1 x 100 mm (or equivalent) [20]
4. Detailed Methodology:
- 4.1. Sample Preparation:
- Precipitate proteins in 100 µL of plasma by adding 300 µL of acetonitrile containing the internal standard.
- Vortex mix for 1 minute and centrifuge at 15,000 x g for 10 minutes at 4°C.
- Transfer 150 µL of the supernatant to a LC vial with insert for analysis.
4.2. LC Conditions:
- Column Temperature: 40 °C
- Flow Rate: 0.4 mL/min
- Injection Volume: 5 µL
- Gradient Program:
Time (min) %A %B 0 95 5 1.0 95 5 8.0 5 95 9.0 5 95 9.1 95 5 12.0 95 5
4.3. MS/MS Conditions:
- Ionization Source: ESI, Positive ion mode
- Source Temperature: 500 °C
- Ion Spray Voltage: 5500 V
- Nebulizer Gas (GS1), Heater Gas (GS2), Curtain Gas: Optimize per instrument manual
- Data Acquisition: Multiple Reaction Monitoring (MRM)
- Dwell Time: 50 ms per transition
- MRM Transitions (to be optimized for specific API):
- API: Q1 m/z → Q3 m/z (Quantifier)
- API: Q1 m/z → Q3 m/z (Qualifier)
- Internal Standard: Q1 m/z → Q3 m/z
5. Data Analysis:
- Plot the peak area ratio (Analyte/IS) against the nominal concentration of calibration standards using a linear regression model with 1/x2 weighting.
- Determine the concentration of quality control (QC) and study samples by back-calculation from the calibration curve.
- Assay validation must meet acceptance criteria for accuracy (85-115%), precision (CV <15%), and sensitivity as per ICH guidelines.
Protocol 2: High-Resolution Intact Protein Analysis Using Orbitrap MS
1. Objective: To achieve precise quantification of intact monoclonal antibodies (mAbs) in research samples for therapeutic drug monitoring (TDM) and biopharmaceutical characterization using high-resolution accurate-mass (HRAM) detection [17].
2. Materials and Reagents:
- mAb Reference Standard
- Mobile Phase A: 0.1% Formic acid in water
- Mobile Phase B: 0.1% Formic acid in acetonitrile
- Desalting Column: Size-exclusion or protein desalting cartridges
3. Instrumentation:
- HPLC Pump: Thermo Vanquish Neo UHPLC system [16]
- Mass Spectrometer: Thermo Orbitrap mass spectrometer (e.g., Orbitrap Exploris) [17]
- LC Column: Restek Raptor C8 column, 2.7 µm, 2.1 x 50 mm (for large biomolecules) [20]
4. Detailed Methodology:
- 4.1. Sample Preparation:
- Desalt the protein sample using a centrifugal desalting column according to the manufacturer's instructions.
- Dilute the desalted sample to a concentration of approximately 1 µg/µL with 0.1% formic acid in water.
4.2. LC Conditions:
- Column Temperature: 80 °C (to denature protein and improve separation)
- Flow Rate: 0.2 mL/min
- Injection Volume: 2 µL
- Gradient Program:
Time (min) %A %B 0 80 20 2.0 80 20 12.0 50 50 12.1 5 95 14.0 5 95 14.1 80 20 17.0 80 20
4.3. MS Conditions:
- Ionization Source: ESI, Positive ion mode
- Source Voltage: 3.8 kV
- Capillary Temperature: 320 °C
- Sheath Gas and Aux Gas Flow: Optimized for protein signal
- Mass Analyzer: Orbitrap
- Resolution Setting: 15,000 (at m/z 200)
- Scan Range: m/z 600 - 4000
5. Data Analysis:
- Deconvolute the raw mass spectrum (a series of multiply charged ions) to a zero-charge mass spectrum using instrument software (e.g., BioPharma Finder, Xtract).
- Identify the main peak as the intact protein and compare against the theoretical mass.
- Identify and quantify glycoforms or other post-translational modifications based on mass differences.
Workflow and Relationship Diagrams
LC-MS Pharmaceutical Analysis Workflow
Ionization Source Mechanisms
The Scientist's Toolkit: Research Reagent Solutions
Table 4: Essential Research Reagents and Materials for LC-MS Pharmaceutical Analysis
| Item | Function/Description | Example Product/Type |
|---|---|---|
| RPLC Columns (C18) | General-purpose separation of small molecules and peptides. | Halo C18 [20], Raptor C18 [20] |
| Bio-inert Columns | Minimize metal-sensitive analyte adsorption; crucial for phosphoproteins, oligonucleotides. | Halo Inert [20], Evosphere Max [20] |
| Specialty Phases (Biphenyl) | Provides alternative selectivity via π-π interactions; useful for isomer separation. | Aurashell Biphenyl [20] |
| Ion-Pairing Reagents | Enables analysis of ionic analytes like oligonucleotides by masking charge. | Triethylamine, Hexylamine (for IP-RPLC) |
| High-Purity Solvents | Mobile phase constituents; high purity is critical to reduce background noise. | LC-MS Grade Water, Acetonitrile, Methanol |
| Volatile Buffers & Acids | Mobile phase additives to control pH and improve ionization efficiency. | Ammonium Formate, Ammonium Acetate, Formic Acid |
| Solid-Phase Extraction Plates | High-throughput sample clean-up to remove matrix interferents from biological fluids. | SPE Plates (C18, Mixed-Mode) |
| Stable Isotope Internal Standards | Correct for matrix effects and ionization variability; ensure quantification accuracy. | d3-, 13C-, 15N-labeled analogs of analytes |
Why LC-MS? Addressing the Unique Demands of Pharmaceutical Compounds and Complex Biological Matrices
Liquid Chromatography-Mass Spectrometry (LC-MS) has become the cornerstone analytical technique in modern pharmaceutical and biomedical research. Its unique capability to precisely separate, identify, and quantify compounds within complex biological matrices addresses critical challenges throughout the drug development workflow. The technique's versatility spans from early drug discovery to final quality control, enabling researchers to navigate the intricate landscape of modern therapeutics, including small molecules, biologics, and novel modalities [1] [3]. This application note details the specific technical advantages of LC-MS and provides standardized protocols for its application in key pharmaceutical analyses, underscoring its indispensable role in ensuring drug safety, efficacy, and quality.
Technical Advantages of LC-MS in Pharmaceutical Analysis
The synergy between liquid chromatography and mass spectrometry creates a powerful analytical system uniquely suited to the demands of pharmaceutical analysis.
Separation Power for Complex Matrices: Liquid chromatography efficiently resolves individual analytes from complex biological samples such as plasma, serum, and tissue homogenates. This separation is crucial to reduce ion suppression and matrix effects in the mass spectrometer, ensuring accurate quantification [21] [22]. Advanced stationary phases, including core-shell biphenyl and phenyl-hexyl columns, provide enhanced selectivity for drug-like molecules through π-π interactions, complementing the common C18 chemistry [22].
Detection Specificity and Sensitivity: Mass spectrometry provides unparalleled specificity by detecting analytes based on their mass-to-charge ratio (m/z). The use of tandem mass spectrometry (MS/MS) further enhances specificity by monitoring unique precursor-to-product ion transitions [3]. This allows for the precise quantification of drugs at trace levels (e.g., picogram-per-milliliter) in the presence of numerous endogenous compounds, a routine but critical requirement in bioanalysis [21].
Versatility for Diverse AnalytES: Unlike Gas Chromatography-Mass Spectrometry (GC-MS), which is limited to volatile or derivatized compounds, LC-MS can analyze a vast range of molecules. It is ideally suited for non-volatile, thermally labile, and high-molecular-weight compounds, which constitute the majority of pharmaceuticals and their metabolites [23] [24]. This includes everything from small molecule drugs to complex biologics like antibodies and antibody-drug conjugates (ADCs) [25].
The following workflow diagram illustrates how these advantages are integrated into a typical LC-MS analysis for biological samples.
Key Applications and Detailed Protocols
Drug Metabolism and Pharmacokinetics (DMPK) Studies
LC-MS is a fundamental tool for DMPK studies, which evaluate a drug's absorption, distribution, metabolism, and excretion (ADME) properties [3]. A core application is metabolic stability assessment, which predicts a drug candidate's clearance and half-life.
Protocol: In Vitro Metabolic Stability Assay Using Liver Microsomes
Objective: To determine the intrinsic metabolic stability of a new chemical entity by incubating it with liver microsomes and monitoring its depletion over time.
Materials:
- Test compound (1 mM stock in DMSO)
- Pooled human or rat liver microsomes (20 mg/mL protein)
- NADPH regenerating system (Solution A: NADP+, Solution B: Glucose-6-phosphate, Solution C: Glucose-6-phosphate dehydrogenase)
- Potassium phosphate buffer (0.1 M, pH 7.4)
- Termination reagent (ice-cold acetonitrile with internal standard)
- LC-MS/MS system (e.g., UHPLC coupled to a triple quadrupole mass spectrometer)
Procedure:
- Preparation: Dilute liver microsomes to 0.5 mg/mL protein concentration in ice-cold potassium phosphate buffer.
- Pre-incubation: In a 96-well plate, add 380 µL of microsome solution and 5 µL of test compound (final concentration 1-5 µM). Pre-incubate for 5 minutes at 37°C in a shaking water bath.
- Initiation: Start the reaction by adding 40 µL of the pre-warmed NADPH regenerating system.
- Time Points: Immediately withdraw 50 µL aliquots at time points 0, 5, 15, 30, and 60 minutes. Transfer each aliquot to a separate well containing 100 µL of ice-cold termination reagent.
- Sample Processing: Vortex, then centrifuge at 4000 x g for 15 minutes at 4°C to precipitate proteins. Transfer the supernatant to a fresh plate for LC-MS/MS analysis.
- Analysis: Inject samples onto the LC-MS/MS. Quantify the parent drug loss using a optimized multiple reaction monitoring (MRM) method.
Data Analysis: Plot the natural logarithm of the parent compound's peak area ratio (analyte/internal standard) versus time. The slope of the linear regression is the depletion rate constant (k). Calculate the in vitro half-life as
t₁/₂ = 0.693 / k.
Monitoring Critical Quality Attributes of Biologics
For complex therapeutics like monoclonal antibodies and Antibody-Drug Conjugates (ADCs), LC-MS is vital for characterizing Critical Quality Attributes (CQAs), such as drug-to-antibody ratio (DAR).
Protocol: Multi-Attribute Monitoring (MAM) for ADC Characterization
Objective: To simultaneously monitor multiple product quality attributes, including DAR distribution, sequence variants, and post-translational modifications, using a high-resolution LC-MS workflow [26].
Materials:
- Purified ADC sample
- Denaturing buffer (e.g., containing Guanidine HCl)
- Reducing agent (e.g., Dithiothreitol - DTT)
- Alkylating agent (e.g., Iodoacetamide)
- Protease (e.g., Trypsin)
- UHPLC system coupled to a high-resolution mass spectrometer (e.g., Q-TOF or Orbitrap)
Procedure:
- Denaturation and Reduction: Desalt the ADC sample. Incubate with denaturing buffer and DTT at 56°C for 30 minutes to reduce disulfide bonds.
- Alkylation: Alkylate the reduced cysteine residues with iodoacetamide in the dark for 30 minutes.
- Digestion: Quench the alkylation reaction. Add trypsin at an enzyme-to-substrate ratio of 1:50 and incubate at 37°C for 4-16 hours.
- LC-HRMS Analysis:
- Chromatography: Separate digested peptides using a reversed-phase UHPLC column (e.g., C8 or C18, 1.7 µm particle size) with a gradient of water and acetonitrile, both containing 0.1% formic acid.
- Mass Spectrometry: Acquire data in positive ion mode with high-resolution full-scan MS and data-dependent MS/MS.
- Data Processing: Use dedicated software to identify peptides, map the amino acid sequence, and characterize modifications (e.g., deamidation, oxidation). For DAR analysis, an intact mass analysis workflow may be employed using native MS conditions to preserve non-covalent interactions [25].
Drug-Plasma Protein Binding Studies
Determining the fraction of drug bound to plasma proteins is critical, as only the unbound fraction is pharmacologically active [21].
Protocol: Determining Plasma Protein Binding via Rapid Equilibrium Dialysis (RED)
Objective: To measure the unbound fraction (
f_u) of a drug in plasma.Materials:
- RED device (e.g., 96-well format)
- Blank plasma (human or relevant species)
- Test compound
- Phosphate buffer (pH 7.4)
- LC-MS/MS system
Procedure:
- Preparation: Spike the test compound into blank plasma to a physiologically relevant concentration (e.g., 1-10 µM).
- Loading: Add 100 µL of spiked plasma to the sample chamber (red side) of the RED device. Add 300 µL of phosphate buffer to the buffer chamber.
- Dialysis: Seal the plate and incubate with gentle shaking at 37°C in a 5% CO₂ incubator for 4-6 hours.
- Sampling: Post-incubation, pipette 50 µL from both the plasma and buffer chambers. To ensure equilibrium, add the 50 µL from the plasma side to 150 µL of blank buffer, and add the 50 µL from the buffer side to 150 µL of blank plasma. This creates matrix-matched samples.
- Sample Processing: Precipitate proteins in all samples with ice-cold acetonitrile containing internal standard. Centrifuge and analyze the supernatant by LC-MS/MS.
- Calculation: The unbound fraction (
f_u) is calculated as:f_u (%) = (Peak Area Buffer / Peak Area Plasma) × 100%.
Instrumentation and Reagent Solutions
The performance of an LC-MS method is heavily dependent on the correct selection of instrumentation and research reagents. The following tables provide a comparative overview of key components.
Table 1: Comparison of Common Mass Spectrometer Types in Pharmaceutical Analysis
| Mass Analyzer Type | Typical Resolving Power | Key Strengths | Common Pharmaceutical Applications |
|---|---|---|---|
| Triple Quadrupole (QqQ) | Unit resolution | High sensitivity and specificity in MRM mode; Excellent quantitative performance; Wide dynamic range. | Targeted Quantification: PK/TK studies, bioequivalence, metabolite monitoring [3]. |
| Quadrupole-Time-of-Flight (Q-TOF) | 20,000 - 60,000 | Accurate mass measurement; Fast acquisition speeds; Untargeted screening capability. | Untargeted Screening: Metabolite identification, impurity profiling, biomarker discovery [23]. |
| Orbitrap | Up to 1,000,000 | Very high resolution and mass accuracy; Superior for distinguishing isobaric compounds. | Structural Elucidation: Detailed characterization of biologics, complex natural products; MAM [23] [26]. |
Table 2: Essential Research Reagent Solutions for LC-MS Workflows
| Reagent / Solution | Function | Application Notes |
|---|---|---|
| Core-Shell Biphenyl LC Column | Chromatographic separation | Provides complementary selectivity to C18 for aromatic drugs via π-π interactions, improving resolution for complex drug panels [22]. |
| Phospholipid Removal (PLR) Plates | Sample preparation | Removes proteins and phospholipids from biological samples in a single step, significantly reducing matrix effects and ion suppression compared to protein precipitation alone [22]. |
| Mixed-Mode Solid Phase Extraction (SPE) | Sample preparation/cleanup | Uses hydrophobic and ionic interactions for superior sample clean-up, leading to lower background noise and higher sensitivity, ideal for complex matrices [22]. |
| NADPH Regenerating System | Enzyme cofactor | Provides a consistent supply of NADPH, essential for maintaining cytochrome P450 enzyme activity during in vitro metabolic stability assays [3]. |
The relationship between sample preparation, chromatographic separation, and mass spectrometric detection is fundamental to a successful LC-MS method. The following diagram outlines this integrated system and the key options at each stage.
LC-MS technology continues to evolve, with emerging trends focusing on increased sensitivity, throughput, and application scope. The integration of ion mobility spectrometry (IMS) with high-resolution MS adds a separation dimension based on an ion's size and shape, enhancing selectivity in complex matrices [25] [23]. Microflow LC-MS/MS is gaining traction for preclinical pharmacokinetic studies, as it offers a significant boost in sensitivity, reduces solvent consumption, and, when paired with microsampling, minimizes animal use in line with the 3Rs principles (Replacement, Reduction, Refinement) [26]. Furthermore, the adoption of multi-attribute monitoring (MAM) represents a paradigm shift in biopharmaceutical quality control, moving from traditional HPLC-UV methods to LC-MS-based assays that simultaneously monitor multiple critical quality attributes [26].
In conclusion, LC-MS is an indispensable tool in the pharmaceutical analysis workflow. Its unmatched ability to separate analytes from complex biological matrices, coupled with highly specific and sensitive mass spectrometric detection, makes it uniquely capable of answering critical questions throughout drug discovery and development. From quantifying drug concentrations for pharmacokinetic studies to characterizing the intricate structure of complex biologics, LC-MS provides the robust and reliable data necessary to advance new therapeutics with confidence.
Transforming Drug Development: Key LC-MS Workflows from Discovery to QC
Application Note: Advanced LC–MS in Addressing DMPK Challenges for Novel Modalities
The drug discovery landscape is increasingly utilizing novel synthetic drug modalities, such as macrocyclic peptides and Proteolysis Targeting Chimeras (PROTACs), to engage challenging therapeutic targets [27]. Although synthetic, these compounds often fall outside the scope of Lipinski's Rule of Five, creating unique absorption, distribution, metabolism, and excretion (ADME) challenges that complicate lead optimization programs [27]. These challenges necessitate novel analytical approaches in Drug Metabolism and Pharmacokinetics (DMPK). Recent technological advancements in Liquid Chromatography–High-Resolution Mass Spectrometry (LC–HRMS) have proven highly effective in increasing the throughput of DMPK assays and confidently identifying metabolic soft spots, thereby accelerating the development of these complex therapeutics [27] [28].
The following table summarizes the core DMPK challenges posed by novel modalities and the corresponding capabilities of advanced LC–HRMS platforms in addressing them.
Table 1: DMPK Challenges for Novel Modalities and LC–HRMS Solutions
| Novel Drug Modality | Key DMPK Challenge | LC–HRMS Solution | Instrument Platform | Key Outcome |
|---|---|---|---|---|
| Macrocyclic Peptides | Low metabolic stability; Metabolite ID | High-throughput stability testing & MetID with sample multiplexing | Orbitrap Astral Mass Spectrometer [27] | Increased throughput of combined stability testing and metabolite identification [27] |
| PROTACs | Complex metabolite identification; Finding metabolic soft spots | Confident metabolite ID with intelligent MSn fragmentation | Orbitrap Ascend Biopharma Tribrid Mass Spectrometer [27] | Confident PROTAC metabolite soft spot identification [27] |
| Oligonucleotide Therapeutics / Protein-based Biologics | Inherently complex molecule analysis; Need for multiple assays (e.g., free vs. conjugated) | Targeted quantitation and characterization in complex matrices | Triple Quadrupole and Orbitrap-based LC-MS [18] | Best tool for analyzing protein-based biologic drugs and oligonucleotide therapeutics [18] |
Detailed Experimental Protocol
Protocol: Combined Metabolic Stability Testing and Metabolite Identification for Macrocyclic Peptides Using the Orbitrap Astral Mass Spectrometer
Objective: To simultaneously assess the metabolic stability and identify major metabolites of a macrocyclic peptide lead candidate using a multiplexed, high-throughput LC–HRMS workflow.
Materials:
- Test System: Liver microsomes or hepatocytes (from relevant species).
- LC–HRMS System: Thermo Scientific Orbitrap Astral mass spectrometer coupled to a UHPLC system.
- Software: Instrument control and data analysis software.
- Consumables: LC columns suitable for peptides, precipitation plates.
Procedure:
- Sample Incubation:
- Prepare the macrocyclic peptide candidate at a suitable concentration (e.g., 1 µM) in a metabolically active test system (e.g., human liver microsomes).
- Incubate under appropriate conditions (e.g., 37°C). Use a zero-time point control where the reaction is stopped immediately.
- Aliquot and quench the reaction at multiple pre-determined time points (e.g., 0, 15, 30, 60 minutes).
Sample Multiplexing:
- Use a sample multiplexing strategy (e.g., isotopic labeling or tandem mass tags) to pool the time-point samples from a single incubation.
- This allows for the simultaneous injection and analysis of multiple time points, drastically reducing instrument time and increasing throughput.
LC–HRMS Analysis:
- Inject the multiplexed sample onto the LC–HRMS system.
- Chromatography: Utilize a reversed-phase gradient elution to separate the parent drug and its metabolites.
- Mass Spectrometry: Acquire data in full-scan HRMS mode with a mass resolution of at least 50,000 (at 200 m/z) for accurate mass measurement of the parent drug and potential metabolites.
Data Processing for Stability and Metabolite ID:
- Stability Assessment: Extract the ion chromatogram for the parent drug. Plot the peak area over time to determine the half-life and intrinsic clearance.
- Metabolite Identification: Use data-dependent acquisition (DDA) or data-independent acquisition (DIA) modes to trigger MS2 and MS3 spectra on detected metabolites.
- Process the high-resolution data to generate a list of potential metabolites based on accurate mass shifts (e.g., +15.995 Da for oxidation, -2.016 Da for reduction). Interrogate the MSn spectra to confirm metabolite structure and identify the site of metabolism (soft spot).
Workflow Diagram
The following diagram illustrates the integrated experimental workflow for metabolic stability and metabolite identification.
Integrated Workflow for Stability and Metabolite ID
Application Note: Lead Identification and Optimization in Modern Drug Discovery
Lead identification and optimization form the critical bridge between initial drug target discovery and the selection of a viable preclinical candidate [29]. This stage focuses on selecting compounds with desirable biological activity and then systematically optimizing their characteristics, including potency, target selectivity, and absorption, distribution, metabolism, excretion, and toxicity (ADMET) properties [29]. The overarching goal is to improve the compound's efficacy, safety, and pharmacological profile to increase the probability of successful drug development.
Key Methods and Technologies in Lead Identification and Optimization
The table below summarizes the core strategies and analytical tools employed in this phase.
Table 2: Strategies and Technologies for Lead Identification & Optimization
| Category | Method/Strategy | Key Function | Role in ADMET/PK |
|---|---|---|---|
| Lead Identification Methods [29] [30] | High-Throughput Screening (HTS) | Rapidly evaluates thousands to millions of compounds for activity against a target. | Initial filtering based on properties like solubility and metabolic stability. |
| Virtual Screening / Molecular Docking | Uses computational models to predict compound binding to a target. | Can provide early predictions of ADMET properties. | |
| Machine Learning/Deep Learning | Analyzes large-scale chemical data to predict promising drug candidates. | Enhances prediction accuracy for efficacy and toxicity. | |
| Lead Optimization Strategies [29] | Structure-Activity Relationship (SAR) | Correlates chemical structure changes with biological activity changes. | Tackles specific ADMET challenges (e.g., metabolic stability). |
| Direct Chemical Manipulation | Modifies functional groups, makes isosteric replacements. | Improves properties like solubility and cellular permeability. | |
| Pharmacophore-Oriented Design | Makes significant modifications to the core scaffold of the lead. | Addresses challenges with chemical accessibility and properties. | |
| Key Analytical Technologies [29] | Liquid Chromatography-Mass Spectrometry (LC-MS) | Characterizes drug metabolism & pharmacokinetics (DMPK); identifies metabolites. | Central for assessing metabolic stability and metabolite profiling. |
| Nuclear Magnetic Resonance (NMR) | Provides molecular structure and information on target interaction. | Used for hit validation and structure-based drug design. | |
| In Silico Computational Tools (e.g., QSAR, CoMFA) | Predicts bioactivity and pharmacokinetic-toxicological properties. | Allows for virtual screening and prioritization of compounds. |
Detailed Experimental Protocol
Protocol: Metabolite Profiling for Lead Compound Optimization Using LC–HRMS
Objective: To characterize the metabolic profile of lead compounds, identify major metabolic pathways, and pinpoint soft spots to guide medicinal chemistry efforts.
Materials:
- Test System: Hepatocytes from human and toxicology species.
- LC–HRMS System: High-resolution mass spectrometer (e.g., Orbitrap Ascend Biopharma Tribrid MS).
- Software: Metabolite identification and structure elucidation software.
Procedure:
- Sample Generation:
- Incubate the lead compound at a pharmacologically relevant concentration with cryopreserved hepatocytes from human and preclinical species.
- Include negative control samples (without compound) and positive controls (with a compound of known metabolism).
- Terminate the reaction at appropriate time points (e.g., 2 hours) by adding an organic solvent (e.g., acetonitrile) to precipitate proteins.
Sample Preparation:
- Centrifuge the quenched samples to remove precipitated proteins.
- Transfer the supernatant and either dilute it or evaporate it and reconstitute it in a solvent compatible with the LC–MS analysis.
LC–HRMS Analysis with Intelligent Data Acquisition:
- Inject the prepared samples.
- Chromatography: Use a UHPLC system with a C18 column and a water/acetonitrile gradient containing formic acid to separate metabolites.
- Mass Spectrometry:
- Acquire full-scan HRMS data for accurate mass determination.
- Use an intelligent data-dependent acquisition (DDA) method. The instrument should automatically select the most intense ions from the full scan for subsequent fragmentation (MS2).
- For key metabolites, the method should automatically trigger additional fragmentation stages (MS3 or MSn) to obtain detailed structural information necessary for confident soft spot identification.
Data Analysis and Metabolite Identification:
- Process the data using software to find metabolites based on predicted biotransformations (e.g., oxidation, glucuronidation).
- Compare the retention time, accurate mass, and fragmentation pattern (MS2, MSn) of the metabolites to those of the parent drug.
- Propose structures for the major metabolites and assign the site of metabolism on the parent molecule.
Workflow Diagram
The following diagram outlines the logical flow for metabolite profiling to guide lead optimization.
Metabolite Profiling for Lead Optimization
The Scientist's Toolkit: Essential Research Reagent Solutions
The following table details key materials and instruments essential for conducting the DMPK and lead optimization experiments described in these application notes.
Table 3: Essential Research Reagent Solutions for LC–MS based DMPK Studies
| Item | Function/Application | Example Use-Case |
|---|---|---|
| Orbitrap Astral Mass Spectrometer | High-resolution accurate-mass (HRAM) system for high-throughput DMPK assays and MetID. | Sample multiplexing for macrocyclic peptide stability and metabolite ID [27]. |
| Orbitrap Ascend Biopharma Tribrid Mass Spectrometer | HRAM system with advanced fragmentation capabilities for detailed structural elucidation. | Confident metabolite soft spot identification for complex molecules like PROTACs [27]. |
| Triple Quadrupole LC-MS | Highly sensitive and specific targeted quantitation of known analytes. | Routine toxicology testing and therapeutic drug monitoring of small molecules [17]. |
| Liver Microsomes / Hepatocytes | In vitro test system for predicting in vivo metabolic stability and metabolite profile. | Metabolic stability assays for lead compounds [29]. |
| Specialized LC Columns (e.g., C18, Peptide) | Chromatographic separation of analytes from complex biological matrices. | Resolving parent drug from its metabolites during LC-HRMS analysis. |
| Metabolite ID & Structure Elucidation Software | Automated data processing for detecting and identifying metabolites based on HRMS data. | Streamlining the identification of metabolic soft spots from complex HRMS datasets. |
Liquid Chromatography-Tandem Mass Spectrometry (LC-MS/MS) has become the cornerstone technology for quantitative bioanalysis in modern pharmaceutical research and development [31] [1]. Its exceptional sensitivity, selectivity, and throughput capabilities make it indispensable for two critical and interrelated applications: high-sensitivity pharmacokinetic/pharmacodynamic (PK/PD) studies and therapeutic drug monitoring (TDM) [32] [33]. These applications are vital for understanding the relationship between drug exposure and physiological effects, enabling the development of safer and more effective therapeutics.
Within the pharmaceutical analysis workflow, LC-MS/MS provides the critical data bridge connecting drug formulation to clinical outcomes. It enables researchers to precisely quantify drug concentrations in biological matrices, establish exposure-response relationships, and individualize patient therapy based on reliable metabolic data [33]. This application note details standardized protocols and best practices for implementing robust LC-MS/MS methods to support PK/PD studies and TDM programs, with a focus on achieving the high sensitivity required for modern drug development challenges.
Principles and Significance
Pharmacokinetic/Pharmacodynamic (PK/PD) Studies
PK/PD modeling represents a powerful approach that integrates quantitative information about a compound's pharmacokinetic properties with its pharmacological effects [33]. The primary objective is to elucidate the relationship between drug exposure (concentration vs. time) and therapeutic response (effect vs. time), thereby understanding the mechanism of drug action [33]. Effective implementation of PK/PD strategies in early research phases enables successful transition to drug development by helping identify promising compounds and establishing potentially safe and effective dosing regimens [33].
The fundamental principle underlying PK/PD analysis is the existence of a definable relationship between the administered dose, the resulting plasma or blood drug concentrations, and the observed pharmacological effects [33]. This relationship can be complex, requiring robust study design and sophisticated mathematical modeling to accurately characterize. Implementing PK/PD modeling in early discovery and development programs can minimize animal usage, shorten development timelines, estimate therapeutic indices, and predict dose ranges for early clinical testing [33].
Therapeutic Drug Monitoring (TDM)
Therapeutic Drug Monitoring (TDM) is defined as the clinical practice of measuring specific drugs at designated intervals to maintain a constant concentration in a patient's bloodstream, thereby optimizing individual dosage regimens [32]. TDM is particularly crucial for medications with narrow therapeutic ranges, marked pharmacokinetic variability, drugs for which target concentrations are difficult to monitor, and pharmaceuticals known to produce both therapeutic and adverse effects [32].
The process of TDM is predicated on the assumption that a definable relationship exists between dose and plasma drug concentration, and between concentration and therapeutic effects [32]. TDM begins when a drug is first prescribed and involves determining an initial dosage regimen appropriate for the patient's clinical condition and individual characteristics such as age, weight, organ function, and concomitant drug therapy [32]. The ultimate goal of TDM is to use appropriate concentrations of difficult-to-manage medications to optimize clinical outcomes in patients across various clinical situations [32].
The Role of LC-MS/MS in Pharmaceutical Analysis
LC-MS/MS combines the superior separation capabilities of liquid chromatography with the highly sensitive and selective mass analysis of tandem mass spectrometry [31] [1]. This powerful combination allows for the precise quantification of analytes, often down to picogram or femtogram levels, even in complex biological matrices like plasma, serum, or tissue homogenates [31]. The development of multiple reaction monitoring (MRM) modes in LC-MS/MS represents a significant advancement in bioanalysis, enabling accurate, high-quality, and simultaneous multi-analyte quantification [31].
The exceptional sensitivity and specificity of LC-MS/MS make it particularly well-suited for monitoring a broad spectrum of drug compounds and their metabolites [1]. Recent advancements in ultra-high-pressure techniques with highly efficient columns have further enhanced LC-MS/MS capabilities, enabling the study of complex and less abundant bio-transformed metabolites [1]. These technological improvements have solidified the position of LC-MS/MS as an indispensable tool in pharmaceutical research, clinical diagnostics, and forensic science [1].
Experimental Protocols
Method Development and Validation
The bioanalytical process begins with method development, a crucial step undertaken by experienced R&D scientists and fine-tuned with the expertise of in-house instrumentation specialists [31]. The primary objective is to establish the most accurate, reliable, and sensitive method for quantifying target analytes [31]. Method development encompasses various stages, from selecting appropriate chromatographic conditions to optimizing mass spectrometry parameters to ensure optimal separation and detection of analytes [31].
Fit-for-Purpose Assay Development
A critical aspect of method development involves creating fit-for-purpose assays, which consist of tests designed to obtain optimal conditions for required concentrations and sensitivity [31]. These assays are tailored to the specific needs of a given study, ensuring the chosen analytical method is well-suited to its intended purpose [31]. The process of designing fit-for-purpose assays represents a critical stage in developing a bioanalytical method, as they dictate the accuracy and precision of quantitative results obtained from the LC-MS/MS system [31].
Sample Preparation Techniques
Proper sample preparation is paramount before analysis can occur on the LC-MS/MS system [31]. The process involves several quality control checks on samples, including comparison against calibration curves and verification using quality control samples [31]. Various techniques are employed to extract analytes from biological matrices, including:
- Liquid-Liquid Extraction: Separation technique based on differential solubility of compounds in immiscible solvents.
- Solid Phase Extraction: Concentration and purification method using specialized cartridges to isolate analytes.
- Protein Precipitation: Simple method for removing proteins from biological samples using organic solvents or acids.
These techniques should be meticulously developed by a dedicated team of experts to ensure optimal recovery and minimal matrix effects [31].
LC-MS/MS Protocol for PK/PD Studies
The following protocol outlines a standardized approach for conducting PK/PD studies using LC-MS/MS:
Instrumentation and Conditions
- LC System: Ultra-high-performance liquid chromatography (UHPLC) system capable of handling high-pressure separations.
- Mass Spectrometer: Triple quadrupole mass spectrometer (e.g., AB Sciex API 4000, QTRAP6500) operated in MRM mode [31].
- Autosampler: Temperature-controlled autosampler (e.g., Shimadzu SIL-20AC HT) for precise injection [31].
- Column Oven: Thermostatically controlled compartment (e.g., CTO-20A) for maintaining stable column temperatures [31].
- Analytical Column: Reversed-phase C18 column (2.1 × 50 mm, 1.7-2.0 μm particle size) or equivalent.
- Mobile Phase A: 0.1% formic acid in water.
- Mobile Phase B: 0.1% formic acid in acetonitrile or methanol.
- Gradient Program: Optimized for specific analyte properties, typically running from 5-95% B over 3-10 minutes.
- Flow Rate: 0.2-0.6 mL/min depending on column dimensions.
- Injection Volume: 5-20 μL.
- Ionization Source: Electrospray ionization (ESI) or atmospheric pressure chemical ionization (APCI) in positive or negative mode [1].
Sample Preparation Protocol
- Thawing: Remove frozen samples from storage and thaw at room temperature.
- Aliquoting: Transfer 100 μL of sample (plasma, serum, etc.) to a clean tube.
- Internal Standard Addition: Add appropriate volume of internal standard solution (typically 10-25 μL).
- Protein Precipitation: Add 300 μL of ice-cold acetonitrile or methanol, vortex mix for 30 seconds, and centrifuge at 13,000 × g for 10 minutes.
- Transfer: Transfer supernatant to a clean tube or 96-well plate.
- Dilution: Dilute with appropriate solvent if necessary.
- Analysis: Transfer to autosampler vials or plates for LC-MS/MS analysis.
Calibration Standards and Quality Controls
- Prepare calibration standards in blank matrix to span the expected concentration range.
- Include at least six non-zero calibration standards.
- Prepare quality control samples at low, medium, and high concentrations.
- Process and analyze calibration standards and QCs alongside study samples.
Data Analysis
- Integrate chromatographic peaks for analytes and internal standards.
- Plot peak area ratios (analyte/internal standard) versus concentration.
- Generate calibration curves using linear or quadratic regression with appropriate weighting (typically 1/x or 1/x²).
- Calculate concentrations for study samples using the established calibration curve.
- Perform pharmacokinetic analysis using specialized software (e.g., WinNonlin, Phoenix) to determine parameters such as C~max~, T~max~, AUC, t~1/2~, CL, and V~d~.
Protocol for Therapeutic Drug Monitoring
The TDM protocol using LC-MS/MS shares many similarities with the PK/PD protocol but emphasizes high throughput and rapid turnaround:
Sample Collection and Handling
- Collect blood samples at appropriate times based on the drug's pharmacokinetics (typically trough samples just before the next dose) [32].
- Process samples promptly by centrifugation to separate serum or plasma.
- Transfer separated serum or plasma to plastic transport tubes without separator gel [34].
- Store and ship samples appropriately (some assays require shipping on ice) [34].
Analytical Considerations for TDM
- Utilize stable isotope-labeled internal standards when available for maximum accuracy.
- Implement efficient chromatographic separations to resolve analytes from potential interferences.
- Employ MRM transitions that provide optimal specificity and sensitivity.
- Use abbreviated calibration curves covering the therapeutic range with additional points at critical decision levels.
- Include quality control samples at medically significant concentrations (e.g., lower limit of quantification, therapeutic threshold, toxic threshold).
Data Interpretation and Reporting
- Compare measured drug concentrations to established therapeutic ranges.
- Consider patient-specific factors such as age, organ function, and concomitant medications.
- Provide interpretive comments to guide dosage adjustments when appropriate.
- Ensure rapid result reporting to impact clinical decision-making.
Data Presentation and Analysis
Quantitative Performance of LC-MS/MS Methods
Table 1: Typical Analytical Performance Characteristics for LC-MS/MS Bioanalysis
| Performance Parameter | Target Value | Application Notes |
|---|---|---|
| Accuracy | 85-115% of nominal value | Should be demonstrated across calibration range |
| Precision | ≤15% RSD (≤20% at LLOQ) | Within-run and between-run |
| Lower Limit of Quantification (LLOQ) | Sufficient to monitor 5 half-lives | Signal-to-noise ratio ≥5:1 |
| Calibration Curve Range | 2-3 orders of magnitude | Linear or quadratic with r² ≥0.99 |
| Matrix Effects | ≤15% suppression/enhancement | Assess across multiple lots of matrix |
| Recovery | Consistent and reproducible | Not necessarily 100%, but should be consistent |
| Carryover | ≤20% of LLOQ | Assessed by injecting blank after high calibration standard |
TDM Analytical Methods and Specifications
Table 2: Example TDM Protocols for Common Therapeutic Drugs [34]
| Drug | Sample Type | Collection Time | Analytical Method | Therapeutic Range | Special Notes |
|---|---|---|---|---|---|
| Phenobarbital | 0.5 mL Serum/Plasma | Trough: Before next dose | Immunoassay | 15-40 μg/mL | Fasting sample recommended |
| Vancomycin | 0.5 mL Serum/Plasma | Trough: Before next dose | Immunoassay | Trough: 10-20 μg/mL | Monitor for nephrotoxicity |
| Cyclosporine | 0.5 mL EDTA whole blood | Trough: Before next dose | Immunoassay | Variable by transplant type | Use specific collection tubes |
| Carbamazepine | 0.5 mL Serum/Plasma | Trough: Before next dose | LC-MS/MS | 4-12 μg/mL | Monitor for drug interactions |
| Digoxin | 0.5 mL Serum/Plasma | Trough: Before next dose | Immunoassay | 0.8-2.0 ng/mL | Draw 6-8 hours post-dose |
| Gentamicin | 0.5 mL Serum/Plasma | Trough: Before next dose | Immunoassay | Trough: <1-2 μg/mL | Peak: 5-10 μg/mL |
Key PK Parameters in Drug Development
Table 3: Essential Pharmacokinetic Parameters and Their Significance
| PK Parameter | Definition | Clinical Significance |
|---|---|---|
| C~max~ | Maximum drug concentration after dosing | Indicates peak exposure; potential for efficacy/toxicity |
| T~max~ | Time to reach C~max~ | Reflects rate of absorption |
| AUC~0-t~ | Area under concentration-time curve from zero to last measurable time point | Primary measure of total drug exposure |
| AUC~0-∞~ | Area under curve from zero to infinity | Complete drug exposure estimate |
| t~1/2~ | Elimination half-life | Determines dosing frequency |
| CL | Clearance | Indicates elimination efficiency; key for dose adjustment |
| V~d~ | Volume of distribution | Reflects tissue distribution extent |
| Bioavailability | Fraction of dose reaching systemic circulation | Critical for formulation development |
Workflow Visualization
LC-MS/MS Method Development Workflow
Therapeutic Drug Monitoring Protocol
PK/PD Study Analysis Workflow
The Scientist's Toolkit: Essential Research Reagents and Materials
Table 4: Key Research Reagent Solutions for LC-MS/MS Bioanalysis
| Item Category | Specific Examples | Function & Application Notes |
|---|---|---|
| LC-MS Instrumentation | AB Sciex API 4000, QTRAP6500, Orbitrap systems [31] [17] | High-sensitivity detection and quantification of analytes |
| Chromatography Columns | C18, C8, phenyl, HILIC columns of various dimensions | Separation of analytes from matrix interferences |
| Sample Preparation Materials | Solid-phase extraction cartridges, 96-well plates, filtration units | Clean-up and concentration of samples prior to analysis |
| Mass Spectrometry Reagents | Stable isotope-labeled internal standards, calibration standards | Accurate quantification through isotope dilution methods |
| Mobile Phase Additives | LC-MS grade formic acid, ammonium acetate, acetonitrile, methanol | Optimal chromatographic separation and ionization efficiency |
| Quality Control Materials | Certified reference materials, quality control samples at multiple levels | Method validation and ongoing performance verification |
LC-MS/MS has firmly established itself as an indispensable technology for quantitative bioanalysis in pharmaceutical research and clinical applications. Its exceptional sensitivity, specificity, and versatility make it ideally suited for high-sensitivity PK/PD studies and therapeutic drug monitoring programs. The protocols and methodologies outlined in this application note provide a solid foundation for implementing robust LC-MS/MS methods that generate reliable, reproducible data to support critical decisions in drug development and patient care.
As pharmaceutical science continues to advance, with increasingly complex therapeutic modalities emerging, the role of LC-MS/MS in bioanalysis will only grow in importance. Future developments in instrumentation, particularly improvements in sensitivity, throughput, and data processing capabilities, will further enhance the application of LC-MS/MS in characterizing exposure-response relationships and optimizing therapeutic outcomes across diverse patient populations.
The structural complexity of monoclonal antibodies (mAbs), including post-translational modifications (PTMs) such as glycosylation, oxidation, and deamidation, contributes to highly heterogeneous variant patterns that define critical quality attributes (CQAs) impacting therapeutic safety and efficacy [35] [36]. Traditional offline analytical approaches for characterizing these variants face substantial limitations, including significant resource demands in time, material, and labor, along with risks of chromatographic resolution loss during upscaling and the potential introduction of method-related artifacts [35].
Multi-dimensional liquid chromatography coupled with mass spectrometry (mD-LC-MS) has emerged as a powerful alternative that streamlines characterization workflows through online fraction processing. This technique enables semi-automated, in-depth characterization of biopharmaceuticals by assessing chromatographically resolved product variants in a streamlined manner, allowing analysts to switch seamlessly between intact, subunit, and peptide mapping workflows [35]. The integration of analytical (U)HPLC methods into mD-LC-MS workflows without adaptation preserves chromatographic resolution and minimizes processing artifacts through minimal processing steps, short sample hold times, and fast online enzymatic digestion [35].
mD-LC-MS System Configuration and Principles
System Architecture and Hardware Extensions
Starting from a commercially available two-dimensional liquid chromatography (2D-LC) system, researchers have introduced specific hardware extensions to create versatile mD-LC-MS setups. The foundation typically includes Multiple Heart Cut (MHC) technology based on a 2-position/4-port duo-valve, which enables precise, closely spaced cuts by diverting flow from the first dimension into two parking decks, each holding multiple loops with volumes ranging from 10 μL to 180 μL [35]. These cuts are successively processed in subsequent dimensions.
To address solvent incompatibility between dimensions, Active Solvent Modulation (ASM) technology can be incorporated, allowing valve-based dilution to enhance characterization across a wide range of first-dimension methods [35]. System capabilities are further extended through the addition of multiple supplementary modules, typically including three additional pumps, two external 2-position 10-port valves, and two column heaters, bringing the total to three column heaters—all equipped with switching valves for comprehensive flow path management [35].
Software Integration and Control Systems
The complex hardware configuration necessitates sophisticated software control, often achieved by configuring a second instance of OpenLab CDS ChemStation software to host new modules alongside the original installation with integrated 2D-LC software [35]. This creates a setup akin to a second instrument, with the first instance managing first and fourth dimension pumps, UV DAD detection, and the MHC valve with connected loop decks, while the second instance controls all column ovens, valves, and second/third dimension pumps [35].
Custom-developed plugins bridge communication gaps between software instances and the mass spectrometer. A Valve Event Plug-In mediates communication between software instances and the MS via contact closure events, facilitating fine-tuning and scheduling of sequentially executed methods [35]. Additionally, a Solvent Selection Valve Switch plugin enables use of all four inlets of a binary pump during a run, increasing flexibility and reducing pump requirements in multi-stage experiments [35].
Experimental Protocols
Comprehensive mD-LC-MS Workflow for Charge Variant Analysis
The characterization of charge variants in therapeutic antibodies represents a key application of mD-LC-MS technology. The following protocol details a comprehensive workflow for analyzing charge variants of a bispecific antibody:
First-Dimension Separation: Employ cation exchange chromatography (CEX) under non-denaturing conditions to separate charge variants. Utilize a shallow salt gradient over 60 minutes to resolve acidic, main, and basic species. Maintain column temperature at 30°C with UV detection at 280 nm [35] [37].
Peak Identification and Cutting: Identify peaks of interest in the first-dimension chromatogram. Using MHC technology, generate precise cuts of target peaks with volumes optimized between 40-100 μL based on peak width and intensity. Transfer cuts to the designated parking loops for temporary storage [35].
Online Sample Processing: For peptide mapping applications, direct the stored cuts to an immobilized enzyme reactor (IMER) containing immobilized trypsin or other proteases. Maintain the IMER at 37°C with a reaction time of 5-8 minutes for efficient digestion. Alternatively, for subunit analysis, implement online reduction using tris(2-carboxyethyl)phosphine (TCEP) at 60°C for 5 minutes [35].
Second-Dimension Separation: Utilize reversed-phase chromatography with a C18 column (1.0 × 100 mm, 1.7 μm) maintained at 80°C. Employ a gradient of 0.1% formic acid in water (mobile phase A) and 0.1% formic acid in acetonitrile (mobile phase B) with a flow rate of 0.4 mL/min [35].
Mass Spectrometry Analysis: Couple the second-dimension separation directly to a high-resolution accurate mass (HRAM) mass spectrometer. For intact and subunit analysis, use ESI-MS with settings optimized for high molecular weight species. For peptide mapping, employ data-dependent MS/MS acquisition with collision-induced dissociation (CID) or higher-energy collisional dissociation (HCD) [35] [38].
Data Processing and Analysis: Process raw data using appropriate software platforms. For intact mass analysis, deconvolute spectra using maximum entropy algorithms. For peptide mapping, identify peptides and their modifications through database search algorithms, quantifying modifications based on extracted ion chromatograms [35] [39].
Multi-Attribute Method (MAM) for Comprehensive Quality Assessment
The Multi-Attribute Method (MAM) represents a significant advancement in biotherapeutic characterization, consolidating multiple quality assessments into a single LC-MS-based assay [39]. The protocol encompasses:
Sample Preparation: Perform buffer exchange into digestion-compatible buffer using spin filters or dialysis. Denature with guanidine hydrochloride and reduce with dithiothreitol (DTT) or TCEP. Alkylate with iodoacetamide. Digest with trypsin using immobilized enzyme cartridges or in-solution digestion at 37°C for 30-60 minutes [39] [40].
Liquid Chromatography: Separate peptides using reversed-phase UHPLC with a C18 column (2.1 × 150 mm, 1.7 μm) maintained at 50°C. Apply a gradient of 0.1% formic acid in water (mobile phase A) and 0.1% formic acid in acetonitrile (mobile phase B) over 90 minutes at 0.2 mL/min [39].
Mass Spectrometry Analysis: Acquire data using a high-resolution mass spectrometer with ESI source in positive ion mode. Implement data-independent acquisition (DIA) or data-dependent acquisition (DDA) with inclusion lists for targeted attributes. Set resolution to at least 35,000 for MS1 and 17,500 for MS2 scans [39] [40].
Data Processing: Process data using MAM-dedicated software capable of automatic peak identification, attribute quantification, and new peak detection (NPD). Identify peptides and modifications through accurate mass measurement and fragmentation patterns. Quantify attributes using extracted ion chromatograms of specific peptides and their modified forms [39].
Table 1: Key Attributes Monitored via mD-LC-MS in Biotherapeutic Characterization
| Attribute Category | Specific Attributes | Characterization Level | Impact on Product Quality |
|---|---|---|---|
| Glycosylation | G0F, G1F, G2F, Man5, afucosylation | Intact, Subunit, Peptide | Effector function, serum half-life, immunogenicity [36] [41] |
| Charge Variants | C-terminal lysine, deamidation, sialylation, succinimide | Intact, Peptide | Stability, biological activity, binding affinity [35] [37] |
| Size Variants | Aggregation, fragmentation, clipping | Intact, Subunit | Efficacy, immunogenicity, safety [42] [37] |
| Oxidation | Methionine, tryptophan oxidation | Subunit, Peptide | Stability, biological activity [38] [37] |
| Sequence Variants | Sequence mutations, clipping | Peptide | Potency, stability, immunogenicity [39] [40] |
Top-Down and Middle-Down MS Characterization
For comprehensive analysis without enzymatic digestion, top-down and middle-down approaches provide complementary information:
Top-Down Intact Analysis: Dilute mAb samples to 1 mg/mL in 0.1% formic acid. Perform LC separation using a reversed-phase column with a shallow gradient. Acquire MS data using high-resolution FT-MS with resolving power >100,000. Isolate single charge states for MS/MS analysis using electron capture dissociation (ECD) or collisionally activated dissociation (CAD) [38].
Middle-Down Subunit Analysis: Reduce interchain disulfide bonds using 10 mM TCEP at 60°C for 10 minutes. Separate light chains, heavy chains, and F(ab')2/Fc fragments using reversed-phase LC. Perform MS analysis with alternating ECD and CAD fragmentation. Achieve sequence coverage >44% at the subunit level for comprehensive characterization of modifications [38].
Results and Data Interpretation
Quantitative Performance of mD-LC-MS Systems
The accuracy and reproducibility of mD-LC-MS systems have been rigorously tested, demonstrating their effectiveness in identifying and quantifying underlying product species despite complex peak patterns in the first dimension [35]. In a case study characterizing charge variants of a bispecific antibody, both configurations of mD-LC-MS systems successfully identified product variants with comparable relative abundances, confirming system reliability [35].
Table 2: Performance Characteristics of mD-LC-MS Methods for mAb Characterization
| Performance Parameter | Top-Down MS | Middle-Down MS | Peptide Mapping (MAM) |
|---|---|---|---|
| Mass Accuracy | <10 ppm [41] | <5 ppm [38] | <1 ppm [39] |
| Sequence Coverage | 15-35% [38] | 44-76% [38] | >99% [39] [40] |
| Modification Detection | Major proteoforms, glycosylation [38] | Glycoforms, C-terminal processing [38] | Deamidation, oxidation, glycosylation, sequence variants [39] |
| Analysis Time | 15-30 minutes [41] | 45-60 minutes [38] | 90-120 minutes [39] |
| Reproducibility | <2% RSD [35] | <5% RSD [38] | <5% RSD [39] [40] |
Case Study: Charge Variant Characterization
In a representative study, mD-LC-MS was applied to characterize peaks from a cation exchange chromatography separation of a bispecific antibody [35]. The system isolated peaks of interest followed by online reduction, enzymatic digestion, and subsequent mass spectrometry analysis. The results demonstrated that despite complex peak patterns in the first dimension, the systems were equally effective in identifying and quantifying the underlying product species, highlighting the routine usability of mD-LC-MS technology for characterization of therapeutic biomolecules [35].
Glycoform Characterization and Monitoring
LC-MS analysis enables detailed characterization of glycoform distributions, a critical quality attribute for therapeutic antibodies. In one study, researchers monitored glycoform distributions during the production process and detected failure modes related to varied carbon source feeding regimes within 1-2 days [41]. The predominant glycoforms identified included G0F/G0F, G0F/G1F, and G1F/G1F, with mass errors less than 10 ppm, confirming precise and reliable classifications [41].
Essential Research Reagent Solutions
Successful implementation of mD-LC-MS workflows requires specific reagents and materials optimized for each step of the process:
Table 3: Essential Research Reagent Solutions for mD-LC-MS Characterization
| Reagent/Material | Function/Purpose | Application Notes |
|---|---|---|
| Immobilized Trypsin Cartridges | Online enzymatic digestion for peptide mapping | Enables fast, reproducible protein digestion with minimal autolysis; suitable for automation [35] [39] |
| UHPLC Columns (C18, 1.7-2.7 μm) | High-resolution separation of peptides, subunits, and intact proteins | Provides sharp peaks, maximal peak capacities, and low retention time variations [39] [41] |
| Cation Exchange Columns | First-dimension separation of charge variants | Enables separation under non-denaturing conditions; compatible with volatile buffers [35] [37] |
| PNGase F | Enzymatic deglycosylation for glycosylation analysis | Removes N-linked glycans; simplifies MS spectra for accurate mass determination [37] |
| Tris(2-carboxyethyl)phosphine (TCEP) | Reduction of disulfide bonds for subunit analysis | Superior stability and efficiency compared to DTT; compatible with LC-MS systems [38] |
| Mobile Phase Additives | MS-compatible buffers for optimal ionization | 0.1% formic acid provides optimal ionization; ammonium bicarbonate for native separations [35] [39] |
Workflow Visualization
The following diagram illustrates the comprehensive mD-LC-MS workflow for biotherapeutic characterization at multiple levels:
Diagram 1: Comprehensive mD-LC-MS Workflow for mAb Characterization. This diagram illustrates the integrated approach for analyzing therapeutic antibodies at intact, subunit, and peptide levels through multi-dimensional separation and mass spectrometry.
Multi-dimensional LC-MS systems represent a transformative approach for comprehensive characterization of therapeutic monoclonal antibodies, successfully addressing the limitations of traditional offline methods. The detailed protocols and system configurations presented enable seamless switching between intact, subunit, and peptide mapping workflows, providing researchers with a unified platform for in-depth biopharmaceutical analysis.
The implementation of mD-LC-MS technology, particularly when combined with Multi-Attribute Method principles, offers significant advantages for biotherapeutic development, including enhanced analytical precision, reduced resource requirements, and comprehensive monitoring of critical quality attributes. These advanced workflows support the biopharmaceutical industry's transition toward Quality by Design principles, enabling more efficient development and manufacturing of safe, effective therapeutic antibodies.
Impurity and degradant profiling is a critical discipline in pharmaceutical development, directly impacting drug safety, efficacy, and regulatory compliance. Modern drug development pipelines rely on advanced analytical technologies to identify and characterize even trace levels of impurities that may pose toxicological risks. The application of Liquid Chromatography-Mass Spectrometry (LC-MS) has become indispensable in this domain, providing the sensitivity, specificity, and structural elucidation capabilities required to meet stringent global regulatory standards [23].
Within pharmaceutical analysis workflows, LC-MS serves as a cornerstone technology for detecting, identifying, and quantifying organic impurities arising from synthesis, storage, or interactions with excipients. This application note details standardized protocols and practical frameworks for implementing comprehensive impurity profiling strategies aligned with current International Council for Harmonisation (ICH) guidelines and regional regulations, including recent updates from regulatory bodies like Brazil's Anvisa [43].
The Critical Role of Impurity Profiling
Defining Pharmaceutical Impurities
In pharmaceutical terms, impurities are chemical components that are unintentionally present in a drug substance or product and do not contribute to its therapeutic effect. According to ICH Q3A(R2) and Q3B(R2) guidelines, a drug substance impurity is "any component that is not the chemical entity defined as the drug substance," while a drug product impurity is "any component of the new drug product that is not the drug substance or an excipient" [44].
Impurities are systematically classified based on their origin into three primary categories:
- Process-related impurities: Associated with the synthesis of the drug substance, including starting materials, intermediates, and by-products.
- Degradation impurities: Formed due to the instability of the active pharmaceutical ingredient (API) under various environmental conditions.
- Contamination impurities: Extraneous substances not directly drug-related, such as leachables from packaging or residues from manufacturing equipment [44].
Regulatory Framework and Thresholds
Global regulatory agencies, including the FDA, EMA, and others, have established clear thresholds for impurity control based on estimated patient exposure. The ICH Q3A and Q3B guidelines define progressive thresholds that trigger specific actions as impurity levels increase [45] [44].
Table 1: ICH Impurity Thresholds for Drug Substances and Products
| Threshold Type | Definition | Required Action |
|---|---|---|
| Reporting Threshold | Level above which an impurity must be reported | Document presence in regulatory submission |
| Identification Threshold | Level above which an impurity must be identified | Establish chemical structure and origin |
| Qualification Threshold | Level above which an impurity must be qualified | Demonstrate biological safety through toxicological assessment |
Recent regulatory developments continue to emphasize stringent impurity control. For instance, Brazil's Anvisa RDC 964/2025, which replaced RDC 53/2015, introduces enhanced requirements for forced degradation studies, including additional oxidation tests and acceptance of scientific justifications for testing exemptions [43]. These evolving standards underscore the necessity for robust, scientifically sound impurity profiling strategies throughout the drug development lifecycle.
LC-MS in the Pharmaceutical Analysis Workflow
Liquid Chromatography-Mass Spectrometry (LC-MS) combines the physical separation capabilities of liquid chromatography with the mass analysis capabilities of mass spectrometry. This hyphenated technique provides unparalleled sensitivity and specificity for analyzing complex pharmaceutical mixtures. The key components of modern LC-MS systems include an autosampler, high-pressure liquid chromatography unit, ionization source, mass spectrometer, and detector [3] [23].
The significant advantage of LC-MS lies in its ability to separate, detect, and characterize compounds across diverse chemical spaces. Reversed-phase chromatography (RP-MS) is favored for most organic molecules, while hydrophilic interaction chromatography (HILIC-MS) and Ion Chromatography-Mass Spectrometry (IC-MS) extend capabilities to highly polar and ionic analytes that are poorly retained in reversed-phase systems [23]. This comprehensive coverage makes LC-MS ideal for impurity profiling where analytes vary widely in polarity and chemical structure.
High-Resolution Mass Spectrometry for Structural Elucidation
High-Resolution Mass Spectrometry (HRMS) has dramatically enhanced impurity identification capabilities by providing mass accuracy to a few parts per million (ppm), enabling distinction between compounds with nearly identical molecular weights [23]. The two primary HRMS technologies used in pharmaceutical analysis are:
- Orbitrap Analyzers: Offer superior resolving power (up to 1,000,000 FWHM) and exceptional mass accuracy (<1 ppm), ideal for untargeted metabolomics, lipidomics, and identification of isobaric species.
- Quadrupole Time-of-Flight (QTOF) Systems: Provide slightly lower resolution (typically 30,000–60,000 FWHM) but faster scan speeds and greater dynamic range, suitable for high-throughput screening and quantitative analysis [23].
The complementary strengths of these systems enable comprehensive impurity characterization, from initial detection to definitive structural identification, particularly when combined with complementary techniques such as Nuclear Magnetic Resonance (NMR) spectroscopy [46].
Experimental Protocols and Application Notes
A Framework for Impurity Standard Selection
The selection of appropriate impurity standards is fundamental to generating reliable analytical data. The following five-step framework ensures regulatory compliance and analytical validity [45]:
Define Your Objective: Determine whether the impurity standard is needed for R&D method development, metabolite identification, or QC batch release testing, as this dictates the required purity, form, and documentation.
Understand Regulatory Requirements: Align impurity standards with ICH Q3A/Q3B, USP monographs, and relevant EMA or FDA guidance to ensure global compliance and avoid costly re-validation.
Evaluate Certification & Traceability: Select ISO 17034 certified impurity standards with traceable Certificates of Analysis (COA) that provide validated data from HPLC, NMR, and mass spectrometry to confirm accuracy and reproducibility.
Assess Customization Needs: For impurities not available off-the-shelf, consider custom synthesis services for specialized standards such as peptide impurities, stable isotope-labeled standards, or novel degradation products.
Verify Supplier Reliability: Assess the supplier's catalog breadth, technical support, delivery timelines, and global logistics to ensure consistent supply chain continuity.
Forced Degradation Study Protocol
Forced degradation studies are essential for understanding the intrinsic stability of drug substances and products, identifying potential degradation pathways, and validating stability-indicating methods. The following protocol aligns with ICH Q1A(R2) and recent regulatory updates, including Anvisa RDC 964/2025 [43] [46].
Materials and Equipment
- API and drug product formulations
- Hydrogen peroxide (3-30%) for oxidative stress
- Hydrochloric acid (0.1-1N) and sodium hydroxide (0.1-1N) for acid/base hydrolysis
- Photostability chamber (ICH Q1B compliant)
- Stability chambers for thermal and humidity stress
- UHPLC/HPLC system with PDA detector
- LC-MS system (QTOF or Orbitrap recommended)
- NMR spectrometer (for structural elucidation)
Experimental Procedure
Sample Preparation: Prepare separate solutions of the drug substance (approximately 1 mg/mL) in appropriate solvents for each stress condition.
Stress Conditions Application:
- Acidic Hydrolysis: Expose sample to 0.1N HCl at room temperature for 24 hours or 60°C for 6-8 hours.
- Basic Hydrolysis: Expose sample to 0.1N NaOH at room temperature for 24 hours or 60°C for 6-8 hours.
- Oxidative Stress: Treat sample with 3% H₂O₂ at room temperature for 24 hours. Note: RDC 964/2025 now requires three oxidation tests: peroxide, metal, and auto-oxidation with radical initiators [43].
- Thermal Stress: Solid state: expose API to 70°C for 1-2 weeks. Solution state: heat at 60°C for 1-2 weeks.
- Humidity Stress: Expose solid API to 75% relative humidity at 25°C for 1-2 weeks.
- Photolytic Stress: Expose solid and solution samples to ICH Q1B conditions (minimum 1.2 million lux hours of visible light and 200 watt hours/m² of UV light).
Termination of Reactions: Neutralize acid/base hydrolysates immediately after stress period. Quench oxidative stress by adding excess ascorbic acid or methionine.
Analysis: Analyze stressed samples alongside appropriate controls using:
- Developed stability-indicating HPLC/UHPLC method
- LC-HRMS for degradant identification
- Supplementary techniques (2D NMR, FT-IR) for structural elucidation as needed
Data Interpretation: Identify degradation products, propose degradation pathways, and establish mass balance.
Diagram 1: Forced degradation study workflow for systematic drug stability assessment
Protocol for Unknown Impurity Identification
When unexpected impurities are detected during routine quality control testing, a structured identification approach must be implemented [44].
Initial Assessment
- Chromatographic Analysis: Using the validated QC method, determine the relative retention time and peak area/height of the unknown impurity.
- Threshold Evaluation: Compare the impurity level against ICH identification thresholds (typically 0.1-0.5% depending on daily dose) to determine if identification is required.
Structural Elucidation Workflow
- Sample Enrichment: If the impurity is present at low levels, consider scaling up preparations or using preparative chromatography to isolate sufficient material for characterization.
- LC-MS Analysis:
- Perform LC-HRMS analysis to determine accurate mass and elemental composition.
- Conduct MS/MS fragmentation studies to generate structural information.
- Compare fragmentation patterns with known compounds or databases.
- NMR Spectroscopy:
- For definitive structural confirmation, employ 1D NMR (¹H, ¹³C) and 2D techniques (COSY, HSQC, HMBC) as needed.
- The case of frovatriptan degradation products demonstrates the power of 2D NMR (COSY, HMBC, HMQC) for elucidating complex impurity structures [46].
- Synthesis of Proposed Structure: When possible, synthesize the proposed impurity standard to confirm identity through co-chromatography and spectral comparison.
Essential Research Reagent Solutions
Successful impurity profiling requires carefully selected reagents, standards, and instrumentation. The following table summarizes key solutions used in modern impurity profiling workflows.
Table 2: Essential Research Reagents and Materials for Impurity Profiling
| Category | Specific Examples | Function & Application |
|---|---|---|
| Certified Reference Standards | ISO 17034 certified impurity standards; Stable isotope-labeled standards | Provide traceable quantification and method validation; Enable precise LC-MS quantification through isotope dilution [45] |
| Chromatography Columns | C18 reversed-phase; HILIC; Ion-exchange | Separate diverse impurity classes based on polarity, charge, and molecular structure [23] |
| MS Calibration Solutions | Sodium formate clusters; ESI Tuning Mix | Calibrate mass accuracy and ensure precise m/z measurements throughout analyses |
| Stress Testing Reagents | Hydrogen peroxide; HCl/NaOH solutions; Radical initiators (e.g., AIBN) | Induce controlled degradation under oxidative, acidic, basic, and auto-oxidative conditions [43] [46] |
| Deuterated Solvents | D₂O; CD₃OD; DMSO-d6 | Enable NMR characterization of impurities without interfering solvent signals |
| Data Management Tools | Luminata; Zeneth | Consolidate and interpret forced degradation data; Predict potential degradation pathways [43] [47] |
Case Studies and Applications
Comprehensive Profiling of Baloxavir Marboxil
A recent comprehensive review of Baloxavir Marboxil (BXM) impurity profiling demonstrates the power of integrated analytical approaches. The study identified and characterized 5 metabolites, 12 degradation products, 14 chiral compounds, 40 process-related impurities, and 5 stable isotopes using LC-MS and related techniques. This extensive profiling supported the establishment of control strategies and specification limits aligned with regulatory requirements [48].
The investigation revealed BXM's metabolic pathway, identifying the active moiety Baloxavir acid (BXA) and four additional metabolites detected in plasma samples, including S-033447 glucuronide (16.4%) and S-033447 sulfoxide (1.5%) with its isomeric forms. Such comprehensive profiling is essential for understanding not just the impurity profile but also the metabolic fate of pharmaceutical compounds [48].
Frovatriptan Degradation Product Characterization
A 2025 study on frovatriptan exemplifies the application of advanced analytical techniques for novel impurity identification. When stability studies revealed three unknown degradation products in frovatriptan tablets, researchers employed an integrated approach using LC-HRMS/MS and 2D NMR to elucidate their structures [46].
The forced degradation study found that frovatriptan degrades under acidic, basic, oxidative, and thermal humidity conditions while remaining stable under photolytic stress. The identification of specific degradation products, including those formed through oxidative mechanisms, informed improved formulation strategies and storage conditions to enhance product shelf-life [46].
Diagram 2: Systematic workflow for unknown impurity identification and characterization
Effective impurity and degradant profiling represents a cornerstone of modern pharmaceutical quality systems, directly contributing to drug safety and efficacy. The integration of LC-MS technologies within structured analytical workflows provides the comprehensive data required to meet increasingly stringent global regulatory standards. The protocols and frameworks presented in this application note offer practical guidance for implementing robust impurity control strategies throughout the drug development lifecycle.
As regulatory expectations continue to evolve, as demonstrated by recent updates to forced degradation requirements in Anvisa RDC 964/2025, pharmaceutical scientists must maintain current knowledge of both analytical methodologies and compliance obligations [43]. The continued advancement of LC-MS technologies, particularly in high-resolution mass spectrometry and multidimensional separation techniques, promises to further enhance our ability to characterize even the most challenging impurities at increasingly lower thresholds, ultimately ensuring the quality and safety of pharmaceutical products for patients worldwide.
High-throughput screening (HTS) represents a foundational approach in modern drug discovery, enabling the rapid testing of hundreds of thousands of chemical compounds against biological targets [49]. The integration of Ultra-High-Performance Liquid Chromatography with Mass Spectrometry (UHPLC-MS) has revolutionized these analytical workflows by providing unparalleled speed, sensitivity, and specificity [50] [1]. This powerful hyphenated technique combines superior chromatographic separation capabilities with precise mass detection, making it indispensable for pharmaceutical analysis [23] [1]. Unlike traditional fluorescence-based assays that are susceptible to compound-dependent artefacts, UHPLC-MS offers a label-free detection method that significantly reduces false positives and accelerates the identification of genuine hits in drug discovery pipelines [49]. The application of UHPLC-MS within HTS frameworks has expanded the breadth of targets for which assays can be developed, particularly for unlabeled biomolecules, while providing more physiologically relevant data compared to competing technologies [49]. This application note details the implementation of UHPLC-MS in accelerated analytical workflows, providing specific methodologies and technical considerations for researchers in pharmaceutical development.
Fundamental Principles and Advantages
The evolution from HPLC to UHPLC-MS represents a significant technological advancement driven by the use of columns packed with particles smaller than 2 μm, which enables operation at pressures exceeding 1000 bar [50]. This fundamental improvement provides enhanced efficiency per unit time, with superior resolution, sensitivity, and speed compared to conventional HPLC systems [50]. UHPLC-MS leverages the Van Deemter equation principle, which establishes that chromatographic efficiency increases as particle size decreases, allowing for sharper peaks and faster analysis without compromising resolution [50].
The key advantages of UHPLC-MS in HTS environments include dramatically reduced analysis times (typically 2-5 minutes per sample), improved peak capacity, and significantly lower solvent consumption, making the technology both environmentally friendly and cost-effective [50] [1]. The mass spectrometry component provides highly selective detection based on mass-to-charge ratio (m/z) measurements, enabling the precise identification and quantification of analytes in complex matrices such as cell lysates, plasma, and other biological samples [49] [23]. This label-free detection capability is particularly valuable in HTS, as it eliminates the need for fluorescent or radioactive tags that can modify compound behavior or introduce artifacts [49].
Instrumentation and System Components
Modern UHPLC-MS systems for HTS incorporate several specialized components optimized for high-throughput applications. The chromatographic subsystem typically includes:
- Pumping Systems: Binary or quaternary solvent managers capable of delivering precise mobile phase compositions at ultra-high pressures up to 1000 bar [50] [51].
- Column Technologies: Specialized UHPLC columns including Charged Surface Hybrid (CSH), Ethylene-Bridged Hybrid (BEH), and High Strength Silica (HSS) particles that provide enhanced separation efficiency, peak shape, and loading capacity for diverse analytes [50].
- Sample Managers: Automated injectors with temperature-controlled sample compartments that enable rapid, precise injections with minimal carryover [51].
The mass spectrometry component typically employs electrospray ionization (ESI) or atmospheric pressure chemical ionization (APCI) sources, which efficiently transfer analytes from the liquid phase to the gas phase for mass analysis [49] [50]. For HTS applications, triple quadrupole (QQQ) mass analyzers operating in multiple reaction monitoring (MRM) mode are often preferred for targeted quantitative analysis, while quadrupole time-of-flight (Q-TOF) and Orbitrap systems provide high-resolution capabilities for untargeted screening applications [23] [1].
Recent advancements in UHPLC-MS interface design have focused on minimizing post-column dispersion, which can significantly degrade chromatographic performance. Innovative approaches include vacuum-jacketed columns for temperature control, reduced connection tubing dimensions, and integrated column heater designs that maintain separation efficiency while enabling faster analysis times [51].
Application in Drug Discovery Workflows
Biochemical and Functional Assays for Enzyme Targets
UHPLC-MS has become a powerful tool for identifying modulators of enzyme function in HTS campaigns [49]. For enzyme targets, inhibition or activation can be measured through direct quantification of substrate depletion or product formation without the need for labeled substrates [49]. This label-free approach is applicable to most enzyme targets provided a mass shift occurs between substrate and product molecules. The versatility of UHPLC-MS instrumentation allows analysis of diverse biomolecules including lipids, peptides, and metabolites from various matrix systems including blood, plasma, and cell lysates [49].
Specific HTS-MS platforms such as the RapidFire system operating in BLAZE mode enable extremely rapid cycling times of approximately 2.5 seconds per sample, making them particularly suitable for high-throughput enzymatic assays [49]. Alternative approaches including acoustic droplet ejection-open port interface (ADE-OPI) MS and desorption electrospray ionization (DESI)-MS have demonstrated capabilities approaching 10,000 reactions per hour, further pushing the boundaries of screening throughput [49]. The integration of ion mobility separation with HTS-capable mass spectrometers has expanded capabilities for challenging targets such as isomerases, enabling separation of complex and isobaric compounds that would be difficult to distinguish using traditional detection methods [49].
Cellular Phenotypic and Multiplexed Assays
Beyond biochemical assays, UHPLC-MS provides an exciting new tool for phenotypic screening in cell lines and primary cells [49]. The technology enables multiplexed readouts of cellular responses to compound treatment, including measurements of metabolic changes, post-translational modifications, and complex phenotypic endpoints [49]. Label-free MS assays in cellular systems are often more physiologically relevant than traditional assay technologies, providing a more comprehensive view of compound activity in biologically complex environments [49].
Cellular phenotypic assays using UHPLC-MS can monitor endogenous cellular processes without genetic manipulation or introduction of reporter constructs, thereby preserving native biology and reducing artificial system biases [49]. Applications include phosphoproteomics for signaling pathway analysis, thermal proteome profiling for target engagement studies, and limited proteolysis-MS for protein structural assessment directly in biological matrices [49]. These approaches provide rich datasets for understanding compound mechanism of action early in the discovery process, ultimately leading to higher quality hits and reduced attrition in later development stages.
Table 1: UHPLC-MS Applications in Drug Discovery Workflows
| Application Area | Key Measurements | Throughput Capabilities | Typical Assay Formats |
|---|---|---|---|
| Enzyme Inhibition/Activation | Substrate depletion, Product formation | RapidFire: 2.5 s/sample; DESI-MS: ~10,000 reactions/hour | Cell lysates, purified enzyme systems |
| Cellular Phenotypic Screening | Metabolic changes, Post-translational modifications, Protein expression | Varies with complexity; typically minutes per sample | Cell lines, primary cells, 3D culture systems |
| Target Engagement | Thermal stability shifts, Proteolytic patterns | Medium throughput; suitable for confirmation studies | Cell lysates, intact cells |
| ADME-Tox Screening | Metabolic stability, Metabolite identification, Reactive intermediate screening | High throughput with multiplexed capabilities | Hepatocytes, microsomes, plasma |
Experimental Protocols
Standardized UHPLC-MS Protocol for Enzyme Inhibition Screening
Objective: To identify small molecule inhibitors of a target enzyme through quantitative measurement of substrate-to-product conversion.
Materials and Reagents:
- Enzyme Source: Purified recombinant enzyme or relevant cell lysate
- Substrate: Native enzyme substrate at Km concentration
- Compound Library: Dissolved in DMSO with concentration typically ≤ 1% final assay concentration
- Reaction Buffer: Optimized for enzyme activity with appropriate pH and cofactors
- Quenching Solution: Appropriate solvent (e.g., acetonitrile with internal standard) to terminate reactions
- UHPLC Mobile Phases:
- Mobile Phase A: 0.1% formic acid in water
- Mobile Phase B: 0.1% formic acid in acetonitrile or methanol
Equipment:
- UHPLC system capable of pressures to 1000 bar
- Mass spectrometer with ESI source (triple quadrupole recommended for MRM)
- UHPLC column (e.g., CSH C18, 1.7 μm, 2.1 × 50 mm)
- Automated liquid handling system for compound addition
- Multi-well plates (96- or 384-well format)
- Plate centrifuge and sealing equipment
Procedure:
- Assay Preparation:
- Prepare substrate solution in reaction buffer at 2× final concentration
- Dispense 10 μL compound solution or DMSO control to appropriate wells
- Dilute enzyme in reaction buffer to 2× final concentration
Reaction Initiation and Incubation:
- Add 10 μL substrate solution to all wells using liquid handler
- Initiate reactions by adding 10 μL enzyme solution
- Seal plate and incubate at appropriate temperature for predetermined time (typically 30-60 minutes)
Reaction Termination:
- Add 60 μL quenching solution (ice-cold acetonitrile with internal standard) to all wells
- Seal plate and mix thoroughly
- Centrifuge at 4000 × g for 15 minutes to precipitate proteins
UHPLC-MS Analysis:
- Transfer supernatant to UHPLC-compatible plates
- Inject 1-5 μL onto UHPLC-MS system
- Employ fast gradient separation: 5-95% B over 1.5 minutes at 0.6 mL/min
- Monitor substrate and product using MRM transitions optimized for each analyte
- Use internal standard for normalization of injection variability
Data Analysis:
- Quantify peak areas for substrate and product in each sample
- Calculate enzyme activity as product formed per unit time
- Determine percentage inhibition relative to DMSO controls
- Apply appropriate statistical thresholds for hit identification (typically >3 standard deviations from mean control activity)
Sample Preparation Techniques for HTS
Efficient sample preparation is critical for successful UHPLC-MS analysis in HTS formats. The most common techniques include:
Solid Phase Extraction (SPE):
- Procedure: Condition sorbent with solvent, load sample, wash to remove impurities, elute analytes with stronger solvent [52]
- Advantages: Effective purification and concentration; amenable to automation; superior recovery for complex matrices [52]
- Applications: Urine, blood, food samples with complex matrices [52]
Protein Precipitation:
- Procedure: Add precipitating agent (acetonitrile, methanol, or trichloroacetic acid) to biological sample, incubate, centrifuge, collect supernatant [52]
- Advantages: Simple, rapid, effective for high protein content samples; improves analysis of small molecules [52]
- Applications: Plasma, serum, and other protein-rich biological fluids [52]
Liquid-Liquid Extraction (LLE):
- Procedure: Mix sample with immiscible solvents, separate phases, collect organic phase containing analytes [52]
- Advantages: Efficient for non-polar/moderately polar compounds; removes water-soluble interferences [52]
- Applications: Biological fluids for non-polar analyte extraction [52]
Automation of these sample preparation techniques using robotic liquid handlers significantly enhances reproducibility, throughput, and efficiency while reducing contamination risks in HTS workflows [52].
Essential Research Reagents and Materials
Table 2: Key Research Reagent Solutions for UHPLC-MS HTS Workflows
| Reagent/Material | Function/Purpose | Application Notes |
|---|---|---|
| CSH C18 UHPLC Columns | Chromatographic separation of analytes | Excellent peak shape for basic compounds; enhanced loading capacity [50] |
| BEH Technology Columns | Separation of diverse compound classes | Extended pH stability (1-12); robust for high-throughput applications [50] |
| HSS T3 Columns | Retention of polar compounds | Specifically designed for small water-soluble molecules; improved retention [50] |
| Formic Acid (0.1%) | Mobile phase modifier | Enhances ionization in positive ESI mode; improves chromatographic peak shape [50] |
| Ammonium Acetate/Formate | Volatile buffers | Provides buffering capacity without MS signal suppression; compatible with ESI [50] |
| Precipitating Solvents | Protein removal from biological samples | Acetonitrile, methanol, or trichloroacetic acid for efficient protein precipitation [52] |
| SPE Cartridges | Sample clean-up and concentration | Selective extraction of analytes from complex matrices; reduces ion suppression [52] |
Technical Considerations and Optimization Strategies
Chromatographic Optimization for Throughput
Maximizing throughput in UHPLC-MS methods requires careful optimization of chromatographic parameters. Key considerations include:
- Column Selection: Short columns (30-50 mm) packed with sub-2μm particles provide rapid separations while maintaining sufficient resolution for most HTS applications [50] [51].
- Gradient Optimization: Steep gradients (typically 1-2 minutes total run time) with ballistic initial gradients can focus analytes at the column head, improving peak shape and sensitivity [51].
- Flow Rate Considerations: Higher flow rates (0.6-1.0 mL/min for 2.1 mm ID columns) reduce cycle times but may impact ionization efficiency; post-column splitting can mitigate this effect when necessary [51].
- Column Temperature: Elevated temperatures (50-60°C) reduce mobile phase viscosity, allowing higher flow rates at lower backpressures while maintaining efficiency [51].
Advanced UHPLC systems incorporating vacuum-jacketed columns and post-column eluent heating effectively minimize detrimental radial temperature gradients and reduce peak broadening, thereby preserving the separation efficiency achieved on-column [51]. These technical improvements can double the peak capacity compared to conventional UHPLC-MS systems, significantly enhancing the ability to resolve complex mixtures in shortened analysis times [51].
Mass Spectrometric Detection Parameters
Optimization of MS detection parameters is equally critical for successful HTS implementation:
- Ion Source Settings: Electrospray voltage, source temperature, and desolvation gas parameters must be optimized for specific analyte classes and flow rates [50] [51].
- Acquisition Modes: Multiple reaction monitoring (MRM) on triple quadrupole instruments provides superior sensitivity and selectivity for targeted quantification, while data-independent acquisition (DIA) methods on high-resolution instruments enable untargeted screening with retrospective data analysis [49] [23].
- Dwell Times: Minimal dwell times (as low as 3 ms) can be employed when monitoring limited MRM transitions, enabling precise quantification even with very narrow chromatographic peaks [51].
- Resolution Settings: Balancing resolution with acquisition speed on high-resolution instruments; lower resolution settings may be appropriate for high-throughput quantitation to maintain adequate data points across chromatographic peaks [23].
Data Analysis and Hit Selection Approaches
Advanced data analysis strategies are essential for effective hit identification in HTS campaigns. Cluster-based enrichment methods have demonstrated significant improvements in confirmation rates compared to traditional "top X" approaches based solely on activity level [53]. These methods leverage chemical similarity between compounds, with clusters scored for enrichment of candidate hits using statistical tests such as Fisher's exact test [53]. Implementation of such approaches has demonstrated improvements in confirmation rates exceeding 30% compared to activity-based selection alone [53].
Key considerations for cluster-based hit selection include:
- Cluster Size Optimization: Moderately sized clusters provide sufficient power for enrichment detection while maintaining chemical similarity [53].
- Activity Thresholds: Relatively low activity thresholds for candidate hits increase power to detect cluster enrichment while managing false positive rates [53].
- Ranking Methods: Clusters should be ranked by enrichment odds ratio rather than p-value for optimal hit prioritization [53].
Workflow Integration and Visualization
The implementation of UHPLC-MS within high-throughput screening workflows involves a coordinated sequence of steps from assay design through hit confirmation. The following diagram illustrates the integrated workflow:
Diagram 1: UHPLC-MS HTS workflow from assay design to hit confirmation
The sample preparation and analysis workflow can be further detailed as follows for enzymatic HTS assays:
Diagram 2: Detailed enzymatic HTS sample processing workflow
UHPLC-MS has established itself as a transformative technology in high-throughput screening, enabling accelerated analytical workflows that generate high-quality data with unprecedented speed and efficiency. The label-free nature of MS detection reduces artifacts common in traditional assay technologies, while the versatility of the approach supports diverse applications from enzymatic assays to complex phenotypic screens. Implementation of optimized UHPLC-MS methods with cycle times of 2-3 minutes per sample enables true HTS capabilities without compromising data quality. When combined with advanced hit selection approaches such as cluster-based enrichment analysis, confirmation rates can be significantly improved compared to traditional activity-based methods. As instrumentation continues to evolve with improvements in sensitivity, speed, and automation, UHPLC-MS will undoubtedly expand its role as a cornerstone technology in pharmaceutical discovery workflows.
Maximizing Data Quality: Practical Strategies to Overcome LC-MS Challenges
Ion suppression is a prevalent form of matrix effect in Liquid Chromatography-Mass Spectrometry (LC-MS) that adversely impacts key analytical figures of merit, including detection capability, precision, and accuracy [54]. This phenomenon occurs when co-eluting matrix components interfere with the ionization efficiency of target analytes in the LC-MS interface [54] [55]. Despite the exceptional sensitivity and selectivity of modern MS instrumentation, ion suppression remains a critical challenge for researchers, scientists, and drug development professionals working with complex biological matrices in pharmaceutical analysis [54] [56].
The persistence of ion suppression effects stems from the complex nature of pharmaceutical samples, which often contain numerous endogenous compounds that can co-elute with analytes of interest [55]. Even with advanced mass analyzers, these interfering compounds can significantly reduce ionization efficiency, leading to compromised data quality and potentially misleading results in drug development workflows [54] [56]. Understanding the root causes, detection methods, and mitigation strategies for ion suppression is therefore essential for maintaining robust and reliable bioanalytical methods in pharmaceutical research and development.
Root Causes and Mechanisms of Ion Suppression
Fundamental Mechanisms
Ion suppression occurs in the early stages of the ionization process within the LC-MS interface when co-eluting compounds negatively influence the ionization efficiency of target analytes [54]. The mechanisms differ significantly between the two primary atmospheric-pressure ionization techniques: electrospray ionization (ESI) and atmospheric-pressure chemical ionization (APCI) [54].
In electrospray ionization (ESI), the predominant mechanisms include:
- Charge Competition: ESI operates with limited excess charge available on droplets. At high concentrations (>10⁻⁵ M), competition for this limited charge occurs between analytes and matrix components, leading to signal saturation and suppression [54].
- Surface Activity Interference: Compounds with high surface activity and basicity can out-compete target analytes for positions at the droplet surface, inhibiting the ejection of ions trapped inside the droplets [54].
- Droplet Property Modification: High concentrations of interfering compounds can increase droplet viscosity and surface tension, reducing solvent evaporation rates and the ability of analytes to reach the gas phase [54].
- Non-Volatile Material Effects: Non-volatile materials can decrease droplet formation efficiency through coprecipitation with analytes or by preventing droplets from reaching the critical radius required for gas-phase ion emission [54].
In atmospheric-pressure chemical ionization (APCI), suppression mechanisms differ:
- Charge Transfer Interference: Matrix components can affect the efficiency of charge transfer from the corona discharge needle [54].
- Solid Formation: Analytes may form pure solids or coprecipitates with other non-volatile sample components during the vaporization process, preventing efficient ionization [54].
APCI typically experiences less pronounced ion suppression compared to ESI due to fundamental differences in their ionization mechanisms, particularly the absence of charge competition and droplet processes [54].
The origins of ion suppression can be categorized into two main classes:
- Endogenous Compounds: These include organic or inorganic molecules naturally present in sample matrices, such as phospholipids, bile salts, and urea in biological fluids [54] [55].
- Exogenous Substances: Compounds introduced during sample preparation, including polymers extracted from plastic tubes, ion-pairing agents, mobile phase additives, and alkaline buffers [54] [55].
Table 1: Common Sources of Ion Suppression in Pharmaceutical Analysis
| Source Category | Specific Examples | Analytical Impact |
|---|---|---|
| Endogenous Compounds | Phospholipids, bile salts, urea, organic acids, salts | High concentration in biological matrices; varies between samples |
| Exogenous Substances | Plasticizers (from tubes), ion-pairing reagents, mobile phase additives (e.g., formic acid) | Introduced during sample preparation; can be controlled |
| Sample Preparation | Protein precipitation residues, insufficient clean-up | Incomplete removal of matrix interferents |
| Chromatographic Factors | Co-elution of matrix components, short run times, inadequate separation | Primary cause; related to separation quality |
Detection and Evaluation Methods
Experimental Protocols for Identifying Ion Suppression
The US Food and Drug Administration's Guidance for Industry on Bioanalytical Method Validation requires assessment of matrix effects to ensure that precision, selectivity, and sensitivity remain uncompromised [54] [55]. Two well-established experimental protocols exist for detecting and evaluating ion suppression.
Post-Column Analyte Infusion Method
This comprehensive approach provides a chromatographic profile of ionization suppression [54] [57]:
PROTOCOL: Post-Column Infusion for Ion Suppression Mapping
- Setup: Connect a syringe pump containing a standard solution of the analyte of interest (typically at a concentration of 10-100 ng/mL) to a tee union positioned between the HPLC column outlet and the MS interface.
- Infusion: Activate the syringe pump to provide continuous post-column infusion of the analyte at a constant flow rate (typically 5-20 μL/min).
- Chromatography: Inject a blank prepared sample extract (e.g., processed plasma without analyte) onto the LC system using the intended chromatographic method.
- Detection: Monitor the multiple reaction monitoring (MRM) channel for the analyte throughout the chromatographic run.
- Interpretation: A constant baseline indicates no suppression. Dips or reductions in the baseline signal indicate regions where co-eluting matrix components cause ion suppression.
This method visually reveals the retention time windows affected by ion suppression, enabling targeted method improvements [54].
Post-Extraction Spiking Method
This quantitative approach evaluates the extent of ion suppression [54] [55]:
PROTOCOL: Post-Extraction Spike for Suppression Quantification
- Sample Preparation: Process blank matrix samples (e.g., plasma, urine) using the intended sample preparation method.
- Spiking: Spike the analyte of interest at known concentrations (typically low, medium, and high QC levels) into the processed blank samples.
- Comparison Standards: Prepare equivalent concentration standard solutions in pure mobile phase or solvent.
- Analysis: Analyze both the spiked matrix samples and the neat standards using the LC-MS method.
- Calculation: Calculate the ion suppression effect using the formula: Ion Suppression (%) = [1 - (Area of spiked sample / Area of standard solution)] × 100
Significant reduction in the analyte signal in the spiked matrix compared to the standard solution indicates ion suppression [54] [55].
Quantitative Assessment of Ion Suppression Effects
The extent of ion suppression can be quantified using the approach initially described by Buhrman and coworkers [54]: Ion Suppression = (100 - B)/(A × 100) Where A represents the unsuppressed signal and B represents the suppressed signal.
Table 2: Interpretation of Ion Suppression Evaluation Results
| Result | Interpretation | Recommended Action |
|---|---|---|
| < 20% Suppression | Minimal matrix effect | Method may be acceptable without modification |
| 20-50% Suppression | Moderate matrix effect | Consider method improvements to enhance robustness |
| > 50% Suppression | Severe matrix effect | Method modification required; results may be unreliable |
| Highly Variable Suppression | Unacceptable for precision | Fundamental method re-development needed |
Advanced Mitigation Strategies
Chromatographic Approaches
Chromatographic separation optimization represents one of the most effective strategies for mitigating ion suppression by physically separating analytes from interfering matrix components [56] [55].
Strategy 1: Modified Retention and Selectivity
- Adjust Gradient Programs: Extend shallow gradient segments to improve resolution in critical regions where suppression occurs [55].
- Alternative Stationary Phases: Utilize different selectivity columns (e.g., phenyl-hexyl, pentafluorophenyl) to alter retention patterns of both analytes and interferents [55].
- Mobile Phase Optimization: Employ volatile buffers (ammonium acetate, ammonium formate) instead of non-volatile additives; adjust pH to modify ionization and retention characteristics [56].
Strategy 2: Two-Dimensional Liquid Chromatography (2D-LC) Advanced 2D-LC systems can significantly reduce ion suppression by providing orthogonal separation mechanisms [58]. A recent application demonstrated successful resolution of perfluorobutanoic acid (PFBA) from isomeric matrix components in complex tomato extracts, eliminating quantification interferences observed with conventional LC-MS [58].
Strategy 3: Microflow and Nanoflow LC Reducing chromatographic flow rates to microflow (1-50 μL/min) or nanoflow (<1 μL/min) ranges can enhance sensitivity and reduce ion suppression through improved desolvation efficiency and smaller droplet formation [56] [57].
Sample Preparation Techniques
Comprehensive sample cleanup remains a cornerstone approach for eliminating ion suppression at its source [56] [55].
Table 3: Sample Preparation Methods for Ion Suppression Reduction
| Technique | Mechanism | Effectiveness | Application Notes |
|---|---|---|---|
| Solid Phase Extraction (SPE) | Selective retention of analytes or interferents | High | Method development critical for selectivity; can target specific interferent classes |
| Liquid-Liquid Extraction (LLE) | Partitioning based on solubility differences | Moderate to High | Effective for non-polar analytes; may require pH adjustment |
| Protein Precipitation | Protein denaturation and removal | Low to Moderate | Simple but incomplete cleanup; may leave phospholipids |
| Phospholipid Removal | Selective sorbents for phospholipids | High for phospholipids | Targeted approach for major biological interferents |
| Dilution | Reduction of absolute matrix load | Low to Moderate | Simple but reduces analyte concentration; limited utility |
Instrumental and Ionization Source Modifications
Strategic adjustments to instrumental parameters and ionization sources can substantially reduce susceptibility to ion suppression effects.
Ion Source Selection and Optimization:
- Source Type Selection: APCI sources typically demonstrate reduced ion suppression compared to ESI for small molecules and should be considered when analyte properties permit [54] [57].
- Source Parameter Optimization: Regular cleaning and optimization of source parameters (gas flows, temperatures, voltages) maintain consistent ionization efficiency and reduce suppression [56].
- Ionization Mode Switching: Evaluating alternative ionization modes (e.g., negative vs. positive mode) may reduce suppression, as fewer compounds ionize in negative mode [54].
Novel Injection Techniques: The recently developed "feed injection" technique enables increased injection volumes (10-fold higher in demonstrated applications) without compromising chromatographic performance, thereby improving sensitivity while managing matrix effects [58].
Advanced Chemical and Computational Approaches
Stable Isotope-Labeled Internal Standards
The use of stable isotope-labeled internal standards (SIL-IS) represents the gold standard for compensating ion suppression effects in quantitative bioanalysis [59] [57]. These compounds experience nearly identical suppression as their native analogs but are distinguished by mass shift, enabling accurate quantification through response ratio normalization [57].
IROA TruQuant Workflow
A groundbreaking recent advancement in non-targeted metabolomics is the IROA (Isotopic Ratio Outlier Analysis) TruQuant workflow, which uses a stable isotope-labeled internal standard library and companion algorithms to measure and correct for ion suppression [59]. This approach:
- Utilizes a 13C-labeled internal standard (IROA-IS) and long-term reference standard (IROA-LTRS)
- Creates a unique, formula-specific isotopolog ladder for each metabolite
- Enables mathematical correction of ion suppression effects across all detected metabolites
- Has demonstrated effectiveness across multiple chromatographic systems (IC, HILIC, RPLC) and ionization modes [59]
This workflow successfully corrected ion suppression ranging from 1% to >90% across diverse analytical conditions, representing a significant advancement for non-targeted analyses where traditional internal standardization is impractical [59].
The Scientist's Toolkit: Essential Research Reagents and Materials
Table 4: Key Research Reagent Solutions for Ion Suppression Management
| Reagent/Material | Function | Application Notes |
|---|---|---|
| Stable Isotope-Labeled Internal Standards | Compensation of ion suppression via mass differentiation | Critical for quantitative accuracy; should be added early in sample preparation |
| IROA Internal Standard Library | Comprehensive suppression correction in non-targeted workflows | Enables ion suppression correction across entire metabolome |
| Phospholipid Removal Plates | Selective removal of major biological interferents | Targeted cleanup for biological matrices |
| Mixed-Mode SPE Sorbents | Multi-mechanism retention for enhanced selectivity | Simultaneous reversed-phase and ion-exchange mechanisms |
| Volatile Mobile Phase Additives | MS-compatible separation without residual suppression | Ammonium formate/acetate instead of phosphate buffers |
| High-Purity Solvents | Reduction of chemical noise and background interference | LC-MS grade solvents essential for sensitivity |
Workflow and Strategic Decision-Making
The following workflow diagram outlines a systematic approach to addressing ion suppression in pharmaceutical LC-MS methods:
Systematic Approach to Ion Suppression Management
Ion suppression remains a significant challenge in LC-MS based pharmaceutical analysis, particularly when analyzing complex biological matrices. Successful management requires a systematic approach beginning with comprehensive detection and evaluation, followed by implementation of appropriate mitigation strategies tailored to the specific analytical context. The continued advancement of techniques such as the IROA TruQuant workflow, two-dimensional chromatography, and sophisticated stable isotope labeling methods provides powerful tools for overcoming this persistent analytical obstacle. By implementing the protocols and strategies outlined in this application note, researchers can significantly improve the reliability, accuracy, and sensitivity of their LC-MS methods, thereby enhancing the quality of pharmaceutical research and development outcomes.
In the pharmaceutical analysis workflow, liquid chromatography-mass spectrometry (LC-MS) has become an indispensable technique due to its exceptional sensitivity and specificity for quantifying drugs and metabolites in biological matrices [18]. However, the accuracy and reproducibility of LC-MS methods are critically compromised by matrix effects (ME), a phenomenon where co-eluting components from the sample matrix alter the ionization efficiency of target analytes [60]. Matrix effects represent the combined influence of all sample components other than the analyte on its measurement, potentially causing either ionization suppression or enhancement [61] [60]. This interference is particularly problematic in complex matrices such as plasma, serum, and whole blood, where phospholipids—major components of cell membranes—are notorious for causing ion suppression and fouling the MS source [62] [63].
The impact of unaddressed matrix effects extends beyond mere signal alteration; it detrimentally affects key validation parameters including precision, accuracy, linearity, and limits of quantification [60]. For pharmaceutical researchers and drug development professionals, mitigating these effects is not optional but a fundamental requirement for generating reliable bioanalytical data that supports pharmacokinetic studies, therapeutic drug monitoring, and regulatory submissions. This application note explores targeted sample preparation strategies, with emphasis on advanced solid-phase extraction (SPE) techniques and other complementary approaches, to effectively overcome matrix effects in LC-MS analysis of pharmaceutical compounds.
Understanding and Assessing Matrix Effects
The Mechanism of Matrix Effects in LC-MS
Matrix effects primarily occur in the ion source of the mass spectrometer when non-volatile or semi-volatile matrix components co-elute with the target analytes, competing for charge and access to the droplet surface during the ionization process [60]. In electrospray ionization (ESI), which occurs in the liquid phase, this competition is particularly pronounced as matrix components can affect the efficiency of charged analyte transfer to the gas phase [62] [60]. Phospholipids present in biological samples like plasma and serum are among the most significant contributors to matrix effects because they typically co-extract with analytes during sample preparation and often elute in similar chromatographic timeframes [62]. These interferences not only cause diminished, augmented, and irreproducible analyte response but also reduce HPLC column lifetime and necessitate excessive gradient elution for system cleaning [62].
Evaluation Methods for Matrix Effects
Before optimizing sample preparation protocols, researchers must first assess the presence and extent of matrix effects. Several established methodologies exist for this purpose, each providing complementary information about sample preparation efficacy.
Table 1: Methods for Evaluating Matrix Effects in LC-MS
| Method Name | Description | Output | Limitations | References |
|---|---|---|---|---|
| Post-Column Infusion | Continuous infusion of analyte standard during LC separation of blank matrix extract | Qualitative assessment of ion suppression/enhancement regions across chromatographic run | Does not provide quantitative results; labor-intensive for multi-analyte methods | [60] |
| Post-Extraction Spike | Comparison of analyte response in pure solution versus blank matrix extract spiked with same analyte concentration | Quantitative measurement of matrix effect at specific concentration | Requires availability of appropriate blank matrix | [60] |
| Slope Ratio Analysis | Comparison of calibration curves from matrix-matched standards and pure standards across concentration range | Semi-quantitative assessment of matrix effects over entire calibration range | Only semi-quantitative results | [60] |
The post-column infusion method, first described by Bonfiglio et al., offers particularly valuable qualitative information for method development [60]. This approach involves injecting a blank matrix extract while continuously infusing the analyte of interest post-column. Signal suppression or enhancement observed in the resulting chromatogram pinpoints retention time windows where matrix effects are most pronounced, guiding subsequent optimization of chromatographic separation or sample clean-up procedures.
Sample Preparation Techniques for Matrix Reduction
Targeted Matrix Isolation: Phospholipid Depletion Techniques
Principle and Mechanism: The targeted matrix isolation approach focuses on selectively removing specific interfering components from the sample matrix while allowing target analytes to remain in solution [62]. For biological samples, specialized sorbents have been developed to specifically capture phospholipids, which are major contributors to matrix effects in plasma and serum analysis. HybridSPE-Phospholipid technology utilizes zirconia-coated silica particles that leverage Lewis acid/base interactions between the electron-deficient zirconia d-orbitals and the electron-rich phosphate groups of phospholipids [62]. This mechanism enables highly selective phospholipid removal without significant loss of target analytes.
Experimental Protocol: HybridSPE-Phospholipid Depletion:
- Device Preparation: Select appropriate HybridSPE format (96-well plate or cartridge) based on throughput requirements.
- Sample Preparation: Add plasma or serum sample to the HybridSPE device.
- Protein Precipitation: Add precipitation solvent (e.g., acetonitrile or methanol) in a 3:1 ratio (solvent:sample) to the well or cartridge.
- Mixing: Vortex or perform draw-dispense mixing for 30-60 seconds to ensure complete protein precipitation.
- Filtration: Apply positive pressure (for plates) or vacuum (for cartridges) to pass the solution through the sorbent bed.
- Collection: Collect the eluent, which now contains analytes with significantly reduced phospholipid content.
- Analysis: Inject directly or with appropriate dilution/concentration for LC-MS analysis.
Performance Data: Application of this technique demonstrates remarkable efficiency in phospholipid removal. As shown in Figure 2, plasma samples processed using standard protein precipitation exhibit direct overlap of phospholipids with target analytes, resulting in significantly reduced analyte response. In contrast, HybridSPE-phospholipid processed samples show dramatic reduction in phospholipid interference and concurrent increase in analyte signal intensity [62]. Quantitative assessment reveals that protein precipitation alone can cause up to 75% reduction in response for compounds like propranolol due to phospholipid matrix interference, while the HybridSPE approach restores response with significantly improved reproducibility [62].
Targeted Analyte Isolation: Solid-Phase Extraction
Principle and Mechanism: Solid-phase extraction operates on the principle of retaining target analytes on a selective sorbent while washing away matrix interferences, followed by elution of purified analytes [64] [65]. The fundamental mechanism involves differential affinity between analytes, matrix components, and the stationary phase based on hydrophobic, polar, or ionic interactions. SPE can be performed in either a load-wash-elute mode (retaining analytes) or a pass-through mode (retaining interferences) [65].
Experimental Protocol: Conventional SPE for Plasma Samples:
Sorbent Selection: Choose appropriate sorbent chemistry based on analyte properties:
- Oasis HLB: Hydrophilic-lipophilic balanced copolymer for acids, bases, and neutrals
- Oasis MCX: Mixed-mode cation exchange for basic compounds
- Oasis MAX: Mixed-mode anion exchange for acidic compounds
- C18 or C8: Reversed-phase for hydrophobic compounds [65]
Conditioning: Pre-wet the sorbent bed with 2-3 column volumes of methanol followed by 2-3 volumes of water or buffer to activate the sorbent.
Sample Loading: Apply pre-treated sample (e.g., diluted or protein-precipitated) to the cartridge under controlled flow rate (1-2 mL/min).
Washing: Remove weakly retained interferences with 2-3 column volumes of wash solution (typically 5-20% organic solvent in water or buffer).
Drying: Centrifuge or apply vacuum for 1-2 minutes to remove residual wash solvent.
Elution: Recover target analytes with 2-3 column volumes of strong elution solvent (typically 50-100% organic modifier with appropriate pH adjustment).
Reconstitution: Evaporate eluent under nitrogen or vacuum and reconstitute in LC-MS compatible solvent.
Protocol Evaluation: Successful SPE method development requires optimization based on three key parameters [65]:
- % Recovery: Measure by comparing analyte response from extracted samples versus non-extracted standards.
- Matrix Effect: Assess using post-extraction spike method to quantify ion suppression/enhancement.
- Mass Balance: Ensure total analyte accountability across all fractions.
Alternative and Complementary Techniques
Protein Precipitation: The simplest sample clean-up approach involves denaturing and precipitating proteins using organic solvents (acetonitrile, methanol), acids, or salts [64]. While effective for protein removal, this method leaves many small molecule interferences, including phospholipids, in solution [62] [61].
Liquid-Liquid Extraction: This technique separates analytes based on differential solubility between immiscible solvents, typically an organic and aqueous phase [64]. LLE efficiently removes water-soluble matrix components but may not effectively separate analytes from non-polar interferences.
Solid Supported Liquid-Liquid Extraction: SLE simplifies the LLE process by supporting the aqueous phase on a diatomaceous earth surface, facilitating efficient partitioning into the organic phase without emulsion formation [66].
Biocompatible Solid Phase Microextraction: A novel approach utilizing SPME fibers with C18-modified silica particles in a biocompatible binder that selectively concentrates analytes while excluding larger biomolecules [62]. This technique simultaneously performs sample cleanup and concentration without co-extraction of matrix components.
Table 2: Comparison of Sample Preparation Techniques for Matrix Effect Reduction
| Technique | Principle | Phospholipid Removal Efficiency | Recovery (%) | Throughput | Best Applications |
|---|---|---|---|---|---|
| Protein Precipitation | Protein denaturation with organic solvents | Low | High (>95) | High | High-throughput screening with less concern about matrix effects |
| Liquid-Liquid Extraction | Partitioning between immiscible solvents | Moderate | Variable (60-90) | Medium | Non-polar to moderately polar compounds |
| Conventional SPE | Selective retention on functionalized sorbents | High (dependent on sorbent) | High (80-100) | Medium-high | Targeted analysis requiring high sensitivity |
| HybridSPE-Phospholipid | Selective phospholipid complexation | Very High | High (>90) | High | Biological fluids where phospholipids are primary concern |
| BioSPME | Equilibrium partitioning to coated fiber | High | Moderate-High (70-95) | Medium | Limited sample volume, multiple extractions from same sample |
Integrated Workflow for Matrix Effect Mitigation
Implementing an effective strategy for matrix effect reduction requires a systematic approach that combines appropriate sample preparation with analytical best practices. The following diagram illustrates the decision pathway for selecting and optimizing sample preparation techniques based on analytical requirements and matrix complexity:
Figure 1: Decision pathway for matrix effect mitigation strategies in LC-MS bioanalysis, adapted from current literature [60].
The Scientist's Toolkit: Essential Research Reagents and Materials
Successful implementation of matrix reduction strategies requires appropriate selection of research reagents and materials. The following table details key solutions for effective sample preparation in pharmaceutical LC-MS analysis:
Table 3: Essential Research Reagents and Materials for Matrix Effect Reduction
| Tool/Reagent | Function/Application | Selection Criteria | Example Products |
|---|---|---|---|
| HybridSPE-Phospholipid | Selective depletion of phospholipids from biological samples | Format (96-well, cartridge), sample capacity | Sigma-Aldrich HybridSPE [62] |
| Oasis HLB Sorbent | Hydrophilic-lipophilic balanced extraction of acids, bases, neutrals | Particle size, well format, capacity | Waters Oasis HLB [65] |
| Mixed-mode SPE Sorbents | Enhanced selectivity for ionizable compounds via mixed mechanisms | pH stability, selectivity requirements | Oasis MCX, MAX, WCX, WAX [65] |
| BioSPME Fibers | Microextraction with minimal matrix co-extraction | Fiber configuration (tip/probe), phase chemistry | Supelco BioSPME [62] |
| Stable Isotope-Labeled Internal Standards | Compensation of residual matrix effects via signal normalization | Isotopic purity, retention match with analytes | Various manufacturers [60] |
| Phospholipid Removal Plates | High-throughput phospholipid depletion in 96-well format | Compatibility with automation, recovery performance | Strata-X PRO [61] |
| High-Purity Solvents | Mobile phase preparation and sample reconstitution | LC-MS grade, low background signals | Various manufacturers [66] |
Application in Pharmaceutical Analysis: Case Study
The practical implementation of these strategies is exemplified by a case study comparing sample preparation techniques for cathinone compounds in plasma [62]. As shown in Figure 5 of the source material, plasma samples spiked with nine cathinone compounds were prepared using either standard protein precipitation or biocompatible SPME (bioSPME). The bioSPME approach demonstrated over twice the analyte response with only one-tenth the phospholipid response compared to protein precipitation, highlighting the significant advantage of selective sample preparation for sensitive bioanalysis [62].
Chromatographic conditions for this comparison employed a HILIC column (Ascentis Express HILIC, 10 cm × 2.1 mm I.D., 2.7 µm) with isocratic elution using 5 mM ammonium formate in 98:2 (v/v) acetonitrile:water at 0.6 mL/min [62]. The dramatic reduction in matrix interference and concurrent enhancement of analyte detectability underscores the value of optimized sample preparation in pharmaceutical LC-MS workflows.
Effective mitigation of matrix effects through strategic sample preparation is not merely an optional refinement but an essential component of robust LC-MS method development in pharmaceutical analysis. The techniques discussed herein—from targeted phospholipid depletion to selective solid-phase extraction—provide researchers with a comprehensive toolkit to overcome the challenges posed by complex biological matrices. Implementation of these approaches, guided by systematic evaluation protocols and appropriate reagent selection, enables generation of reliable, reproducible, and sensitive bioanalytical data that meets the rigorous demands of modern drug development. As LC-MS technology continues to evolve toward higher sensitivity and throughput, the role of optimized sample preparation in ensuring data quality becomes increasingly critical for success in pharmaceutical research.
Within the pharmaceutical analysis workflow, the refinement of chromatographic methods is a critical step for ensuring the accuracy, sensitivity, and reliability of liquid chromatography-mass spectrometry (LC-MS) data. This process is foundational to supporting drug discovery, pharmacokinetic studies, and quality control, where the precise quantification of analytes in complex biological matrices is paramount [1]. The core challenge often lies in optimizing two fundamental components: the chromatography column and the mobile phase. The column dictates the selectivity and efficiency of the separation, while the mobile phase influences analyte retention, peak shape, and, crucially, ionization efficiency in the MS interface [56] [67]. This application note provides detailed protocols and structured data to guide researchers in systematically selecting and optimizing these parameters to achieve superior peak resolution and sensitivity in LC-MS based pharmaceutical analysis.
Theoretical Foundation: The Resolution Equation and Its Parameters
The goal of chromatographic separation is quantitatively described by the resolution equation. A deep understanding of this equation is essential for rational method development, as it pinpoints the variables that can be manipulated to improve separation.
The resolution (Rs) of two closely eluting peaks is given by:
[ R_s = \frac{\sqrt{N}}{4} \times \frac{\alpha - 1}{\alpha} \times \frac{k}{k + 1} ]
Where:
- N is the column efficiency, or plate number, which quantifies the column's ability to produce sharp peaks. It can be increased by using columns packed with smaller particles, increasing column length, or operating at elevated temperatures [68].
- α is the selectivity factor, which is the ratio of the capacity factors of the two peaks. This parameter represents the column's ability to chemically distinguish between analytes. It is most powerfully adjusted by changing the stationary phase chemistry or the mobile phase composition, including the type of organic modifier, pH, and use of additives [68].
- k is the capacity factor, a measure of analyte retention. It can be optimized by adjusting the strength of the mobile phase, typically by modifying the ratio of organic to aqueous solvent in reversed-phase chromatography [68].
This equation clearly shows that improving resolution requires a strategic approach to altering column and mobile phase properties.
Diagram 1: A strategic map for improving chromatographic resolution (Rs) by manipulating efficiency (N), selectivity (α), and retention (k), based on the fundamental resolution equation.
Column Selection for Optimal Resolution
The chromatography column is the heart of the separation. Selecting the appropriate stationary phase and column hardware is the first and most critical step in method refinement.
Stationary Phase Chemistry and Selectivity
While C18 phases are a common starting point, many separations require alternative selectivity to resolve challenging peak pairs, such as structural analogues or isomers [68].
Table 1: Guide to HPLC Stationary Phase Selection for Pharmaceutical Analysis
| Stationary Phase Type | Mechanism of Separation | Best For | Pharmaceutical Application Examples |
|---|---|---|---|
| C18 / C8 | Hydrophobic interactions | General purpose; most non-polar to moderately polar analytes [69] | Potency assays, stability-indicating methods, impurity profiling |
| Phenyl-Hexyl / Biphenyl | Hydrophobic + π-π interactions | Compounds with aromatic rings; isomer separation [20] | Separation of positional isomers, compounds with conjugated systems |
| Polar-Embedded / Aqua | Hydrophobic + H-bonding | Very polar compounds; 100% aqueous compatibility [20] | Early eluting polar analytes, metabolites |
| HILIC | Partitioning into aqueous layer | Highly polar, hydrophilic compounds [70] | Sugars, small polar metabolites, counter-ion analysis |
| Chiral | Stereo-specific interactions | Enantiomer separation [69] | Chiral drug purity, pharmacokinetics of single enantiomers |
Particle and Pore Characteristics
- Particle Size: Smaller particles (e.g., 1.7–2.7 µm) provide higher efficiency (theoretical plates, N) and sharper peaks, leading to better resolution and sensitivity. This comes at the cost of increased backpressure, requiring UHPLC instrumentation [68] [69]. Particles of 3–5 µm offer a good balance for conventional HPLC systems.
- Pore Size: This is critical for accommodating the analyte. A pore size of 120 Å is standard for small molecules (< 2000 Da). For larger biomolecules like peptides or oligonucleotides, a pore size of 200 Å or more is necessary to allow full access to the internal surface area [69]. Using a pore size too small for the analyte can result in poor retention and low loading capacity.
Column Dimensions
- Length: Longer columns (150–250 mm) provide more theoretical plates (N), enhancing resolution for complex mixtures. Shorter columns (50–100 mm) enable faster run times and are ideal for high-throughput analysis of simpler samples [69].
- Internal Diameter (I.D.): Narrower columns (e.g., 2.1 mm I.D.) increase sensitivity by producing higher analyte concentrations at the detector and reduce solvent consumption. Wider columns (e.g., 4.6 mm I.D.) have higher loading capacity and are often used for preparative work [69].
The Role of Inert Hardware
For analytes that are metal-sensitive, such as those containing phosphate groups, certain antibiotics, or chelating compounds, interaction with metallic surfaces (e.g., stainless steel) in the LC flow path can cause peak tailing, loss of response, and poor recovery [20] [56]. Bio-inert or inert columns utilize hardware that is passivated or made from non-metal materials (e.g., PEEK-lined) to prevent these interactions, ensuring accurate and sensitive quantification [20].
Mobile Phase Optimization for Resolution and MS Sensitivity
The mobile phase not only drives the separation in the column but also plays a pivotal role in the ionization process at the MS interface.
Organic Modifier Selection
Changing the organic solvent is one of the most effective ways to alter selectivity (α). The solvent strength varies, so a change requires re-optimization of the gradient or isocratic conditions. The approximate strengths for reversed-phase solvents are: Acetonitrile > Methanol > Tetrahydrofuran (for a given % in water) [68]. A separation that shows co-elution with acetonitrile may be fully resolved with methanol, or vice-versa, due to different hydrogen-bonding and dipole interactions.
pH and Buffer Selection
The pH of the mobile phase is a powerful tool for separating ionizable compounds. It controls the ionization state of acidic and basic analytes, profoundly affecting their retention and selectivity [67].
- For Basic Compounds: Use a mobile phase pH ~2–3.5 units below the pKa to protonate (and thus retain) the analyte. Volatile acids like formic acid (0.1%) or trifluoroacetic acid (0.01-0.05%) are standard.
- For Acidic Compounds: Use a mobile phase pH ~2–3.5 units above the pKa to deprotonate the analyte. Ammonium formate or ammonium acetate buffers (e.g., 5–20 mM) are volatile and MS-compatible.
- Critical Note: The pH of the aqueous portion of the mobile phase should be adjusted before adding the organic solvent, as the mixture will have a different apparent pH that is not accurately measured by standard pH electrodes [67].
Additives for Peak Shape and Sensitivity
- Ion-Pairing Reagents: Amphiphilic ions like TFA (for positives) or alkylamines (for negatives) can mask the charge of ionic analytes, increasing their retention on reversed-phase columns. However, they can cause significant ion suppression and should be used with caution in LC-MS [67].
- Metal Chelators: Additives like EDTA (0.1 mM) can be added to chelate trace metals in the mobile phase or system, improving peak shapes for metal-sensitive analytes like phosphorylated species or tetracyclines [67].
Comprehensive Experimental Protocol for Method Refinement
This protocol outlines a systematic approach to refining an LC-MS method for a small molecule pharmaceutical compound and its related substances.
Research Reagent Solutions
Table 2: Essential Materials for LC-MS Method Refinement
| Item | Function / Rationale | Example Products / Specifications |
|---|---|---|
| LC-MS System | Core analytical instrument for separation and detection. | Triple quadrupole (for quantification) or Q-TOF (for identification). |
| C18 Column | General purpose starting point for method development. | 100 x 2.1 mm, 1.7–2.7 µm particle size, 120 Å pore [69]. |
| Alternative Selectivity Columns | To resolve co-elutions by changing chemical interactions. | F5, Phenyl-Hexyl, HILIC, or polar-embedded phases [20]. |
| Inert Column | For metal-sensitive analytes to prevent peak tailing/loss. | Columns with passivated or PEEK-lined hardware [20]. |
| HPLC-Grade Water | Aqueous component of mobile phase; purity is critical. | LC-MS grade, 18 MΩ·cm resistivity, from a reliable supplier. |
| HPLC-Grade Organic Solvents | Organic modifiers for mobile phase. | LC-MS grade Acetonitrile and Methanol. |
| Volatile Buffers & Additives | To control pH and aid ionization without MS contamination. | Mass spectrometry grade Formic Acid, Ammonium Formate, Ammonium Acetate. |
| Sample Vials | To hold samples without introducing contamination or adsorption. | Clear or actinic (for light-sensitive samples) vials with certified low-adsorption inserts [71]. |
Step-by-Step Refinement Procedure
Step 1: Initial Scouting and System Suitability
- Begin with a standard C18 column (e.g., 100 x 2.1 mm, 1.7 µm) and a generic gradient (e.g., 5–95% acetonitrile in 10 minutes with 0.1% formic acid).
- Inject the sample and note the resolution (Rs) between the critical peak pair, peak shape (asymmetry factor), and retention of the first and last peaks (k should ideally be between 2-10) [68].
- If resolution is inadequate, proceed to the following steps, changing only one variable at a time.
Step 2: Optimizing Retention (k) and Efficiency (N)
- Adjust Gradient/Isocratic Conditions: If peaks are too close to the void volume (low k), weaken the initial mobile phase (e.g., start at 1% organic instead of 5%). If the run time is too long, steepen the gradient.
- Optimize Flow Rate and Temperature: To improve efficiency (N), try a lower flow rate (e.g., 0.2 mL/min) to enhance resolution, or a higher flow rate to shorten run time. Increase column temperature (e.g., 40–60°C) to reduce viscosity and improve mass transfer, which sharpens peaks [68] [71].
Step 3: Altering Selectivity (α) – Mobile Phase
- Change Organic Modifier: Replace acetonitrile with methanol. Use a solvent strength chart (see Figure 4 in [68]) to estimate the equivalent starting concentration (e.g., 40% ACN is roughly equivalent to 50% MeOH for elution strength). Re-run the gradient and assess changes in peak order and resolution.
- Adjust pH: If the analyte is ionizable, prepare a new mobile phase using a volatile buffer (e.g., 10 mM ammonium formate, pH 3.5 or 8.0, adjusted before adding organic). This can cause significant shifts in retention and selectivity for ionizable compounds.
Step 4: Altering Selectivity (α) – Stationary Phase
- If mobile phase changes are insufficient, switch to a column with different chemistry. A phenyl-hexyl or biphenyl phase is an excellent second choice for providing π-π interactions that can separate aromatic isomers or alter the elution order of planar vs. non-planar molecules [20].
Step 5: Addressing Peak Shape and Recovery
- If peak tailing is observed, particularly for basic or metal-sensitive compounds, switch to an inert column. This can dramatically improve peak symmetry and analyte recovery, directly boosting sensitivity [20] [56].
Step 6: Final Method Fine-Tuning for LC-MS
- Once optimal resolution is achieved, ensure the method is MS-friendly. Avoid non-volatile buffers and high concentrations of phosphate or sulfate. If ion-pairing reagents are necessary, use them at the lowest possible concentration.
- Perform a matrix effect study to check for ion suppression. Observe the baseline for regions of high noise or signal depression. If suppression is noted for your analyte, improve sample clean-up or further adjust the chromatographic conditions to shift the analyte's retention time away from the suppression zone [56].
Diagram 2: A systematic workflow for the iterative refinement of an LC-MS method, detailing the sequence of optimizing retention (k), efficiency (N), and selectivity (α).
Advanced Considerations: Mitigating Ion Suppression in LC-MS
Ion suppression occurs when co-eluting matrix components compete with or disrupt the ionization of the target analyte in the MS source, leading to reduced and variable signal [56]. This is a major challenge in bioanalysis.
Strategies to Overcome Ion Suppression:
- Enhanced Sample Clean-up: Employ techniques beyond protein precipitation, such as solid-phase extraction (SPE), to remove more endogenous phospholipids and salts that cause suppression [56].
- Chromatographic Resolution: The primary defense. Use the column and mobile phase optimization strategies outlined above to ensure the analyte elutes in a "clean" region of the chromatogram, away from major matrix interferences.
- Microflow LC: Switching from conventional analytical flow rates (~0.3-0.5 mL/min) to microflow rates (~5-50 µL/min) can significantly improve ionization efficiency and reduce ion suppression, as the analyte is introduced into the MS source in smaller droplets with a higher surface-to-volume ratio, leading to more efficient desolvation [56].
Systematic chromatographic method refinement is non-negotiable for generating high-quality LC-MS data in pharmaceutical research. By understanding the fundamental parameters of the resolution equation and adopting a structured, iterative approach to selecting the column and optimizing the mobile phase, scientists can reliably develop robust, sensitive, and specific methods. This process ensures accurate quantification, supports regulatory compliance, and ultimately accelerates the drug development pipeline.
Within the pharmaceutical analysis workflow, Liquid Chromatography-Mass Spectrometry (LC-MS) serves as a cornerstone technology for activities ranging from drug discovery and product characterization to metabolism studies and the identification of impurities [72]. The reliability of the data generated throughout these stages is paramount, directly influencing critical decisions in the drug development pipeline. Achieving long-term robustness and reproducibility in LC-MS analysis is not automatic; it is the direct result of implementing disciplined instrument maintenance and performance tracking protocols. As noted in discussions on trends in the field, the consistency of results is a key focus, with a shift towards easy-to-use instrumentation that enables anyone, regardless of experience, to use the technology correctly and produce reliable results [73]. This document outlines detailed application notes and protocols designed to embed these principles into the daily practice of researchers, scientists, and drug development professionals.
The Essential Framework of LC-MS Maintenance
Proper maintenance of an LC-MS system can be conceptualized as a three-pronged approach encompassing regular cleaning, preventive maintenance, and effective troubleshooting [74]. Adherence to this framework extends the operational life of the equipment and ensures the reliability and accuracy of analytical results, which is a cornerstone of any successful laboratory operation [74].
Routine Cleaning Procedures
The liquid chromatography component requires frequent flushing with appropriate solvents to prevent the buildup of sample residues that can impair performance [74]. The mass spectrometer, due to its complexity, often requires professional servicing, but a critical routine cleaning that can be performed in-house is the cleaning of the ion source. The ion source can accumulate contaminants over time, which directly affects ionization efficiency and, consequently, sensitivity [74]. As highlighted in recent trends, challenges remain in improving ionization efficiency, making source cleanliness even more critical for maintaining signal intensity [73].
Preventive Maintenance Schedule
Preventive maintenance involves the regular inspection and replacement of wear parts to ensure optimal operation and prevent unexpected breakdowns [74]. This proactive approach results in material cost savings by avoiding more expensive repairs and significant instrument downtime [74]. Key components to monitor include:
- LC System: Seals and gaskets, pump pistons, injector needles, and column compartments [74].
- MS System: Vacuum pump oil, turbo pump bearings, and filaments [74].
A strict, documented schedule for inspecting and replacing these components is fundamental to a robust maintenance program.
Troubleshooting Common Issues
Even with meticulous maintenance, issues can arise. The ability to rapidly identify and rectify these problems is crucial for minimizing analytical downtime.
- Pressure abnormalities in the LC system can signify blockages, leaks, or pump issues [74].
- Changes in the MS baseline or signal intensity may indicate problems with the ion source, detector, or vacuum system [74]. Maintaining a detailed logbook of all maintenance activities, operational changes, and observed issues is a recommended good practice. This record-keeping aids in identifying recurring problems and diagnosing underlying causes more efficiently [74].
Quantitative Performance Tracking and System Suitability
To ensure the reproducibility of data, especially in regulated environments, objective assessment of instrument performance is necessary. This involves tracking key performance indicators (KPIs) over time against predetermined acceptance criteria. System suitability tests, run alongside actual samples, provide a snapshot of the system's performance at the time of analysis.
The following table outlines critical parameters to monitor for both the LC and MS components of the system:
Table 1: Key Performance Tracking Parameters for LC-MS Systems
| Component | Parameter | Recommended Frequency | Acceptance Criteria (Example) | Investigation Trigger |
|---|---|---|---|---|
| Liquid Chromatography | Pump Pressure | Daily | Stable, within ± 50 psi of historical baseline | Sudden spikes or drops; gradual drifting |
| Retention Time | With each batch | RSD < 1% for standards | RSD > 2% or significant shift from calibration | |
| Peak Area & Height | With each batch | RSD < 5% for replicate standards | RSD > 5% or consistent downward trend | |
| Peak Shape (Theoretical Plates, Tailing) | With each batch | > 2000 plates; Tailing Factor < 2 | Significant deterioration from baseline | |
| Mass Spectrometer | Signal Intensity (Sensitivity) | Daily | > 10,000 counts for reference standard (e.g., 1 pg/µL) | Drop > 50% from historical average |
| Signal-to-Noise Ratio | Daily | > 10:1 for reference standard | Ratio falls below 10:1 | |
| Mass Accuracy | Weekly | < 5 ppm error for known calibrant | Error consistently > 5 ppm | |
| Mass Resolution | Weekly | Meets manufacturer specification (e.g., > 20,000 FWHM) | Resolution falls below specified threshold | |
| Vacuum System | Vacuum Pressure | Daily | < 5 x 10⁻⁵ Torr (varies by instrument) | Failure to reach operating pressure; slow pump down |
The data for these parameters should be recorded in a dedicated system suitability and performance log. Visualizing the data, such as plotting pump pressure or signal intensity over time, can help quickly identify negative trends before they lead to system failure. This practice aligns with the industry's need for reliability and reproducibility, where instrument-to-instrument reproducibility is a key consideration for transferring methods into regulated environments [73].
Detailed Experimental Protocol: Comprehensive LC-MS Performance Qualification
This protocol describes a systematic monthly performance qualification procedure to verify that the LC-MS system is operating within specifications for sensitivity, stability, and mass accuracy.
Materials and Reagents
- Mobile Phase A: HPLC-grade water with 0.1% formic acid
- Mobile Phase B: HPLC-grade acetonitrile with 0.1% formic acid
- System Suitability Standard: A solution containing a known analyte at a concentration in the low ng/mL range (e.g., caffeine or a proprietary standard mix relevant to the laboratory's focus).
- Mass Calibration Solution: A solution provided by the instrument manufacturer for mass axis calibration (e.g., containing sodium dodecyl sulfate or other reference compounds).
- Appropriate LC Column: A C18 column (e.g., 2.1 x 50 mm, 1.8 µm) or a column specified for the standard.
Instrumentation and Software
- UHPLC or HPLC system equipped with a binary or quaternary pump, autosampler, and column oven.
- Mass spectrometer (e.g., triple quadrupole or Q-TOF) with an electrospray ionization (ESI) source.
- Data acquisition and processing software (e.g., SCIEX Analyst, Thermo Xcalibur, Agilent MassHunter).
Procedure
Preparation:
- Prepare fresh mobile phases and filter through a 0.2 µm membrane.
- Prepare the system suitability standard and mass calibration solutions according to established procedures.
- Purge the LC system lines and pump with the mobile phases.
LC-MS System Setup:
- Install the specified column and set the column oven temperature to 40°C.
- Set the mobile phase flow rate to 0.3 mL/min.
- Use a gradient elution program: 5% B to 95% B over 5 minutes, hold at 95% B for 1 minute, then re-equilibrate at 5% B for 3 minutes.
- Set the mass spectrometer to the appropriate mode (e.g., positive ESI). Tune and calibrate the mass axis using the calibration solution as per the manufacturer's instructions.
Data Acquisition:
- Create a sequence in the acquisition software to inject the system suitability standard six times.
- For the mass spectrometer, set up a selected ion monitoring (SIM) or multiple reaction monitoring (MRM) scan for the specific analyte(s) in the standard.
- Initiate the sequence.
Data Analysis:
- Process the data from the six replicate injections.
- For the target analyte, calculate the following for the peak:
- Average retention time and %RSD.
- Average peak area and height and %RSD.
- Theoretical plates and tailing factor.
- Signal-to-noise ratio for a designated injection.
- Record the mass accuracy (in ppm) for a designated ion.
Acceptance Criteria and Reporting
The results should be compared against the laboratory's predefined acceptance criteria (see examples in Table 1). A formal report should be generated, noting any deviations. If any parameter falls outside its acceptance range, a troubleshooting investigation must be initiated before the instrument is used for sample analysis.
Data Management for Reproducibility and Compliance
Robust data management is integral to ensuring the long-term reproducibility and defensibility of LC-MS data, particularly in regulated environments like pharmaceutical manufacturing [75]. A comprehensive Data Management Plan (DMS) should address the following elements:
- Data Types and Metadata: All raw LC-MS data files, analytical methods, and instrument parameters must be preserved. Crucially, this should be accompanied by rich metadata describing the sample amounts, extraction/processing methods, and volumes of processed samples analyzed [75].
- Data Storage: All MS data should be stored on a secure, redundant server, with a defined policy for long-term preservation (e.g., 7 years) [75].
- Data Sharing and Repositories: To maximize data sharing and collaboration, data (often in the .mzML format along with associated metadata) should be uploaded to public repositories. Recommended repositories include:
- Metabolomics Workbench: For metabolomics data, offering extensive metadata components [75].
- ProteomeXchange: A widely used depository for proteomics data, required by many journals [75].
- GNPS (Global Natural Products Social Molecular Networking): For data involving peptides, metabolites, and lipids [75].
- Data Analysis Software: Utilizing standardized software, both commercial and open-source, ensures consistent data interpretation. Examples include SCIEX MultiQuant for targeted quantification, MS-DIAL for untargeted metabolomics/lipidomics, and MetaboAnalyst for statistical and pathway analysis [75].
The Scientist's Toolkit: Essential Research Reagent Solutions
The following table details key reagents and materials essential for maintaining and troubleshooting an LC-MS system in a pharmaceutical research context.
Table 2: Essential Research Reagent Solutions for LC-MS Maintenance
| Item | Function/Application |
|---|---|
| HPLC-Grade Water & Acetonitrile | The foundational components of mobile phases; high purity is critical to minimize background noise and contamination. |
| Formic Acid & Ammonium Acetate/Formate | Common mobile phase additives used to control pH and improve ionization efficiency in positive and negative ESI modes, respectively. |
| System Suitability Standard Mix | A solution of known compounds used to verify system performance, including sensitivity, retention time stability, and chromatographic efficiency. |
| Mass Calibration Solution | A standard provided by the MS manufacturer containing compounds of known mass-to-charge ratio for accurate mass calibration. |
| Source Cleaning Solvents & Swabs | Isopropanol, water, and methanol, along with lint-free swabs, for manually cleaning the ion source to restore sensitivity. |
| Seal & Gasket Kits | Manufacturer-specified replacement parts for the LC pump and autosampler to prevent leaks and maintain pressure stability. |
| Vacuum Pump Oil | High-quality oil specified for the MS vacuum pump; regular changes are necessary to maintain high vacuum performance. |
| In-Line Filters & Frits | Filters placed before the column to trap particulates and prevent column clogging. |
| Certified Reference Materials (CRMs) | Analytically pure standards with well-defined concentrations for instrument calibration and method validation. |
Workflow and Relationship Visualizations
LC-MS Maintenance Workflow
The following diagram outlines the logical workflow for a comprehensive LC-MS instrument maintenance program, integrating daily checks, periodic tasks, and responsive actions.
Performance Tracking and Data Management Relationship
This diagram illustrates the logical relationship between performance tracking, data management, and the overarching goal of ensuring data reproducibility.
Within the pharmaceutical analysis workflow, Liquid Chromatography-Mass Spectrometry (LC-MS) is indispensable for its high sensitivity and specificity in tasks ranging from drug metabolism studies to quality control. However, the reliability of this data is paramount and can be compromised by technical challenges including signal instability, inconsistent retention times, and carryover. These issues can directly impact the accuracy, precision, and regulatory compliance of analytical results, posing significant risks in drug development. This application note provides a structured, symptom-based troubleshooting guide to help researchers and scientists quickly diagnose and resolve these common LC-MS performance issues, thereby ensuring data integrity within the pharmaceutical research context.
Signal Instability
Signal instability manifests as fluctuating responses from samples with identical analyte levels, leading to high variability in quantitative results and poor reproducibility [76].
Diagnosis and Systematic Troubleshooting
A systematic approach is critical for isolating the root cause of signal instability. The flow diagram below outlines a diagnostic workflow.
Diagnostic Protocol:
- Method Preparation: Create a simple, unscheduled MRM method with 20-30 transitions [76].
- Sample Preparation: Prepare a medium-level standard (neat, matrix-free) in 100% mobile phase A. Include a blank with internal standard and a double-blank [76].
- Batch Sequence: Run samples in the order: BLNK, DB, DB, BLNK, STND, DB, BLNK, STND, STND (10-20 repeated injections), BLNK, DB [76].
- Data Analysis: Calculate the relative standard deviation (RSD) of the peak areas from the repeated standard injections. An RSD above 10-15% indicates instrumental issues; better reproducibility points to problems in sample preparation or materials [76].
Common Causes and Mitigation Strategies
Table 1: Troubleshooting Signal Instability
| Symptom/Cause | Mitigation Strategy |
|---|---|
| High RSD in Diagnostic Test (Instrument-related) | - MS Source Contamination: Clean the ion source, including sprayer and orifice [76]. - Autosampler Performance: Check for precise injection volumes and needle function. - Spray Instability: Optimize nebulizer and desolvation gas flows; verify mobile phase composition. |
| Inconsistent Internal Standard Response | - Source Temperature: Avoid excessively high temperatures that may decompose analytes [76]. - Ion Suppression: Modify chromatography to separate analytes from matrix interferences. |
| Low RSD in Diagnostic Test (Sample/Material-related) | - Column Health: Replace compromised, contaminated, or expired columns [77]. - Mobile Phase: Use fresh, LC-MS grade solvents and buffers; ensure proper degassing [77]. - Sample Prep: Standardize evaporation and reconstitution steps to prevent discriminatory losses [76]. |
Inconsistent Retention Times
Retention time (RT) shifts compromise peak identification and integration accuracy. These shifts can be categorized as gradual drift or sudden fluctuations [78].
Diagnosis and Systematic Troubleshooting
The following diagram guides the diagnosis of different RT shift patterns.
Diagnostic Protocol:
- Identify the Pattern: Analyze historical chromatograms to classify the RT shift as continuously decreasing, increasing, or fluctuating [78].
- Verify Mobile Phase: Confirm fresh, correctly prepared mobile phase with accurate pH. For isocratic methods, try a hand-mixed premix to rule out pump proportioning errors [78].
- Check Flow Rate: Collect eluent at the column outlet over a measured time (e.g., 10 minutes) to verify the actual flow rate matches the set method value [78].
- Inspect System Pressure: Compare current system pressure to baseline. Perform a system pressure test to check for leaks or blockages [78].
Common Causes and Mitigation Strategies
Table 2: Troubleshooting Inconsistent Retention Times
| Shift Type | Root Cause | Corrective Action |
|---|---|---|
| Decreasing RT | - Mobile Phase: Stronger elution strength than intended [78]. - Temperature: Increasing column temperature [78]. - Flow Rate: Actual flow rate higher than set value [78]. | - Prepare fresh mobile phase; cover reservoirs to prevent evaporation [78]. - Use a column thermostat for stable temperature control [78]. - Verify pump calibration and check for leaks [78]. |
| Increasing RT | - Mobile Phase: Weaker elution strength than intended [78]. - Temperature: Decreasing column temperature [78]. - Flow Rate: Actual flow rate lower than set value [78]. | - Prepare fresh mobile phase [78]. - Ensure consistent laboratory temperature or use a column oven [78]. - Verify pump performance and check for obstructions [78]. |
| Fluctuating RT | - Pump Issues: Insufficient mobile phase mixing; MCGV cross-port leaks [78]. - Insufficient Equilibration: Especially in gradient or ion-pairing methods [78]. - Low Buffer Capacity: Inadequate pH control [78]. | - Purge mixer; service or clean the Multi-Channel Gradient Valve (MCGV) [78]. - Increase equilibration time (e.g., 10-15 column volumes) [78]. - Use buffer concentrations >= 20 mM for sufficient capacity [78]. |
Carryover
Carryover is the appearance of analyte peaks in a blank injection following a high-concentration sample, potentially leading to false positives and inaccurate quantification, especially critical in regulated bioanalysis where it must be <20% of the LLOQ [79].
Diagnosis and Systematic Troubleshooting
Carryover can originate from multiple sources; a systematic isolation process is required to identify the exact location.
Diagnostic Protocol:
- Initial Test: Inject a blank sample immediately after an upper limit of quantification (ULOQ) sample. A significant peak indicates carryover [79].
- Autosampler Isolation: Perform a zero-volume injection of a blank. If the carryover peak is still present, the autosampler (injection valve, needle, needle seat) is the most likely source [80].
- Column Isolation: Disconnect the column and replace it with a zero-dead-volume union or a short piece of tubing. Inject a high-concentration sample followed by a blank. If carryover is observed, the issue lies in the LC flow path between the injector and column (e.g., tubing, fittings). If it is eliminated, the column itself is the source [81] [79].
Common Causes and Mitigation Strategies
Table 3: Troubleshooting and Mitigating Carryover
| Source | Underlying Cause | Corrective Action |
|---|---|---|
| Autosampler | - Worn Parts: Worn injector rotor seal is a primary cause [80]. - Ineffective Wash: Wash solvent strength is insufficient to elute stuck analyte [80]. - Dead Volumes: Improperly cut tubing or fittings create spaces where analyte is trapped [79]. | - Replace rotor seal and other worn parts as routine maintenance [80]. - Use a strong wash solvent (e.g., 90:10 MeOH/Water for RP-LC) [80]. - Ensure proper tubing cuts and tight, zero-dead-volume connections [79]. |
| Column | - Analyte Adsorption: "Sticky" analytes (e.g., biopolymers, peptides) adsorb to the stationary phase [79]. - Contamination: Sample matrix components build up on the column inlet [81]. | - Use a column wash protocol with strong solvent as a separate method [80]. - Use a guard column to capture contaminants; replace it regularly [81] [77]. |
| Systemic | - Inherent Analyte Properties: Some compounds are prone to adsorption due to viscosity, charge, or polarity [79]. | - For problematic analytes, use passivated or specially coated components to minimize interaction [79]. - Perform a system flush with a strong solvent like 30% phosphoric acid, followed by extensive water washing [80]. |
The Scientist's Toolkit: Research Reagent Solutions
The following reagents and materials are essential for effective LC-MS troubleshooting and method robustness in pharmaceutical analysis.
Table 4: Essential Research Reagents and Materials for LC-MS Troubleshooting
| Item | Function & Importance |
|---|---|
| LC-MS Grade Solvents & Additives | High-purity solvents minimize chemical noise and background interference, which is crucial for signal stability and reducing ghost peaks [77]. |
| Ammonium Formate & Acetate Buffers | Volatile buffers are compatible with MS detection. They help control mobile phase pH, which improves peak shape by blocking active silanol sites on the stationary phase [77]. |
| Guard Columns & In-Line Filters | Protect the expensive analytical column from particulate matter and contaminants from the sample matrix, extending column life and preventing pressure spikes [81] [77]. |
| Strong Needle Wash Solvents | A wash solvent stronger than the mobile phase (e.g., 90:10 MeOH/Water) is critical for effectively cleaning the autosampler needle and injection port, thereby mitigating carryover [80]. |
| System Flushing Solutions | Solutions like 30% phosphoric acid are used for periodic deep cleaning of the entire LC flow path to remove strongly adsorbed contaminants that cause carryover and ghost peaks [80]. |
Ensuring Confidence and Selecting Tools: Validation Standards and Technology Comparisons
Liquid chromatography-tandem mass spectrometry (LC-MS/MS) has evolved from a scientific curiosity into a cornerstone technique in pharmaceutical analysis, providing the superior separating efficiency, specificity, and sensitivity required for modern drug development [82] [83]. The analysis of active pharmaceutical ingredients (APIs), their impurities, and metabolites in complex matrices demands techniques capable of precise quantification at trace levels. The 2018 discovery of nitrosamine impurities in valsartan exemplifies a persistent challenge for the industry, highlighting how trace-level contaminants can impact public trust and patient safety [84]. Such incidents underscore the non-negotiable requirement for rigorously validated analytical methods.
Method validation is a key activity in chemical analysis, indispensable for obtaining reliable results [83]. For LC-MS/MS methods, which are notorious for their complexity, validation becomes particularly critical [83]. This process provides documented evidence that an analytical procedure is suitable for its intended purpose, ensuring that product quality, safety, and efficacy assessments are based on trustworthy data. Regulatory bodies, including the Food and Drug Administration (FDA) and the European Medicines Agency (EMA), mandate strict adherence to validation guidelines for pharmaceutical applications, implementing strict limits on impurities such as nitrosamines [84]. This article delineates the core frameworks for validating LC-MS/MS methods, providing detailed protocols and illustrative data to guide researchers in meeting these stringent regulatory standards.
Core Validation Parameters and Acceptance Criteria
The validation of an LC-MS/MS method involves assessing a set of key performance characteristics to demonstrate its reliability, accuracy, and robustness. These parameters are universally recognized as fundamental to any validation protocol [85] [83].
Table 1: Essential Validation Parameters and Their Definitions
| Validation Parameter | Definition | Typical Regulatory Acceptance Criteria |
|---|---|---|
| Accuracy [85] | The difference between the measured value and the true value of the analyte. | Intra- and inter-assay concentrations within 85-115% of the expected value [86]. |
| Precision [85] | The degree of agreement between results from multiple measurements of the same sample. | Intra-assay precision ≤ 15% RSD; Inter-assay precision ≤ 15% RSD [87] [86]. |
| Specificity [85] | The ability to measure the analyte accurately in the presence of other sample components. | No interference observed at the retention time of the analyte [88]. |
| Linearity [85] | The ability to produce results proportional to analyte concentration over a defined range. | Coefficient of determination (R²) ≥ 0.99 [87]. |
| Limit of Quantification (LOQ) [85] | The lowest concentration that can be reliably and accurately measured. | Signal-to-noise ratio (S:N) ≥ 10; Precision and accuracy at LOQ ≤ 20% [84] [88]. |
| Limit of Detection (LOD) [88] | The lowest concentration of the analyte that can be detected. | Signal-to-noise ratio (S:N) ≥ 3 [88]. |
| Recovery [85] | The efficiency of extracting the analyte from the sample matrix. | Consistent and reproducible recovery, ideally high and consistent [87]. |
| Matrix Effect [85] | The interference from the sample matrix on analyte ionization and detection. | Precision and accuracy of matrix-spiked samples within pre-defined criteria (e.g., ±15%) [85]. |
The precision of a method is further categorized into intra-day precision (repeatability) and inter-day precision (intermediate precision), which assess variability within a single analytical run and between different runs over time, respectively [87]. For instance, a validated method for LXT-101 in beagle plasma demonstrated intra- and inter-batch precision within 3.23–14.26% and 5.03–11.10%, respectively [87]. The concept of "dynamic validation" or "series validation" is also gaining traction, emphasizing that validation is an ongoing process to monitor method performance throughout its life cycle, under more challenging and variable conditions than the initial validation [89].
Detailed Experimental Protocol: Determination of N-Nitroso-Atenolol
The following protocol, adapted from a study on the determination of the mutagenic impurity N-nitroso-atenolol in atenolol-based pharmaceuticals, exemplifies a fully validated LC-MS/MS method meeting regulatory standards [84].
Materials and Reagents
- Reference Standards: N-nitroso-atenolol (99.5% purity) and stable isotope-labeled internal standard N-nitroso-atenolol-d7 (98.4% purity).
- Chemicals: LC-MS grade water, methanol, and formic acid.
- Samples: Atenolol active pharmaceutical ingredient (API) and finished tablet dosage forms.
- Consumables: PVDF syringe filters (0.22 µm pore size) [84].
Instrumentation and Chromatographic Conditions
- LC System: Waters Acquity UPLC system with a photodiode array (PDA) detector.
- Mass Spectrometer: Waters Xevo TQ-Absolute tandem quadrupole mass spectrometer with an electrospray ionization (ESI) source.
- Analytical Column: Waters BEH C18 column (2.1 × 50 mm, 1.7 µm particle size), maintained at 40°C.
- Mobile Phase: (A) 0.1% formic acid in water; (B) 0.1% formic acid in methanol.
- Gradient Elution:
- 0-1.5 min: 20% B
- 1.5-2.5 min: 20-23.5% B
- 2.5-3 min: 23.5% B
- 3-9.5 min: 23.5-26% B
- 9.5-9.9 min: 26-99% B
- 9.9-12.4 min: 99% B
- 12.4-12.5 min: 99-20% B
- 12.5-15 min: 20% B (re-equilibration)
- Flow Rate: 0.33 mL/min
- Injection Volume: 1 µL
- Autosampler Temperature: 10°C [84]
Mass Spectrometric Conditions
- Ionization Mode: Positive electrospray ionization (ESI+)
- Data Acquisition: Multiple reaction monitoring (MRM)
- MRM Transitions:
- N-nitroso-atenolol: m/z 296 → 222 (quantifier) and m/z 296 → 145 (qualifier)
- N-nitroso-atenolol-d7 (IS): m/z 303 → 229 and m/z 303 → 152
- Source Conditions:
- Capillary voltage: 0.71 kV
- Source temperature: 150°C
- Desolvation temperature: 400°C
- Desolvation gas flow: 800 L/h
- Cone gas flow: 150 L/h [84]
Sample Preparation
- Standard Solutions: Prepare stock solutions of analyte and IS at 1 mg/mL in methanol. Dilute to working concentrations with 75% methanol. Prepare calibration standards in the range of 0.5–80 ng/mL.
- Drug Substance (API): Accurately weigh 20 mg of atenolol API into a 50 mL centrifuge tube. Add 1 mL of internal standard solution and 29 mL of 75% methanol. Vortex for 1 minute, centrifuge at 4000 rpm for 10 minutes, and filter the supernatant through a 0.22 µm PVDF syringe filter before analysis [84].
- Drug Product (Tablets): The preparation method is analogous to the drug substance, involving extraction with 75% methanol in the presence of the internal standard, followed by centrifugation and filtration.
Validation Results and Data
The described method was rigorously validated, with the following quantitative results demonstrating its performance.
Table 2: Validation Data for the N-Nitroso-Atenolol LC-MS/MS Method [84]
| Validation Parameter | Result |
|---|---|
| Linear Range | 0.5 - 80 ng/mL |
| Coefficient of Determination (R²) | Meets acceptance criteria |
| Limit of Detection (LOD) | 0.2 ng/mL (0.30 ng/mg) |
| Limit of Quantification (LOQ) | 0.5 ng/mL (0.75 ng/mg) |
| Accuracy (Recovery) | Meets pre-defined criteria |
| Precision (Repeatability) | Meets pre-defined criteria |
| Specificity | No interference from atenolol API or excipients |
| Robustness | Method performance maintained under deliberate variations |
Workflow and Material Considerations
Analytical Workflow Diagram
The following diagram visualizes the logical flow of the LC-MS/MS method development and validation process.
Research Reagent Solutions
A successful LC-MS/MS analysis depends on the quality and appropriateness of the materials used.
Table 3: Essential Research Reagents and Materials for LC-MS/MS Analysis
| Item | Function / Importance | Example from Protocol |
|---|---|---|
| Stable Isotope-Labeled Internal Standard (IS) | Compensates for analyte loss during preparation and mitigates matrix effects, improving accuracy and precision [86]. | N-nitroso-atenolol-d7 [84] |
| LC-MS Grade Solvents | Minimize background noise and signal suppression, ensuring high sensitivity and preventing instrument contamination. | LC-MS grade water, methanol, formic acid [84] |
| High-Purity Reference Standards | Ensure accurate quantification and correct method calibration. | N-nitroso-atenolol (99.5% purity) [84] |
| U/HPLC Column (C18) | Provides efficient chromatographic separation of analytes from matrix components. | Waters BEH C18 column, 1.7 µm [84] |
| Sample Filtration Units | Remove particulate matter from samples, protecting the LC system and column from damage. | 0.22 µm PVDF syringe filters [84] |
The rigorous validation of LC-MS/MS methods, as demonstrated in the protocol for N-nitroso-atenolol, is a critical pillar of modern pharmaceutical analysis. It transforms a technical procedure into a reliable, evidence-based tool that ensures drug safety and efficacy. By adhering to the established frameworks for validation—assessing accuracy, precision, specificity, and other key parameters—researchers and drug development professionals can generate data that meets stringent global regulatory standards. As the technique continues to evolve, the fundamentals of method validation remain the bedrock upon which quality, patient safety, and public trust are built.
Within pharmaceutical analysis, the comprehensive characterization of complex biological samples is a cornerstone of drug discovery and development. High-resolution mass spectrometry (HRMS) has emerged as an indispensable technology for this task, with Orbitrap and quadrupole time-of-flight (Q-TOF) platforms representing the predominant analytical techniques [90] [91]. Both technologies deliver the high-resolution, accurate-mass (HRAM) data necessary to separate and identify known and unknown compounds in complex matrices, a critical requirement for applications like metabolomics, proteomics, and drug metabolism and pharmacokinetics (DMPK) studies [90] [3]. The choice between these platforms significantly influences the depth of analytical insight, workflow efficiency, and operational cost. This application note provides a comparative analysis of Orbitrap and Q-TOF mass spectrometers, framing their performance characteristics within the context of targeted and untargeted workflows in pharmaceutical research. We include structured experimental protocols and resource guides to facilitate informed method development and instrument selection.
Technology and Operating Principles
Understanding the fundamental differences in how Orbitrap and Q-TOF instruments operate is key to appreciating their respective strengths and applications.
Orbitrap Mass Spectrometry
The Orbitrap is an electrostatic ion trap mass analyzer. It consists of a central spindle-shaped electrode and two coaxial outer electrodes [92]. Ions are injected tangentially into the trap and captured in stable orbits around the central electrode. Simultaneously, they oscillate harmonically along the axial direction. The frequency of this axial oscillation ((ω)) is mass-dependent, related to the mass-to-charge ratio ((m/z)) of the ion and the field curvature ((k)) by the equation (ω = \sqrt{(k/(m/z))}) [92]. The image current generated by these oscillating ions is detected and converted into a mass spectrum via Fourier transformation (FT). This operating principle enables Orbitrap instruments to achieve very high resolving power (up to 1,000,000 FWHM) and sub-ppm mass accuracy, which are crucial for confidently identifying compounds and resolving isobaric interferences [90] [92].
Q-TOF Mass Spectrometry
The Q-TOF is a hybrid instrument that combines a quadrupole mass filter with a time-of-flight (TOF) mass analyzer [91]. The first quadrupole (Q1) can operate as a mass filter to select specific precursor ions or in RF-only mode to transmit all ions. The second quadrupole (Q2) serves as a collision cell for fragmenting ions via collision-induced dissociation (CID). The resulting ions are then pulsed orthogonally into the flight tube of the TOF analyzer [91] [93]. In this field-free region, all ions are accelerated to the same kinetic energy. Since kinetic energy is proportional to mass and velocity, lighter ions travel faster and reach the detector first. The (m/z) of an ion is determined by its time of flight ((t)), with the relationship given by (m/z = 2V t^2 / L^2), where (V) is the accelerating voltage and (L) is the flight path length [91]. Modern Q-TOFs often incorporate a reflectron, an electrostatic mirror that corrects for kinetic energy spread among ions of the same (m/z), thereby enhancing mass resolution [91].
Comparative Performance Data
The following tables summarize the key performance metrics for a selection of contemporary Orbitrap and Q-TOF systems, based on manufacturer specifications and scientific literature. These parameters are critical for evaluating instrument suitability for specific pharmaceutical applications.
Table 1: Performance Comparison of Select Orbitrap Mass Spectrometers
| Instrument Model | Resolving Power (@ m/z 200) | Mass Accuracy | Scan Speed (Hz) | Mass Range (m/z) | Key Applications in Pharma |
|---|---|---|---|---|---|
| Orbitrap Exploris 120 | 120,000 | <1 ppm (with EASY-IC) | 22 | 40 - 3,000 | Forensic toxicology, clinical research, targeted/semi-targeted metabolomics [13] |
| Orbitrap Exploris 240 | 240,000 | <1 ppm (with EASY-IC) | 22 | 40 - 6,000 | Forensic toxicology, biopharma development, lipidomics, clinical research [13] |
| Orbitrap Exploris 480 | 480,000 | <1 ppm (with EASY-IC) | 40 | 40 - 6,000 | Quantitative proteomics, biopharma R&D, clinical & translational research [13] |
| Orbitrap Ascend Tribrid | >1,000,000 | <1 ppm | Not Specified | Not Specified | Multi-omics, intact/top-down proteomics, biotherapeutics [13] |
Table 2: General Performance Characteristics of Q-TOF Mass Spectrometers
| Performance Parameter | Q-TOF Capabilities | Significance for Pharma Analysis |
|---|---|---|
| Resolving Power | Typically 20,000 - 80,000 (commercial systems) [91] | Sufficient for many small molecule analyses; can resolve isobars in complex samples. |
| Mass Accuracy | <2-5 ppm with internal calibration [91] [93] | Enables confident elemental composition assignment for unknown ID. |
| Scan Speed | Very high (thousands of spectra/sec in principle) [91] | Excellent for fast LC separations and high-throughput screening. |
| Dynamic Range | Wide, but may be lower than triple quadrupoles for quantification [3] | Suitable for semi-quantitation in untargeted workflows. |
| Data Acquisition | Full-scan, data-dependent (DDA), data-independent (DIA e.g., SWATH) [91] | Enables comprehensive non-targeted screening and retrospective data mining. |
Application Workflows in Pharmaceutical Analysis
The distinct technical profiles of Orbitrap and Q-TOF instruments make them differentially suited for various stages of the drug development pipeline.
Untargeted Metabolomics and Biomarker Discovery
Objective: To comprehensively profile the metabolome of a biological system (e.g., cell lines, plasma) without prior knowledge of the metabolites present, often for biomarker identification [94].
Protocol:
- Sample Preparation: Extract metabolites from plasma using a protein precipitation method. Add 200 µL of cold 1:1 acetonitrile:methanol containing internal standards to 50 µL of plasma. Mix vigorously, incubate at 4°C for 10 minutes, and centrifuge to pellet proteins. Collect the supernatant for analysis [94].
- Chromatography: Employ hydrophilic interaction liquid chromatography (HILIC) for separation of polar metabolites.
- Column: SeQuant ZIC-pHILIC (100 mm x 2.1 mm, 5 µm).
- Mobile Phase: A) 20 mM ammonium bicarbonate in 95:5 water:acetonitrile; B) Acetonitrile.
- Gradient: 90% B to 35% B over 12 minutes [94].
- Mass Spectrometry Analysis (Orbitrap-based):
- Data Processing: Use software (e.g., Compound Discoverer, XCMS) for peak picking, alignment, and compound identification against databases (e.g., HMDB, mzCloud). Q-TOF platforms are equally applicable here, utilizing similar full-scan and DDA or DIA (e.g., SWATH) modes [91] [93].
Targeted Screening and Quantification: Pesticide Residues in Nutraceutical Products
Objective: To screen for and quantify hundreds of known and unknown pesticide residues in plant-based materials used in nutraceutical production, demonstrating a workflow applicable to drug impurity testing.
Protocol:
- Sample Extraction: Use the QuEChERS (Quick, Easy, Cheap, Effective, Rugged, and Safe) procedure. Homogenize the sample and extract with acetonitrile, followed by partitioning with salts (MgSO4, NaCl) and a clean-up step with dispersive SPE [95].
- Chromatography: Utilize reversed-phase UHPLC for high-resolution separation.
- Column: C18 column (e.g., 100 mm x 2.1 mm, 1.7 µm).
- Mobile Phase: A) Water with 0.1% formic acid; B) Methanol with 0.1% formic acid.
- Gradient: Optimized for a wide log P range of pesticides.
- Mass Spectrometry Analysis (Q-Orbitrap-based):
- Instrument: UHPLC/ESI Q-Orbitrap Mass Spectrometer.
- Acquisition Mode: Full MS scan at resolving power ≥ 70,000 (for quantification) simultaneously with dd-MS2 for identification. Use internal standards for calibration [95].
- Data Analysis: Quantify against matrix-matched calibration curves. Identify unknowns by matching acquired MS/MS spectra to a high-resolution library.
A Hybrid Untargeted-to-Targeted Workflow
Objective: To leverage the high resolution of an Orbitrap or Q-TOF for discovery and then transfer methods to a more cost-effective platform for high-throughput targeted analysis of hundreds of samples [94] [96].
Protocol:
- Discovery Phase: Analyze a pooled sample and a subset of research samples on a high-resolution instrument (Orbitrap ID-X or high-end Q-TOF) using an untargeted method as in Section 4.1. This establishes the list of detectable metabolites, including "unknowns" that may be of biological interest but lack a chemical standard [94].
- Method Translation: Use the high-resolution fragmentation data (from the Orbitrap or Q-TOF) to design MRM transitions for a triple quadrupole (QqQ) mass spectrometer. The precursor ion and fragment ions are identified from the HRMS/MS spectrum, and collision energies can be predicted from established conversion formulas, bypassing the need for authentic standards for every compound [94].
- High-Throughput Targeted Phase: Run the entire large sample cohort on the QqQ instrument using the newly developed MRM method. This approach combines the discovery power of HRMS with the affordability and quantitative robustness of QqQ for large-scale studies [94] [96].
The Scientist's Toolkit: Essential Research Reagents and Materials
The following table details key reagents and materials essential for implementing the LC-MS workflows described in this note.
Table 3: Key Research Reagent Solutions for LC-MS Workflows
| Reagent/Material | Function | Application Example |
|---|---|---|
| ZIC-pHILIC Chromatography Column | Separates polar metabolites via hydrophilic interaction liquid chromatography. | Untargeted metabolomics of plasma extracts [94]. |
| CAPTIVA EMR-Lipid Plates | Enhanced matrix removal solid-phase extraction for efficient lipid removal. | Clean-up of plasma samples prior to metabolomics profiling [94]. |
| QuEChERS Extraction Kits | Standardized protocol for extracting analytes from complex matrices. | Multi-residue pesticide analysis in fruits, vegetables, and botanicals [95]. |
| FlexMix Calibration Solution | Ready-to-use mix for single-click mass calibration of Orbitrap instruments. | Maintaining sub-ppm mass accuracy over extended periods [13]. |
| FAIMS Pro Duo Interface | High-field asymmetric waveform ion mobility spectrometry interface. | Adds ion mobility separation to reduce chemical noise and improve selectivity [13]. |
| Stable Isotope-Labeled Internal Standards | (e.g., 13C, 15N-labeled amino acids) | Normalization for sample preparation variability and accurate quantification [94]. |
| T-ReX LC-QTOF Kit (Bruker) | Integrated solution for non-targeted analysis, including data processing. | Streamlined untargeted metabolomics workflow on Q-TOF platforms [93]. |
Orbitrap and Q-TOF mass spectrometers are both powerful platforms that have revolutionized pharmaceutical analysis. The choice between them is not a matter of superiority, but of strategic alignment with specific application needs and operational constraints. Orbitrap systems generally provide superior resolving power and mass accuracy, making them ideal for applications demanding the highest confidence in compound identification, such as characterizing complex biotherapeutics or resolving challenging isobars [90] [92]. Q-TOF systems offer exceptional scan speeds and robustness, excelling in high-throughput untargeted screening and applications requiring fast polarity switching [91] [93]. As demonstrated, modern workflows can also leverage the strengths of both platforms—using HRMS for discovery and method development and transitioning to more affordable QqQ systems for large-scale quantification. Ultimately, the decision should be guided by a careful evaluation of the required performance specifications against the goals of the specific pharmaceutical workflow, be it untargeted discovery, targeted quantification, or an agile hybrid approach.
Within pharmaceutical analysis, the accurate quantification of target analytes in complex biological matrices is a cornerstone of drug development and bioequivalence studies. Triple Quadrupole (QQQ) mass spectrometers, operating in Multiple Reaction Monitoring (MRM) mode, have firmly established themselves as the gold standard for such targeted quantitation assays [97] [98]. Their dominance stems from an unparalleled combination of specificity, sensitivity, and robustness, enabling researchers to reliably measure everything from small molecule drugs to complex biologics and oligonucleotide therapeutics [98] [18].
The fundamental principle of an MRM assay on a QQQ system involves two stages of mass selection. The first quadrupole (Q1) filters ions to select a specific precursor ion derived from the target molecule. This ion is then fragmented in the second quadrupole (Q2), which acts as a collision cell. The third quadrupole (Q3) then selects a specific, characteristic product ion from this fragmentation [97]. This two-stage mass filtering process drastically reduces chemical background noise, allowing for the precise identification and quantitation of target analytes even in the presence of complex sample matrices like plasma or tissue homogenates [99]. The following diagram illustrates the core principle of MRM.
The utility of LC-QQQ platforms in pharmaceutical workflows is reflected in market dynamics. Recent analytical instrument sector reports note steady revenue growth driven by sustained demand from pharmaceutical and chemical industries, with liquid chromatography and mass spectrometry sales posting high single-digit increases [100]. This trend underscores the critical and growing role of these systems in modern laboratories.
Current Applications and Quantitative Impact in Pharmaceutical Analysis
The application of QQQ systems in pharmaceutical and biopharmaceutical research is extensive, providing critical data from early discovery through to clinical trials. Their ability to perform multiplexed analyses allows for the simultaneous quantification of a drug, its metabolites, and potential endogenous biomarkers in a single, high-throughput run [97] [101].
Data extracted from the scientific literature via the Scopus database reveals the profound impact of QQQ systems across key biomedical fields. The table below summarizes the number of scientific publications utilizing different analytical platforms in these domains over the last decade (2014-2024), highlighting the dominant position of tandem mass spectrometry (primarily QQQ) [98].
Table 1: Analysis of Scientific Publications (2014-2024) by Application Area and Analytical Platform
| Application Area | Total Publications | Tandem MS (QQQ) | Q-TOF | Orbitrap | Immunoassay |
|---|---|---|---|---|---|
| Newborn Screening | 924 | 823 (89%) | 1 | 6 | 167 |
| Endocrine Testing | 1,122 | 975 (87%) | 17 | 38 | 315 |
This data shows that triple quadrupole systems are the instrument of choice in highly quantitative, regulated applications, outperforming high-resolution accurate mass (HRAM) platforms and traditional immunoassays [98]. In pharmaceutical and biopharma contexts, QQQ systems are essential for [101]:
- Bioanalysis and Bioequivalence Studies: Quantifying drug concentrations in biological fluids for pharmacokinetic studies.
- Biologics and Oligonucleotide Quantification: Addressing the complex analytical challenges presented by large-molecule therapeutics.
- Biomarker Verification: Robustly measuring candidate biomarkers in validation studies.
A key driver for adopting LC-MS/MS over immunoassays is the superior specificity of the former, avoiding issues of antibody cross-reactivity that can lead to false positives and overestimated concentrations [98]. As noted by experts in the field, while LC-MS can involve higher initial costs, its benefits in mitigating reliance on critical reagents often make it "the best tool for the job" for modern biologic bioanalysis [18].
Detailed MRM Protocol for Targeted Protein Quantitation
The following section provides a step-by-step protocol for a targeted MRM assay, exemplifying a typical workflow for quantifying proteins or peptides in a complex matrix. This methodology is widely applicable in pharmaceutical research for quantifying protein biomarkers or biotherapeutic agents.
Research Reagent Solutions and Essential Materials
Table 2: Key Reagents and Materials for MRM Assay Development
| Item | Function / Description | Example |
|---|---|---|
| Triple Quadrupole MS | Instrument platform for sensitive, specific MRM detection. | Agilent 6495, Thermo Scientific Quantis/Altis, Bruker EVOQ LC-TQ [12] [102] [99] |
| Liquid Chromatography System | High-resolution separation of peptides prior to MS analysis. | Agilent 1290 Infinity LC system [102] |
| Reverse-Phase UHPLC Column | Stationary phase for peptide separation based on hydrophobicity. | Zorbax Eclipse Plus RP-UHPLC column (2.1 × 150 mm, 1.8 μm) [102] |
| Trypsin | Proteolytic enzyme for digesting proteins into measurable peptides. | Sequencing-grade modified trypsin |
| Stable Isotope-Labeled (SIS) Peptides | Internal standards for precise quantification, correcting for sample prep variability and ion suppression. | Purified SIS peptides [102] |
| Software for Method Building & Data Analysis | Creates MRM methods, analyzes data, and quantifies results. | Skyline, TraceFinder, LCQUAN [12] [102] |
| Mobile Phase A | Aqueous phase for LC gradient. | 0.1% Formic acid in water [102] |
| Mobile Phase B | Organic phase for LC gradient. | 0.1% Formic acid in acetonitrile [102] |
Experimental Workflow and Methodology
The complete workflow for developing and executing an MRM assay, from sample preparation to data analysis, is visualized below.
Step-by-Step Protocol:
Sample Preparation:
- Extract proteins from the biological matrix (e.g., plasma, tissue homogenate).
- Perform reduction and alkylation of cysteine residues to denature proteins and prevent disulfide bond reformation.
- Digest the protein sample into peptides using trypsin (typically overnight at 37°C). Trypsin cleaves at the C-terminal side of lysine and arginine residues, generating peptides suitable for LC-MS/MS analysis [97].
Selection of Proteotypic Peptides:
- For the target protein, select peptide sequences that are unique to it (proteotypic) to avoid interference.
- Ideal peptides are typically 8-25 amino acids long, avoid missed cleavage sites, and are not prone to chemical modifications (e.g., oxidation, deamidation) [97].
- These peptides will act as surrogates for quantifying the parent protein.
MRM Method Development and Optimization:
- Utilize a purified stable isotope-labeled (SIS) version of each target peptide for method optimization. The SIS peptide is chemically identical to the natural peptide but heavier in mass, making it distinguishable by the mass spectrometer.
- Infuse the SIS peptide and use software (e.g., Skyline) to empirically determine the optimal precursor ion charge state, fragmentor voltage, and collision energies to generate the most intense product ions [102].
- For each peptide, typically five transitions (precursor ion → product ion pairs) are monitored: one serves as the primary "quantifier" and the others as "qualifiers" to confirm peptide identity [102].
Liquid Chromatography:
- Reconstitute the tryptic digest in a suitable aqueous solvent and inject onto the LC column.
- Separate peptides using a reversed-phase UHPLC column with a multi-step gradient of increasing organic solvent (e.g., from 2% to 80% acetonitrile with 0.1% formic acid) over a 60-minute run [102].
- Maintain the column at an elevated temperature (e.g., 50°C) to improve chromatographic resolution.
Mass Spectrometric Detection (MRM):
- The LC eluent is introduced into the triple quadrupole mass spectrometer via an electrospray ionization (ESI) source operated in positive ion mode.
- Set key source parameters for optimal ionization: capillary voltage (e.g., 3.5 kV), sheath and drying gas flows and temperatures, and nebulizer pressure [102].
- The mass spectrometer is programmed to cycle through the list of predefined MRM transitions for each peptide within its specific elution window. A typical cycle time is 900 ms to ensure sufficient data points across each chromatographic peak [102].
Data Analysis and Quantification:
- Process the raw data using quantitative analysis software (e.g., Skyline, LCQUAN).
- Integrate the peak areas for the MRM transitions of both the natural (light) peptide and the SIS (heavy) peptide added at a known concentration as an internal standard.
- The ratio of the light peptide peak area to the heavy peptide peak area is used to calculate the absolute concentration of the target protein in the original sample, correcting for sample loss and ion suppression effects [97].
Instrumentation and Key Technological Advances
Modern triple quadrupole systems incorporate several innovations that enhance their performance for routine pharmaceutical analysis. Key differentiators among commercial systems include sensitivity, resolution, scan speed, and features designed for robustness and ease of use [12].
Manufacturers continuously refine key components. For instance, the interlaced quadrupole (IQ) dual ion funnel on Bruker's EVOQ series and the segmented quadrupoles on Thermo Scientific's Altis and Quantis systems are designed to increase ion transmission efficiency, thereby boosting sensitivity [12] [99]. The Vacuum Insulated Probe (VIP) heated electrospray source is another innovation that improves the analysis of thermally labile molecules at high flow rates, enhancing robustness [99].
Software integration is equally critical. Modern platforms come with intuitive MRM Method Builders that contain extensive libraries of pre-defined transitions for thousands of compounds, dramatically simplifying and accelerating method development [99]. Furthermore, client-server based software architectures and features for remote monitoring and 21 CFR Part 11 compliance make these systems well-suited for high-throughput, regulated environments [12] [99].
Triple quadrupole mass spectrometers, through their robust MRM capabilities, have irrevocably cemented their status as the gold standard for targeted quantitation in pharmaceutical analysis. Their superior specificity, sensitivity, and capacity for highly multiplexed analysis allow for the reliable quantification of drugs, metabolites, and biomarkers in complex matrices, a task essential for effective drug development and safety assessment. As instrument technology and software continue to evolve, offering greater sensitivity and ease of use, the dominance of the QQQ platform in the quantitative bioanalytical laboratory is assured for the foreseeable future. Its role is pivotal in generating the high-quality data required to advance new therapeutics through the pipeline and into the clinic.
The fields of high-performance liquid chromatography (HPLC) and mass spectrometry (MS) have undergone significant technological evolution between 2024 and 2025, introducing instrumentation with remarkable gains in sensitivity, speed, and analytical precision. These advancements are particularly transformative for the pharmaceutical industry, where they enable deeper characterization of complex biotherapeutics, enhance quality control (QC) workflows, and accelerate drug discovery and development timelines [23] [103]. This review provides a critical evaluation of the latest HPLC and MS systems launched during this period, detailing their technical specifications and presenting structured application notes and protocols for their implementation in pharmaceutical analysis.
Latest HPLC/UHPLC Systems (2024-2025)
The recent introductions in HPLC and Ultra-High-Performance Liquid Chromatography (UHPLC) showcase a trend towards higher pressure limits, enhanced bio-inert capabilities for analyzing sensitive biomolecules, and the integration of intelligent software to streamline operations and reduce errors [16].
Table 1: Key New HPLC/UHPLC Systems (2024-2025)
| Manufacturer | System Model | Key Specifications | Primary Pharma Application |
|---|---|---|---|
| Agilent | Infinity III LC Series [16] | Up to 1300 bar pressure; Bio-inert flow path | Method development; High-throughput analysis; Online SPE |
| Shimadzu | i-Series HPLC/UHPLC [16] | 70 MPa (10,152 psi); Compact, eco-friendly design | Flexible method development with various detectors |
| Waters | Alliance iS Bio HPLC [16] | 12,000 psi; MaxPeak HPS technology; Bio-inert | Biopharmaceutical QC for proteins & oligonucleotides |
| Thermo Fisher | Vanquish Neo UHPLC [16] | Tandem direct injection workflow | Increased sample throughput; Reduced carryover |
| Knauer | Azura HTQC UHPLC [16] | 1240 bar; Flow rates up to 10 mL/min | High-throughput quality control (QC) |
| Sartorius | Hypersep Flowdrive [16] | Up to 100 bar; Flow rates up to 2500 L/h | Preparative purification of peptides & oligonucleotides |
A significant trend is the development of systems specifically designed for biopharmaceutical QC laboratories. For example, the Waters Alliance iS Bio HPLC System incorporates instrument intelligence with built-in functions designed to eliminate up to 40% of common laboratory errors, thereby boosting operational efficiency and reliability in regulated environments [16] [104]. Furthermore, the market shows a movement towards automation and UHPLC adoption, driven by the need for greater precision and throughput in pharmaceutical analysis [105] [104].
Advanced Mass Spectrometry Platforms (2024-2025)
Innovation in mass spectrometry has been driven by the demands of proteomics, multiomics, and the characterization of next-generation biotherapeutics. Recent platforms offer unprecedented scan speeds, sensitivity, and resolution.
Table 2: Key New Mass Spectrometry Systems (2024-2025)
| Manufacturer | System Model | Technology | Key Performance Features | Primary Pharma Application |
|---|---|---|---|---|
| Thermo Fisher | Orbitrap Astral Zoom [106] | HRAM Orbitrap-Astral | 35% faster scan speeds; 40% higher throughput | Deep proteomics; Biomarker discovery |
| Thermo Fisher | Orbitrap Excedion Pro [106] | HRAM Orbitrap | Alternative fragmentation technologies | Intact mAb analysis; Post-translational modifications |
| Bruker | timsTOF Ultra 2 [16] | Trapped Ion Mobility-TOF | Deep, high-fidelity 4D proteomics | Proteomics & multiomics of cell lines & tissues |
| Sciex | 7500+ MS/MS [16] | Triple Quadrupole | 900 MRM/sec; Mass Guard technology | High-sensitivity quantitative analysis |
| Sciex | ZenoTOF 7600+ [16] | High-resolution TOF | Zeno Trap; Electron Activated Dissociation (EAD) | Advanced proteomics & biomarker research |
| Waters | BioAccord LC-MS [107] | Compact Benchtop TOF | Extended mass range to m/z 9000 | Native MS for protein complexes & aggregates |
The extension of the mass detection window on systems like the Waters BioAccord to m/z 9000 is a direct response to the growing need for analyzing larger, more complex molecules like antibody-drug conjugates (ADCs) and non-covalent protein complexes under native conditions [107]. Meanwhile, the new Orbitrap systems are pushing the boundaries of what is possible in proteomic depth and throughput, enabling researchers to quantify and validate proteins with greater precision and scale than ever before [106].
Application Note: Native MS Analysis of Protein Aggregates
Objective
To characterize high molecular weight (HMW) aggregates in a stressed monoclonal antibody (mAb) sample using Size Exclusion Chromatography coupled to native Mass Spectrometry (SEC-MS) on the Waters BioAccord LC-MS System with Extended Mass Range (EMR) [107].
Experimental Protocol
Materials and Reagents
- Analytical System: Waters BioAccord LC-MS System with ACQUITY RDa Detector [107].
- SEC Column: ACQUITY UPLC Protein BEH SEC Column, 200 Å, 1.7 µm, 2.1 x 150 mm [107].
- Mobile Phase: 50 mM Ammonium Acetate, pH 6.8.
- Sample: Monoclonal antibody (e.g., infliximab) subjected to freeze-thaw stress to induce aggregation [107].
Chromatographic and MS Conditions
- Column Temperature: 30 °C.
- Elution: Isocratic, over 10 minutes.
- Flow Rate: As per column specifications (e.g., 0.1 - 0.3 mL/min).
- MS Detection: ESI positive ion mode.
- Mass Range: m/z 400-9000 (Extended Mass Range mode).
- Instrument Calibration: Perform using the standard BioAccord calibration solution.
Procedure
- System Setup and Equilibration: Install the SEC column and equilibrate the system with at least 5-10 column volumes of the 50 mM ammonium acetate mobile phase.
- MS Calibration: Calibrate the mass spectrometer in the EMR mode (m/z 400-9000) using the provided calibration solution.
- Sample Analysis: Inject the stressed mAb sample.
- Data Acquisition: Simultaneously acquire UV (280 nm) and mass spectrometry data.
- Data Analysis: In the software, deconvolute the mass spectra corresponding to the monomer and HMW peaks to determine their molecular weights.
Expected Results and Analysis
The UV chromatogram will show the main monomeric protein peak and a smaller, earlier-eluting peak for the HMW aggregate [107]. The key differentiator of the EMR method is the mass spectrum of this HMW peak. It is expected to show a charge state distribution in the m/z 6500-8500 range, which, upon deconvolution, will confirm a mass consistent with a dimer of the mAb [107]. This dimer species would likely be missed with a standard mass range acquisition.
The Scientist's Toolkit: Key Research Reagent Solutions
Table 3: Essential Materials for Native MS Analysis of mAbs
| Item | Function/Description |
|---|---|
| Bio-inert UHPLC System | Prevents metal adsorption and maintains protein integrity. Examples: Alliance iS Bio, Infinity III Bio LC [16]. |
| Size Exclusion Column | Separates protein monomers from aggregates based on hydrodynamic size under non-denaturing conditions [107]. |
| Volatile Buffer (Ammonium Acetate) | Provides necessary ionic strength for separation without interfering with MS ionization [107]. |
| Extended Range MS Detector | Enables detection of high m/z ions from large, lightly charged protein aggregates (e.g., BioAccord with EMR) [107]. |
| Native MS Calibration Standard | A known protein complex for verifying system performance in native mode (e.g., Yeast Alcohol Dehydrogenase) [107]. |
Application Note: High-Throughput Quantitative Analysis for PK/Studies
Objective
To demonstrate a high-throughput quantitative liquid chromatography-tandem mass spectrometry (LC-MS/MS) method for pharmacokinetic (PK) studies using a modern triple quadrupole mass spectrometer.
Experimental Protocol
Materials and Reagents
- Analytical System: UHPLC system coupled to a modern triple quadrupole MS (e.g., Sciex 7500+ or equivalent) [16].
- Analytical Column: C18 reversed-phase column (e.g., 2.1 x 50 mm, sub-2µm particles).
- Mobile Phases: (A) 0.1% Formic Acid in Water; (B) 0.1% Formic Acid in Acetonitrile.
- Samples: Plasma samples containing the drug candidate and its metabolites, processed via protein precipitation.
Chromatographic and MS Conditions
- Column Temperature: 40-50 °C.
- Gradient: Fast gradient from 5% B to 95% B over 1-2 minutes.
- Flow Rate: 0.4 - 0.6 mL/min.
- Ionization: Electrospray Ionization (ESI), positive or negative mode.
- Data Acquisition: Multiple Reaction Monitoring (MRM) mode. The high speed of modern systems (e.g., 900 MRM/sec for Sciex 7500+) allows monitoring of many analyte transitions concurrently [16].
Procedure
- Sample Preparation: Precipitate proteins from plasma samples using a 3:1 (v/v) ratio of acetonitrile to plasma. Centrifuge and dilute the supernatant.
- System Calibration: Create and analyze a calibration curve of the analyte in processed blank plasma matrix.
- Batch Analysis: Inject study samples using an automated sampler.
- Quantification: Integrate peaks for the analyte and internal standard in each MRM channel. Use the calibration curve to calculate concentrations.
Expected Results and Analysis
A fast UHPLC separation will result in narrow peaks (cycle times of 1-2 minutes), enabling high sample throughput. The use of MRM on a sensitive triple quadrupole MS will provide highly selective and low-level quantification of the drug and its metabolites, which is crucial for generating robust PK data.
The latest HPLC and MS instrumentation launched in 2024-2025 provide pharmaceutical scientists with powerful tools to address increasingly complex analytical challenges. The trends are clear: systems are becoming more intelligent to reduce errors, more sensitive to detect low-abundance species, and more versatile to handle molecules from small chemical entities to large native protein complexes. The application notes detailed herein for aggregate analysis and high-throughput quantification illustrate how these technological advancements can be practically implemented to enhance drug characterization, ensure product quality, and accelerate development timelines. As the industry continues to evolve, these instruments will form the backbone of the analytical workflows that bring safer and more effective medicines to patients.
In modern pharmaceutical analysis, the accurate characterization and quantification of polar and ionic analytes present a significant analytical challenge. Liquid Chromatography-Mass Spectrometry (LC-MS) and Ion Chromatography-Mass Spectrometry (IC-MS) have emerged as two powerful techniques that address this challenge through complementary separation mechanisms [23]. The selection between these techniques is crucial for developing robust analytical methods in drug discovery, bioanalysis, and quality control.
LC-MS has become indispensable in pharmaceutical workflows due to its robustness in both qualitative and quantitative analysis, offering unparalleled sensitivity and specificity for biomolecules, pharmaceuticals, and metabolites [23]. Meanwhile, IC-MS provides specialized capabilities for analyzing highly polar and ionic compounds that may not be well-suited for conventional LC-MS approaches [23]. This application note examines the technical principles, comparative strengths, and specific pharmaceutical applications of both techniques to guide researchers in selecting the appropriate methodology for their analytical needs.
Technical Principles and Comparative Analysis
Liquid Chromatography-Mass Spectrometry (LC-MS)
LC-MS combines the physical separation capabilities of liquid chromatography with the mass analysis power of mass spectrometry. The technique involves the separation of target analytes through interaction with a stationary phase and mobile phase, followed by ionization and mass-based detection [3]. Common ionization techniques include electrospray ionization (ESI) and atmospheric pressure chemical ionization (APCI), which have significantly enhanced sensitivity and expanded the range of detectable analytes [1].
Advanced LC-MS configurations include reversed-phase chromatography (RP-MS) for non-volatile and thermally labile compounds, and hydrophilic interaction chromatography-mass spectrometry (HILIC-MS) for polar compounds [23]. The development of ultra-high-pressure liquid chromatography (UHPLC) coupled with mass spectrometry has led to substantial improvements in resolution, speed, and sensitivity, making LC-MS particularly valuable in pharmacokinetics and toxicology studies [23] [1].
Ion Chromatography-Mass Spectrometry (IC-MS)
IC-MS specializes in the separation and detection of highly polar and ionic compounds through ion-exchange mechanisms. This technique extends the chromatographic separation space beyond what is achievable with reversed-phase chromatography (RP-LC) and HILIC, offering unique capabilities for ionic species [23]. The distinct retention mechanism in IC-MS enables high sensitivity and specificity for metabolites such as sugars, organic acids, nucleotides, and amino acids [23].
While IC-MS shares some application space with HILIC-MS and ion-pairing chromatography, its specialized columns and elution systems provide superior performance for charged molecules, making it particularly valuable in clinical chemistry where detection of ionic metabolites and electrolytes in biological fluids is crucial for diagnosing diseases [23].
Technique Comparison
Table 1: Comparative analysis of LC-MS and IC-MS characteristics
| Parameter | LC-MS | IC-MS |
|---|---|---|
| Primary Separation Mechanism | Reversed-phase, HILIC, mixed-mode | Ion-exchange |
| Optimal Analyte Type | Non-volatile, thermally labile compounds, broad range of organics | Highly polar and ionic compounds |
| Chromatographic Space | Conventional to extended polar compounds | Extended space for ionic compounds |
| Retention Capability | Hydrophobic interactions, polar interactions | Ionic interactions, charge-based separation |
| Key Applications | Drug metabolites, proteomics, lipidomics, pharmaceutical compounds | Ionic metabolites, electrolytes, inorganic ions, polar pesticides |
| Common Detection Modes | ESI, APCI, APPII | Conductivity, amperometric, suppressed conductivity |
| Dynamic Range | Restricted in some applications | Wide concentration range (ng/L to percentage levels) |
Analytical Performance and Mass Spectrometer Selection
The analytical performance of both LC-MS and IC-MS is significantly enhanced when coupled with appropriate mass spectrometry systems. High-Resolution Mass Spectrometry (HRMS) has dramatically improved capabilities for both techniques by enabling separation and detection of analytes with very similar mass-to-charge (m/z) ratios [23].
Table 2: Mass spectrometer selection guide for LC-MS and IC-MS applications
| Mass Spectrometer Type | Analyzer | Optimal Application Mode | Sensitivity | Peak Confirmation | Structural Elucidation |
|---|---|---|---|---|---|
| Single Quadrupole | Quadrupole | Single ion monitoring (SIM) | Good | Good | Poor |
| Triple Quadrupole | Triple Quadrupole | Selected reaction monitoring (SRM) | Better | Better | Good |
| Q-TOF | Time-of-Flight | High-resolution full-scan | Good | Good | Better |
| Orbitrap | Orbitrap | High Resolution Accurate Mass (HRAM) | Best | Best | Best |
For complex lipidomic studies, the resolving power of the mass analyzer becomes critical. For example, Quadrupole Time-of-Flight (QTOF) instruments typically operate with resolving power between 20,000 to 40,000, whereas Orbitrap systems can achieve resolutions up to 500,000-1,000,000 [23]. This difference has practical implications: in phospholipid analysis, QTOF may combine two closely related ions into a single peak, while Orbitrap can distinguish molecules like lysophosphatidylethanolamine (LPE 18:1, m/z = 480.30854) and lysophosphatidylcholine (LPC 16:0p, m/z = 480.34454) [23].
Experimental Protocols
Protocol 1: IC-MS Analysis of Highly Polar Pesticides in Food Matrices
This protocol adapts methodology from polar pesticide analysis for pharmaceutical impurities with similar physicochemical properties [108] [109].
Sample Preparation:
- Extraction: Weigh 2 g homogenized sample into a 50 mL centrifuge tube. Add 10 mL acidified methanol (1% formic acid). Vortex vigorously for 1 minute.
- Extraction: Sonicate for 15 minutes, then centrifuge at 4000 × g for 10 minutes.
- Clean-up: Transfer supernatant to a dSPE tube containing 150 mg C18 sorbent and 50 mg chitosan. Vortex for 30 seconds.
- Centrifugation: Centrifuge at 4000 × g for 5 minutes. Filter the supernatant through a 0.22 μm nylon membrane before IC-MS analysis.
IC-MS Conditions:
- Column: Hybrid ion-exchange/HILIC column (2.1 × 30 mm, 2.7 μm)
- Mobile Phase: A) 10 mM ammonium formate in water, B) acetonitrile
- Gradient: 95% B (0-1 min), 95-70% B (1-8 min), 70% B (8-10 min), 95% B (10-12 min)
- Flow Rate: 0.4 mL/min
- Injection Volume: 5 μL
- Mass Spectrometer: Triple quadrupole with ESI source
- Ionization Mode: Negative mode for glyphosate and AMPA; positive mode for glufosinate
- Detection: Multiple Reaction Monitoring (MRM)
Protocol 2: LC-MS/MS Quantification of ADC Cleavable Payloads in Serum
This protocol demonstrates high-sensitivity quantification of polar pharmaceutical compounds in biological matrices [110].
Sample Preparation:
- Protein Precipitation: Aliquot 5 μL serum into a 1.5 mL microcentrifuge tube. Add 2 μL of 7.5 μM internal standard (Nicotinamide-D4).
- Extraction: Add 15 μL of ice-cold methanol:ethanol (50% v/v). Vortex for 5 minutes.
- Incubation: Place at -20°C for 20 minutes for complete protein precipitation.
- Centrifugation: Centrifuge at 14,000 × g for 10 minutes at 4°C.
- Analysis: Transfer supernatant to autosampler vials for LC-MS/MS analysis.
LC-MS/MS Conditions:
- Column: Kinetex F5 Core-shell (2.1 × 100 mm, 1.7 μm)
- Mobile Phase: A) 0.1% formic acid in water, B) 0.1% formic acid in methanol
- Gradient: 20% B (0 min), 20-70% B (0-2 min), 70% B (2-7 min), 70-90% B (7-8.5 min), 90% B (8.5-10 min), 90-20% B (10-10.5 min), 20% B (10.5-11 min)
- Flow Rate: 0.15 mL/min (0-7 min), 0.3 mL/min (7-10.5 min), 0.15 mL/min (10.5-11 min)
- Column Temperature: 45°C
- Injection Volume: 1 μL
- Mass Spectrometer: Triple quadrupole with ESI interface
- Ionization Mode: Positive mode
- Detection: Multiple Reaction Monitoring (MRM)
Application in Pharmaceutical Analysis
Analysis of Active Pharmaceutical Ingredients and Impurities
IC-MS has proven particularly valuable for analyzing active pharmaceutical ingredients (APIs) and their impurities. For example, the technique can separate and quantify closely related compounds such as gentamicin components (C1, C1a, C2, C2a, C2b) despite their structural similarity [111]. This capability is crucial for quality control of antibiotics where different components may vary in therapeutic efficacy.
In impurity testing, IC-MS enables detection of toxic impurities at trace levels. The analysis of azide impurities in the antihypertensive drug irbesartan demonstrates this application. Azide is strongly toxic to humans, and its concentration must be rigorously controlled. IC-MS with in-line matrix elimination provides a selective, sensitive, and rapid method for azide determination, fulfilling all regulatory requirements for selectivity, detection limits, precision, linearity, accuracy, and robustness [111].
Metabolomics and Biomarker Discovery
Both LC-MS and IC-MS play crucial roles in metabolomics and biomarker discovery. LC-MS is ideal for broad metabolite profiling, while IC-MS provides specialized capabilities for ionic metabolites critical in metabolic pathways. The technique allows precise measurement of compounds like sugar phosphates, organic acids, nucleotides, and amino acids, providing valuable insights into metabolic fluxes [23].
This separation advantage is particularly valuable in stable isotope-resolved metabolomics (SIRM), where detection of isotopologue patterns demands both low background and high resolution [23]. In clinical chemistry, IC-MS enables identification of metabolic imbalances in inherited disorders through detection of ionic metabolites and electrolytes in biological fluids [23].
Polar Compound Analysis in Biologics
The analysis of highly polar compounds extends to biologics development, as demonstrated by the LC-MS/MS workflow for characterizing and quantifying antibody-drug conjugate (ADC) cleavable payloads [110]. This methodology enables simultaneous quantification of six ADC payloads (SN-38, MTX, DXd, MMAE, MMAF, and Calicheamicin) in a single chromatographic run, requiring only 5 μL of serum due to its high sensitivity.
The method demonstrates well-validated linear response ranges of 0.4-100 nM for SN38, MTX and DXd, 0.04-100 nM for MMAE and MMAF, and 0.4-1000 nM for Calicheamicin in mouse serum, with recoveries exceeding 85% for all six payloads [110]. This application highlights the critical role of sensitive LC-MS methods in assessing ADC stability and safety profiles during development.
The Scientist's Toolkit: Essential Research Reagent Solutions
Table 3: Essential materials and reagents for LC-MS and IC-MS analyses
| Item | Function | Application Examples |
|---|---|---|
| Hybrid Ion-Exchange/HILIC Column | Balanced retention of polar ionic compounds | Glyphosate, AMPA, glufosinate analysis in pharmaceutical impurities [109] |
| dSPE Sorbents (C18, Chitosan, PSA) | Matrix clean-up in sample preparation | Removal of interfering compounds in complex samples [108] |
| Acidified Methanol | Extraction solvent for polar compounds | QuPPe method for HPP extraction [108] |
| Passivation Solution | Minimize adsorption to stainless steel flow path | Improve recovery of chelating compounds like glyphosate [109] |
| High Purity Formic Acid | Mobile phase additive for improved ionization | Enhanced sensitivity in LC-MS analysis [110] |
| Characterized Stationary Phases | Specialized separation mechanisms | RP, HILIC, mixed-mode for different analyte classes [23] |
Technique Selection Workflow
The following diagram illustrates the decision process for selecting between LC-MS and IC-MS based on analyte properties and analytical requirements:
LC-MS and IC-MS provide complementary analytical capabilities for polar and ionic analytes in pharmaceutical applications. LC-MS offers broad applicability for diverse compound classes and is particularly well-suited for drug metabolites, proteomics, and lipidomics. IC-MS delivers specialized separation power for highly polar and ionic compounds that challenge conventional LC-MS methods.
The selection between these techniques should be guided by analyte characteristics, with IC-MS being preferred for permanently charged or multiple ionic group compounds, and LC-MS being appropriate for analytes amenable to reversed-phase or HILIC separation. Understanding the strengths and limitations of each technique enables researchers to develop robust, sensitive, and specific methods for challenging pharmaceutical analysis applications, ultimately supporting drug development, quality control, and regulatory compliance.
Conclusion
Liquid Chromatography-Mass Spectrometry has firmly established itself as an indispensable, versatile pillar of pharmaceutical analysis, revolutionizing workflows from early drug discovery to quality control. Its unparalleled sensitivity and specificity enable the precise quantification and characterization of both small and large molecules in complex matrices. As the field advances, the integration of multi-dimensional LC-MS systems, high-resolution mass analyzers, and AI-driven data processing is poised to unlock even deeper biological insights, accelerate high-throughput experimentation, and pave the way for advanced personalized therapeutics. The continued evolution of LC-MS technology promises to further enhance its critical role in ensuring drug safety, efficacy, and innovation for years to come.
References
- 1. Recent Advances in Liquid Chromatography–Mass ... [https://pmc.ncbi.nlm.nih.gov/articles/PMC12204688/]
- 2. Evolving Role of Mass Spectrometry in Pharmaceutical ... [https://www.spectroscopyonline.com/view/evolving-role-of-mass-spectrometry-in-pharmaceutical-analysis-highlighted-in-new-review]
- 3. LC/MS Applications in Drug Development [https://www.bioagilytix.com/blog/lc-ms-applications-in-drug-development/]
- 4. 150 Years Anniversary | LC-MS [https://www.shimadzu.hr/150-years/lcms.html]
- 5. ASMS 2025 in review: Key moments, launches and ... [https://www.selectscience.net/article/asms-2025-in-review]
- 6. Innovations Unveiled: Highlights from ASMS 2025 [https://www.sepscience.com/innovations-unveiled-highlights-from-asms-2025-12029]
- 7. LC–MS for the Separation of Biopharmaceuticals Reviewed [https://www.chromatographyonline.com/view/lc-ms-for-the-separation-of-biopharmaceuticals-reviewed]
- 8. LC-MS/MS-Based Diagnostics Market Size, Trends and ... [https://www.towardshealthcare.com/insights/lc-ms-ms-based-diagnostics-market-sizing]
- 9. Key Trends Reshaping the Liquid Chromatography Mass [https://www.openpr.com/news/4205558/key-trends-reshaping-the-liquid-chromatography-mass]
- 10. Innovative applications and future perspectives of ... [https://www.frontiersin.org/journals/pharmacology/articles/10.3389/fphar.2025.1529468/full]
- 11. Evolving Techniques for Food Analysis - PMC [https://pmc.ncbi.nlm.nih.gov/articles/PMC12345980/]
- 12. Triple Quadrupole LC-MS Comparison Table [https://www.thermofisher.com/us/en/home/industrial/mass-spectrometry/liquid-chromatography-mass-spectrometry-lc-ms/lc-ms-systems/triple-quadrupole-lc-ms/triple-quadrupole-lc-ms-comparison-table.html]
- 13. Orbitrap LC-MS Comparison Chart [https://www.thermofisher.com/us/en/home/industrial/mass-spectrometry/liquid-chromatography-mass-spectrometry-lc-ms/lc-ms-systems/orbitrap-lc-ms/orbitrap-lc-ms-comparison-chart.html]
- 14. Choosing the Right Proteomics Data Analysis Software [https://www.metwarebio.com/proteomics-software-comparison-lc-msms-lfq-tmt-silac-dia/]
- 15. Liquid chromatography -Mass spectrometry (LC-MS) [https://pharmacores.com/liquid-chromatography-mass-spectrometry-lc-ms/]
- 16. New HPLC, MS, and CDS Products from 2024–2025 [https://www.chromatographyonline.com/view/new-hplc-ms-and-cds-products-from-2024-2025-a-brief-review]
- 17. Maximize Performance with Specialized LC-MS Workflows [https://www.thermofisher.com/blog/analyteguru/maximize-performance-with-specialized-lc-ms-workflows-and-save-up-to-40/]
- 18. AAPS PharmSci 360 2025: The Role of LC–MS in ... [https://www.pharmtech.com/view/aaps-pharmsci-360-2025-the-role-of-lc-ms-in-bioanalysis]
- 19. Editorial: Recent advances in pharmaceutical analysis [https://pmc.ncbi.nlm.nih.gov/articles/PMC12491238/]
- 20. Innovations in Liquid Chromatography: 2025 HPLC ... [https://www.chromatographyonline.com/view/innovations-in-liquid-chromatography-2025-hplc-column-and-accessories-review]
- 21. The Mass Spectrometry Advantage in Bioanalytical Testing [https://www.americanpharmaceuticalreview.com/Featured-Articles/619887-Sharper-Faster-Smarter-The-Mass-Spectrometry-Advantage-in-Bioanalytical-Testing/]
- 22. LC Column and Sample Preparation Considerations [https://myadlm.org/cln/cln-industry-insights/2025/lc-column-and-sample-preparation-considerations]
- 23. Comprehensive analytical approaches: The use of LC-MS ... [https://www.sciencedirect.com/science/article/abs/pii/S0026265X25021289]
- 24. LCMS vs. GCMS: When to Choose Each for Optimal ... [https://emerypharma.com/blog/lcms-vs-gcms-when-to-choose-each-for-optimal-results-in-your-analytical-chemistry/]
- 25. Mass spectrometry workflows powering the future of biologics [https://www.drugtargetreview.com/article/187313/mass-spectrometry-workflows-powering-the-future-of-biologics/]
- 26. HPLC 2025 Update Day 2: Pharmaceutical Separations ... [https://www.chromatographyonline.com/view/hplc-2025-update-day-2-pharmaceutical-separations-session]
- 27. Advancement in LC-MS to address DMPK challenges for ... [https://www.acs.org/events/all-events/advancement-in-lc-ms-to-address-dmpk-challenges-for-novel-modalities.html]
- 28. Advancement in LC-MS to address DMPK challenges for ... [https://connect.discoveracs.org/CENWebinars_ThermoFisherScientific_DMPK?partnerref=CENonline]
- 29. Lead Optimization in Drug Discovery | Danaher Life Sciences [https://lifesciences.danaher.com/us/en/library/lead-optimization-drug-discovery-guide.html]
- 30. What is Lead Identification in Drug Discovery? [https://www.aragen.com/what-is-lead-identification-in-drug-discovery/]
- 31. GLP Quantitative Bioanalysis using LC-MS/MS - Biotrial [https://www.biotrial.com/solutions-services/bioanalysis/quantitative-bioanalysis-using-lc-ms-ms/]
- 32. Overview of Therapeutic Drug Monitoring - PMC [https://pmc.ncbi.nlm.nih.gov/articles/PMC2687654/]
- 33. Implementation of pharmacokinetic and pharmacodynamic ... [https://pmc.ncbi.nlm.nih.gov/articles/PMC4112793/]
- 34. Therapeutic Drug Monitoring (TDM) Pricing and Sample ... [https://www.vetmed.auburn.edu/academic-departments/dept-of-anatomy-physiology-pharmacology/clinical-labs/tdm-pricing-and-sample-collection-protocols/]
- 35. Establishing Multi-Dimensional LC-MS Systems for Versatile ... [https://pmc.ncbi.nlm.nih.gov/articles/PMC11944941/]
- 36. Analytical Techniques for the Characterization and ... [https://pmc.ncbi.nlm.nih.gov/articles/PMC9967501/]
- 37. Characterization of Product Related Variants in ... [https://www.chromatographyonline.com/view/characterization-of-product-related-variants-in-therapeutic-monoclonal-antibodies]
- 38. Comprehensive characterization of monoclonal antibody ... [https://pmc.ncbi.nlm.nih.gov/articles/PMC6343775/]
- 39. Biopharmaceutical Multi-Attribute Method [https://www.thermofisher.com/us/en/home/industrial/pharma-biopharma/pharma-biopharma-learning-center/biopharmaceutical-characterization-information/multi-attribute-method.html]
- 40. Development and implementation of an LC-MS-based ... [https://pmc.ncbi.nlm.nih.gov/articles/PMC12410397/]
- 41. Accelerating Monoclonal Antibody Quality Control [https://www.chromatographyonline.com/view/accelerating-monoclonal-antibody-quality-control-the-role-of-lc-ms-in-upstream-bioprocessing]
- 42. Systematic analytical workflow for characterisation and ... [https://www.sciencedirect.com/science/article/abs/pii/S0003269723000386]
- 43. Anvisa RDC 964/2025: What You Need To Know About ... [https://www.lhasalimited.org/blog/anvisa-rdc-964-2025/]
- 44. An unexpected impurity in my drug product, what now? [https://www.nelsonlabs.com/an-unexpected-impurity-in-my-drug-product-what-now/]
- 45. Specialty Impurity Standards in 2025: A Practical Guide for ... [https://www.pharmaffiliates.com/en/blog/specialty-impurity-standards-in-2025-a-practical-guide-for-r-and-d-and-qc-laboratories]
- 46. Integrative stability and forced degradation analysis to ... [https://www.sciencedirect.com/science/article/abs/pii/S0026265X25009063]
- 47. Protecting drug safety with forced degradation data ... [https://www.rdworldonline.com/protecting-drug-safety-with-forced-degradation-data-management/]
- 48. Comprehensive review on impurity profiling, control ... [https://link.springer.com/article/10.1007/s44371-025-00329-2]
- 49. Advances in high‐throughput mass spectrometry in drug ... [https://pmc.ncbi.nlm.nih.gov/articles/PMC9832828/]
- 50. Ultra-high performance liquid chromatography-MS/MS ... [https://fjps.springeropen.com/articles/10.1186/s43094-019-0007-8]
- 51. Improved Performance of UHPLC–MS Hyphenated Systems [https://www.chromatographyonline.com/view/improved-performance-of-uhplc-ms-hyphenated-systems]
- 52. LC-MS Sample Preparation: Techniques & Challenges [https://opentrons.com/applications/lc-ms-sample-preparation?srsltid=AfmBOorAOAmBlQmH3ORLRzrchWo9nWb6zIS5HwNJp5hM1rW81nLR7sjH]
- 53. Analysis of High Throughput Screening Assays using ... [https://pmc.ncbi.nlm.nih.gov/articles/PMC3635947/]
- 54. Ion Suppression: A Major Concern in Mass Spectrometry [https://www.chromatographyonline.com/view/ion-suppression-major-concern-mass-spectrometry]
- 55. Ion suppression; A critical review on causes, evaluation ... [https://www.sciencedirect.com/science/article/abs/pii/S0039914013001975]
- 56. Optimize LC‑MS/MS Sensitivity: Ion Suppression in ... [https://amsbiopharma.com/lc-ms-ms-sensitivity/]
- 57. Ion suppression in liquid chromatography–mass ... [https://en.wikipedia.org/wiki/Ion_suppression_in_liquid_chromatography%E2%80%93mass_spectrometry]
- 58. Chromatographic Techniques for Improving the LC/MS ... [https://pubmed.ncbi.nlm.nih.gov/40361260/]
- 59. Ion suppression correction and normalization for non- ... [https://www.nature.com/articles/s41467-025-56646-8]
- 60. Compensate for or Minimize Matrix Effects? Strategies ... [https://pmc.ncbi.nlm.nih.gov/articles/PMC7412464/]
- 61. Sample Prep Tech Tip: What is the Matrix Effect [https://www.phenomenex.com/knowledge-center/spe-knowledge-center/what-is-the-matrix-effect?srsltid=AfmBOoqXex5n2Yk2-U2e1DHbLXGtBzHX9_Qzd3puk5p0JgLR_mbi6WBz]
- 62. Two Distinct Sample Prep Approaches to Overcome Matrix ... [https://www.sigmaaldrich.com/US/en/technical-documents/technical-article/analytical-chemistry/solid-phase-extraction/sample-prep-overcome-matrix-effect?srsltid=AfmBOopm49IgA5zv-5zap6Se-s4W-1Z7XDbnE9IVzRK4uf1-2ksHP1CQ]
- 63. Strategies for Developing Sensitive and Automated LC-MS/ ... [https://pmc.ncbi.nlm.nih.gov/articles/PMC3986713/]
- 64. LC-MS Sample Preparation: Techniques & Challenges [https://opentrons.com/applications/lc-ms-sample-preparation?srsltid=AfmBOopRjMKCMXcqn7454JV-CSpn36kJk6cloZjP2hKh-DbGJ46azzBb]
- 65. Solid-Phase Extraction: From Sample Prep Fundamentals ... [https://www.waters.com/blog/solid-phase-extraction-from-sample-prep-fundamentals-to-best-practices/?srsltid=AfmBOoojsJjPbchSA7jQVoRGme9unb5r8rYCo7tUYrKzTWIX5L5g2svV]
- 66. LC-MS Sample Preparation [https://www.thermofisher.com/us/en/home/industrial/mass-spectrometry/mass-spectrometry-learning-center/liquid-chromatography-mass-spectrometry-lc-ms-information/lc-ms-sample-preparation.html]
- 67. Mobile Phase Optimization: A Critical Factor in HPLC [https://www.phenomenex.com/knowledge-center/hplc-knowledge-center/mobile-phase-in-chromatography?srsltid=AfmBOopmqTIScfs020VHJbmX2Oo_aSYjwMWXyn4XvtadcIOXv6p001xJ]
- 68. Methods for Changing Peak Resolution in HPLC [https://www.chromatographyonline.com/view/methods-changing-peak-resolution-hplc-advantages-and-limitations]
- 69. Choosing the Right HPLC Column: A Complete Guide [https://www.phenomenex.com/knowledge-center/hplc-knowledge-center/choosing-the-right-hplc-column?srsltid=AfmBOormm1h0r2FMLnRy5DCsbwTh2ZnkZjtUanhLiqKJn2qCsRZJRjgl]
- 70. How to Select the Optimal Chromatography Column [https://www.coleparmer.com/blog/chromatography-column/]
- 71. Real Solutions to Improve Your HPLC Peak Resolution [https://www.thermofisher.com/blog/analyteguru/real-solutions-to-improve-your-hplc-peak-resolution/]
- 72. Current developments in LC-MS for pharmaceutical analysis - PubMed [https://pubmed.ncbi.nlm.nih.gov/31971527/]
- 73. Trends and Developments in LC–MS [https://www.chromatographyonline.com/view/trends-and-developments-in-lc-ms]
- 74. Understanding the Basics of LC & MS Maintenance [https://labtechsupport.com/blogs/services/understanding-the-basics-of-lc-ms-maintenance-a-guide-for-beginners?srsltid=AfmBOoo4XSgSsiYm_ydF9-hBSLDi4a1pNUwQUv54jbRSsOZ-UghK4Zlg]
- 75. TMPL - Facilities [https://www.uab.edu/proteomics/massspec/instrumentation/tmpl-data-management-plan.php]
- 76. Diagnosing signal instability when processing data in ... [https://sciex.com/support/knowledge-base-articles/the-reason-for-an-unstable-signal-lcmsms_en_us]
- 77. Effective LC Troubleshooting: Symptom-Based Strategies ... [https://www.restek.com/articles/effective-lc-troubleshooting-symptom-based-strategies-and-solutions?srsltid=AfmBOordBkI0DMJhC4hNHHm-IYDcGwN7ZVgkgju-XYLviNTphwIz7P3n]
- 78. Troubleshooting Peak Retention Time Shifts and Non- ... [https://community.agilent.com/knowledge/lc-portal/kmp/lc-articles/kp1561.troubleshooting-peak-retention-time-shifts-and-non-reproducibility-in-lc-systems]
- 79. Critical strategies to pinpoint carryover problems in liquid ... [https://www.sciencedirect.com/science/article/abs/pii/S0026265X22002922]
- 80. Carryover problems [http://www.chromforum.org/viewtopic.php?t=80333]
- 81. LC Troubleshooting Essentials: A Guide to Common ... [https://www.chromatographyonline.com/view/lc-troubleshooting-essentials-a-guide-to-common-problems-and-solutions-for-peak-tailing-ghost-peaks-and-pressure-spikes]
- 82. The Application of LC-MS in Pharmaceutical Analysis ... [https://www.mdpi.com/journal/molecules/special_issues/I7L11Q917T]
- 83. Tutorial review on validation of liquid chromatography ... [https://www.sciencedirect.com/science/article/abs/pii/S0003267015001956]
- 84. Development and Validation of a Sensitive LC-MS/MS Method for the Determination of N-Nitroso-Atenolol in Atenolol-Based Pharmaceuticals [https://www.mdpi.com/2297-8739/12/5/122]
- 85. 8 Essential Characteristics of LC-MS/MS Method Validation [https://www.resolian.com/bioanalytics/8-essential-characteristics-of-lc-ms-ms-method-validation/]
- 86. Validation of a LC/MS method for the determination of gemfibrozil in human plasma and its application to a pharmacokinetic study - PMC [https://pmc.ncbi.nlm.nih.gov/articles/PMC3071626/]
- 87. Development and validation of an LC–MS/MS method for quantitative determination of LXT-101 sustained-release suspension, a novel drug in treating prostate cancer, in beagle plasma | Scientific Reports [https://www.nature.com/articles/s41598-025-96764-3]
- 88. Development and validation of a reliable LC–MS/MS method ... [https://bmcresnotes.biomedcentral.com/articles/10.1186/s13104-019-4580-x]
- 89. A suggested standard for validation of LC-MS/MS based ... [https://pmc.ncbi.nlm.nih.gov/articles/PMC8600988/]
- 90. Orbitrap LC-MS | Thermo Fisher Scientific - US [https://www.thermofisher.com/us/en/home/industrial/mass-spectrometry/liquid-chromatography-mass-spectrometry-lc-ms/lc-ms-systems/orbitrap-lc-ms.html]
- 91. Quadrupole Time-of-Flight Mass Spectrometry - PubMed Central [https://pmc.ncbi.nlm.nih.gov/articles/PMC6719743/]
- 92. Orbitrap - an overview | ScienceDirect Topics [https://www.sciencedirect.com/topics/medicine-and-dentistry/orbitrap]
- 93. Quadrupole Time-of-Flight (QTOF) Mass Spectrometry [https://www.bruker.com/en/products-and-solutions/mass-spectrometry/qtof.html]
- 94. A Workflow to Perform Targeted Metabolomics at the ... [https://pmc.ncbi.nlm.nih.gov/articles/PMC8377714/]
- 95. Ultrahigh-performance liquid chromatography electrospray ... [https://pubmed.ncbi.nlm.nih.gov/25265038/]
- 96. A Workflow to Perform Targeted Metabolomics at the ... [https://figshare.com/articles/dataset/A_Workflow_to_Perform_Targeted_Metabolomics_at_the_Untargeted_Scale_on_a_Triple_Quadrupole_Mass_Spectrometer/16818199]
- 97. Targeted Quantitation of Proteins by Mass Spectrometry [https://pmc.ncbi.nlm.nih.gov/articles/PMC3674507/]
- 98. Current Role and Potential of Triple Quadrupole Mass ... [https://pmc.ncbi.nlm.nih.gov/articles/PMC11643727/]
- 99. EVOQ LC-TQ [https://www.bruker.com/en/products-and-solutions/mass-spectrometry/triple-quads/evoq-lc.html]
- 100. Analytical Instrument Vendors Post Strong Q2 2025 Growth ... [https://www.chromatographyonline.com/view/analytical-instrument-vendors-q2-2025-pharma-chemical-growth]
- 101. Pharma Biopharma Applications [https://www.thermofisher.com/us/en/home/industrial/mass-spectrometry/liquid-chromatography-mass-spectrometry-lc-ms/lc-ms-systems/triple-quadrupole-lc-ms/pharma-biopharma-applications.html]
- 102. LC-MRM/MS assay for targeted analysis [https://bio-protocol.org/exchange/minidetail?id=7034848&type=30]
- 103. Growing Importance of Mass Spectrometry from Drug ... [https://www.pharmasalmanac.com/articles/growing-importance-of-mass-spectrometry-from-drug-discovery-through-commercialization-and-life-cycle-management]
- 104. High-Performance Liquid Chromatography Market Report ... [https://www.thebusinessresearchcompany.com/report/high-performance-liquid-chromatography-global-market-report]
- 105. High-Performance Liquid Chromatography Market to ... [https://www.globenewswire.com/news-release/2025/11/19/3190839/0/en/High-Performance-Liquid-Chromatography-Market-to-Reach-USD-7-74-Billion-by-2032-Driven-by-Rising-Demand-for-Precise-Analytical-Testing-and-Advancing-Lab-Technologies-SNS-Insider.html]
- 106. News Details - Investors - Thermo Fisher Scientific [https://ir.thermofisher.com/investors/news-events/news/news-details/2025/Thermo-Fisher-Scientific-Unveils-Next-generation-Mass-Spectrometers-at-ASMS-2025-to-Revolutionize-Biopharma-Applications-and-Omics-Research/default.aspx]
- 107. BioAccord™ LC-MS System Enhancements for Improved ... [https://www.waters.com/nextgen/us/en/library/application-notes/2025/bioaccord-lc-ms-system-enhancements-for-improved-native-ms-analysis.html?srsltid=AfmBOorB9wQQTTpNS2W6X487hfXHyLECmDwFVVHc96AGkNarmNZRXzCQ]
- 108. Analysis of highly polar pesticides in foods by LC-MS/MS [https://pmc.ncbi.nlm.nih.gov/articles/PMC9910296/]
- 109. LC-MS/MS Analysis of Glyphosate & Other Polar ... [https://www.restek.com/videos/lc-ms-ms-analysis-of-glyphosate-other-polar-contaminants-in-food-with-an-ion-exchange-hilic-column?srsltid=AfmBOorFtntUJ8whQTMYWRxFStqhqykt-oSFgFuc-IZNbkIKIWo6xGkJ]
- 110. A simple and highly sensitive LC–MS workflow for ... [https://www.nature.com/articles/s41598-024-61522-4]
- 111. Ion Chromatography – A Versatile Tool in Pharma Analysis [https://www.chromatographyonline.com/view/ion-chromatography-versatile-tool-pharma-analysis]