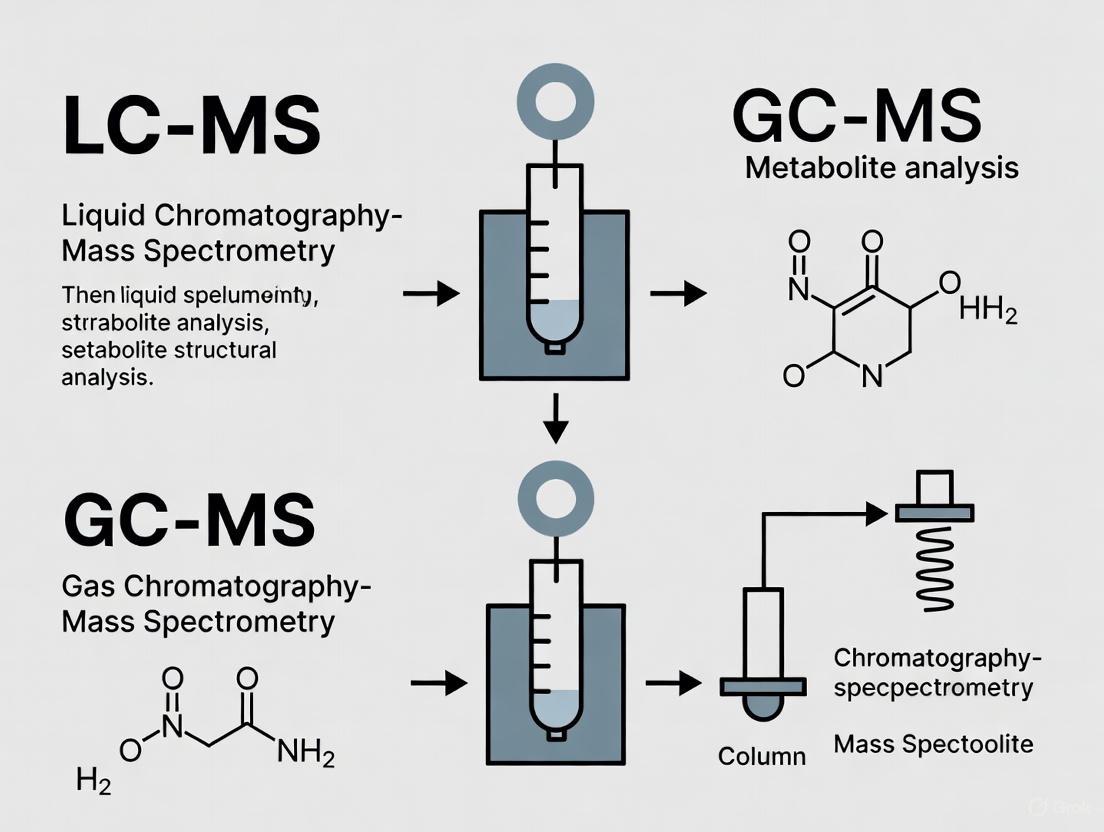
LC-MS vs. GC-MS for Metabolite Analysis: A Strategic Guide for Life Science Researchers
This article provides a comprehensive comparison of Liquid Chromatography-Mass Spectrometry (LC-MS) and Gas Chromatography-Mass Spectrometry (GC-MS) for metabolite analysis, tailored for researchers and drug development professionals.
LC-MS vs. GC-MS for Metabolite Analysis: A Strategic Guide for Life Science Researchers
Abstract
This article provides a comprehensive comparison of Liquid Chromatography-Mass Spectrometry (LC-MS) and Gas Chromatography-Mass Spectrometry (GC-MS) for metabolite analysis, tailored for researchers and drug development professionals. It covers the foundational principles of both platforms, including their distinct ionization sources and separation mechanisms. The scope extends to methodological considerations for diverse applications, best practices for troubleshooting and optimization, and a direct comparative analysis to guide platform selection. By synthesizing current methodologies and applications, this guide aims to empower scientists in selecting the optimal analytical strategy to enhance coverage, data quality, and biological insight in metabolomics studies.
Core Principles: Understanding the Fundamentals of LC-MS and GC-MS
Metabolomics, the comprehensive study of small molecule metabolites, relies heavily on advanced analytical technologies to separate, identify, and quantify compounds within complex biological mixtures. The core components of metabolomics analysis technology are separation and detection, primarily utilizing various chromatographic methods coupled with mass spectrometry [1]. Two principal platforms have emerged as cornerstone technologies in this field: Liquid Chromatography-Mass Spectrometry (LC-MS) and Gas Chromatography-Mass Spectrometry (GC-MS). Each platform offers distinct advantages, limitations, and optimal application ranges, making the choice between them critical for research outcomes.
This guide provides an objective comparison of LC-MS versus GC-MS performance for metabolite analysis, supported by experimental data and detailed methodologies. Within the broader thesis of comparing these analytical platforms, we examine specific workflows from sample preparation to data analysis, enabling researchers to make informed decisions based on their specific analytical needs. The sophisticated interplay between separation science and detection technology forms the foundation of modern metabolomics, allowing scientists to probe biochemical pathways with unprecedented depth and precision [1] [2].
Fundamental Principles and Technical Differences
The fundamental distinction between LC-MS and GC-MS lies in their separation mechanisms and the physical states of their mobile phases. LC-MS uses a liquid mobile phase to move the sample between columns, exploiting the hydrophilic and hydrophobic properties of substances to adsorb onto the solid phase [3] [1]. Different substances separate out in the changing mobile phase, facilitating detection by mass spectrometry. In contrast, GC-MS employs an inert gas mobile phase (typically helium) to transport the sample through a chromatographic column that is typically much longer than those used in liquid chromatography, allowing for superior substance separation [1].
The ionization techniques employed by these platforms differ significantly, profoundly impacting the type of data generated. LC-MS typically uses softer ionization techniques such as Electrospray Ionization (ESI) and Atmospheric Pressure Chemical Ionization (APCI), which cause the substance to become positively or negatively charged without immediately breaking into fragments [1]. Conversely, GC-MS utilizes Electron Impact (EI) ionization, a hard ionization method that breaks molecules into fragment ions before they enter the mass analyzer [1]. This results in rich fragmentation patterns that can be exploited for increased specificity in mass spectral matching.
Table 1: Fundamental Technical Differences Between LC-MS and GC-MS
| Parameter | LC-MS | GC-MS |
|---|---|---|
| Mobile Phase | Liquid (often mixtures of water with organic solvents like methanol or acetonitrile) | Inert gas (typically helium or hydrogen) |
| Separation Mechanism | Hydrophilic/hydrophobic interactions with stationary phase | Volatility and polarity interacting with stationary phase |
| Typical Ionization Sources | ESI, APCI | EI |
| Ionization Character | Soft ionization (often produces molecular ions) | Hard ionization (produces characteristic fragments) |
| Sample State | Dissolved in liquid solvent | Volatile or derivatized to become volatile |
| Chromatographic Column | Shorter columns (typically 50-150 mm) | Longer columns (typically 15-60 m) |
The choice between these platforms significantly influences the metabolomic workflow, from sample preparation requirements to data interpretation strategies. LC-MS has a broader application field for detecting substances such as lipids, amino acids, flavonoids, and anthocyanins, while GC-MS is particularly suitable for analyzing low polarity, low boiling point metabolites, or substances with volatility after derivatization [1].
Experimental Workflows: From Sample to Data
Sample Collection, Quenching, and Metabolite Extraction
Sample collection and preparation are critical steps in the metabolomics workflow that directly impact the quality and reliability of the resulting data. The choice of sample (cell, tissue, blood, urine, etc.) depends on the research question and metabolites of interest [2]. To minimize variability, it is preferred to collect samples at the same time of day, under similar conditions, and in a consistent manner. Samples should be processed as soon as possible to minimize changes in metabolite levels.
The first vital step in sample processing is the rapid quenching (enzymatic inhibition) of total metabolism, followed by the extraction of metabolites in such a way that the extract obtained should quantitatively reflect the endogenous metabolite levels originally present in the sample [2]. For living cells and tissue, which are metabolically active systems, quenching becomes particularly important (less so with biological fluids like blood, plasma, or urine). Several quenching methods exist, including flash freezing in liquid N₂, pouring liquid N₂ directly onto samples, using chilled methanol (-20°C or -80°C), and ice-cold PBS [2]. Quick quenching should be performed immediately after sample collection, as delays may result in deviation of the metabolic scenario from the one desired to be investigated.
Following quenching, organic solvent-based precipitation of proteins and extraction of metabolites occurs. Efficient sample processing is crucial to prevent degradation of labile metabolites and to achieve high-quality data. For non-targeted metabolomics, extraction methods must capture a broad range of metabolites, though the physicochemical diversity of metabolites makes this challenging [2]. A commonly used extraction method is liquid-liquid extraction, which relies on differential immiscibility of solvents. Polar, aqueous solutions are often paired with non-polar organic solvents such as chloroform to form a two-phase system, allowing the separation of polar and non-polar metabolites for subsequent analytical analysis [2].
Diagram 1: Sample Preparation Workflow for Metabolomics Analysis. This diagram illustrates the critical steps from sample collection through metabolic quenching to metabolite extraction, highlighting common methods and solvents used at each stage.
Platform-Specific Sample Preparation
LC-MS Sample Preparation: For LC-MS analysis, the extraction protocol often uses a ternary combination of hydrophilic (water) and lipophilic (isopropanol) solvents with acetonitrile as a medium polarity solvent [4]. To remove very lipophilic lipids that could accumulate in the injection interface and cause carry-over effects, a clean-up step after initial extraction and desiccation is recommended. Without this lipid clean-up step, derivatization reactions may be hampered for certain compound classes like amino acids and polyamines, particularly in postprandial blood plasma samples after lipid-rich meals [4].
GC-MS Sample Preparation: GC-MS requires an additional derivatization step to render compounds volatile enough for analysis. The most common derivatization protocol uses trimethylsilylation or variants like tert-butyldimethylsilylation, both of which remove acidic protons from hydroxyl-, carboxyl-, amino-, or thiol-groups [4]. These derivatization reactions are performed under mild conditions, work rapidly with high yields, break molecular proton bridge bonding, and consequently decrease boiling points while increasing compound stability for GC-MS analysis. While silylation reactions are more universal and easier to perform, some reports suggest complementary strategies such as using ethyl chloroformates [4].
Instrumental Analysis and Data Acquisition
LC-MS Instrumentation and Analysis: LC-MS systems have evolved from basic manual pumps and columns to sophisticated automated systems that provide precise control over chromatographic separations [5]. The development of ionization sources such as ESI, APCI, and Atmospheric Pressure Photoionization (APPI) has profoundly impacted LC-MS performance, facilitating the analysis of pharmaceutical compounds, including nonvolatile and polar or less polar molecules with lower molecular weights [5]. Mass analyzers commonly used in LC-MS include ion traps (ITs), quadrupoles (Q), Orbitrap, and time-of-flight (TOF) instruments, as well as hybrid systems offering high resolution, enhanced sensitivity, and superior mass accuracy across a wide dynamic range [5].
GC-MS Instrumentation and Analysis: GC-MS represents the most standardized method in metabolomics, with almost 50 years of established protocols for metabolite analyses [4]. The technology is considered a "gold standard" in metabolomics against which newer approaches should be compared with respect to breadth, sensitivity, and specificity of metabolite detections [4]. The electron ionization used in GC-MS leads to complex and rich fragmentation patterns which can be exploited to increase specificity in mass spectral matching, especially when using large user libraries with standardized protocols for data acquisition. Automated mass spectral deconvolution software (AMDIS) has been freely available for GC-MS since 1998 and has been successfully used for metabolomics since that time [4].
Diagram 2: Instrumental Analysis Pathways for LC-MS and GC-MS. This diagram illustrates the distinct analytical pathways for both platforms, highlighting the critical differences in separation mechanisms, ionization techniques, and the additional derivatization step required for GC-MS analysis of non-volatile compounds.
Performance Comparison: Experimental Data
Sensitivity and Detection Limits
Direct comparisons of LC-MS and GC-MS performance reveal platform-specific advantages depending on the analyte characteristics. In a study comparing pharmaceuticals and personal care products (PPCPs) in surface water, HPLC-TOF-MS yielded lower detection limits than GC-MS for most compounds [6]. The detection limits ranged from 0.4 to 6 ng L⁻¹ for target compounds using the developed LC-MS/MS method, with recoveries for most compounds above 70% with relative standard deviation below 20% [7].
When comparing the analysis of hormones and pesticides in surface waters, both GC-MS/MS and LC-MS/MS demonstrated comparable performance for most compounds, with exceptions for specific analyte classes. GC-MS/MS outperformed LC-MS/MS for legacy organochlorine pesticides, such as DDT and its metabolites [7]. However, because of the very low water solubility of these compounds, they are less likely to be found in surface water samples. Conversely, LC-MS/MS enabled simultaneous analysis of highly water-soluble endocrine disrupting compounds (EDCs) such as estrogens and their conjugates with currently registered pesticides without the need for derivatization [7].
Table 2: Performance Comparison of LC-MS and GC-MS for Metabolite Analysis
| Performance Metric | LC-MS | GC-MS | Experimental Context |
|---|---|---|---|
| Sensitivity | 10⁻¹⁵ mol [1] | 10⁻¹² mol [1] | General metabolomics applications |
| Detection Limits | 0.4-6 ng L⁻¹ for PPCPs [7] | Higher than LC-MS for most PPCPs [6] | Analysis of pharmaceuticals in water |
| Recovery Rates | >70% for most compounds [7] | Variable depending on compound volatility | Environmental sample analysis |
| Compound Coverage | Broad range including non-volatile, thermally labile, and high molecular weight compounds [1] | Volatile and semi-volatile compounds, or those renderable volatile via derivatization [1] | Untargeted metabolomics |
| Reproducibility | RSD <20% achievable [7] | High reproducibility with standardized libraries [4] | Inter-laboratory comparisons |
| Analysis Speed | 2-5 minutes per sample with UHPLC-MS [5] | Generally longer run times due to temperature programming | High-throughput applications |
Application-Specific Performance
The optimal platform choice heavily depends on the specific analytical application and compound classes of interest. GC-MS is ideal for identifying and quantitating small molecular metabolites (<650 daltons), including small acids, alcohols, hydroxyl acids, amino acids, sugars, fatty acids, sterols, catecholamines, drugs, and toxins, often using chemical derivatization to make these compounds volatile enough for gas chromatography [4]. The mature nature of GC-MS technology is evidenced by comprehensive spectral libraries such as the NIST14 library, which comprises GC-MS mass spectra for 242,477 unique compounds, roughly one-third with recorded standardized retention times [4].
LC-MS offers distinct advantages for different compound classes. It has a broader application field, especially due to its wide range of detectable substances such as lipids, amino acids, flavonoids, and anthocyanins, with significantly higher sensitivity compared to other detection techniques [1]. The capacity of LC-MS to multiplex several analytes within a single analytical run with minimal incremental cost represents another significant advantage for targeted analyses [1].
Data Processing, Analysis, and Visualization
Data Preprocessing and Quality Control
Mass spectrometry-based metabolomics generates extensive datasets that require specific data exploration skills to identify and visualize statistically significant trends and biologically relevant differences [8]. Quality Assurance (QA) and Quality Control (QC) are critical components in metabolomics, ensuring the reliability, reproducibility, and integrity of data [2]. The Metabolomics Quality Assurance and Quality Control Consortium (mQACC) is a collaborative effort dedicated to defining and advancing best practices in QA and QC within metabolomics [2].
A common approach involves using quality control samples obtained by pooling small aliquots of all biological samples or purchased reference materials [8]. These QCs are instrumental for evaluating data quality, providing insight into technical variability, and normalizing data to remove batch effects [8]. Missing value management represents another critical step in data preprocessing, with strategies including imputation by constant value (e.g., percentage of the lowest concentration), k-nearest neighbors (kNN) algorithm, or random forest methods [8].
Statistical Analysis and Visualization Strategies
Effective data visualization is crucial at every stage of the metabolomics workflow, providing core components of data inspection, evaluation, and sharing capabilities [9] [10]. For untargeted LC-MS/MS-based metabolomics, visualization strategies include scatter plots, boxplots, cluster heatmaps, and network visualizations that help researchers navigate complex datasets and gain specific insights [9].
Volcano plots provide a snapshot view of treatment impacts and affected metabolites, while dimensionality reduction techniques such as Principal Component Analysis (PCA) help visualize sample clustering and outliers [8]. For lipidomics data, specialized visualizations including lipid maps and fatty acyl chain plots effectively represent the complex relationships within lipid classes [8]. The field has seen the development of numerous computational tools and platforms, including MetaboAnalyst, LipidSig, and LipidMaps Statistical Analysis Tool, which facilitate data exploration through user-friendly interfaces [8].
Diagram 3: Metabolomics Data Analysis Workflow. This diagram outlines the key steps in processing and interpreting metabolomics data, from raw data preprocessing through statistical analysis to biological interpretation and visualization.
Essential Research Reagents and Materials
Table 3: Essential Research Reagents for Metabolomics Workflows
| Reagent/Material | Function | Application Notes |
|---|---|---|
| Methanol | Metabolite extraction, protein precipitation, quenching agent | Often used in combination with chloroform or water for biphasic extraction [2] |
| Chloroform | Lipid extraction, non-polar metabolite separation | Component of Folch and Bligh & Dyer methods for lipid extraction [2] |
| MTBE (Methyl tert-butyl ether) | Lipid extraction, particularly for lipophilic metabolites | Non-polar solvent with high affinity for lipids [2] |
| Derivatization Reagents (e.g., MSTFA, BSTFA) | Render metabolites volatile for GC-MS analysis | Trimethylsilylation reagents remove acidic protons from functional groups [4] |
| Internal Standards (isotope-labeled) | Quantification reference, compensation for technical variability | Should have similar chemical properties to target metabolites [2] |
| Formic Acid | Mobile phase modifier for LC-MS | Improves ionization efficiency in positive ion mode [6] |
| Ammonium Acetate/Formate | Mobile phase buffers for LC-MS | Provides consistent ionization conditions, especially in negative ion mode |
| Quality Control Materials (e.g., NIST SRM 1950) | Method validation, inter-laboratory comparison | Standard reference material for plasma metabolomics [8] |
The choice between LC-MS and GC-MS for metabolomics research depends primarily on the specific research questions, target metabolite classes, and available resources. GC-MS remains the gold standard for analyzing volatile compounds and those that can be rendered volatile through derivatization, leveraging extensive spectral libraries and standardized protocols [4]. Its rich fragmentation patterns provide structural information that facilitates compound identification. LC-MS offers broader coverage of metabolite classes, particularly non-volatile, thermally labile, and high molecular weight compounds, with superior sensitivity and without the need for derivatization [1].
For comprehensive metabolomic coverage, many laboratories implement both platforms in complementary approaches. The continuous advancement of both technologies, including improvements in mass analyzer design, ionization efficiency, and chromatographic resolution, ensures that both LC-MS and GC-MS will remain indispensable tools in the metabolomics workflow. By understanding their respective strengths and limitations, researchers can optimize their analytical strategies to extract maximum biological insight from complex metabolic systems.
Liquid Chromatography-Mass Spectrometry (LC-MS) has become a cornerstone technique for metabolite analysis, particularly valued for its ability to characterize a wide range of biologically relevant molecules. Its core technological strength lies in the synergistic combination of liquid chromatography separation and soft ionization techniques, which together enable the sensitive analysis of non-volatile, thermally labile, and high-molecular-weight compounds that are prevalent in biological systems [11] [12]. This technical profile examines these foundational technologies and positions LC-MS within the broader analytical context by comparing it with Gas Chromatography-Mass Spectrometry (GC-MS), another premier analytical technique.
While both LC-MS and GC-MS integrate chromatography with mass spectrometry to separate, identify, and quantify chemicals in complex mixtures, they differ fundamentally in their operational principles and application domains [11]. GC-MS employs a gas mobile phase and requires sample vaporization, making it ideal for volatile and semi-volatile compounds. In contrast, LC-MS uses a liquid mobile phase and softer ionization methods, making it uniquely suitable for analyzing pharmaceuticals, proteins, metabolites, and other compounds that cannot withstand the high temperatures required for vaporization in GC-MS [11] [12]. Understanding these distinctions enables researchers to select the optimal technology for their specific analytical challenges in drug development and metabolic research.
Core Technology Breakdown: Liquid Chromatography Separation
The liquid chromatography component of LC-MS serves as the critical front-end separation system that resolves complex biological samples into individual components before mass analysis. This separation occurs through differential partitioning of analytes between a stationary phase (typically hydrophobic C18 particles packed into a column) and a liquid mobile phase that is pumped through the system at high pressure [12].
The separation mechanism leverages the varying degrees of interaction between different metabolites and the stationary phase. Retention time - the time taken for a compound to elute from the column - serves as a key identifying characteristic that is influenced by multiple factors including compound polarity, molecular structure, and mobile phase composition [13]. In modern metabolomics, retention time has proven particularly valuable for distinguishing between isomeric candidate structures when combined with high-resolution mass spectrometry data, providing an orthogonal dimension for compound identification [13].
Recent advances have focused on improving the predictability and reproducibility of chromatographic separations. Approaches include experimental projection methods that translate retention times between different chromatographic systems, and machine learning models that predict retention behavior from molecular structure [13]. The similarity between chromatographic systems - particularly regarding column chemistry and mobile phase pH - has been identified as a crucial factor affecting the accuracy of these predictive approaches [13].
Core Technology Breakdown: Soft Ionization Techniques
Soft ionization represents the second critical technological pillar of LC-MS, enabling the transformation of liquid-phase separated compounds into gas-phase ions suitable for mass analysis without extensive fragmentation. The predominant soft ionization techniques in LC-MS are Electrospray Ionization (ESI) and Atmospheric Pressure Chemical Ionization (APCI), with ESI being particularly widely adopted in metabolomics applications [12].
ESI operates by applying a high voltage to a liquid stream as it exits a capillary, creating a fine aerosol of charged droplets. As the solvent evaporates, the charge concentration increases until the Rayleigh limit is reached, leading to Coulombic fission and ultimately producing gas-phase ions [2]. This process gently transfers pre-existing ions from solution to the gas phase and can also promote ionization through adduct formation (e.g., with sodium, ammonium, or protons). The "soft" nature of this technique preserves molecular integrity, allowing the detection of intact molecular ions with minimal fragmentation, which is crucial for accurate molecular weight determination and structural characterization [12].
The flexibility in ionization techniques allows researchers to tailor LC-MS methods to specific compound classes. ESI is particularly effective for polar compounds and molecules that already exist as ions in solution, while APCI can handle less polar compounds and offers enhanced compatibility with higher flow rates and a broader range of mobile phase compositions [12]. This adaptability makes LC-MS suitable for analyzing diverse metabolite classes with varying chemical properties.
LC-MS versus GC-MS: Performance Comparison and Experimental Data
Direct comparative studies reveal distinct performance characteristics and application boundaries for LC-MS and GC-MS technologies. Understanding these differences is essential for selecting the appropriate analytical platform for specific research questions in metabolite analysis.
Table 1: Technical and Performance Comparison Between LC-MS and GC-MS
| Parameter | LC-MS | GC-MS |
|---|---|---|
| Mobile Phase | Liquid (solvents/buffers) | Gas (helium, hydrogen) [11] |
| Sample State | Liquid, minimal preparation | Must be volatile and thermally stable [11] |
| Typical Analytes | Non-volatile, thermally labile, polar, high molecular weight compounds [12] | Volatile, semi-volatile, thermally stable compounds [11] |
| Derivatization Requirement | Generally not required | Often required for non-volatile compounds [12] |
| Ionization Techniques | ESI, APCI (soft ionization) [12] | EI (hard ionization), CI |
| Typical Detection Limits | Lower for many pharmaceuticals and PPCPs [6] | Varies by compound; can be higher for some analytes [6] |
| Operational Costs | Higher initial investment and maintenance [12] | More affordable operation and maintenance [11] |
A comparative study analyzing pharmaceuticals and personal care products (PPCPs) in water samples demonstrated that HPLC-TOF-MS (a form of LC-MS) generally yielded lower detection limits than GC-MS for the compounds studied [6]. This enhanced sensitivity for certain compound classes makes LC-MS particularly valuable in applications requiring trace-level detection.
For metabolomic studies, each technique offers complementary coverage of the metabolome. GC-MS is limited to volatile compounds or those that can be made volatile through derivatization, while LC-MS can analyze a much broader range of metabolites without chemical modification [14]. This distinction was evident in a study of lupus nephritis patients, where the combined application of both GC/MS and LC/MS enabled the identification of 41 potential metabolic biomarkers, providing a more comprehensive metabolic profile than either technique could achieve alone [14].
Table 2: Application-Based Technique Selection Guide
| Research Application | Recommended Technique | Rationale |
|---|---|---|
| Drug Metabolism Studies | LC-MS | Ideal for polar metabolites, conjugates, and thermally labile compounds [12] |
| Volatile Compound Profiling | GC-MS | Excellent for essential oils, fuels, solvents [11] |
| Lipidomics | LC-MS | Superior for intact lipids, phospholipids [2] |
| Environmental Pollutant Analysis | Both (compound-dependent) | GC-MS for VOCs/PAHs; LC-MS for pesticides/PPCPs [6] |
| Forensic Toxicology | Both (complementary) | GC-MS for traditional drugs; LC-MS for polar metabolites [11] |
| Protein/Peptide Analysis | LC-MS | Handles high molecular weight biomolecules [12] |
| Metabolomics Discovery | Both (complementary) | Combined approach maximizes metabolome coverage [14] |
Experimental Protocols and Methodologies
LC-MS Metabolomic Workflow Protocol
A standardized workflow is essential for generating reliable and reproducible LC-MS metabolomic data. The following protocol, adapted from current metabolomic research, outlines the key steps from sample preparation to data analysis [2]:
Sample Collection and Quenching: Collect biological samples (cells, tissue, blood, urine) using sterile techniques. Immediately quench metabolism through flash freezing in liquid N₂ or using chilled methanol (-20°C to -80°C) to preserve the metabolic profile at the time of collection [2].
Metabolite Extraction: Employ liquid-liquid extraction with appropriate solvent systems. For comprehensive metabolite coverage, use biphasic systems like methanol/chloroform/water (typical ratios 1:1:0.5) to simultaneously extract polar (methanol/water phase) and non-polar metabolites (chloroform phase) [2]. Add internal standards (e.g., stable isotope-labeled compounds) at known concentrations prior to extraction to correct for technical variability [2].
Chromatographic Separation: Inject extracts onto a reversed-phase UHPLC system. Use a C18 column (e.g., 150 mm × 2.1 mm, 1.7-1.8 µm) maintained at 35-45°C. Employ a binary gradient with mobile phase A (water with 0.1% formic acid) and B (acetonitrile with 0.1% formic acid). A typical gradient runs from 5% B to 95% B over 10-20 minutes, followed by column re-equilibration [6] [14].
Mass Spectrometric Analysis: Operate the mass spectrometer in either positive or negative electrospray ionization mode with a capillary voltage of 3-4 kV. Use high-resolution mass analyzers (Orbitrap or TOF) for accurate mass measurement. Data-dependent MS/MS acquisition can be implemented for compound identification [14].
Data Processing: Extract features using specialized software (e.g., MassCube, XCMS, MS-DIAL) that perform peak detection, alignment, and normalization [15]. Apply quality control measures including pooled quality control samples and internal standards to monitor and correct for instrumental drift [16].
Combined LC-MS/GC-MS Metabolomic Analysis
For comprehensive metabolomic coverage, a combined approach using both LC-MS and GC-MS can be implemented as demonstrated in clinical research [14]:
Table 3: Research Reagent Solutions for Metabolite Analysis
| Reagent/Material | Function | Application Examples |
|---|---|---|
| Methanol/Chloroform (2:1) | Biphasic extraction of polar and non-polar metabolites [2] | Comprehensive metabolite extraction from tissues, cells |
| L-2-chlorophenylalanine | Internal standard for data normalization [14] | Correcting technical variability in LC-MS and GC-MS |
| Methoxyamine hydrochloride | Derivatization agent for GC-MS analysis | Protecting carbonyl groups before silylation |
| BSTFA (with 1% TMCS) | Silylation derivatization agent | Increasing volatility for GC-MS analysis |
| Formic acid | Mobile phase additive | Improving ionization efficiency in LC-MS |
| C18 SPE disks | Solid-phase extraction | Concentrating analytes from liquid samples |
Sample Preparation for Combined Analysis:
- LC-MS Analysis: Add internal standard to serum, then precipitate proteins with cold methanol-acetonitrile (2:1). After centrifugation, filter supernatant through 0.22 µm membrane prior to LC-MS analysis [14].
- GC-MS Analysis: Add internal standard to serum, extract with methanol, then derivatize using methoxyamine hydrochloride in pyridine (37°C, 90 min) followed by BSTFA with 1% TMCS (70°C, 60 min) [14].
Instrumental Analysis:
- LC-MS: Utilize reversed-phase chromatography with gradient elution and positive/negative ESI switching coupled to high-resolution mass spectrometry.
- GC-MS: Employ capillary GC with optimized temperature programming and electron ionization (70 eV) mass spectrometry [14].
Data Integration: Process data from both platforms separately, then combine annotated features for multivariate statistical analysis and pathway mapping.
Diagram 1: LC-MS Metabolomic Analysis Workflow. The process begins with sample collection and proceeds through critical preparation and analysis stages.
Advanced Applications and Future Directions
LC-MS technology continues to evolve, with emerging applications leveraging its core strengths in liquid-phase separation and soft ionization. In pharmaceutical analysis, LC-MS is indispensable throughout the drug development pipeline, from initial candidate screening and metabolite identification to pharmacokinetic studies and quality control [12]. The technology's ability to detect and quantify trace levels of drugs and their metabolites in complex biological matrices with high specificity makes it particularly valuable for therapeutic drug monitoring and toxicity studies.
In clinical metabolomics, LC-MS enables the discovery of diagnostic and prognostic biomarkers for various diseases. The lupus nephritis study exemplifies this application, where LC-MS analysis revealed metabolic perturbations associated with disease pathogenesis, including alterations in energy metabolism, oxidative stress responses, and gut microbiome-derived metabolites [14]. Such findings provide insights into disease mechanisms and identify potential targets for therapeutic intervention.
Future developments in LC-MS technology focus on enhancing separation efficiency through ultra-high performance systems, improving detection sensitivity with advanced mass analyzers, and increasing analytical throughput for large-scale epidemiological studies. Computational approaches for data processing, such as the MassCube platform, are addressing challenges in feature detection, annotation, and quantification, particularly for large datasets [15]. These advancements will further establish LC-MS as a cornerstone technology for metabolite analysis across diverse research fields including systems biology, personalized medicine, and environmental science.
LC-MS provides researchers with a powerful analytical platform characterized by exceptional versatility in analyzing diverse metabolite classes, high sensitivity for trace-level detection, and minimal requirement for sample derivatization. While GC-MS remains superior for volatile compound analysis and offers more economical operation, LC-MS extends analytical capabilities to encompass the vast chemical space of non-volatile and thermally labile metabolites that are inaccessible to GC-MS. The complementary nature of these techniques means that strategic selection or combined implementation based on specific research objectives delivers the most comprehensive insights into metabolic systems, ultimately advancing drug development and biomedical research.
In the field of metabolomics research, the selection of an appropriate analytical platform is fundamental to the success of any study. Gas Chromatography-Mass Spectrometry (GC-MS) and Liquid Chromatography-Mass Spectrometry (LC-MS) represent two of the most prominent technologies, each with distinct operational principles and application domains [1]. GC-MS is characterized by its use of a gas mobile phase for high-resolution separation and its reliance on hard ionization to generate highly reproducible, fragment-rich spectra. In contrast, LC-MS employs a liquid mobile phase and soft ionization, which preferentially preserves the molecular ion [17] [18]. This guide provides an objective, data-driven comparison of these platforms, focusing on the core technology of GC-MS to inform researchers and drug development professionals.
Core Principles and Instrumental Configuration
The fundamental differences between GC-MS and LC-MS begin with their separation mechanisms and extend to their ionization techniques, defining the scope of metabolites they can detect.
Gas Chromatography (GC) Separation: In GC-MS, the mobile phase is an inert gas, such as helium or nitrogen. Separation occurs within a long, heated capillary column as analytes are vaporized and transported by the gas stream [1] [17]. The separation is based on the compound's volatility and its interaction with the stationary phase of the column. Temperature programming is critical, as gradually increasing the oven temperature allows for the effective elution and separation of compounds with different boiling points [1].
Liquid Chromatography (LC) Separation: LC-MS uses a liquid mobile phase (e.g., a mixture of water and organic solvents like acetonitrile or methanol) that is pumped at high pressure through a shorter column packed with fine particles [1] [19]. Separation primarily depends on the polarity and affinity of the analytes for the stationary phase compared to the mobile phase. The most common mode, reversed-phase chromatography, retains non-polar compounds longer, while a technique called Hydrophilic Interaction Liquid Chromatography (HILIC) is used to separate polar metabolites [17] [19].
Ionization: Hard vs. Soft: The ionization techniques used are a defining differentiator. GC-MS typically uses Electron Ionization (EI), a "hard" ionization method. In the EI source, analytes are bombarded with high-energy electrons (usually 70 eV), which causes them to fragment into a characteristic pattern of ions [1] [18]. LC-MS, on the other hand, uses "soft" ionization techniques like Electrospray Ionization (ESI) or Atmospheric Pressure Chemical Ionization (APCI). These methods impart less energy, primarily generating intact molecular ions (e.g., [M+H]⁺ or [M-H]⁻) with little fragmentation [1] [20] [18].
Table 1: Fundamental Operational Principles of GC-MS and LC-MS
| Feature | GC-MS | LC-MS |
|---|---|---|
| Mobile Phase | Inert gas (e.g., Helium) [1] [3] | Liquid solvents (e.g., Water, Acetonitrile, Methanol) [1] [3] |
| Separation Principle | Volatility & boiling point [17] [18] | Polarity & chemical affinity [17] [18] |
| Typical Ionization | Electron Impact (EI) [1] [18] | Electrospray Ionization (ESI) [1] [18] |
| Ionization Character | Hard (extensive fragmentation) [1] [18] | Soft (minimal fragmentation; intact molecular ion) [1] [20] |
Diagram 1: Simplified GC-MS analytical workflow.
Performance Comparison and Experimental Data
The technical differences between the platforms translate directly into distinct performance characteristics, which can be evaluated through sensitivity, compound coverage, and identification capabilities.
Analytical Sensitivity and Dynamic Range
Sensitivity is a key metric for any analytical platform. LC-MS generally offers exceptional sensitivity, capable of detecting compounds at concentrations as low as 10⁻¹⁵ mol (femtogram level) [1]. This makes it particularly powerful for targeted bioanalysis where trace levels of compounds must be measured [18]. GC-MS is also highly sensitive, typically operating in the 10⁻¹² mol (picogram) range [1]. A comparative study of benzodiazepine analysis in urine found that both LC-MS/MS and GC-MS produced highly accurate and precise results at concentrations around 100 ng/mL, demonstrating their comparable reliability for quantitative analysis at this level [20].
Metabolite Coverage and Compound Suitability
The scope of metabolites each platform can analyze is largely determined by the physical and chemical properties of the compounds.
GC-MS Domain: GC-MS is ideally suited for volatile and semi-volatile, thermally stable compounds with molecular weights typically under 500 Da [18]. This includes metabolites such as fatty acids, organic acids, alcohols, essential oils, and environmental pollutants [1] [18]. Many non-volatile metabolites (e.g., sugars, amino acids) can be analyzed by GC-MS only after chemical derivatization to increase their volatility and thermal stability [1] [17] [19].
LC-MS Domain: LC-MS has a much broader application range, capable of analyzing non-volatile, polar, ionic, and thermally labile compounds without derivatization [1] [3]. It can handle a wide range of molecular weights, from small polar metabolites to large biomolecules like peptides and proteins [18]. This makes it the platform of choice for lipids, amino acids, flavonoids, anthocyanins, pharmaceuticals, and most biomolecules found in biological fluids [1] [21].
Table 2: Analytical Performance and Application Scope
| Performance Metric | GC-MS | LC-MS |
|---|---|---|
| Sensitivity | ~10⁻¹² mol [1] | ~10⁻¹⁵ mol [1] |
| Ideal Compound Types | Volatile, thermally stable, low-MW [18] | Non-volatile, polar, thermally labile, wide MW range [3] [18] |
| Sample Preparation | Often requires derivatization [17] [19] | Typically minimal; dilution or simple extraction [20] |
| Key Strength | Excellent for structural isomers; robust libraries [18] | Broad metabolite coverage; ideal for biofluids [1] [18] |
Compound Identification and Database Support
Confident identification of unknown metabolites is a critical step. GC-MS benefits from decades of development, resulting in highly standardized and reproducible EI mass spectra [18]. These spectra are largely independent of the instrument brand, allowing them to be matched against extensive, universal libraries like the NIST and Wiley databases, which contain hundreds of thousands of spectra [17] [18]. This provides a high level of confidence in identifications.
In LC-MS, the soft ionization spectra are highly dependent on the instrument and specific settings (e.g., collision energy) [22]. Identification relies on a combination of accurate mass, retention time, and MS/MS fragmentation patterns, which are compared to smaller, often instrument-specific, spectral libraries (e.g., METLIN, MassBank) [17]. While powerful, the process can be more complex and less standardized than with GC-MS.
Experimental Protocols and Comparative Data
To illustrate the practical differences, the following section details specific experimental methodologies and results from comparative studies.
Experimental Protocol: Comparative Analysis of Benzodiazepines
A 2016 study directly compared LC-MS/MS and GC-MS for the urinalysis of five benzodiazepines [20].
- Sample Preparation:
- Instrumental Analysis:
- GC-MS: An Agilent 7890 GC/5975 MS with an HP-ULTRA 1 column was used. Helium was the carrier gas [20].
- LC-MS/MS: Not specified in the excerpt, but typically uses a C18 column with a gradient of water and acetonitrile, often with formic acid as an additive.
- Results: Both methods showed excellent and comparable accuracy (99.7-107.3%) and precision (<9% coefficient of variation) for quality control samples. The study concluded that the simpler and faster sample preparation of LC-MS/MS made it a suitable alternative, though it noted issues like ion suppression that required careful management with deuterated internal standards [20].
Experimental Protocol: Analysis of Propofol Metabolites
A comprehensive study on propofol metabolites in urine highlighted the complementary nature of both techniques [23].
- GC-MS Sample Prep: Required acid hydrolysis, liquid-liquid extraction (LLE), and trimethylsilyl (TMS) derivatization [23].
- LC-MS Sample Prep: Used simpler dilution or solid-phase extraction [23].
- Key Findings: The LC-MS method provided a shorter total analysis time and was highly sensitive for phase II metabolites (e.g., glucuronides). Conversely, the GC-MS method provided better separation and easier identification of the parent propofol and its phase I metabolites, as the EI spectra produced structurally characteristic fragment ions [23]. This demonstrates how the techniques can be used in tandem for a more complete metabolic picture.
The Scientist's Toolkit: Essential Research Reagents
Successful metabolomics analysis requires a suite of specialized reagents and materials. The following table details key solutions used in the featured experiments and the broader field.
Table 3: Key Research Reagent Solutions and Their Functions
| Reagent / Material | Function | Application Context |
|---|---|---|
| Derivatization Reagents (e.g., MTBSTFA, TMS) | Increases volatility and thermal stability of non-volatile metabolites for GC-MS analysis [20] [23]. | GC-MS sample preparation [20]. |
| Deuterated Internal Standards (e.g., Drug-d5) | Accounts for variability in sample preparation and ionization efficiency; enables accurate quantification [20] [2]. | LC-MS/MS and GC-MS quantitation [20]. |
| Solid-Phase Extraction (SPE) Columns | Selectively purifies and concentrates analytes from complex biological matrices like urine or plasma [20]. | Sample clean-up in both GC-MS and LC-MS [20]. |
| β-Glucuronidase Enzyme | Hydrolyzes glucuronide-conjugated metabolites to release the aglycone for analysis [20]. | Sample hydrolysis in GC-MS protocols [20]. |
| LC-MS Grade Solvents (e.g., Acetonitrile, Methanol) | High-purity solvents used as mobile phase components to minimize background noise and ion suppression. | LC-MS mobile phase preparation [19]. |
Diagram 2: A decision guide for selecting between GC-MS and LC-MS.
GC-MS and LC-MS are not competing technologies but rather complementary pillars of modern metabolomics. The core strength of GC-MS lies in its high-resolution gas chromatography separation and hard EI ionization, which provides superior and reproducible fragmentation for confident identification of volatile and derivatized compounds. LC-MS excels with its unparalleled breadth in analyzing diverse, non-volatile metabolites with high sensitivity and minimal sample preparation. The choice between them is not about which is superior, but which is the right tool for the specific analytical challenge. For a comprehensive metabolic profile, the most powerful approach is often to leverage both platforms in tandem [18] [23].
In the field of analytical chemistry, the coupling of separation techniques with mass spectrometry has revolutionized our ability to identify and quantify chemical compounds in complex mixtures. The fundamental challenge in this integration lies in the efficient ionization of analyte molecules after chromatographic separation but before mass analysis. This article focuses on three predominant ionization techniques: Electrospray Ionization (ESI) and Atmospheric Pressure Chemical Ionization (APCI) for Liquid Chromatography-Mass Spectrometry (LC-MS), and Electron Impact (EI) for Gas Chromatography-Mass Spectrometry (GC-MS). The choice of ionization method is not merely a technical detail but a critical determinant of the success of an analytical method, influencing factors such as the range of detectable compounds, the quality of structural information obtained, and the overall sensitivity and robustness of the analysis. Within the broader context of comparing LC-MS and GC-MS for metabolite analysis research, understanding these ionization sources is paramount for researchers, scientists, and drug development professionals seeking to optimize their analytical workflows [1] [18].
Fundamental Principles and Mechanisms
Electron Impact (EI) in GC-MS
Electron Impact (EI) is a hard ionization technique conducted in a high-vacuum environment. The process begins when a tungsten or rhenium-tungsten filament is heated, emitting a beam of high-energy electrons. These electrons are accelerated to a standard energy of 70 electron volts (eV). When analyte molecules, which have been vaporized by the GC inlet, enter the path of this electron beam, they are bombarded by these high-energy electrons. This collision typically results in the ejection of an electron from the analyte molecule, creating a positively charged molecular ion (M⁺•). The key characteristic of EI is that the 70 eV energy transferred significantly exceeds the energy required for simple ionization, causing the molecular ions to become vibrationally excited and subsequently fragment into smaller, characteristic ions. This fragmentation pattern, while often leading to the diminution or complete loss of the molecular ion signal, provides a rich and reproducible "fingerprint" that is invaluable for structural elucidation and library matching [24] [25].
Electrospray Ionization (ESI) in LC-MS
Electrospray Ionization (ESI) is a soft ionization technique that occurs at atmospheric pressure and is ideal for polar, thermally labile, and high-molecular-weight compounds. In ESI, the LC eluent containing the analytes is pumped through a narrow capillary to which a high voltage (typically 3-5 kV) is applied. This results in the formation of a fine aerosol of charged droplets at the capillary tip. As the solvent in these droplets evaporates, assisted by a flow of warm nitrogen (drying gas), the droplets shrink and the charge density on their surface increases. Through mechanisms believed to involve either droplet fission (the Coulombic explosion) or ion evaporation, the analyte molecules are ultimately released as gas-phase ions. ESI primarily produces protonated ([M+H]⁺) or deprotonated ([M-H]⁻) molecules, or other pre-charged species, with minimal fragmentation. This makes ESI excellent for determining molecular weights but less informative for direct structural analysis without subsequent tandem MS (MS/MS) experiments [1] [12] [26].
Atmospheric Pressure Chemical Ionization (APCI) in LC-MS
Atmospheric Pressure Chemical Ionization (APCI) is another soft ionization technique that, like ESI, operates at atmospheric pressure but employs a different mechanism. In APCI, the LC eluent is first nebulized into a fine mist and vaporized in a heated tube (typically at 400-500°C) to create a gas-phase plume. A corona discharge needle then emits a stream of electrons, which ionizes the nebulizer gas (typically N₂) and solvent molecules in the air, initiating a cascade of ion-molecule reactions. These reagent ions subsequently collide with and transfer charge to the analyte molecules through chemical ionization processes, most commonly leading to proton transfer and the formation of [M+H]⁺ or [M-H]⁻ ions. Because APCI relies on the analyte being in the gas phase, it is better suited for less polar, thermally stable, and low- to medium-molecular-weight compounds compared to ESI. It generally produces simpler spectra than EI but can exhibit some in-source fragmentation, such as the loss of water or carbon monoxide [27] [26].
The following diagram illustrates the fundamental workflows and ionization mechanisms for the three techniques:
Comparative Performance Data
The selection of an appropriate ionization source is guided by the physicochemical properties of the target analytes and the required analytical outcomes. The following tables summarize key performance metrics and characteristics based on experimental data.
Table 1: Quantitative Comparison of Ionization Source Performance in Analytical Applications
| Performance Metric | EI (GC-MS) | APCI (LC-MS) | ESI (LC-MS) |
|---|---|---|---|
| Typical Sensitivity (mol) | 10⁻¹² [1] | Varies with compound | 10⁻¹⁵ [1] |
| Recovery (in nitrosamine analysis) | 108.66 ± 9.32% [28] | Data not fully specified | Data not fully specified |
| Precision (RSD in nitrosamine analysis) | < 6% [28] | Data not fully specified | Data not fully specified |
| Matrix Effect (in pesticide analysis) | Not applicable (GC context) | Less susceptible to suppression [26] | More susceptible to ion suppression [26] |
| LOD for Pesticides (in cabbage) | Not applicable (GC context) | Higher LOD for most compounds [26] | Lower LOD for most compounds [26] |
Table 2: Analytical Characteristics and Applicability of Ionization Sources
| Characteristic | EI (GC-MS) | APCI (LC-MS) | ESI (LC-MS) |
|---|---|---|---|
| Ionization Mechanism | High-energy electron bombardment [24] | Chemical ionization at atmospheric pressure [27] | Charge residue or ion evaporation [1] |
| Ionization Environment | High vacuum [24] | Atmospheric pressure [27] | Atmospheric pressure [1] |
| Primary Ions Formed | Fragment ions, M⁺• (can be weak) [25] | [M+H]⁺, [M-H]⁻, M⁺• (sometimes) [27] | [M+H]⁺, [M-H]⁻, multiply charged ions [1] |
| Fragmentation Level | High ("hard" ionization) [18] | Low to moderate ("soft" ionization) [27] | Very low ("soft" ionization) [18] |
| Ideal Compound Types | Volatile, thermally stable, low polarity [18] | Low-medium polarity, semi-volatile, thermally stable [27] [26] | Polar, ionic, thermally labile, high MW [12] [18] |
| Library Searchability | Excellent (NIST, Wiley libraries) [18] | Poor | Poor |
Experimental Protocols and Methodologies
Protocol 1: Analysis of Nitrosamines Using EI-GC-MS/MS
This protocol is adapted from a study comparing ionization techniques for the analysis of nine nitrosamines eluted from synthetic resins into artificial saliva [28].
- Sample Preparation: Nitrosamines are extracted from rubber-type products (e.g., pacifiers, bottle nipples) by immersion in artificial saliva. The artificial saliva serves as a physiologically relevant extraction solvent to mimic human exposure.
- Chromatography (GC): Separation is achieved using a gas chromatograph equipped with a capillary column. The specific column and temperature program are optimized for the resolution of the nine target nitrosamines.
- Ionization (EI): The GC effluent is introduced into a high-vacuum EI ion source. Ionization is performed with a standard 70 eV electron energy. The filament current and source temperature are set according to the manufacturer's specifications.
- Mass Analysis (MS/MS): Detection and quantification are performed using a tandem mass spectrometer (MS/MS). The instrument operates in Multiple Reaction Monitoring (MRM) mode, where specific precursor ion → product ion transitions are monitored for each nitrosamine to achieve high selectivity and sensitivity.
- Validation Parameters: The method is validated by assessing linearity, limit of detection (LOD), recovery, and precision. In the cited study, EI-GC-MS/MS demonstrated an average recovery of 108.66% with a precision of < 6% RSD, outperforming APCI- and ESI-LC-MS/MS methods for this application [28].
Protocol 2: Multiresidue Pesticide Analysis in Food Comparing ESI and APCI
This protocol is derived from a study evaluating the efficiency of ESI and APCI for the analysis of 22 pesticide residues in a cabbage matrix [26].
- Sample Preparation: The QuEChERS (Quick, Easy, Cheap, Effective, Rugged, and Safe) method is employed. Cabbage samples are homogenized, and pesticides are extracted with acetonitrile. The extract is then cleaned up using dispersive solid-phase extraction (d-SPE) with sorbents like PSA (primary secondary amine) to remove interfering compounds.
- Chromatography (LC): Separation is carried out using a high-performance liquid chromatograph with a reversed-phase C18 column. A gradient elution with water and acetonitrile (both often modified with acids like formic acid) is used to separate the diverse pesticide compounds.
- Ionization (ESI & APCI): The LC effluent is directed to either an ESI or APCI source. For ESI, parameters such as capillary voltage, nebulizer gas pressure, and drying gas temperature are optimized. For APCI, the vaporizer temperature and corona discharge needle current are critical parameters. The study optimized these for all 22 pesticides in positive ion mode.
- Mass Analysis (MS/MS): A triple quadrupole mass spectrometer operating in MRM mode is used for detection.
- Method Comparison: Key validation parameters, including linearity, LOD, matrix effect, accuracy, and precision, are determined for both sources. The study concluded that while APCI was less affected by matrix-induced ion suppression, ESI provided lower LODs for most of the pesticides analyzed [26].
The Scientist's Toolkit: Essential Research Reagents and Materials
Successful implementation of the aforementioned experimental protocols requires specific reagents and materials. The following table details key components for these analytical workflows.
Table 3: Essential Reagents and Materials for LC-MS and GC-MS Analysis
| Item Name | Function / Application | Example Use Case |
|---|---|---|
| Artificial Saliva | Physiologically relevant extraction solvent | Simulating oral exposure to nitrosamines from rubber products [28]. |
| QuEChERS Kits | Streamlined sample preparation for multi-residue analysis | Extracting and cleaning up pesticide residues from complex food matrices like cabbage [26]. |
| PSA (Primary Secondary Amine) | d-SPE sorbent for clean-up | Removing fatty acids and other polar organic acids from food extracts during QuEChERS [26]. |
| DB-5MS GC Column | (5%-Phenyl)-methylpolysiloxane GC column | Standard non-polar/low-polarity column for separating semi-volatile analytes like nitrosamines [28]. |
| C18 LC Column | Reversed-phase LC column | Separating a wide range of analytes by hydrophobicity, from pesticides to pharmaceuticals [26]. |
| Formic Acid | Mobile phase additive | Promoting protonation of analytes in positive ion mode ESI and APCI LC-MS to improve sensitivity [26]. |
| Calibration Standards | Instrument calibration and quantification | Creating calibration curves for accurate quantification of target analytes, essential for both GC-MS and LC-MS [28] [26]. |
Application Scenarios and Decision Framework
The choice between EI, ESI, and APCI is fundamentally guided by the nature of the analyte and the analytical question. The following decision workflow visualizes the key considerations for selecting the appropriate ionization source:
GC-MS with EI is the undisputed choice for volatile and thermally stable metabolites. Its strengths are highlighted in analyzing essential oils, environmental pollutants (VOCs, PAHs), fatty acids, and drugs of abuse [18]. The ability to generate reproducible, library-searchable spectra makes it powerful for identifying unknown compounds within its applicable chemical space.
LC-MS with ESI dominates the analysis of polar, ionic, and thermally labile molecules that are incompatible with GC. It is the workhorse for biomarker discovery, pharmaceutical analysis, proteomics, and metabolomics of polar compounds in biological fluids like plasma and urine [12] [18]. Its capacity to form multiply charged ions allows for the analysis of large biomolecules far beyond the mass range of GC-MS.
LC-MS with APCI serves as a crucial complementary technique to ESI. It extends the reach of LC-MS to less polar, semi-volatile metabolites that may ionize poorly by ESI, such as certain steroids, carotenoids, and lipids [27] [18]. A key operational advantage is its generally lower susceptibility to matrix effects compared to ESI, making it more robust for analyzing dirty samples [26].
Electron Impact (EI), Electrospray Ionization (ESI), and Atmospheric Pressure Chemical Ionization (APCI) are foundational ionization techniques, each with a distinct and non-overlapping role in a modern analytical laboratory. EI-GC-MS provides unparalleled structural information and library-based identification for volatile compounds. ESI-LC-MS offers exceptional sensitivity and a broad application range for polar and high-molecular-weight analytes, particularly in biological matrices. APCI-LC-MS acts as a vital bridge, handling less polar compounds and offering greater robustness against matrix effects. The choice is not about finding a single "best" technique but about selecting the right tool for the specific analytical challenge. For a comprehensive metabolomics research program, GC-MS/EI and LC-MS/ESI/APCI should be viewed as complementary, and an ideal strategy often involves leveraging the strengths of both platforms to achieve maximum coverage of the metabolome [18].
The comparison between Liquid Chromatography-Mass Spectrometry (LC-MS) and Gas Chromatography-Mass Spectrometry (GC-MS) for metabolomics research often focuses on the analytical instrumentation itself. However, the critical determinant for success or failure in metabolite analysis lies in the preliminary steps of sample preparation, specifically the choice of extraction solvents and the requirement for chemical derivatization. These preparatory steps are not merely preliminary; they fundamentally define which segments of the metabolome will be accessible for detection and quantification. This guide objectively compares the performance of LC-MS and GC-MS through the lens of these sample preparation protocols, providing supporting experimental data and detailed methodologies to inform researchers and drug development professionals.
The goal of metabolomics is the comprehensive analysis of all small-molecule metabolites (<1500 Da) in a biological system [29] [2]. The chemical diversity of these metabolites—ranging from highly polar amino acids and sugars to non-polar lipids—presents a profound analytical challenge. No single analytical platform can capture the entire metabolome without bias, making the initial sample preparation a critical point of strategic decision-making.
Sample preparation directly influences the reliability, reproducibility, and coverage of metabolomic data [2]. It involves the crucial steps of quenching metabolic activities, extracting metabolites from the biological matrix, and potentially derivatizing them to make them amenable to analysis. The efficiency of these steps determines the accuracy with which the final data reflects the original metabolic state of the sample. Inadequate preparation can lead to the irreversible loss of labile metabolites, introduction of artifacts, or matrix effects that suppress ionization, thereby compromising the entire experiment [29] [30]. The fundamental divergence between LC-MS and GC-MS workflows often begins at this very first stage, dictating the specific chemical space each platform can effectively probe.
Comparison of Extraction Solvents for LC-MS and GC-MS
The selection of extraction solvents is a primary differentiator between LC-MS and GC-MS protocols, as it determines the classes of metabolites that will be recovered from a complex biological matrix.
Extraction for LC-MS Analysis
LC-MS is renowned for its ability to handle a broad spectrum of metabolite polarities. Consequently, its sample preparation often employs liquid-liquid extraction (LLE) to separate metabolites based on their differential solubility in immiscible solvents [2]. A biphasic system, such as the classical methanol/chloroform/water mixture, is widely used to simultaneously extract polar and non-polar metabolites. In this system, polar metabolites (e.g., sugars, amino acids) partition into the methanol/water phase, while non-polar lipids dissolve in the chloroform phase [2]. This approach was effectively employed in a recent lupus nephritis study, where a simple protein precipitation protocol using a methanol-acetonitrile mixture was sufficient to prepare serum for a comprehensive untargeted LC-MS analysis [14].
The pH of the extraction solvent can be strategically manipulated to improve the recovery of specific metabolite classes. By varying the pH, researchers can take advantage of the acid-base chemistry of metabolites, significantly enhancing the extraction of certain classes from biofluids or cells [2]. For robust quantification, isotopically labeled internal standards are added to the extraction solvent at known concentrations before sample processing. These standards correct for variability in extraction efficiency, ionization suppression, and other matrix effects, thereby enhancing the accuracy and reproducibility of the data [2] [30].
Extraction for GC-MS Analysis
In contrast, the utility of GC-MS is inherently limited to metabolites that are volatile and thermally stable. Since many biologically relevant metabolites do not possess these properties, the extraction for GC-MS is often just the first step in a more involved process. The initial LLE may be designed to enrich for classes of metabolites known to be amenable to GC-MS, such as organic acids, sugars, or fatty acids. However, the extracted metabolites frequently require a subsequent derivatization step to become volatile enough for GC separation [1] [18]. For instance, in the same lupus nephritis study that used LC-MS, the serum samples for GC-MS analysis underwent a multi-step derivatization process after extraction, involving methoximation and silylation before injection into the instrument [14]. This highlights how the extraction for GC-MS is intrinsically linked to the goal of producing volatile analyte derivatives.
Table 1: Common Extraction Solvents and Their Applications in Metabolomics
| Solvent System | Characteristics | Target Metabolites | Compatible Platform |
|---|---|---|---|
| Methanol/Chloroform/Water | Biphasic system; classical method | Polar metabolites (aqueous phase); Lipids (organic phase) | Primarily LC-MS |
| 100% Methanol | Monophasic; efficient protein precipitation | Highly polar metabolites | Primarily LC-MS |
| Methanol/Acetonitrile | Monophasic; effective for serum/plasma | Broad range of polar metabolites | LC-MS (and GC-MS post-derivatization) |
| Methyl tert-butyl ether (MTBE) | Non-polar; forms biphasic system with MeOH/H₂O | Lipids (organic phase) | LC-MS (Lipidomics) |
The Role of Derivatization in GC-MS Analysis
Derivatization is a chemical modification process that is often mandatory for GC-MS analysis but is rarely used in LC-MS. This step is a critical differentiator that adds complexity, time, and potential for error to the GC-MS workflow.
Purpose and Protocols
The primary goals of derivatization are to: (1) increase the volatility of non-volatile metabolites, (2) improve thermal stability to prevent decomposition in the hot GC inlet, and (3) enhance the chromatographic behavior and detectability of analytes [18] [14]. A standard derivatization protocol, as used in clinical studies, typically involves a two-step process [14]:
- Methoximation: The sample is treated with methoxyamine hydrochloride to protect carbonyl groups (e.g., in sugars and keto acids) by forming methoximes, which prevents ring formation and improves peak shape.
- Silylation: The sample is then derivatized with a silylating agent like N,O-Bis(trimethylsilyl)trifluoroacetamide (BSTFA), which replaces active hydrogens in groups (-OH, -COOH, -NH) with trimethylsilyl groups. This step drastically increases the volatility and thermal stability of the metabolites.
This process can extend sample preparation time by several hours and requires careful control of reaction conditions to ensure completeness and reproducibility.
Impact on Data and Analysis
Derivatization enables GC-MS to analyze a wide range of otherwise inaccessible metabolites. A key strength of this approach is the "hard" Electron Impact (EI) ionization used in GC-MS, which produces highly reproducible and compound-specific fragmentation patterns [1] [18]. These fragmentation patterns are searchable against extensive, standardized spectral libraries (e.g., NIST, Wiley), allowing for confident metabolite identification across different laboratories and over decades [18]. However, the derivatization process itself can introduce artifacts, and incomplete reactions can lead to multiple derivatives for a single metabolite, complicating data analysis. Furthermore, the additional sample manipulation increases the risk of introducing contaminants and can negatively impact the reproducibility of the analysis if not meticulously controlled [31].
Experimental Comparison: Performance Data from Practical Applications
Direct comparisons of LC-MS and GC-MS in real-world studies highlight the practical implications of their differing sample preparation requirements and analytical capabilities.
Sensitivity and Metabolite Coverage
Quantitative data demonstrates that LC-MS generally offers higher sensitivity, with detection limits as low as 10⁻¹⁵ mol for some compounds, compared to 10⁻¹² mol for GC-MS [1]. This superior sensitivity, combined with its ability to analyze compounds without derivatization, allows LC-MS to cover a wider range of substance types, including large, thermolabile, and polar molecules like peptides, phospholipids, and glycosylated compounds [1] [18]. GC-MS, while more limited in scope, provides exceptional chromatographic resolution, particularly for volatile and semi-volatile compounds, and is often more effective at separating structural isomers [18].
Table 2: Comparative Performance of LC-MS and GC-MS in Metabolite Analysis
| Performance Metric | LC-MS | GC-MS |
|---|---|---|
| Typical Sensitivity | 10⁻¹⁵ mol [1] | 10⁻¹² mol [1] |
| Ionization Method | Electrospray (ESI), Atmospheric Pressure Chemical Ionization (APCI) [1] [32] | Electron Impact (EI) [1] [18] |
| Ionization Character | Soft (produces molecular ions) [32] | Hard (produces fragment ions) [1] |
| Key Identification Data | Accurate mass, MS/MS fragmentation, Retention time [32] | Reproducible EI spectrum, Retention time, Library matching [18] |
| Required Sample Prep | Minimal to moderate (e.g., protein precipitation) [18] [14] | Often complex, frequently requires derivatization [18] [14] |
A Case Study in Clinical Research
A 2024 study on lupus nephritis (LN) patients provides a clear example of the complementary nature of these platforms. Researchers used both untargeted GC/MS and LC/MS to analyze serum from 50 LN patients and 50 healthy controls [14]. The LC-MS sample preparation involved a straightforward "dilute and shoot" protocol after protein precipitation. In contrast, the GC-MS protocol required a multi-step derivatization process following extraction [14]. This combined approach proved powerful, leading to the identification of 41 potential metabolic biomarkers associated with LN. The study concluded that using both techniques enhanced the understanding of metabolic spectrum changes, a feat that would have been difficult to achieve with either platform alone [14].
The Scientist's Toolkit: Essential Reagents and Materials
Successful metabolomics relies on a suite of high-purity reagents and materials. The following table details key items critical for sample preparation in both LC-MS and GC-MS workflows.
Table 3: Essential Research Reagent Solutions for Metabolomics Sample Preparation
| Reagent/Material | Function | Application Notes |
|---|---|---|
| Methanol (HPLC/MS Grade) | Protein precipitation; extraction of polar metabolites [2]. | High purity is critical to minimize background noise in MS. |
| Chloroform | Extraction of non-polar lipids in biphasic systems [2]. | Used in classical Folch or Bligh & Dyer methods. |
| Isotopically Labeled Internal Standards | Normalization for extraction efficiency and matrix effects; accurate quantification [2] [30]. | Added at the very beginning of sample processing. |
| Derivatization Reagents (e.g., BSTFA) | Increases volatility and thermal stability of metabolites for GC-MS [14]. | Requires careful handling and controlled reaction conditions. |
| Solid Phase Extraction (SPE) Cartridges | Clean-up and enrichment of specific metabolite classes; removal of interfering salts [29]. | Various sorbents (C18, ion-exchange) are used selectively. |
Workflow Visualization and Decision Guide
The following diagram summarizes the distinct sample preparation pathways for LC-MS and GC-MS, highlighting the critical decision points that determine the analytical outcome.
Sample Preparation Workflow for LC-MS and GC-MS
The choice between LC-MS and GC-MS for metabolomics research is fundamentally guided by the sample preparation strategy, particularly the use of extraction solvents and derivatization. LC-MS offers a broader, more flexible platform with simpler sample preparation, making it ideal for polar, ionic, and thermally labile metabolites, and enabling high-sensitivity targeted and untargeted discovery. GC-MS, while requiring more complex and time-consuming derivatization, provides superior chromatographic resolution and robust, library-searchable data for volatile and semi-volatile compounds. Rather than seeking a single "best" platform, researchers should view LC-MS and GC-MS as complementary. The most comprehensive metabolomic insights are often achieved by leveraging the distinct strengths of both techniques, either in parallel or in an integrated manner, to illuminate a wider spectrum of biochemical reality.}
Strategic Applications: Choosing the Right Tool for Your Analysis
In mass spectrometry-based metabolomics, the fundamental physical and chemical properties of target analytes directly determine the appropriate analytical instrumentation. The choice between Liquid Chromatography-Mass Spectrometry (LC-MS) and Gas Chromatography-Mass Spectrometry (GC-MS) hinges primarily on a compound's volatility, thermal stability, and polarity [12] [18]. GC-MS excels for volatile and thermally stable molecules, while LC-MS provides a superior platform for non-volatile, polar, or thermally labile compounds that would decompose under GC conditions [12] [1]. This guide provides an objective comparison of these techniques, supported by experimental data, to inform researchers and drug development professionals in selecting the optimal method for their metabolite analysis.
Technical Comparison: LC-MS vs. GC-MS
The core differences between these platforms stem from their separation mechanisms and the interfaces required to couple them with mass spectrometry.
Fundamental Operational Differences
The following diagram illustrates the key differences in the workflows and critical decision points for LC-MS and GC-MS analysis.
Key Technical Parameters and Performance
Table 1: Core Technical Characteristics of LC-MS and GC-MS
| Parameter | GC-MS | LC-MS |
|---|---|---|
| Separation Mechanism | Gas-phase separation using inert carrier gas and high-temperature capillary column [18] [3] | Liquid-phase separation using pressurized liquid mobile phase and packed column [18] [1] |
| Ionization Source | Electron Impact (EI) [18] [1] | Electrospray Ionization (ESI), Atmospheric Pressure Chemical Ionization (APCI) [5] [18] |
| Ionization Character | "Hard" ionization, generates reproducible fragment ions [18] [1] | "Soft" ionization, often produces intact molecular ions [18] [1] |
| Optimal Analyte Molecular Weight | Typically ≤ 500 Da [18] | Broad range, from small metabolites to large biomolecules (>10 kDa) [18] |
| Typical Analysis Time | Faster process [3] | Variable, but can be very fast with UHPLC (2-5 minutes) [5] |
| Spectral Libraries | Extensive, reproducible EI libraries (e.g., NIST, Wiley) [18] | Less comprehensive; relies more on MS/MS and authentic standards [18] |
Experimental Data and Performance Comparison
Sensitivity and Detection Limits
Experimental comparisons consistently demonstrate technique-dependent performance. A study analyzing pharmaceuticals and personal care products in water found that HPLC-TOF-MS yielded lower detection limits than GC-MS for the same set of compounds [33]. Furthermore, the inherent sensitivity of the techniques varies, with LC-MS typically achieving detection down to 10-15 mol, compared to 10-12 mol for GC-MS [1].
Analysis of Benzodiazepines in Urine
A direct methodological comparison for analyzing benzodiazepines in urine highlights practical trade-offs [20]. Both techniques produced results with comparable accuracy (99.7-107.3%) and precision (%CV <9%). However, the sample preparation and analysis workflows differed significantly.
Table 2: Experimental Protocol Comparison for Benzodiazepine Analysis
| Protocol Step | GC-MS Method [20] | LC-MS/MS Method [20] |
|---|---|---|
| Sample Preparation | Enzymatic hydrolysis, solid-phase extraction, and derivatization with MTBSTFA | Simplified sample clean-up; often just dilution or minimal extraction |
| Derivatization | Required (adds 60-80 minutes to protocol) | Not required |
| Extraction Time | Longer, multi-step process | Quicker and less extensive |
| Chromatographic Run Time | Longer run times | Shorter run times |
| Matrix Effects | Less impacted | Observed; controlled using deuterated internal standards |
This study concluded that the ease and speed of sample extraction, broader compound range, and shorter run time make LC-MS/MS a suitable and expedient alternative to GC-MS for this application [20].
Complementary Analysis in Clinical Metabolomics
A serum metabolomics study on Lupus Nephritis (LN) patients effectively utilized both platforms to maximize metabolite coverage [14]. Researchers used GC/MS for volatile organic compounds, lipids, and derivatizable molecules, leveraging its high repeatability. They simultaneously employed LC/MS for nonvolatile compounds and large or thermally unstable molecules, taking advantage of its comprehensive profiling capability. This combined approach identified 41 potential LN biomarkers, demonstrating how the techniques are complementary in practice [14].
Essential Research Reagent Solutions
The experimental protocols for both techniques rely on specific reagents for sample preparation, separation, and detection.
Table 3: Key Reagents and Their Functions in Metabolomics Analysis
| Reagent / Solution | Function | Technique |
|---|---|---|
| Methanol/Chloroform Mixtures | Biphasic liquid-liquid extraction; polar metabolites (methanol phase) and non-polar lipids (chloroform phase) [2] | Sample Prep (Both) |
| Derivatization Reagents (e.g., MTBSTFA, BSTFA) | Increase volatility and thermal stability of non-volatile compounds for GC-MS analysis [20] [14] | Sample Prep (GC-MS) |
| Internal Standards (e.g., deuterated analogs, L-2-chlorophenylalanine) | Correct for variability during sample preparation and analysis; enable accurate quantification [2] [14] | Sample Prep (Both) |
| Formic Acid in Mobile Phase | Modifies pH to improve protonation and separation of analytes in LC-MS [33] | LC-MS |
| β-Glucuronidase Enzyme | Hydrolyzes conjugated metabolites (e.g., glucuronides) in urine to free the parent compound for analysis [20] | Sample Prep (Both) |
| C18 SPE Disks/Columns | Solid-phase extraction for pre-concentrating analytes and removing matrix interferences from liquid samples [33] | Sample Prep (Both) |
The choice between LC-MS and GC-MS is not a matter of one technique being superior to the other, but rather of selecting the right tool for the specific analytical challenge [18]. GC-MS is the preferred method for volatile and thermally stable compounds, offering robust separation, reproducible fragmentation, and powerful library matching. In contrast, LC-MS is indispensable for non-volatile, polar, ionic, or thermally labile compounds, including large biomolecules, providing high sensitivity with minimal sample preparation. For the most comprehensive metabolomic coverage, employing both techniques in a complementary manner provides the deepest insights into the metabolic state of a biological system [18] [14].
Liquid Chromatography-Mass Spectrometry (LC-MS) has emerged as an indispensable analytical technique in modern life sciences, providing unparalleled capabilities for analyzing a vast spectrum of molecules critical to biomedical research and drug development [5]. This guide objectively examines the performance of LC-MS across its primary application domains—pharmaceuticals, peptides, lipids, and polar metabolites—while contextualizing its strengths and limitations within the broader framework of metabolite analysis research, particularly in comparison to Gas Chromatography-Mass Spectrometry (GC-MS) [18]. The fundamental distinction lies in their operational principles: LC-MS separates compounds in a liquid phase at ambient temperature, making it ideal for non-volatile, thermally labile, and polar molecules, whereas GC-MS vaporizes analytes for separation in a gas phase, limiting its application to volatile or semi-volatile, thermally stable compounds typically under ~500 Da [18] [1]. This intrinsic difference dictates their respective domains of excellence and shapes their complementary roles in comprehensive metabolomic profiling.
Comparative Analytical Performance: LC-MS vs. GC-MS
The selection between LC-MS and GC-MS is fundamentally guided by the physicochemical properties of the target analytes and the specific research requirements. The table below summarizes their core performance characteristics across key parameters.
Table 1: Performance Comparison between LC-MS and GC-MS in Metabolite Analysis
| Parameter | LC-MS | GC-MS |
|---|---|---|
| Ideal Analytes | Polar, ionic, thermolabile molecules; small metabolites to >10 kDa [18] | Volatile, semi-volatile, thermally stable compounds (< ~500 Da) [18] |
| Primary Ionization | Electrospray Ionization (ESI), Atmospheric Pressure Chemical Ionization (APCI) [5] [1] | Electron Impact (EI) [18] [1] |
| Typical Sensitivity | (10^{-15}) mol (can be compound-dependent) [1] | (10^{-12}) mol [1] |
| Sample Preparation | Usually minimal; careful pH/buffer control may be needed [18] | Derivatization often required for non-volatile compounds [18] |
| Separation & Identification | Wide polarity range; rich MS/MS data; method-dependent retention times [18] | Excellent for structural isomers; highly reproducible retention times and EI spectra [18] |
| Spectral Libraries | Improving but less comprehensive; relies on MS/MS, accurate mass, and standards [18] | Mature, universal libraries (e.g., NIST, Wiley) for confident identification [18] |
| Operational Costs | Higher ongoing costs (solvents, maintenance, consumables) [18] | Lower purchase and maintenance costs; simple gas mobile phase [18] |
Experimental Workflows and Protocols
A Generic LC-MS Metabolomics Workflow
The following diagram illustrates the standard workflow for an untargeted LC-MS metabolomics study, from sample collection to data interpretation.
Detailed Methodologies for Key Applications
Protocol for Combined Lipidomics and Metabolomics from Serum
A robust LC-HRMS workflow enables integrated lipid and polar metabolite profiling from minimal serum volumes, ideal for high-throughput clinical applications [34].
- Sample Volume & Extraction: The protocol requires only 10 µL of serum. A simplified extraction uses a 1:1 (v/v) mixture of methanol and methyl tert-butyl ether (MTBE) [34].
- Instrumentation: Liquid Chromatography-High Resolution Mass Spectrometry (LC-HRMS).
- Performance Data: This method confidently identified over 440 lipid species across 23 classes and provided broad coverage of polar metabolites (detecting <1000 metabolite features in both ionization modes) [34].
- Reproducibility: The use of internal standard normalization achieved high analytical precision, with relative standard deviations (RSDs) of 5% in negative ion mode and 6% in positive ion mode [34].
- Clinical Utility: Applied to a cohort with age-related macular degeneration (AMD), the method detected a 34-fold increase in a specific highly unsaturated triglyceride (TG 22:622:622:6) and significant reductions in other lipid species, demonstrating its sensitivity to pathophysiological changes [34].
Protocol for Comprehensive Polar Metabolite Analysis using HILIC-MS
Hydrophilic Interaction Liquid Chromatography (HILIC) coupled to MS is a powerful technique for retaining and analyzing highly polar metabolites that are poorly captured by reversed-phase chromatography [35] [36].
- Chromatography: A bioinert LC system with a bridged ethyl hybrid (BEH) amide column is recommended to minimize metal-analyte interactions and improve sensitivity, especially for problematic compounds like phosphates and nucleotides [36].
- Mobile Phase Strategy: A dual mobile phase strategy is advised, with conditions independently optimized for positive and negative electrospray ionization modes to maximize metabolite coverage [36].
- Sample Preparation: Polar metabolites can be efficiently extracted from tissues (e.g., liver, pancreas) or plasma using a modified Folch method (a two-phase liquid-liquid extraction with chloroform and methanol), which also allows for the parallel recovery of lipids from the same sample [36].
- Key Advantage: This approach expands the range of annotated polar metabolites and improves identification confidence, providing a more accurate metabolic profile of biological systems [36].
The Scientist's Toolkit: Essential Research Reagents and Materials
Successful LC-MS analysis relies on a set of core reagents and materials. The following table details key components used in the featured experiments and the wider field.
Table 2: Essential Research Reagent Solutions for LC-MS Metabolomics
| Item | Function / Application |
|---|---|
| Methanol (MeOH) & Acetonitrile (ACN) | Common organic solvents for metabolite extraction and mobile phase composition [2] [36]. |
| Methyl tert-butyl ether (MTBE) | A non-polar solvent used for lipid extraction, often in combination with methanol [34]. |
| Chloroform | Used in biphasic extraction systems (e.g., Folch, Bligh & Dyer methods) to separate non-polar lipids from polar metabolites [2] [36]. |
| Ammonium Acetate/Formate | Common volatile buffer salts for LC-MS mobile phases; help control pH and improve ionization [36]. |
| Formic Acid/Acetic Acid | Acidic mobile phase additives to promote protonation of analytes in positive ion mode [19]. |
| Internal Standards (IS) | Stable isotope-labeled analogs of target metabolites; spiked into samples to correct for variability in extraction and ionization, enabling accurate quantification [2] [34]. |
| C18 Chromatography Columns | The workhorse reversed-phase columns for separating non-polar to moderately polar compounds (e.g., lipids, many pharmaceuticals) [35] [19]. |
| HILIC Chromatography Columns | Hydrophilic interaction columns (e.g., BEH amide) for the retention and separation of highly polar metabolites that elute too early in RPLC [35] [36]. |
| Bioinert LC System | A chromatographic system with hardware (e.g., titanium, PEEK) that minimizes non-specific adsorption of analytes, crucial for sensitive detection of ionic compounds like phosphates [36]. |
Application Domain Performance and Analysis
Analysis of Application-Specific Strengths
LC-MS demonstrates distinct advantages across its core application domains, driven by its compatibility with a wide range of molecule types.
- Pharmaceuticals: LC-MS is a cornerstone in drug discovery and development [5]. Its high sensitivity and specificity make it ideal for identifying lead compounds, assessing pharmacokinetics (PK), and conducting metabolic stability studies [5] [37]. Ultra-high-performance LC–MS (UHPLC–MS) has further reduced analysis times to 2–5 minutes per sample, enabling high-throughput screening in continuous drug development pipelines [5].
- Peptides and Proteins: LC-MS is the superior technique for peptide analysis. Operating at room temperature with soft ionization (ESI), it prevents the thermal degradation that would occur in GC-MS [18]. Its capacity to handle large, polar biomolecules and provide sequence information via MS/MS makes it indispensable for proteomics and peptide biomarker research [5].
- Lipids: The field of lipidomics, a specialized branch of metabolomics, heavily relies on LC-MS [35]. The structural diversity and hydrophobic nature of lipids are poorly addressed by GC-MS without complex derivatization. LC-MS, particularly with reversed-phase columns, readily separates and characterizes countless lipid species, as evidenced by methods identifying over 440 lipids from minimal sample [34].
- Polar Metabolites: For polar metabolites like sugars, amino acids, and nucleotides, LC-MS with HILIC separation is the method of choice [35] [36]. GC-MS analysis of these compounds requires derivatization to increase volatility, adding steps and potential for error. LC-MS allows for direct analysis of aqueous samples with minimal preparation, simplifying the workflow and expanding metabolite coverage [18] [19].
LC-MS establishes itself as a versatile and powerful platform for analyzing pharmaceuticals, peptides, lipids, and polar metabolites, offering high sensitivity, a broad dynamic range, and minimal sample preparation requirements for a vast array of compounds [5] [35] [18]. The choice between LC-MS and GC-MS is not about finding a universally superior technique but rather about selecting the right tool for the specific analytical challenge. GC-MS remains a robust and cost-effective solution for volatile and thermally stable compounds, offering excellent chromatographic resolution and unparalleled library-matching confidence [18] [1]. For the domains of non-volatile, thermally labile, polar, and high molecular weight molecules—which encompass a massive proportion of modern biomolecular research—LC-MS is the unequivocal leader. For the most comprehensive metabolomic insights, leveraging both techniques as complementary tools provides the deepest coverage of the metabolome [18].
In the field of metabolite analysis, researchers often face a critical choice between two powerful analytical techniques: Gas Chromatography-Mass Spectrometry (GC-MS) and Liquid Chromatography-Mass Spectrometry (LC-MS). This guide provides an objective comparison of their performance across three specific application domains—essential oils, environmental pollutants, and organic acids—to inform method selection in research and drug development. GC-MS combines the separation power of gas chromatography with the detection capabilities of mass spectrometry, making it particularly suitable for volatile and thermally stable compounds [38]. By examining experimental data and protocols, this article delineates the specific scenarios where GC-MS delivers superior performance and where LC-MS might be more appropriate, providing a structured framework for analytical decision-making.
Fundamental Principles and Comparative Advantages of GC-MS
How GC-MS Works
The GC-MS technique operates through a two-stage process. First, the gas chromatograph vaporizes the sample and separates its components using a capillary column housed in a temperature-controlled oven. An inert carrier gas (e.g., helium or nitrogen) propels the vaporized sample through the column, where compounds separate based on their volatility and affinity for the stationary phase [39]. Second, the separated compounds elute from the column into the mass spectrometer, where they are ionized (typically by electron impact ionization at 70 eV) and fragmented [4]. The mass analyzer then separates these fragments by their mass-to-charge (m/z) ratios, producing spectra that serve as molecular fingerprints for identification against extensive reference libraries [39].
Key Comparative Advantages in Metabolite Analysis
GC-MS offers several distinct advantages for specific analytical scenarios:
- Superior Chromatographic Resolution: GC provides higher separation efficiency than liquid chromatography, effectively resolving complex mixtures containing hundreds of compounds [39] [40].
- Highly Reproducible Fragmentation: Electron ionization (EI) at 70 eV produces consistent, reproducible mass spectra across instruments and laboratories [4]. This standardization has enabled the creation of extensive, searchable spectral libraries (e.g., NIST, Wiley) containing spectra for over 240,000 compounds [4].
- Enhanced Detection Sensitivity: For volatile and semi-volatile compounds, GC-MS often provides lower detection limits and better signal-to-noise ratios compared to LC-MS [41].
- Reduced Matrix Effects: GC-MS experiences less ion suppression from complex sample matrices than LC-MS, leading to more reliable quantification [40].
GC-MS Versus LC-MS: Core Technical Differences
The fundamental distinction between these techniques lies in their mobile phases and separation mechanisms. GC-MS uses a gas mobile phase (e.g., helium, hydrogen) and requires sample vaporization, typically with heated injection ports and oven-controlled columns [3] [11]. This makes it ideal for volatile compounds but unsuitable for thermally labile molecules. In contrast, LC-MS employs liquid mobile phases (solvent mixtures) at room temperature, making it gentler for delicate compounds like proteins or large polar metabolites [3].
Operational considerations favor GC-MS in many routine applications. GC-MS systems generally have lower operating costs, require less specialized operator training, and need less frequent maintenance compared to LC-MS instrumentation [11]. However, LC-MS can analyze a broader range of compounds without derivatization, particularly non-volatile, thermally unstable, or highly polar molecules [3].
Table 1: Core Technical Differences Between GC-MS and LC-MS
| Parameter | GC-MS | LC-MS |
|---|---|---|
| Mobile Phase | Gas (helium, hydrogen, nitrogen) [3] [11] | Liquid solvents with buffers/additives [3] [11] |
| Separation Mechanism | Volatility/polarity with temperature programming [39] | Polarity, hydrophobicity, ion exchange [3] |
| Sample Requirements | Must be volatile and thermally stable [40] | No volatility requirement; suitable for thermally labile compounds [3] |
| Common Ionization | Electron Ionization (EI) [4] | Electrospray Ionization (ESI) [3] |
| Typical Analysis Time | Faster for volatile compounds [3] | Variable; can be longer for complex mixtures |
| Operational Costs | Generally lower [11] | Higher (solvents, maintenance) [11] |
| Spectral Libraries | Extensive, reproducible EI libraries (NIST: >240,000 compounds) [4] | Smaller, less reproducible libraries (NIST: ~8,000 compounds) [4] |
Domain-Specific Application and Performance Comparison
Essential Oil Analysis
GC-MS is considered the "gold standard" for essential oil analysis due to the inherent volatility of oil constituents [42] [43]. The technique provides a characteristic "fingerprint" that identifies individual components (such as linalool, limonene, and eucalyptol) and their relative percentages [42]. This information is crucial for verifying authenticity, detecting adulteration with synthetic compounds or cheaper oils, and ensuring safety by identifying components that may cause adverse effects in vulnerable populations [42].
Performance Comparison: For essential oil profiling, GC-MS outperforms LC-MS in several key aspects. GC-MS provides better separation of stereoisomers (critical for fragrance characterization) and more reliable identification through extensive EI spectral libraries specifically developed for essential oil components [43]. While LC-MS can detect non-volatile adulterants, GC-MS remains superior for comprehensive quality assessment of volatile oil compositions.
Table 2: GC-MS Performance in Essential Oil Authentication
| Analysis Type | Key Measured Compounds | Typical Performance Metrics | Comparison to LC-MS |
|---|---|---|---|
| Purity Verification | All volatile constituents | Identifies 100+ compounds per analysis [42] | Superior for volatile profiles; LC-MS may miss key volatiles |
| Adulteration Detection | Synthetic compounds, vegetable oils | Detects 0.1-1% adulteration levels [42] | Complementary; GC-MS finds volatile adulterants, LC-MS detects non-volatiles |
| Chemotype Determination | Marker compounds (e.g., linalool, thymol) | Quantifies markers with RSD <2% [41] | Better separation of stereoisomers |
| Safety Assessment | Potentially problematic constituents (e.g., camphor) | Precise quantification for risk assessment [42] | More established safety thresholds based on GC-MS data |
Environmental Pollutant Monitoring
GC-MS excels in detecting volatile and semi-volatile organic environmental contaminants. Standardized methods exist for monitoring dibenzofurans, dioxins, pesticides, phenols, chlorophenols, polychlorinated biphenyls (PCBs), brominated flame retardants, and polycyclic aromatic hydrocarbons (PAHs) in air, water, and soil matrices [38] [39]. The high chromatographic resolution of GC-MS enables separation of complex contaminant mixtures, while the sensitive detection capabilities allow quantification at trace levels required for regulatory compliance.
Experimental Protocol: For water analysis, solid-phase extraction (SPE) typically concentrates pollutants from large water volumes (0.5-1 L) onto cartridges, which are then eluted with organic solvents. The extract is concentrated under nitrogen flow and injected into the GC-MS system operating in selected ion monitoring (SIM) mode for enhanced sensitivity [39]. Quality control incorporates internal standards (e.g., deuterated analogs) to compensate for matrix effects and recovery variations.
Performance Comparison: GC-MS demonstrates particular advantage for pesticide analysis in food and environmental samples, where GC-MS/MS methods achieve detection limits in the low parts-per-billion range [39]. While LC-MS is gaining prominence for certain polar pesticides, GC-MS remains the preferred technique for most legacy organochlorine pesticides and other semi-volatile contaminants due to its superior separation power and library identification capabilities.
Organic Acid Profiling
Organic acid analysis represents a challenging application where both techniques compete directly. GC-MS has historically been the preferred method for profiling organic acids in biological samples (urine, plasma, stool) for clinical diagnostics and metabolomics [4] [44]. These compounds—including lactic acid, citric acid, succinic acid, and keto acids—provide crucial insights into metabolic pathways and are biomarkers for inherited metabolic disorders [44].
Experimental Protocol: A standard derivatization protocol involves a two-step process [4]:
- Methoximation: Addition of methoxyamine hydrochloride in pyridine (90 minutes, 30°C) to protect carbonyl groups
- Silylation: Treatment with N-methyl-N-trimethylsilyltrifluoroacetamide (MSTFA) with 1% trimethylchlorosilane (60 minutes, 37°C) to replace active hydrogens with trimethylsilyl groups
Derivatized samples must be analyzed within 24 hours to prevent degradation, and GC-MS run times typically range from 15-30 minutes depending on the required metabolite coverage [40].
Performance Comparison: A comparative study of phenolic acids in herbs found GC-MS provided better repeatability (average RSD 1.4% versus 7.2% for LC-TOFMS) and was better suited for quantitative determination of compounds present at low concentrations [41]. However, newer GC-MS/MS approaches using tert-butyldimethylsilyl (tBDMS) derivatization offer improved specificity by preserving molecular ions for better precursor ion selection [44].
Table 3: Organic Acid Analysis Method Comparison
| Parameter | GC-MS | LC-MS |
|---|---|---|
| Sample Preparation | Requires derivatization (silylation) [40] | Minimal preparation; sometimes protein precipitation |
| Analysis Coverage | 200+ identified compounds per study [4] | Broader for non-volatile acids without derivatization |
| Quantitation Precision | RSD ~1.4% for phenolic acids [41] | RSD ~7.2% for phenolic acids [41] |
| Detection Limits | <80 ng/mL for most phenolic acids [41] | Comparable or slightly higher for some compounds |
| Throughput | Faster analysis once derivatized [3] | Slower chromatography but no derivatization wait |
| Method Development | Established, standardized protocols [4] | Evolving methods with retention time stability challenges [44] |
Essential Research Reagent Solutions
Successful GC-MS analysis requires specific reagents and materials tailored to each application domain:
Table 4: Essential GC-MS Research Reagents and Materials
| Reagent/Material | Function | Application Specifics |
|---|---|---|
| Derivatization Reagents | Increase volatility of polar compounds | MSTFA+1% TMCS: standard silylation for metabolomics [40]; MTBSTFA: for improved EI fragmentation in MS/MS [44] |
| Internal Standards | Quantitation and quality control | Deuterated analogs for environmental analysis; stable isotope-labeled metabolites for metabolomics [44] |
| GC Columns | Compound separation | Mid-polarity stationary phases (e.g., 35%-phenyl) for broad metabolite coverage; low-bleed columns for sensitive detection [39] |
| Quality Control Materials | Method validation | Certified reference materials for environmental pollutants; pooled quality control samples for metabolomics [4] |
| Carrier Gases | Mobile phase | Ultra-high purity helium (standard) or hydrogen for faster separations [39] |
| Sample Preparation | Extraction and cleanup | Solid-phase extraction cartridges for environmental samples; ternary solvent systems (water/isopropanol/acetonitrile) for metabolomics [4] |
Integrated Workflow for Metabolite Analysis
The complementary nature of GC-MS and LC-MS makes them powerful when used together in metabolomics research. A typical integrated workflow begins with sample collection (biofluids, tissues, or environmental samples) followed by metabolite extraction using optimized solvent systems [4]. The extract is split for parallel analysis: one portion undergoes derivatization for GC-MS analysis of volatile and semi-volatile metabolites, while the other portion is analyzed directly by LC-MS for non-volatile compounds [40]. Data integration from both platforms provides comprehensive metabolic coverage.
GC-MS remains an indispensable analytical technique with distinct advantages for analyzing essential oils, environmental pollutants, and organic acids. Its strengths include superior chromatographic resolution, highly reproducible spectral libraries, excellent sensitivity for volatile compounds, and robust quantification capabilities. Within the context of metabolite analysis research, GC-MS provides complementary data to LC-MS, with the choice between techniques depending on the specific compounds of interest, required detection limits, and available resources. For volatile and semi-volatile compound analysis, GC-MS continues to offer unparalleled performance, establishing it as a cornerstone technology in analytical laboratories across diverse research and industrial applications.
Metabolomics, the comprehensive analysis of small molecule metabolites, represents a significant challenge in analytical science due to the immense physicochemical diversity of the metabolome. No single analytical platform can fully measure the entire metabolome, as metabolites range from hydrophilic carbohydrates and amino acids to volatile alcohols and hydrophobic lipids [45]. This limitation has driven the development of integrated approaches that combine the complementary strengths of Gas Chromatography-Mass Spectrometry (GC-MS) and Liquid Chromatography-Mass Spectrometry (LC-MS) for untargeted profiling [46]. While GC-MS is one of the most standardized methods in metabolomics with almost 50 years of established protocols, LC-MS has emerged as a powerful complementary technique with broader coverage for certain metabolite classes [4] [47]. This guide objectively compares the performance of these two platforms and demonstrates how their integration provides a more complete picture of biological systems for researchers, scientists, and drug development professionals.
Fundamental Principles and Technical Differences
Core Chromatographic Separation Mechanisms
The fundamental difference between GC-MS and LC-MS lies in their separation mechanisms and the physical state of their mobile phases. GC-MS utilizes a gas (typically helium) as the mobile phase and separates compounds based on their volatility and interaction with the stationary phase of a long capillary column (often 30-60 meters) [17] [1]. The separation process is highly dependent on temperature programming, with optimal results achieved through carefully controlled temperature gradients that affect how compounds partition between the gas phase and the liquid stationary phase [1].
In contrast, LC-MS employs a liquid mobile phase and separates compounds based on their polarity and chemical affinity for the stationary phase [17]. Modern LC-MS systems typically use High-Performance Liquid Chromatography (HPLC) or Ultra-High Performance Liquid Chromatography (UHPLC), with the latter utilizing smaller particle sizes (<2µm) and higher pressures (>25,000 psi) to achieve superior separation efficiency in shorter time frames [17]. The most common separation mode in LC-MS is Reversed-Phase Chromatography (RPLC), which accounts for over 60% of chromatographic applications in metabolomics and is particularly useful for analyzing lipid metabolomes and general metabolomes [17].
Ionization Techniques and Mass Spectrometry Interfaces
The interface between chromatography and mass spectrometry represents another critical distinction between these platforms. GC-MS typically uses Electron Ionization (EI) under high vacuum conditions, where analyte molecules are bombarded with high-energy electrons (usually 70 eV), resulting in characteristic fragmentation patterns [4] [1]. This "hard" ionization method produces reproducible mass spectra with rich structural information, facilitating library matching against extensive databases like NIST, which contains mass spectra for 242,477 unique compounds [4].
LC-MS predominantly uses softer ionization techniques, primarily Electrospray Ionization (ESI) and Atmospheric Pressure Chemical Ionization (APCI), which occur at atmospheric pressure [17] [1]. These techniques typically produce molecular ions with less fragmentation, preserving information about the intact molecule but providing less structural information without MS/MS fragmentation [1]. The development of atmospheric pressure ionization technology in the 1970s-1980s was crucial for solving the interface problems between liquid chromatography and mass spectrometry [17].
Table 1: Fundamental Technical Differences Between GC-MS and LC-MS
| Parameter | GC-MS | LC-MS |
|---|---|---|
| Mobile Phase | Inert gas (e.g., helium) | Liquid solvents (e.g., acetonitrile, methanol) |
| Separation Principle | Volatility and polarity | Polarity, hydrophobicity, chemical affinity |
| Typical Column Length | 30-60 meters | 5-25 centimeters |
| Primary Ionization Methods | Electron Ionization (EI), Chemical Ionization (CI) | Electrospray Ionization (ESI), Atmospheric Pressure Chemical Ionization (APCI) |
| Ionization Fragmentation | High fragmentation (structural information) | Minimal fragmentation (molecular ion information) |
| Sample Introduction | Vaporized injection | Direct liquid injection |
Performance Comparison and Coverage Assessment
Metabolite Coverage and Detection Capabilities
The complementary nature of GC-MS and LC-MS becomes evident when examining their respective metabolite coverage. GC-MS is ideal for identifying and quantitating small molecular metabolites (<650 daltons), including small acids, alcohols, hydroxyl acids, amino acids, sugars, fatty acids, sterols, catecholamines, drugs, and toxins [4]. However, it typically requires chemical derivatization to make these compounds volatile enough for gas chromatography, which adds preparation steps but enables analysis of otherwise non-volatile compounds [4]. With standardized protocols, GC-MS can identify and semi-quantify over 200 compounds per study in human body fluids like plasma, urine, or stool samples [4].
LC-MS has a broader application field for biological samples such as animal blood plasma, tissues, cells, and various plant parts, where metabolites are predominantly non-volatile and readily ionizable [17] [1]. It can detect a wider range of substance types without derivatization, including lipids, amino acids, flavonoids, anthocyanins, and other semi-polar metabolites [1]. In comparative studies, the number of metabolites that can be identified in GC-MS analyses is around 100, while LC-MS studies can approach 500 metabolites [45].
Sensitivity and Analytical Performance Metrics
Both platforms offer high sensitivity but differ in their optimal detection ranges and applications. GC-MS demonstrates sensitivity at the 10⁻¹² mol level, making it suitable for detecting trace metabolites in complex matrices [1]. Its high chromatographic resolution, facilitated by faster gas molecule diffusion and long separation columns, enables excellent separation of complex mixtures [17].
LC-MS generally provides higher sensitivity, reaching levels as low as 10⁻¹⁵ mol (femtogram range), and has a broader dynamic range for detecting trace substances [1]. This exceptional sensitivity, combined with its ability to analyze thermally labile and high molecular weight compounds, makes LC-MS particularly valuable for biomarker discovery and pharmaceutical applications.
Table 2: Performance Comparison Between GC-MS and LC-MS in Metabolomics
| Performance Characteristic | GC-MS | LC-MS |
|---|---|---|
| Sensitivity | 10⁻¹² mol [1] | 10⁻¹⁵ mol [1] |
| Typical Metabolites Identified | ~100-200 per study [4] [45] | Up to ~500 per study [45] |
| Chromatographic Resolution | High (due to fast gas diffusion) [17] | Moderate to High (UHPLC provides highest) [17] |
| Reproducibility | High (standardized EI spectra) [4] | Moderate (ion suppression possible) [45] |
| Sample Throughput | Moderate (derivatization required) | High (minimal preparation) |
| Dynamic Range | Good | Broad [17] |
Experimental Protocols for Integrated Metabolomics
Sample Preparation Workflows
Proper sample preparation is critical for successful integrated metabolomics. The protocol below uses a ternary combination of hydrophilic (water) and lipophilic (isopropanol) solvents with acetonitrile as a medium polarity solvent to extract a broad range of metabolites [4]. To remove very lipophilic lipids that can interfere with analysis, the protocol employs a clean-up step after initial extraction and desiccation, as lipids accumulating in GC-MS liners can pyrolyze and create carry-over background fatty acid signals [4].
For GC-MS analysis, a derivatization step is essential for most metabolites. The standardized two-step derivatization protocol involves:
- Methoximation: 50 µL of freshly prepared methoxyamine in pyridine (20 mg/mL) is added to dried samples, followed by incubation for 90 min at 30°C with shaking [48].
- Silylation: 50 µL of N-methyl-N-(trimethylsilyl)trifluoroacetamide (MSTFA) with 1% trimethylchlorosilane (TMCS) is added, followed by incubation for 60 min at 70°C with shaking [48].
For LC-MS analysis, sample preparation is typically simpler, often requiring only protein precipitation and centrifugation before analysis, though specific applications may require solid-phase extraction or other enrichment techniques.
Instrumental Conditions and Data Acquisition
GC-MS Analysis:
- Column: 60 m × 0.25 mm × 0.25 µm DB-5 ms UI capillary column [48]
- Temperature program: 60°C for 1 min, then +5°C/min to 300°C, holding for 12 min [48]
- Carrier gas: Helium at 1.0 mL/min [48]
- Ionization: Electron ionization at -70 eV [48]
- Mass range: m/z 45-1000 [48]
LC-MS Analysis:
- Column: Depending on application (C18 for reversed-phase, HILIC for hydrophilic compounds) [17]
- Mobile phase: Gradient from aqueous to organic phase (typically acetonitrile or methanol with modifiers) [17]
- Ionization: ESI in positive and/or negative mode [1]
- Mass analyzer: Typically Q-TOF or Orbitrap for untargeted profiling [47]
Integrated Workflow Visualization
The following diagram illustrates the comprehensive workflow for integrated GC-MS and LC-MS metabolomics profiling, from sample preparation through data integration:
Integrated GC-MS and LC-MS Metabolomics Workflow
Essential Research Reagent Solutions
The integrated workflow requires specific research reagents optimized for metabolomics studies:
Table 3: Essential Research Reagents for Integrated Metabolomics
| Reagent Category | Specific Examples | Function in Workflow |
|---|---|---|
| Derivatization Reagents | Methoxyamine in pyridine, MSTFA with 1% TMCS [48] | Renders metabolites volatile for GC-MS analysis by replacing active hydrogens with trimethylsilyl groups |
| Extraction Solvents | Methanol/chloroform (3:1) [48], Water/Isopropanol/Acetonitrile [4] | Comprehensive extraction of metabolites spanning various polarity classes |
| Internal Standards | Heptadecanoic acid, Norleucine [48] | Quality control and quantification reference for both GC-MS and LC-MS analyses |
| LC-MS Mobile Phase | HPLC-grade acetonitrile, methanol with ammonium acetate/formate | Optimal chromatographic separation and ionization efficiency in LC-MS |
| Retention Index Markers | Alkane standard mixture (C10-C40) [48] | Retention time standardization for metabolite identification in GC-MS |
Comparative Experimental Data and Case Studies
Quantitative Performance Assessment
Direct comparison studies demonstrate the complementary strengths of both platforms. In a study analyzing human serum samples from 109 subjects, GC×GC-MS (an advanced GC-MS variant) detected about three times as many peaks as conventional GC-MS at a signal-to-noise ratio ≥ 50, and three times the number of metabolites were identified by mass spectrum matching [48]. Specifically, 23 metabolites showed statistically significant abundance changes between patient and control samples in the GC-MS data set, while 34 metabolites showed significant differences in the GC×GC-MS data set [48].
In another integrated study on the effects of azadirachtin on Bactrocera dorsalis larvae, researchers detected 22 differentially abundant metabolites in the LC-MS analysis and 13 in the GC-MS analysis, with pathway analysis revealing 14 significantly affected metabolic pathways [49]. This case study exemplifies how neither platform alone would have provided the complete picture of the biochemical effects.
Publication Trends and Scientific Adoption
Analysis of PubMed publication rates reveals the evolving adoption of these technologies. In the period 1995–2023, the yearly publication rate accounted for 3042 for GC-MS articles and 3908 for LC-MS articles (LC-MS/GC-MS ratio, 1.3:1) [47]. This data indicates that while LC-MS has gained prominence, GC-MS remains a substantially used technology with steady application in life sciences research.
The integration of GC-MS and LC-MS represents the most comprehensive approach for untargeted metabolomics profiling. While GC-MS provides highly reproducible, standardized analysis with extensive spectral libraries for volatile and derivatized metabolites, LC-MS offers superior sensitivity and coverage for non-volatile, thermally labile compounds across a broad molecular range. The strategic combination of these orthogonal techniques enables researchers to overcome the limitations inherent in either standalone platform, providing a more complete view of metabolic changes in biological systems. As the field advances, continued development of integrated workflows and data integration methods will further enhance our ability to comprehensively characterize the metabolome, with significant implications for disease biomarker discovery, drug development, and systems biology research.
Serum metabolomics has emerged as a powerful approach for biomarker discovery, providing a direct snapshot of physiological and pathological states by characterizing small-molecule metabolites. The selection of analytical platforms is critical for comprehensive metabolite coverage and reliable biomarker identification. This case study objectively compares the performance of Liquid Chromatography-Mass Spectrometry (LC-MS) and Gas Chromatography-Mass Spectrometry (GC-MS) for serum metabolomics in the context of liver fibrosis associated with chronic Hepatitis C Virus (HCV) infection [50]. We examine experimental data, methodological considerations, and analytical capabilities of each platform to guide researchers in selecting appropriate technologies for metabolic biomarker discovery.
Platform Fundamentals and Selection Criteria
Core Technical Principles
LC-MS combines liquid chromatography separation with mass spectrometric detection. Separation occurs in a liquid mobile phase using mechanisms like reversed-phase or hydrophilic interaction chromatography, making it ideal for non-volatile, thermally labile, and high-molecular-weight compounds [12]. Ionization typically occurs via Electrospray Ionization (ESI) or Atmospheric Pressure Chemical Ionization (APCI), producing intact molecular ions with minimal fragmentation [1].
GC-MS utilizes gas chromatography for separation followed by mass spectrometry. It excels in analyzing volatile and semi-volatile compounds, requiring samples to be vaporized without decomposition [12]. Electron Impact (EI) ionization at 70 eV is standard, generating extensive fragment ions that facilitate library-based identification [1]. Non-volatile metabolites often require chemical derivatization to enhance volatility and thermal stability [12].
Platform Selection Guide
The choice between LC-MS and GC-MS depends on analyte properties and research objectives:
| Selection Factor | LC-MS | GC-MS |
|---|---|---|
| Ideal Compound Types | Non-volatile, thermally labile, polar, high molecular weight | Volatile, semi-volatile, thermally stable |
| Sample Preparation | Relatively simple; protein precipitation often sufficient | Often requires derivatization for non-volatile compounds |
| Compound Coverage | Broad range: lipids, amino acids, flavonoids, pharmaceuticals [1] | Volatiles, organic acids, sugars, fatty acids after derivatization [1] |
| Ionization Method | ESI, APCI [1] | EI [1] |
| Mass Spectra | Intact molecular ions, adduct formation | Extensive fragmentation, reproducible spectral libraries |
Cross-Platform Serum Metabolomics Case Study: Liver Fibrosis in HCV
Study Design and Methodology
A 2021 cross-platform investigation compared serum metabolomes from HCV patients at different liver fibrosis stages (n=20) and non-HCV controls (n=14) [50]. Liver fibrosis was staged via the METAVIR scoring system (F0-F4) confirmed by histopathology. The study implemented standardized protocols for both platform methodologies.
Sample Preparation Protocol:
- Serum Collection and Filtration: Blood samples were collected and processed to obtain serum filtrate.
- Metabolite Extraction: Employed ice-cold methanol/chloroform solvent mixture for metabolite extraction.
- Quality Control: Pooled quality control (QC) samples from all study participants were analyzed intermittently throughout the sequence to monitor instrumental performance and ensure data quality [50].
LC-MS Methodology (MSI-CE-MS):
- Platform: Multisegment Injection-Capillary Electrophoresis-Mass Spectrometry.
- Separation: Capillary electrophoresis using fused silica capillaries with acidic background electrolyte.
- Ionization: Electrospray Ionization.
- Detection: High-resolution mass spectrometer.
- Data Acquisition: Multiple segments per run with QC samples integrated into the sequence [50].
GC-MS Methodology:
- Platform: Standard Gas Chromatography-Mass Spectrometry.
- Derivatization (if used): Typically involves methoxyamination and silylation for GC-MS analysis.
- Separation: Using a DB-5ms or equivalent capillary column (30-60m length) with temperature programming.
- Ionization: Electron Impact (70 eV).
- Detection: Time-of-Flight or quadrupole mass analyzer [48].
Analytical Performance and Metabolite Coverage
The cross-platform analysis revealed significant differences in analytical capabilities and biomarker discovery potential [50]:
| Performance Metric | LC-MS (MSI-CE-MS) | GC-MS | NMR |
|---|---|---|---|
| Sensitivity (mol) | 10⁻¹⁵ [1] | 10⁻¹² [1] | 10⁻⁶ [1] |
| Metabolites Detected | 60 metabolites (>75% frequency) | Typically fewer than LC-MS in comparable studies [48] | 30 metabolites (>75% frequency) [50] |
| Technical Precision (Median CV) | <10% [50] | <10% (with good QC) [48] | <10% [50] |
| Key Biomarkers Identified | Choline, histidine, 5-oxo-proline | Not specifically identified in this study | Choline, histidine |
| Sample Volume Requirements | Low (μL range) [50] | Moderate (typically ~100 μL) [48] | Higher (typically >500 μL) |
The superior sensitivity of LC-MS (10⁻¹⁵ mol) compared to GC-MS (10⁻¹² mol) enabled detection of lower-abundance metabolites [1]. LC-MS identified 60 metabolites detected in >75% of samples with excellent technical precision (median CV <10%), while NMR detected 30 metabolites with similar frequency and precision [50]. Both platforms independently identified choline and histidine as significantly elevated in late-stage fibrosis, demonstrating cross-platform validation [50].
Advanced GC×GC-MS technology demonstrates approximately three times higher peak detection and metabolite identification compared to conventional GC-MS, narrowing the coverage gap with LC-MS [48].
Biomarker Discovery and Clinical Correlation
Multivariate and univariate analyses revealed key metabolic disruptions in HCV-related liver fibrosis:
- Choline/Histidine Elevation: Both LC-MS and NMR confirmed significant increases in serum choline and histidine in late-stage (F2-F4) versus early-stage (F0-F1) fibrosis [50]
- 5-oxo-Proline Elevation: LC-MS identified increased 5-oxo-proline in HCV patients versus controls, indicating glutathione depletion and elevated oxidative stress [50]
- Clinical Correlation: The choline/uric acid ratio provided optimal differentiation of liver disease severity (AUC=0.848, p=0.00766), correlating with liver stiffness measurements by ultrasound elastography (r=0.606, p=0.0047) [50]
Metabolic Pathway Disruptions in HCV Liver Fibrosis. LC-MS and NMR identified elevated choline, histidine, and 5-oxo-proline linked to key metabolic disruptions in liver fibrosis. The choline/uric acid ratio correlates with disease severity.
Experimental Protocols for Platform Validation
LC-MS/MS Method Validation
LC-MS/MS bioanalysis requires rigorous validation to ensure reliable quantification of metabolites in complex matrices like serum [51]. The following eight characteristics are essential for method validation:
| Validation Characteristic | Assessment Method | Acceptance Criteria |
|---|---|---|
| Accuracy | Compare measured vs. known concentration of spiked standards | Typically ±15% deviation (±20% at LLOQ) |
| Precision | Multiple measurements of same sample under identical conditions | CV ≤15% (≤20% at LLOQ) |
| Specificity | Measure target analyte in presence of other sample components | No interference from matrix components |
| Quantification Limit (LLOQ) | Analyze decreasing concentrations until S/N reaches predefined level | S/N ≥20:1 with accuracy ±20% |
| Linearity | Analyze increasing concentrations and plot response vs. concentration | R² ≥0.99 over defined range |
| Recovery | Compare measured vs. expected value in spiked samples after extraction | Consistent and reproducible recovery |
| Matrix Effect | Extract individual matrix lots spiked with known analyte concentrations | Precision and accuracy within predefined criteria |
| Stability | Analyze samples at different time intervals and temperatures | Analyte remains stable under storage/processing conditions |
Series validation should be performed for each analytical batch, assessing calibration integrity, quality control performance, and system suitability [52]. This ongoing "dynamic validation" monitors method performance throughout the method's life cycle [52].
GC-MS Method Optimization
For comprehensive metabolite coverage in GC-MS, advanced approaches like comprehensive two-dimensional GC (GC×GC-MS) significantly enhance performance:
| GC-MS Configuration | Peak Capacity | Metabolites Identified | Biomarkers Discovered |
|---|---|---|---|
| Conventional GC-MS | Standard | ~3x fewer than GC×GC-MS [48] | 23 significant metabolites [48] |
| GC×GC-MS | ~3x higher [48] | ~3x more than GC-MS (Rsim ≥600) [48] | 34 significant metabolites [48] |
GC×GC-MS utilizes two GC columns with different stationary phases connected via a thermal modulator, providing superior chromatographic separation for complex metabolite mixtures [48]. This enhanced resolution reduces peak overlap and improves spectrum deconvolution, facilitating more accurate metabolite identification and quantification [48].
Experimental Workflow for Multi-platform Metabolomics. Serum samples undergo protein precipitation before analysis. LC-MS requires minimal additional preparation, while GC-MS typically requires a two-step derivatization process to enhance volatility.
Essential Research Reagents and Materials
Successful multi-platform metabolomics requires specific reagents and materials optimized for each analytical approach:
| Category | Specific Reagents/Materials | Function | Platform |
|---|---|---|---|
| Sample Preparation | Methanol, chloroform, heptadecanoic acid, norleucine | Protein precipitation, metabolite extraction, internal standards | Both |
| Derivatization Reagents | Methoxyamine, MSTFA + 1% TMCS | Enhance volatility for GC analysis | GC-MS |
| Chromatography Columns | Reversed-phase C18, HILIC | Separate compounds by hydrophobicity/polarity | LC-MS |
| Chromatography Columns | DB-5ms, DB-17ms | Separate volatile compounds | GC-MS |
| Ionization Additives | Formic acid, ammonium acetate | Enhance ionization efficiency | LC-MS |
| Calibration Standards | Alkane series (C10-C40) | Retention index calibration | GC-MS |
| Quality Control | Pooled serum samples | Monitor instrument performance | Both |
This case study demonstrates that both LC-MS and GC-MS offer complementary strengths for serum metabolomics in disease biomarker discovery. LC-MS provides superior sensitivity and broader coverage of non-volatile metabolites, while GC-MS excels in analyzing volatile compounds with robust library-based identification. The cross-platform validation of choline and histidine as biomarkers for liver fibrosis staging underscores the value of orthogonal analytical approaches.
For comprehensive metabolomics studies, researchers should consider:
- LC-MS for broad, untargeted discovery of diverse metabolite classes
- GC-MS for targeted analysis of volatile metabolites and when library matching is essential
- Multi-platform approaches for independent biomarker validation
- GC×GC-MS when dealing with highly complex metabolite mixtures requiring superior separation
Platform selection should ultimately align with research objectives, analyte properties, and available resources. The integration of multiple platforms provides the most comprehensive approach for confident biomarker identification and biological insight.
Overcoming Challenges: Pitfalls, Optimization, and Quality Control
In mass spectrometry-based metabolomics, the analytical precision of technologies like Liquid Chromatography-Mass Spectrometry (LC-MS) and Gas Chromatography-Mass Spectrometry (GC-MS) can be completely undermined by pre-analytical artifacts. Metabolite interconversion and incomplete quenching represent two of the most significant challenges in obtaining biologically relevant data. The metabolome is exceptionally dynamic, with turnover rates for critical metabolites like ATP and glucose 6-phosphate occurring in under one second [53]. Without proper techniques to instantaneously preserve the metabolic state, analytical results reflect artifact rather than biological reality, regardless of whether LC-MS or GC-MS platforms are employed. This guide examines the specific vulnerabilities of each platform to these pitfalls and provides evidence-based protocols to ensure data integrity.
Understanding the Fundamental Pitfalls
Metabolite Interconversion: A Silent Source of Error
Metabolite interconversion refers to the enzymatic or chemical transformation of metabolites after sample collection but prior to complete analysis. These alterations falsely represent the in vivo metabolic state and can lead to incorrect biological interpretations [53]. The problem is particularly acute for energy charge metabolites (ATP, ADP, AMP), phosphorylated sugars, and redox cofactors, which exist in tightly coupled equilibrium states and have rapid turnover rates.
Incomplete Quenching: Failure to Arrest Metabolism
Quenching describes the process of rapidly halting all enzymatic activity in a biological sample. Incomplete or slow quenching allows metabolic pathways to continue operating, changing metabolite concentrations from their physiological values. Research demonstrates that common quenching methods, such as cold organic solvent alone, may not fully denature enzymes quickly enough, permitting significant interconversion during processing [53]. The effectiveness of quenching varies by organism, cell type, and metabolite class, necessitating careful validation.
Comparative Vulnerabilities: LC-MS vs. GC-MS Workflows
Platform-Specific Workflow Challenges
The sample preparation requirements for LC-MS and GC-MS create distinct vulnerabilities to pre-analytical artifacts. The table below summarizes key differences in their typical workflows and associated risks.
Table 1: Platform-Specific Vulnerabilities to Pre-Analytical Artifacts
| Workflow Aspect | LC-MS | GC-MS |
|---|---|---|
| Typical Extraction Solvents | Methanol, Acetonitrile, Water mixtures (often chilled) [2] | Methanol/Chloroform, Water/Isopropanol/Acetonitrile [4] |
| Major Processing Risk | Incomplete protein precipitation; continued enzyme activity in aqueous phases | Additional derivatization step introduces heat stress (often 60-70°C) that can degrade thermolabile metabolites [14] |
| Primary Vulnerability | Interconversion of labile phosphorylated compounds (e.g., ATP/ADP, sugar phosphates) [53] | Degradation of heat-sensitive metabolites; interconversion during extended sample preparation |
| Typical Quenching Method | Direct addition of cold acidic organic solvent to cells/tissue [53] | Rapid freezing (liquid N₂) followed by powderization in a cryomill [53] |
Quantitative Evidence of Pitfalls and Solutions
Experimental data reveals the extent of interconversion during suboptimal quenching and validates effective solutions. The following table summarizes key findings from spike-in experiments that tracked the transformation of specific metabolites during sample processing.
Table 2: Experimental Evidence of Interconversion and Effective Quenching
| Metabolite Monitored | Artifact Observed with Incomplete Quenching | Effective Quenching Protocol | Result with Validated Protocol |
|---|---|---|---|
| 3-Phosphoglycerate (3PG) | Conversion to Phosphoenolpyruvate (PEP) [53] | Cold acidic acetonitrile:methanol:water with 0.1 M formic acid [53] | >95% recovery of 3PG; minimal PEP formation [53] |
| ATP | Hydrolysis to ADP [53] | Cold acidic acetonitrile:methanol:water with 0.1 M formic acid [53] | >95% recovery of ATP; minimal ADP increase [53] |
| General Primary Metabolites | Variable interconversion across pathways | Acidic solvent (0.1 M formic acid) followed by neutralization with NH₄HCO₃ after quenching [53] | Superior preservation of in vivo metabolite levels; neutralization prevents acid-catalyzed degradation [53] |
Recommended Protocols for Preventing Artifacts
Universal Quenching and Extraction Principles
The following workflow diagram outlines a general approach for quenching and extraction, applicable to both LC-MS and GC-MS, designed to minimize artifacts. Key decision points address specific platform requirements.
Step-by-Step Validated Protocol
The following protocol, adapted from proven methodologies, is designed to effectively quench metabolism and prevent interconversion for cell cultures [53].
Rapid Quenching:
- For suspension cells: Use fast filtration instead of pelleting. Immediately transfer the filter into a tube containing cold (-40°C) quenching solvent composed of acetonitrile:methanol:water (40:40:20, v/v) with 0.1 M formic acid [53].
- For adherent cells: Quickly aspirate the media and directly add the same acidic quenching solvent to the culture dish [53].
- Note: The addition of 0.1 M formic acid is critical for rapid enzyme denaturation. A lower concentration (e.g., 0.02 M) has been shown to be insufficient [53].
Metabolite Extraction:
- Vortex the sample in quenching solvent for 1 minute, then incubate in an ice-water bath with periodic vortexing for 15 minutes.
- Centrifuge at maximum speed (e.g., 13,000-16,000 g) for 10-15 minutes at 4°C to pellet precipitated proteins and cell debris.
- Transfer the supernatant (the metabolite-containing extract) to a new tube.
Neutralization (Critical for Acid-Sensitive Metabolites):
- Neutralize the acidic extract by adding a pre-calculated volume of ammonium bicarbonate (NH₄HCO₃). This step prevents acid-catalyzed degradation of labile metabolites during storage [53].
Sample Preparation for Specific Platforms:
- For LC-MS: The extract can be diluted if necessary, filtered (0.22 µm), and directly analyzed [14] [2].
- For GC-MS: The extract must be completely dried under a gentle stream of nitrogen or in a vacuum concentrator. Subsequently, a derivatization step is required, typically involving methoximation and trimethylsilylation, to render metabolites volatile [14] [4]. This heating step is a potential source of degradation for thermolabile compounds.
The Scientist's Toolkit: Essential Reagent Solutions
Table 3: Key Research Reagents for Preventing Metabolite Interconversion
| Reagent / Solution | Function | Key Consideration |
|---|---|---|
| Acidic Acetonitrile: Methanol: Water (40:40:20 v/v, 0.1 M formic acid) | Primary quenching and extraction solvent; rapidly denatures enzymes and extracts polar metabolites [53]. | Acidity is crucial for complete quenching; must be followed by neutralization. |
| Ammonium Bicarbonate (NH₄HCO₃) | Neutralizing agent added post-extraction to prevent acid hydrolysis of labile metabolites [53]. | Quantity must be calibrated to neutralize the specific volume and acidity of the extraction solvent used. |
| Liquid Nitrogen | Preferred quenching method for tissues via ultra-rapid freezing using tools like the Wollenberger clamp [53]. | Heat transfer is slow; tissue must be smashed thin for effective quenching. |
| Internal Standards (e.g., L-2-chlorophenylalanine, C-17) | Added at the beginning of extraction to monitor and correct for losses during sample preparation and analysis [14] [2]. | Should be structurally similar to target metabolites and not endogenous to the sample. |
| Derivatization Reagents (e.g., BSTFA with 1% TMCS) | For GC-MS; replaces active hydrogens with a TMS group, making metabolites volatile and stable for GC analysis [14] [4]. | Must be performed under anhydrous conditions; heating may degrade some metabolites. |
The integrity of metabolomics data is fundamentally established during the initial seconds of sample processing. GC-MS and LC-MS, while analytically robust, are equally vulnerable to artifacts from metabolite interconversion and incomplete quenching. The adoption of a validated, acidic quenching protocol is not merely an optimization but a necessity for accurate measurement. Researchers should prioritize the following:
- Validate Quenching Efficiency: Use spiked labeled standards to confirm that your specific protocol arrests metabolism without causing degradation [53] [2].
- Minimize Processing Time: Reduce all delays between sample collection and immersion in quenching solvent.
- Avoid Problematic Washes: Omit PBS washes unless absolutely essential, as they cause metabolic stress and leakage [53].
- Select Platform Appropriately: Choose LC-MS for thermolabile or polar metabolites without derivatization, and GC-MS for volatile and stable compounds, being mindful of the additional derivatization step [1] [18].
By rigorously applying these principles, researchers can ensure that their comparative findings reflect true biological differences rather than pre-analytical artifacts, thereby maximizing the value of both LC-MS and GC-MS platforms in metabolic research.
Liquid Chromatography-Mass Spectrometry (LC-MS) has emerged as a cornerstone technique in metabolomics due to its exceptional sensitivity, specificity, and versatility in analyzing a wide range of metabolites [2] [35]. The comprehensive analysis of the metabolome presents significant analytical challenges due to the vast physicochemical diversity of metabolites, which span extreme ranges of polarity, concentration, and molecular mass [35]. No single chromatographic technique can sufficiently separate this entire chemical spectrum, making the choice between Reversed-Phase (RP) and Hydrophilic Interaction Liquid Chromatography (HILIC) a fundamental strategic decision in method development [36] [35]. This guide provides an objective comparison of these complementary separation modes, supported by experimental data and practical implementation protocols to enable researchers to make informed decisions optimized for their specific analytical needs.
Fundamental Separation Mechanisms and Metabolite Coverage
Reversed-Phase (RP) LC separates metabolites based on their hydrophobicity, utilizing a non-polar stationary phase (typically C8 or C18) and a polar mobile phase. Analytes are eluted in order of increasing hydrophobicity, with polar compounds eluting first and non-polar compounds retained longer [35]. This mechanism makes RP-LC particularly suitable for the analysis of lipids, fatty acids, and other non-polar to moderately polar metabolites [36] [35]. The limitations of RP-LC become apparent with highly polar metabolites, which show little to no retention and may co-elute with the solvent front, leading to potential ion suppression and missed identifications [54] [55].
Hydrophilic Interaction Liquid Chromatography (HILIC) employs a hydrophilic stationary phase (such as amide, zwitterionic, or diol chemistry) with a hydrophobic mobile phase (typically acetonitrile-rich). Separation occurs through a complex mechanism involving partitioning between the aqueous layer immobilized on the stationary phase and the organic mobile phase, with additional contributions from hydrogen bonding and electrostatic interactions [36]. This mechanism provides excellent retention for polar and ionizable metabolites that are poorly retained in RP-LC, including amino acids, sugars, nucleotides, and organic acids [54] [36]. The technique is particularly valuable for capturing compounds central to energy metabolism and signaling pathways [36].
Table 1: Fundamental Characteristics of RP-LC and HILIC Separation Modes
| Characteristic | Reversed-Phase (RP) LC | Hydrophilic Interaction (HILIC) LC |
|---|---|---|
| Separation Mechanism | Hydrophobicity | Partitioning, hydrogen bonding, electrostatic interactions |
| Stationary Phase | Non-polar (C8, C18) | Polar (amide, zwitterionic, diol) |
| Mobile Phase | Polar (water, methanol, acetonitrile) | Hydrophobic (acetonitrile-rich with aqueous buffer) |
| Elution Order | Polar compounds first, non-polar last | Non-polar compounds first, polar last |
| Ideal for Metabolites | Lipids, fatty acids, non-polar compounds | Amino acids, sugars, nucleotides, organic acids, polar compounds |
| Key Limitations | Poor retention of highly polar metabolites | Sensitive to injection solvent, longer equilibration |
Performance Comparison: Experimental Data and Applications
Recent studies provide quantitative comparisons of the performance characteristics between RP and HILIC separations in metabolomic applications. A systematic evaluation of a novel zwitterionic HILIC (Z-HILIC) column demonstrated its enhanced performance for polar metabolite analysis. When testing with 990 metabolite standards, the Z-HILIC column detected 707 standards (71%), compared to 543 standards (55%) detected by a widely-used ZIC-pHILIC column, demonstrating superior metabolite coverage for polar compounds [54]. In biological samples (triple-negative breast cancer cell extracts), Z-HILIC successfully annotated 79.1% of the detected standards versus 66.6% with ZIC-pHILIC, highlighting improved sensitivity and reduced matrix effects in complex matrices [54].
The complementary nature of these techniques is further evidenced by approaches that combine both separation modes. Research utilizing a monolithic column based on 1-vinyl-1,2,4-triazole demonstrated that sequential HILIC and RP analyses enabled detection of approximately 400 metabolites in a total analysis time of less than 30 minutes [56]. This dual-mode approach provided broader metabolite coverage than methods utilizing commercially available columns of either single type, successfully enabling the identification of potential radiation exposure biomarkers in mouse dried blood spots [56].
Table 2: Experimental Performance Comparison of RP-LC and HILIC Methods
| Performance Metric | RP-LC Method | HILIC Method | Experimental Context |
|---|---|---|---|
| Metabolites Detected | N/A | 707 of 990 standards (71%) | Z-HILIC vs. ZIC-pHILIC with chemical standards [54] |
| Annotation Rate | N/A | 79.1% in cell extracts | Z-HILIC in biological matrices [54] |
| Combined Coverage | ~400 metabolites | Complementary analysis | Dual HILIC/RP on monolithic column [56] |
| Analysis Time | <30 min total | Sequential analysis | Dual-mode separation [56] |
| Glycan Analysis | Superior peak capacity | Broader peaks, longer equilibration | Derivatized N-linked glycans [55] |
For specific analyte classes, the performance differences can be even more pronounced. In glycomics research, RP separation of derivatized N-linked glycans significantly outperformed HILIC, providing increased peak capacity and superior chromatographic resolution due to sharper peak profiles [55]. This enhanced separation efficiency facilitates the detection of lower-abundance glycans that might be obscured in HILIC separations characterized by broader peak widths.
Mobile Phase Optimization Strategies
Mobile phase composition represents a critical optimization parameter that significantly impacts sensitivity, peak shape, and metabolite coverage in both RP and HILIC modes.
HILIC Mobile Phase Optimization
Advanced HILIC methods employ a dual mobile phase strategy with conditions independently optimized for positive and negative ionization modes to maximize metabolite coverage [36]. Key considerations include:
pH Optimization: Alkaline pH (e.g., ammonium carbonate with ammonia, pH 9.8) enables sensitive detection of polyphosphorylated metabolites like nucleotides and coenzyme A derivatives [56] [36]. This is particularly important for assessing energy metabolism and signaling pathways.
Buffer Selection: Volatile ammonium salts (formate, acetate, carbonate) provide MS-compatibility. Concentration typically ranges from 5-20 mM to balance ionization efficiency and chromatographic performance [56] [36].
Bioinert Systems: In a fully bioinert chromatographic system, chelating additives like medronic acid become redundant as metal-analyte interactions are minimized, simplifying mobile phase preparation [36].
RP-LC Mobile Phase Optimization
RP separations typically employ water/acetonitrile or water/methanol gradients with acidic modifiers (formic acid, acetic acid) to promote protonation in positive ionization mode. A Quality by Design (QbD) approach using Box-Behnken Design has identified optimal conditions comprising 20% organic content, flow rate of 1.0 mL/min, and mobile phase pH of 3.0 for simultaneous quantification of pharmaceutical compounds [57]. These systematically optimized parameters ensure robust analytical methods with excellent linearity (r² > 0.998) and precision (CV < 10%) [57].
Comprehensive Workflow: From Sample Preparation to Analysis
Robust metabolomic profiling requires careful attention to the entire analytical workflow, with specific adaptations for the chosen separation mode.
Metabolomics Workflow: HILIC and RP-LC Pathways
Sample Collection and Metabolism Quenching
Rapid quenching is essential to preserve the metabolic state at the time of sampling. Cold methanol quenching is widely employed due to methanol's water miscibility, low freezing point, and low viscosity in methanol-water mixtures, enabling rapid metabolic inactivation within seconds [2] [35]. Alternative approaches include flash freezing in liquid nitrogen or pH quenching using strong acids or bases [2].
Metabolite Extraction
Efficient extraction must quantitatively recover metabolites while removing interfering proteins. Biphasic liquid-liquid extraction using methanol/chloroform/water systems (modified Folch method) simultaneously recovers polar and non-polar metabolites, with the methanol phase containing polar metabolites and the chloroform phase containing lipids [2] [36]. This approach is particularly valuable as it enables parallel metabolomic and lipidomic analyses from the same sample aliquot [36]. The inclusion of appropriate internal standards (typically stable isotope-labeled analogs) at the extraction stage is critical for accurate quantification [2].
Method Selection Guidelines
- Choose HILIC when: Targeting polar metabolites (amino acids, sugars, nucleotides, organic acids); analyzing samples rich in water (plasma, urine, tissues); when complementary separation to RP-LC is needed for comprehensive coverage [54] [36].
- Choose RP-LC when: Focusing on lipids, fatty acids, and non-polar metabolites; when derivatizing glycans or other polar compounds for enhanced retention; when implementing multidimensional separations where RP provides superior peak capacity [58] [55].
Advanced Applications and Multidimensional Approaches
Two-dimensional liquid chromatography (LC×LC) combines RP and HILIC in a single comprehensive analysis, significantly expanding metabolite coverage. Recent innovations include multi-2D LC×LC systems that dynamically select between HILIC or RP as the second dimension based on the first-dimension retention time, optimizing separation performance across wide polarity ranges [59]. While traditionally HILIC is used in the first dimension, studies demonstrate that RP-LC × HILIC-MS configurations offer potential advantages including improved MS sensitivity due to better desolvation in organic-rich HILIC mobile phases and the ability to use higher flow rates under pressure-constrained conditions [58] [59].
The implementation of bioinert chromatographic systems has shown significant benefits for both separation modes, particularly minimizing metal-analyte interactions for challenging compounds like phosphates and CoA derivatives. These systems improve peak shape and sensitivity, especially in HILIC analysis of ionic metabolites [36].
The Scientist's Toolkit: Essential Research Reagents
Table 3: Key Reagents and Materials for LC-MS Metabolomics
| Reagent/Material | Function/Application | Notes |
|---|---|---|
| Methanol (LC-MS grade) | Quenching, metabolite extraction | Preferred for rapid metabolism quenching [2] [35] |
| Chloroform (LiChrosolv) | Biphasic extraction (Folch method) | Non-polar phase for lipid extraction [2] [36] |
| Ammonium carbonate | HILIC mobile phase buffer | Alkaline pH for sensitive phosphate detection [56] [36] |
| Ammonium formate/acetate | Volatile LC-MS buffers | Compatible with both RP and HILIC modes [36] |
| Formic acid | RP-LC mobile phase modifier | Promotes protonation in positive ion mode [57] |
| Stable isotope standards | Internal quantification standards | Correct for extraction/ionization variability [2] |
| Bioinert columns | Minimize metal-analyte interactions | Critical for phosphates, nucleotides, CoA compounds [36] |
RP-LC and HILIC represent complementary rather than competing separation modes in LC-MS metabolomics. HILIC provides superior coverage of polar metabolites central to primary metabolism, while RP-LC excels in analyzing non-polar compounds including lipids. The optimal choice depends on the specific research question and metabolite classes of interest. For comprehensive metabolic profiling, sequential analysis using both techniques or implementation of multidimensional LC×LC approaches provides the most complete picture of the metabolome. Method optimization should prioritize mobile phase composition tailored to the specific separation mode and analyte properties, with recent advances in bioinert hardware and stationary phase chemistry further enhancing performance for challenging metabolites.
In the analytical scientist's toolkit, Gas Chromatography-Mass Spectrometry (GC-MS) remains a cornerstone technique for separating, identifying, and quantifying volatile and semi-volatile compounds. Its utility is evident across diverse fields, from environmental monitoring to pharmaceutical development [60]. A key differentiator between GC-MS and its counterpart, Liquid Chromatography-Mass Spectrometry (LC-MS), lies at the very front of the system: how the sample is introduced and separated. GC-MS relies on vaporizing the sample and using an inert gas to carry it through a column, making it ideal for volatile and thermally stable compounds. In contrast, LC-MS, which uses a liquid mobile phase, is better suited for non-volatile, thermally labile, and high-molecular-weight compounds like many proteins and metabolites [12] [1].
This guide focuses on two critical aspects that define the performance and scope of a GC-MS method: temperature programming and derivatization. Temperature programming is a powerful mode of operation that enhances separation, while derivatization is a sample preparation technique that expands the range of compounds amenable to GC-MS analysis. Mastering both is essential for any researcher aiming to optimize their analytical methods, particularly when comparing the capabilities of GC-MS against LC-MS for complex applications such as metabolite profiling [61] [62].
Fundamentals of GC-MS Temperature Programming
What is Temperature Programming?
Temperature programming in gas chromatography is a mode of operation where the temperature of the column oven is not held constant but is gradually increased according to a predefined sequence during the separation. This approach stands in contrast to isothermal analysis, where the oven temperature remains fixed throughout the run [61].
The primary purpose of this technique is to achieve efficient separation of complex mixtures containing components with a wide range of boiling points. In an isothermal run, low-boiling point compounds may elute quickly but with poor resolution, while high-boiling point compounds might take an impractically long time to elute, often with severe peak broadening. Temperature programming elegantly solves this by using the temperature ramp to "focus" the peaks, ensuring that early-eluting compounds are well-resolved and later-eluting compounds move through the column more rapidly, leading to sharper peaks and reduced overall analysis time [61] [63].
How Temperature Affects Separation
Temperature exerts a profound influence on the chromatographic process, primarily through three mechanisms [61]:
- Vaporization of Analytes: For GC analysis, compounds must be in the gas phase. Optimal temperature ensures complete vaporization without degrading thermally sensitive analytes. Inadequate vaporization leads to poor separation and peak tailing.
- Partitioning Behavior: Temperature affects how analytes distribute themselves between the stationary phase of the column and the mobile (gas) phase. As temperature increases, analytes spend more time in the gas phase, moving through the column faster.
- Adjustment of Retention Time: Retention time is inversely related to temperature. A common rule of thumb is that an increase of about 30°C can halve the retention time for some compounds, significantly speeding up analysis without sacrificing resolution.
Table 1: Advantages of Temperature Programming in GC-MS
| Advantage | Impact on Analysis |
|---|---|
| Improved Resolution | Provides better separation of closely eluting peaks across a wide boiling point range [61]. |
| Reduced Analysis Time | Shortens run times by accelerating the elution of high-boiling-point compounds [61]. |
| Enhanced Peak Shape | Prevents peak tailing and broadening commonly seen in isothermal runs for later-eluting analytes [61]. |
| Increased Sensitivity | Sharper peaks lead to higher signal-to-noise ratios, improving detection limits [61]. |
| Versatility | Allows a single method to efficiently analyze complex mixtures with diverse chemical properties [61]. |
A Practical Guide to Temperature Program Development
Developing a robust temperature program is a systematic process. The following workflow and guidelines provide a roadmap for method development.
Step-by-Step Parameter Optimization
Initial Temperature and Hold Time: For a mixture where the first peak elutes at 194°C, the initial temperature would be 194°C - 45°C = 149°C [63]. If using splitless injection (common for trace analysis), the initial temperature should be set 10-20°C below the boiling point of the solvent (e.g., 44°C for methanol, 57°C for ethyl acetate) to ensure effective solvent focusing and sharp peaks. The initial hold time is typically short for split injection but should match the splitless (purge) time, usually 30 to 90 seconds, for splitless injection [63].
Temperature Ramp Rate: The optimal ramp rate is approximately 10°C per column hold-up time (t₀) [63]. The hold-up time can be calculated from the column dimensions and carrier gas flow rate. For a standard 30m x 0.25mm column at 1 mL/min flow, t₀ is about 0.94 minutes, suggesting a ramp rate of ~10.6°C/min. Adjusting this rate is a primary tool for optimizing separation. A slower ramp generally improves resolution but increases run time.
Final Temperature and Hold Time: The final temperature should be set at about 20°C above the elution temperature of the last sample component to ensure all compounds, including high-boiling-point matrix components, are eluted from the column. A final hold time of 3 to 5 times the column dead volume (t₀) is typical to flush the column clean [63].
Troubleshooting with Mid-Ramp Holds
If a pair of peaks co-elutes after setting the initial program, introducing a mid-ramp hold can often resolve them without a complete method overhaul [63]. For example, if two peaks co-elute at 9.92 minutes in a program starting at 149°C with a ramp of 10.6°C/min, their elution temperature is approximately 254°C. Using the Giddings approximation, the optimal hold temperature would be 254°C - 45°C = 209°C. Inserting a hold at this temperature for 4-5 minutes can successfully separate the co-eluting pair, as demonstrated in a study separating 13 environmental contaminants [63].
Managing Derivatization in GC-MS Analysis
The Role of Derivatization
Derivatization is a chemical modification of analytes to make them suitable for GC-MS analysis. It is an indispensable step for compounds that are non-volatile, thermally unstable, or too polar to analyze directly [62] [64]. Common targets include hormones, steroids, organic acids, and sugars [62] [1] [64].
The primary goals of derivatization are [62]:
- Improving Volatility and Thermal Stability: Allows high-boiling-point compounds to be vaporized without decomposition.
- Enhancing Chromatographic Performance: Reduces peak tailing and improves separation efficiency.
- Increasing Sensitivity: Can improve detector response and lower detection limits.
Optimizing Derivatization Parameters
A study on the quantification of myo-inositol (MI) in plasma provides an excellent example of systematic derivatization optimization. The researchers investigated reagent volume, temperature, and duration to maximize the derivatization yield [62].
Table 2: Optimized Derivatization Parameters for myo-Inositol (MI) in Plasma [62]
| Parameter | Tested Range | Optimal Value | Observation |
|---|---|---|---|
| Reagent Volume | 1 - 15 mL | 5 mL | Yield increased with volume up to 5 mL, then plateaued. |
| Temperature | 65 - 85 °C | 70 °C | Yield was sufficient at 70°C and above. |
| Duration | 15 - 105 min | 60 min | Yield increased up to 60 min, with no major gain thereafter. |
| Sample Volume | 10 - 70 µL | 30 µL | 30 µL was the minimal volume giving a proportional response. |
The final optimized protocol used a 5 mL mixture of N-Methyl-N-(trimethylsilyl)trifluoroacetamide (MSTFA) with 1% trimethylchlorosilane (TMCS) at 70°C for 60 minutes, with shaking at 10-minute intervals [62]. This demonstrates that methodically testing these parameters is crucial for developing a robust and efficient derivatization procedure.
Another study on estrogenic compounds used BSTFA + 1% TMCS in an ultrasonic cup booster to accelerate the derivatization process, highlighting that alternative energy sources like ultrasound can significantly reduce reaction times [64].
Experimental Data and Protocol Comparison
Case Study: Environmental Contaminant Analysis
A detailed method development exercise for 13 persistent environmental contaminants showcases the impact of temperature programming [63]. The initial screening run used a generic program (40°C to 330°C at 10°C/min) and revealed a complex mixture. Attempting isothermal analysis at 218°C successfully separated the components but resulted in a long runtime and significant peak broadening for later eluters. The final optimized temperature program used an initial temperature of 149°C, a ramp of 10.6°C/min, and a mid-ramp hold at 209°C for 4.7 minutes, achieving excellent resolution with a reasonable analysis time [63].
Case Study: Hormone Analysis in Water
A comparison study of GC-MS/MS and LC-MS/MS for analyzing hormones and pesticides in surface water highlighted the role of derivatization. The study found that while GC-MS/MS outperformed LC-MS/MS for legacy organochlorine pesticides like DDT, derivatization was required for the GC-MS/MS analysis of hormones [7]. In contrast, LC-MS/MS could analyze highly water-soluble endocrine-disrupting chemicals, including estrogens and their conjugates, without derivatization, simplifying the sample preparation [7]. This trade-off between sample preparation complexity and instrumental performance is a key consideration when choosing between these techniques.
Table 3: Comparison of Key GC-MS and LC-MS Characteristics [12] [1]
| Characteristic | GC-MS | LC-MS |
|---|---|---|
| Ideal Analytes | Volatile, semi-volatile, thermally stable | Non-volatile, thermally labile, polar, high MW |
| Sample Preparation | Often requires derivatization for non-volatile compounds | Typically minimal; no derivatization needed |
| Ionization Source | Electron Impact (EI) - hard ionization | Electrospray Ionization (ESI) - soft ionization |
| Resulting Spectra | Extensive, reproducible fragmentation | Primarily molecular ion (e.g., [M+H]⁺) |
| Sensitivity | Can detect down to ~10⁻¹² mol [1] | Can detect down to ~10⁻¹⁵ mol [1] |
| Database Reliance | Universal EI spectral libraries available | Highly dependent on curated databases |
The Scientist's Toolkit: Essential Reagents and Materials
Successful GC-MS analysis, particularly involving derivatization, relies on specific reagents and materials. The following toolkit lists key items based on the protocols cited.
Table 4: Research Reagent Solutions for GC-MS and Derivatization
| Item | Function / Application |
|---|---|
| Silylation Reagents (e.g., BSTFA, MSTFA) | Most common derivatization agents; replace active hydrogens (e.g., in -OH, -COOH, -NH₂) with an alkyl-silyl group, increasing volatility and thermal stability [62] [64]. |
| Catalysts (e.g., TMCS) | Added in small amounts (e.g., 1%) to silylation reagents to catalyze the reaction and improve derivatization efficiency for sterically hindered compounds [62] [64]. |
| Deactivated Glass Vials | Essential for containing derivatization reactions to prevent adsorption of analytes and contamination from plasticizers, which can cause ghost peaks and system overpressure [64]. |
| Inert Solvents (e.g., Pyridine, n-Hexane) | Used to dissolve samples and derivatization reagents. Pyridine is a common solvent for silylation but may need to be exchanged for a solvent like n-hexane before injection to avoid instrumental issues [64]. |
| HP-5MS or Equivalent GC Column | A (5%-Phenyl)-methylpolysiloxane stationary phase; the industry workhorse for general purpose GC-MS analysis, providing excellent separations for a wide range of semi-volatile compounds [33] [62] [63]. |
Optimizing temperature programming and managing derivatization are not merely technical exercises; they are strategic decisions that define the scope and quality of a GC-MS analysis. Temperature programming is the key to unlocking fast, high-resolution separations of complex mixtures, while derivatization extends the power of GC-MS to a much broader range of biologically and environmentally relevant compounds.
When framing this within the broader thesis of comparing LC-MS and GC-MS for metabolite research, the choice becomes application-specific. GC-MS, particularly when optimized with effective temperature programming and derivatization protocols, is exceptionally powerful for volatile metabolites, organic acids, sugars, and steroids [62] [1]. Its strengths lie in robust, reproducible fragmentation and established libraries. LC-MS, conversely, offers a more straightforward path for polar, non-volatile, and thermally labile compounds without the need for chemical derivatization, making it ideal for peptides, conjugates, and many pharmaceuticals [12] [7] [1].
The most powerful modern laboratories recognize these techniques as complementary. The informed researcher, equipped with a deep understanding of how to optimize GC-MS through temperature programming and derivatization, is well-positioned to choose the right tool for the question at hand, and in many cases, to leverage both for a more comprehensive analytical picture.
In mass spectrometry-based metabolomics, the choice between Liquid Chromatography-Mass Spectrometry (LC-MS) and Gas Chromatography-Mass Spectrometry (GC-MS) represents a critical methodological crossroad. The accuracy, reliability, and reproducibility of data generated by both platforms hinge on robust quality assurance practices, with internal standards (IS) and systematic quality control (QC) protocols serving as fundamental components [2] [65]. This guide objectively compares the application of these quality assurance tools across both techniques, providing researchers with a framework for ensuring data integrity in metabolite analysis.
Internal Standards: Principles and Application
Internal standards are known compounds added at a known concentration to analytical samples to correct for variability during sample preparation, chromatographic separation, and mass spectrometric detection [66] [67]. The core principle involves normalizing analyte response relative to the IS response, which accounts for analyte losses and signal fluctuations [68].
When to Use an Internal Standard
Internal standardization provides maximum benefit in analyses involving complex, multi-step sample preparation where volumetric losses are likely [67]. For simple dilution-based methods with minimal processing, external standardization may suffice, but for techniques like liquid-liquid extraction or solid-phase extraction, an IS is essential to correct for preparation inconsistencies [67] [68].
Selection of Appropriate Internal Standards
The choice of internal standard depends on the specific analysis and required accuracy level. The ideal IS should closely mimic the analyte's chemical behavior, including retention time, ionization efficiency, and extraction recovery [66].
- Stable Isotope-Labeled Internal Standards (SIL-IS): Represent the gold standard for LC-MS and GC-MS bioanalysis. These compounds, where atoms are replaced with stable isotopes (²H, ¹³C, ¹⁵N), exhibit nearly identical chemical and physical properties to the target analyte, ensuring consistent extraction recovery and ionization efficiency [68]. To minimize mass spectrometric cross-talk, a mass difference of 4-5 Da from the analyte is recommended [68].
- Structural Analogue Internal Standards: Used when SIL-IS are unavailable, these compounds share similar chemical structures and functional groups with the target analyte. While they help mitigate experimental variability, they may not fully compensate for matrix effects [68].
- Alternative Approaches: When deuterated standards are inaccessible, a mixture of three different IS with varying masses, retention times, and structures can be employed. The IS demonstrating the most consistent response is selected for processing the entire batch [66].
Quality Control in Metabolomics
Quality Control encompasses the procedures and protocols implemented to ensure the reliability and reproducibility of analytical data throughout a metabolomics study [65]. The Metabolomics Quality Assurance and Quality Control Consortium (mQACC) leads collaborative efforts to define and advance best practices in this area [2].
Key QC practices include:
- Systematic Workflow: A structured approach from sample collection to data analysis is crucial for effective metabolomic studies [2].
- Sample Preparation Consistency: Using sterile techniques, consistent collection timing and conditions, and rapid processing or quenching of metabolism to minimize metabolite level changes [2].
- Technical Replicates and Blank Samples: Included to monitor analytical performance and identify potential contamination.
- QC Samples: Typically prepared from a pooled sample representative of the entire sample set, analyzed at regular intervals throughout the batch run to monitor system stability, precision, and reproducibility [65].
Comparative Analysis: LC-MS vs. GC-MS
The following table summarizes the key distinctions between LC-MS and GC-MS in the context of metabolite analysis, highlighting their implications for quality assurance.
Table 1: Comparison of LC-MS and GC-MS for Metabolite Analysis
| Aspect | GC-MS | LC-MS |
|---|---|---|
| Best For | Volatile, semi-volatile, and thermally stable compounds (typically < ~500 Da) [18] | Polar, ionic, thermolabile molecules; range from small metabolites to large biomolecules [18] |
| Ionization Source | Electron Ionization (EI) [18] | Electrospray Ionization (ESI) or Atmospheric Pressure Chemical Ionization (APCI) [18] |
| Ionization Characteristics | "Hard" ionization; produces highly reproducible, extensive fragmentation [18] | "Soft" ionization; often yields molecular ion with less fragmentation [18] |
| Sample Preparation | Often requires derivatization to increase volatility and thermal stability [18] | Typically minimal; may require careful pH/buffer control [18] |
| Identification Strength | Robust library matching using extensive, standardized EI spectral libraries (e.g., NIST, Wiley) [18] | Relies more on MS/MS fragmentation, accurate mass, retention time, and authentic standards; library coverage less comprehensive [18] |
| Internal Standards | SIL-IS are preferred; structural analogues used when unavailable. | SIL-IS are optimal; correct for matrix effects in ESI [68]. |
| Quality Control Focus | Monitoring derivatization efficiency and consistency; column performance at high temperatures [18] | Controlling matrix effects on ionization; solvent purity; buffer compatibility [18] [68] |
Experimental Protocols for Quality Assurance
Protocol 1: Sample Preparation with Internal Standards
This general protocol for biofluids or tissues highlights steps where internal standards and QC are critical.
- Quenching and Homogenization: Rapidly quench metabolism immediately after collection using methods like flash freezing in liquid N₂ or cold methanol to preserve the metabolic profile [2].
- Internal Standard Addition: Add a known, consistent amount of selected internal standard (SIL-IS or structural analogue) to each sample, including calibrators, QC samples, and unknowns, as early as possible in the preparation process [2] [68].
- Metabolite Extraction: Perform extraction using appropriate solvents. A common biphasic system for broad metabolite coverage is methanol/chloroform/water, which separates polar metabolites (methanol/water phase) from non-polar lipids (chloroform phase) [2].
- Concentration and Reconstitution: Dry the extracted samples under nitrogen or vacuum and reconstitute in a solvent compatible with the subsequent analytical platform [69].
Protocol 2: Monitoring Internal Standard Performance
Tracking IS response is a critical QC checkpoint.
- Response Checking: After analysis, check the IS response across all samples for consistent levels [66].
- Anomaly Investigation: Significant variations in IS response may indicate issues. Individual anomalies could stem from pipetting errors during IS addition, while systematic anomalies might point to instrument problems like injector issues [68].
- Corrective Action: If an IS shows inconsistent behavior, processing the batch with an alternative IS may be necessary to ensure data reliability [66].
Visualizing Workflows
The following diagram illustrates the integrated role of internal standards and quality control in a typical metabolomics workflow.
The Scientist's Toolkit: Essential Research Reagents
Table 2: Key Reagents for Quality-Assured Metabolomics
| Reagent / Solution | Function | Considerations |
|---|---|---|
| Stable Isotope-Labeled Internal Standards (SIL-IS) | Corrects for analyte loss and matrix effects; ensures quantification accuracy [68]. | Ideal mass difference of 4-5 Da from analyte; purity must be verified [68]. |
| Structural Analogue Internal Standards | Mitigates experimental variability when SIL-IS are unavailable [68]. | Should match analyte's logD, pKa, and critical functional groups [68]. |
| Methanol/Chloroform Solvent System | Biphasic extraction for broad-coverage metabolomics; separates polar and non-polar metabolites [2]. | Solvent ratios can be optimized (e.g., 2:1 for lipids) [2]. |
| Derivatization Reagents (for GC-MS) | Increases volatility and thermal stability of non-volatile metabolites [18]. | Adds preparation steps; potential for side reactions and variability [18]. |
| QC Pooled Sample | Monitors instrument stability, precision, and reproducibility throughout a batch sequence [65]. | Should be representative of the entire sample set; analyzed at regular intervals. |
Both LC-MS and GC-MS are powerful platforms for metabolite analysis, yet each presents distinct challenges for quality assurance. The foundational principle for ensuring data quality across both techniques is the consistent and appropriate use of internal standards, particularly stable isotope-labeled internal standards, complemented by rigorous, systematic QC protocols. By understanding the specific requirements and best practices for each platform—such as managing derivatization in GC-MS and controlling matrix effects in LC-MS—researchers can generate reliable, reproducible, and high-quality metabolomic data crucial for advancing research in drug development and biological science.
The application of Design of Experiments (DoE) represents a paradigm shift in chromatographic method development for metabolite analysis, moving from traditional one-variable-at-a-time (OVAT) approaches to systematic, multivariate optimization. Within the comparative framework of Liquid Chromatography-Mass Spectrometry (LC-MS) versus Gas Chromatography-Mass Spectrometry (GC-MS), DoE emerges as a critical strategy for enhancing method robustness, reproducibility, and efficiency. As metabolomics continues to revolutionize drug research and development by providing comprehensive insights into metabolic pathways and disease mechanisms, the demand for highly optimized analytical methods has never been greater [70]. DoE addresses this need by enabling researchers to simultaneously evaluate multiple methodological parameters and their interactions, thereby accelerating the development of precise and accurate analytical methods for both LC-MS and GC-MS platforms.
The fundamental principle of DoE in method development involves the application of statistical experimental designs to identify critical method parameters, understand their effects on method performance, and establish a design space where method robustness is guaranteed. This approach aligns with the Analytical Quality by Design (AQbD) framework advocated by regulatory agencies, which emphasizes systematic method development, risk assessment, and continuous improvement throughout the method lifecycle. For both LC-MS and GC-MS methodologies in metabolite analysis, DoE provides a structured pathway for navigating the complex interplay between chromatographic separation, ionization efficiency, and detection parameters [71].
Fundamental Differences Between LC-MS and GC-MS in Metabolite Analysis
Core Technological Principles and Applications
LC-MS and GC-MS represent complementary analytical techniques with distinct operational principles and application domains in metabolomics. LC-MS combines liquid chromatography separation with mass spectrometric detection, making it ideal for analyzing polar, ionic, and thermally labile molecules across a broad molecular weight range [18]. The mobile phase consists of liquids under high pressure, utilizing hydrophilic and hydrophobic properties of substances for separation [1]. In contrast, GC-MS employs gas chromatography with mass spectrometry, excelling in the analysis of volatile and semi-volatile, thermally stable compounds [3]. The GC-MS process vaporizes analytes and transports them through a heated capillary column using an inert carrier gas, separating compounds based on boiling points and column interactions [11].
The application profiles of these techniques reflect their fundamental differences. GC-MS serves as the gold standard for analyzing volatile organic compounds, environmental pollutants, essential oils, fatty acids, and drugs of abuse [18]. Its exceptional chromatographic resolution and ability to separate structural isomers make it invaluable for these applications. LC-MS, however, dominates bioanalytical applications, including plasma and urine metabolomics, peptide analysis, pharmaceutical quality control, and biomarker discovery [3] [70]. Its capacity to handle complex biological matrices and analyze thermolabile compounds positions LC-MS as an indispensable tool for modern metabolomics research.
Table 1: Fundamental Comparison of LC-MS and GC-MS Technologies
| Parameter | LC-MS | GC-MS |
|---|---|---|
| Separation Principle | Liquid mobile phase, polarity-based separation | Gas mobile phase, volatility and boiling point-based separation |
| Ionization Source | Electrospray Ionization (ESI), Atmospheric Pressure Chemical Ionization (APCI) [1] | Electron Impact (EI) [1] |
| Ionization Character | Soft ionization (preserves molecular ions) [18] | Hard ionization (produces fragment ions) [1] |
| Optimal Analyte Type | Polar, ionic, thermolabile compounds [18] | Volatile, thermally stable compounds [18] |
| Molecular Weight Range | Small metabolites to >10 kDa [18] | Typically <500 Da [18] |
| Sample Preparation | Protein precipitation, careful pH/buffer control [18] | Often requires derivatization for non-volatile compounds [18] |
Ionization Mechanisms and Their Implications
The ionization processes in LC-MS and GC-MS fundamentally differ, significantly impacting method development strategies and resulting data. LC-MS predominantly uses soft ionization techniques such as Electrospray Ionization (ESI) and Atmospheric Pressure Chemical Ionization (APCI) [1]. ESI works particularly well for most substances, while APCI proves suitable for detecting carotenoids and steroid-type compounds. These techniques typically generate intact molecular ions with little fragmentation, facilitating molecular weight determination and preserving labile functional groups [18].
In contrast, GC-MS typically employs Electron Impact (EI) ionization, a hard ionization method that produces extensive fragmentation [1]. Under high vacuum conditions, a heated filament emits electrons that interact with sample molecules, causing ionization and fragmentation. The resulting fragment ions provide rich structural information but may complicate molecular ion identification. A key advantage of EI ionization lies in its highly reproducible mass spectra across instruments and laboratories, which has enabled the development of extensive, universally applicable spectral libraries such as NIST and Wiley [18]. This reproducibility makes GC-MS particularly amenable to standardized method development approaches, including DoE implementation.
DoE Fundamentals for Chromatographic Method Development
Core Principles and Terminology
Design of Experiments (DoE) represents a systematic approach to method development that investigates the simultaneous effects of multiple factors on critical method performance characteristics. In the context of chromatographic method development for metabolite analysis, DoE enables researchers to efficiently optimize complex multivariate systems by identifying significant factors, quantifying their effects, and modeling their interactions. The approach stands in stark contrast to traditional OVAT methodology, which fails to capture factor interactions and often leads to suboptimal method conditions [71].
Key DoE terminology includes factors (independent variables), responses (dependent variables), levels (specific values assigned to factors), and experimental designs (structured arrangements of factor-level combinations). For chromatographic method development, typical factors include column temperature, mobile phase composition, pH, flow rate, and gradient profile. Critical responses encompass resolution, tailing factor, plate count, retention time, and peak capacity. The overarching goal of DoE implementation is to establish a design space—a multidimensional combination and interaction of input variables that have been demonstrated to provide assurance of quality [71].
Experimental Designs for Method Optimization
Various experimental designs serve different purposes in chromatographic method development. Screening designs, such as Plackett-Burman or fractional factorial designs, efficiently identify the most influential factors from a large set of potential variables with minimal experimental runs. Once critical factors are identified, response surface methodologies (RSM), including Central Composite Design (CCD) and Box-Behnken designs, characterize the relationship between factor settings and responses, enabling the identification of optimal method conditions [71].
Central Composite Design (CCD) has emerged as a particularly valuable approach for chromatographic method optimization in metabolomics. CCD consists of a two-level factorial design augmented with center points and axial points, allowing for efficient estimation of first- and second-order terms in the response model. This design provides comprehensive information about factor effects and interactions while requiring a reasonable number of experimental runs. The application of CCD enables researchers to develop robust methods that remain unaffected by small variations in method parameters, a crucial consideration for both LC-MS and GC-MS analyses in high-throughput metabolomics studies [71].
DoE Implementation for LC-MS Method Development
Critical Method Parameters and Responses
LC-MS method development requires careful optimization of multiple interrelated parameters to achieve optimal separation, ionization efficiency, and detection sensitivity. Critical method parameters typically include column temperature, mobile phase composition (organic modifier percentage), pH, buffer concentration, and gradient profile. The selection of stationary phase represents another crucial factor, with reversed-phase C18 columns being most common for semi-polar compounds and hydrophilic interaction chromatography (HILIC) columns preferred for polar metabolites [32] [70].
The responses measured during DoE implementation reflect method performance characteristics essential for reliable metabolite identification and quantification. Key responses include resolution between critical analyte pairs, peak tailing factor, theoretical plate count, retention time, and peak area reproducibility. For mass spectrometric detection, additional responses such as signal-to-noise ratio, ionization efficiency, and matrix effects must also be considered. The simultaneous optimization of these multiple responses often necessitates compromise, as improving one response may adversely affect others [71].
Case Study: DoE-Assisted HPLC Method for Drug Interaction Studies
A recent study demonstrates the effective application of DoE in LC-MS method development for simultaneous quantification of enzalutamide and repaglinide in rat plasma [71]. Researchers employed a Central Composite Design to systematically optimize four critical factors: column temperature (A), percentage organic strength (B), pH (C), and column type (D). The study evaluated three key responses: plate count (R1), tailing factor (R2), and resolution (R3) through 51 experimental runs.
The DoE approach enabled researchers to develop a robust, rapid HPLC method with a 7-minute runtime for analytical solution and 10 minutes for rat plasma samples. Through response surface analysis and utilization of polynomial equations, optimal chromatographic conditions were identified as 0.1% formic acid and acetonitrile as mobile phases on a Phenomenex C18 LC column (250 × 4.6 mm, 5 μm). The method was successfully validated according to US FDA guidelines, demonstrating linearity, accuracy, and precision within specified ranges [71]. This case study illustrates how DoE facilitates efficient method development capable withstanding rigorous regulatory scrutiny.
DoE Workflow for LC-MS Method Development
DoE Implementation for GC-MS Method Development
Unique Considerations for GC-MS Optimization
GC-MS method development presents distinct challenges and opportunities for DoE implementation compared to LC-MS. Critical factors requiring optimization include injector temperature, oven temperature program, carrier gas flow rate, column selection, and, for non-volatile compounds, derivatization parameters. The temperature program represents perhaps the most crucial optimization parameter in GC-MS, as it directly impacts separation efficiency, analysis time, and detection sensitivity [1] [18].
Derivatization introduces additional complexity to GC-MS method development, as this sample preparation step can significantly impact method performance. DoE approaches can optimize derivatization conditions by systematically varying factors such as derivatization reagent concentration, reaction time, reaction temperature, and catalyst amount. This comprehensive optimization ensures complete derivatization while minimizing decomposition or side reactions, ultimately enhancing method sensitivity and reproducibility for challenging metabolites [18].
Spectral Library Matching and Compound Identification
A distinctive advantage of GC-MS in metabolomics is the availability of extensive, standardized spectral libraries such as NIST and Wiley databases. The Electron Impact (EI) ionization used in GC-MS produces highly reproducible fragmentation patterns across different instruments and laboratories, enabling reliable compound identification through spectral matching [18]. This reproducibility makes GC-MS particularly amenable to DoE approaches, as method robustness can be quantitatively assessed through the consistency of spectral matching scores across different experimental conditions.
When implementing DoE for GC-MS method development, spectral match quality should be included as a critical response variable alongside traditional chromatographic performance metrics. The combination of retention index matching and spectral similarity scoring provides a powerful tool for compound identification, with DoE helping to establish method conditions that maximize both identification confidence and quantification accuracy. This integrated approach is particularly valuable in untargeted metabolomics, where comprehensive metabolite coverage and confident identification are paramount [18] [45].
Table 2: DoE Application in LC-MS vs GC-MS Method Development
| Aspect | LC-MS Method Development | GC-MS Method Development |
|---|---|---|
| Critical Factors | Column temperature, % organic solvent, mobile phase pH, buffer concentration, gradient profile, flow rate | Injector temperature, oven temperature program, carrier gas flow rate, derivatization parameters |
| Key Responses | Resolution, peak tailing, plate count, retention time, signal-to-noise ratio, matrix effects | Resolution, peak symmetry, retention index reproducibility, spectral match quality, signal-to-noise ratio |
| Optimal Designs | Central Composite Design, Box-Behnken Design, Full Factorial Design | Central Composite Design, Box-Behnken Design, Full Factorial Design |
| Special Considerations | Ionization suppression/enhancement, mobile phase additives, source parameters | Derivatization efficiency, thermal stability, inlet discrimination |
| Validation Parameters | Linearity, accuracy, precision, matrix effects, carryover | Linearity, accuracy, precision, derivatization yield, retention time stability |
Comparative Experimental Data: LC-MS vs GC-MS Performance
Sensitivity and Metabolite Coverage
Direct comparison of LC-MS and GC-MS performance metrics reveals complementary strengths that inform technique selection for specific metabolomics applications. LC-MS typically demonstrates higher sensitivity for most compound classes, with detection limits reaching 10⁻¹⁵ mol compared to 10⁻¹² mol for GC-MS [1]. This superior sensitivity, combined with its ability to analyze thermally labile and high molecular weight compounds, makes LC-MS particularly valuable for targeted bioanalysis of low-abundance metabolites in complex matrices.
GC-MS, while generally less sensitive than LC-MS for most applications, provides exceptional chromatographic resolution, especially for structural isomers [18]. The technique typically identifies approximately 100 metabolites in complex biological samples, while LC-MS can detect nearly 500 metabolites [45]. This difference in metabolite coverage reflects the complementary nature of these techniques, with each platform accessing different subsets of the metabolome based on compound physicochemical properties.
Analytical Performance and Operational Considerations
Beyond sensitivity and coverage, several additional factors influence technique selection for metabolomics studies. GC-MS generally offers better chromatographic resolution and more reproducible retention times compared to LC-MS, facilitating compound identification through retention index matching [18]. The availability of comprehensive, standardized spectral libraries further enhances identification confidence in GC-MS analyses.
Operational considerations also significantly differ between the platforms. GC-MS typically has lower capital and operational costs, simpler mobile phase requirements (pure gas vs. solvent mixtures), and demonstrated robustness for routine analysis [11]. LC-MS, while requiring more specialized operation and maintenance, provides greater analytical flexibility and is more easily adapted for high-throughput analyses. The higher solvent consumption and waste generation in LC-MS represent additional environmental and cost considerations [18] [11].
Table 3: Performance Comparison of LC-MS and GC-MS in Metabolite Analysis
| Performance Metric | LC-MS | GC-MS |
|---|---|---|
| Sensitivity | 10⁻¹⁵ mol [1] | 10⁻¹² mol [1] |
| Typical Metabolites Identified | ~500 metabolites [45] | ~100 metabolites [45] |
| Chromatographic Resolution | Good to very good | Excellent [18] |
| Retention Time Reproducibility | Good (method dependent) | Excellent [18] |
| Spectral Libraries | Limited coverage, instrument-dependent | Comprehensive (NIST, Wiley) [18] |
| Capital Cost | Higher [11] | Lower [11] |
| Operational Cost | Higher (solvents, maintenance) [18] | Lower (gas, less maintenance) [18] |
| Analysis Time | Variable (5-30 minutes typical) | Often longer due to temperature programming |
| Sample Throughput | High (with modern UHPLC systems) | Moderate |
Integrated Workflows: Combining LC-MS and GC-MS with DoE
Comprehensive Metabolite Coverage Through Orthogonal Techniques
The integration of LC-MS and GC-MS platforms represents a powerful strategy for achieving comprehensive metabolome coverage in complex biological samples. Since no single analytical platform can completely capture the immense chemical diversity of the metabolome, combining these orthogonal techniques significantly enhances the breadth and confidence of metabolite identification and quantification [45]. DoE methodologies facilitate the development of optimized integrated workflows by systematically addressing the unique requirements of each platform while ensuring complementary data quality.
Recent studies demonstrate that simultaneous application of GC-MS and LC-MS in metabolomics profiling enables better understanding of phenotype-related metabolic changes [45]. In one comprehensive analysis of reference plasma standard (NIST SRM 1950), the combined application of GC-MS, LC-MS, and NMR platforms identified a total of 353 metabolites, with each platform contributing unique metabolite identifications [45]. This integrative approach maximizes the probability of detecting significant metabolic alterations in response to disease, environmental exposures, or therapeutic interventions.
DoE for Cross-Platform Method Harmonization
The implementation of DoE in integrated LC-MS/GC-MS workflows extends beyond individual method optimization to include cross-platform harmonization. Experimental designs can systematically address factors affecting data comparability between platforms, including sample preparation consistency, quality control procedures, and data normalization strategies. This systematic approach ensures that metabolic data generated from different platforms can be confidently integrated for comprehensive biological interpretation.
Quality control samples, including pooled quality control (QC) samples and standard reference materials, play a crucial role in monitoring and maintaining platform performance in integrated workflows. DoE methodologies can optimize QC sample composition and injection frequency to maximize data quality while minimizing analytical downtime. The inclusion system suitability criteria in the DoE framework further ensures that both LC-MS and GC-MS platforms maintain optimal performance throughout large-scale metabolomics studies [45].
The Scientist's Toolkit: Essential Research Reagents and Materials
Table 4: Essential Research Reagents and Materials for LC-MS and GC-MS Metabolomics
| Item | Function | Application |
|---|---|---|
| C18 Reverse Phase Columns | Separation of semi-polar compounds using hydrophobic interactions | LC-MS analysis of lipids, flavonoids, amino acids [32] |
| HILIC Columns | Separation of polar compounds through hydrophilic interactions | LC-MS analysis of sugars, amino acids, carboxylic acids [32] |
| Derivatization Reagents (e.g., MSTFA, BSTFA) | Increase volatility and thermal stability of non-volatile compounds | GC-MS analysis of organic acids, sugars, amino acids [18] |
| LC-MS Grade Solvents | High purity mobile phases with minimal ion suppression | LC-MS mobile phase preparation [71] |
| Volatile Buffers (e.g., ammonium formate, ammonium acetate) | pH control without MS signal suppression | LC-MS mobile phase modification [32] |
| Quality Control Materials (e.g., NIST SRM 1950) | Method validation and inter-laboratory comparison | Both LC-MS and GC-MS performance verification [45] |
| Stable Isotope-Labeled Internal Standards | Quantification normalization and quality assessment | Both LC-MS and GC-MS targeted metabolomics [70] |
The strategic application of Design of Experiments (DoE) in chromatographic method development for metabolomics represents a significant advancement over traditional approaches. By enabling systematic optimization of multiple method parameters and their interactions, DoE facilitates the development of robust, reproducible, and efficient analytical methods for both LC-MS and GC-MS platforms. The complementary strengths of these techniques—with LC-MS excelling in polar, thermolabile compound analysis and GC-MS providing superior resolution for volatile compounds—highlight the value of integrated workflows for comprehensive metabolome coverage.
As metabolomics continues to expand its role in drug research and development, disease biomarker discovery, and systems biology, the implementation of structured method development approaches like DoE becomes increasingly crucial. The systematic comparison of LC-MS and GC-MS performance characteristics presented in this review provides a foundation for informed technique selection based on specific analytical requirements. Furthermore, the integration of these orthogonal platforms, guided by DoE principles, offers the most comprehensive approach for unraveling the complex metabolic networks underlying biological processes and disease states. Through continued refinement of DoE methodologies and their application to emerging analytical technologies, the field of metabolomics is poised to deliver increasingly profound insights into biochemical mechanisms and therapeutic interventions.
Platform Selection and Workflow Integration Strategy
Head-to-Head Comparison: Sensitivity, Coverage, Cost, and Data Analysis
In mass spectrometry-based metabolomics, the choice between Liquid Chromatography-Mass Spectrometry (LC-MS) and Gas Chromatography-Mass Spectrometry (GC-MS) is pivotal and directly influences the depth and reliability of research findings [45]. This guide provides a direct, data-driven comparison of these two platforms, focusing on the core performance metrics of sensitivity, dynamic range, and metabolite coverage. The objective is to equip researchers, scientists, and drug development professionals with the evidence needed to select the optimal analytical technique for their specific metabolite analysis projects [12]. Recognizing that these techniques are largely complementary is key to designing comprehensive metabolomics studies [17] [72].
Quantitative Performance Comparison
The fundamental differences in the operating principles of LC-MS and GC-MS directly translate into distinct performance profiles. Table 1 summarizes these key quantitative differences, providing a clear, at-a-glance comparison to inform platform selection.
Table 1: Direct Quantitative Comparison of LC-MS and GC-MS Performance
| Performance Metric | LC-MS | GC-MS |
|---|---|---|
| Typical Sensitivity | ~10-15 mol [1] | ~10-12 mol [1] |
| Dynamic Range | Broad [17] | Wide, but can be limited for non-volatiles without derivatization [73] |
| Key Ionization Techniques | Electrospray Ionization (ESI), Atmospheric Pressure Chemical Ionization (APCI) [73] [1] | Electron Impact (EI), Chemical Ionization (CI) [1] [4] |
| Metabolite Coverage Strength | Non-volatile, thermally labile, and high molecular weight compounds (e.g., lipids, peptides, pharmaceuticals) [12] [17] | Volatile and thermally stable compounds (e.g., organic acids, sugars, volatile fatty acids) [4] [17] |
| Approx. Metabolites Identifiable per Run | Can approach 500 metabolites [45] | ~100-200+ metabolites [4] [45] |
Experimental Protocols for Performance Assessment
A clear understanding of the underlying methodologies is essential for interpreting the data in Table 1. The following sections detail the standard experimental workflows that generate these performance metrics.
LC-MS Metabolomics Workflow
The LC-MS workflow is designed to handle labile and non-volatile compounds present in complex biological matrices [2]. The process, summarized in Figure 1 below, involves careful sample preparation to preserve the native state of metabolites, followed by separation via liquid chromatography and soft ionization prior to mass analysis.
Figure 1: LC-MS Experimental Workflow
Sample Preparation:
- Quenching: Metabolism is rapidly halted (quenched) immediately after sample collection using methods like flash freezing in liquid nitrogen or cold methanol (-40°C to -80°C) to preserve the in-vivo metabolic profile [2] [35].
- Extraction: Metabolites are extracted from the quenched sample. A common and robust method is biphasic liquid-liquid extraction using a methanol/chloroform/water system. This effectively separates polar metabolites (into the methanol/water layer) and non-polar lipids (into the chloroform layer) [2] [4]. Other solvents like methyl tert-butyl ether (MTBE) are also used for lipidomics [2].
- Internal Standards: Known concentrations of stable isotope-labeled internal standards are added to the extraction solvent before sample processing. This corrects for variability during preparation and enables accurate quantification [2].
Instrumental Analysis:
- Chromatography: The extracted metabolites are separated using High-Performance or Ultra-High-Performance Liquid Chromatography (HPLC/UHPLC). Reversed-Phase (RPLC) with C18 columns is most common for medium to non-polar metabolites, while Hydrophilic Interaction Liquid Chromatography (HILIC) is used for polar compounds [17] [35].
- Ionization: The separated analytes are ionized using soft techniques like Electrospray Ionization (ESI) or APCI. These techniques typically produce intact molecular ions (e.g., [M+H]+, [M-H]-) with little fragmentation, which is crucial for determining molecular mass [73] [1] [72].
- Mass Analysis: The ionized metabolites are analyzed by the mass spectrometer. LC-MS is highly versatile and can be coupled with various mass analyzers, including triple quadrupoles (for quantification) and high-resolution instruments like Orbitraps or TOF (for accurate mass and untargeted discovery) [12].
GC-MS Metabolomics Workflow
The GC-MS workflow, detailed in Figure 2 below, is characterized by a derivatization step that makes non-volatile metabolites amenable to analysis. It utilizes hard ionization that generates reproducible fragmentation patterns, aiding in compound identification.
Figure 2: GC-MS Experimental Workflow
Sample Preparation:
- Quenching and Extraction: The initial steps are similar to LC-MS, aiming to rapidly quench metabolism and extract metabolites. However, protocols often favor more hydrophilic solvents (e.g., methanol/water or acetonitrile/water) to reduce co-extraction of non-volatile lipids that can cause instrumental issues [4].
- Derivatization: This is a critical and specialized step for GC-MS. To become volatile and thermally stable, metabolites undergo a two-step chemical derivatization:
- Methoxyamination: Protects carbonyl groups in sugars and keto acids.
- Silylation: Replaces active hydrogens in functional groups (-OH, -COOH, -NH2) with non-polar trimethylsilyl (TMS) groups, drastically reducing polarity and boiling point [4]. This step is unnecessary for naturally volatile compounds.
Instrumental Analysis:
- Chromatography: The derivatized sample is vaporized and carried by an inert gas (e.g., helium) through a long chromatographic column. Compounds are separated based on their volatility and interaction with the stationary phase, which can be non-polar, intermediate-polarity, or polar [4] [17].
- Ionization: The separated compounds are ionized using a hard ionization method, typically 70 eV Electron Impact (EI). This high-energy process causes extensive and reproducible fragmentation of the molecular ion [1] [4].
- Mass Analysis: The mass spectrometer analyzes the resulting fragment ions. The rich, reproducible fragmentation patterns are a key strength, as they can be directly matched against extensive standardized spectral libraries (e.g., NIST, FiehnLib) for high-confidence compound identification [4].
The Scientist's Toolkit: Essential Research Reagents
Successful execution of the protocols above requires specific reagents and materials. Table 2 lists key solutions and their functions in metabolomics sample preparation.
Table 2: Essential Reagents for Metabolomics Sample Preparation
| Reagent/Material | Function | Key Considerations |
|---|---|---|
| Cold Methanol | Rapid quenching of metabolism; extraction of polar metabolites [2] [35]. | Pre-chilled to -20°C to -80°C; miscible with water for effective quenching. |
| Biphasic Solvent Systems | Comprehensive extraction of both polar and non-polar metabolites [2]. | Common system: Methanol/Chloroform/Water; separates metabolites by polarity. |
| Internal Standards | Correction for preparation variability; enable absolute quantification [2]. | Stable isotope-labeled compounds (e.g., 13C, 15N); should be added at start of extraction. |
| Derivatization Reagents | Make non-volatile metabolites analyzable by GC-MS [4]. | e.g., MSTFA (N-Methyl-N-(trimethylsilyl)trifluoroacetamide) for silylation. |
| Quality Control (QC) Pools | Monitor instrument stability and data reproducibility [2]. | Created by mixing small aliquots of all study samples; analyzed throughout the batch. |
Integrated Analysis for Comprehensive Coverage
Given the orthogonal strengths of LC-MS and GC-MS, the most powerful metabolomics studies often integrate both platforms [45]. LC-MS provides excellent coverage of non-volatile and labile metabolites like complex lipids and peptides, while GC-MS excels at profiling primary metabolites like organic acids, sugars, and amino acids. Using both techniques in tandem can significantly expand the number of annotated metabolites, potentially identifying over 350 unique compounds in a single study, and thereby offering a more holistic view of the metabolic state [45]. This integrated approach is highly recommended for untargeted discovery-phase research where the goal is to achieve the broadest possible metabolite coverage.
Metabolite identification is a foundational challenge in metabolomics, and the two predominant technologies—Gas Chromatography-Mass Spectrometry (GC-MS) and Liquid Chromatography-Mass Spectrometry (LC-MS)—have evolved distinct identification philosophies. GC-MS relies heavily on its mature, curated spectral libraries built from standardized fragmentation patterns. In contrast, LC-MS often depends on MS/MS fragmentation to generate structural data for identification, though it faces challenges with inconsistent fragmentation and smaller library resources [4] [29]. This guide objectively compares the performance, experimental protocols, and applications of these two approaches to inform researchers and drug development professionals.
Technology Comparison: Fundamental Principles and Workflows
The core difference in identification strategy stems from fundamental differences in ionization and fragmentation.
GC-MS: Standardized Fragmentation and Library Matching
In GC-MS, electron ionization (EI) is typically used. EI is a "hard" ionization method that produces extensive, reproducible, and compound-specific fragmentation patterns by bombarding molecules with high-energy electrons [4] [74]. The stability and reproducibility of these EI mass spectra across instruments and laboratories are what make large, searchable spectral libraries possible [75].
LC-MS: Soft Ionization and Targeted Fragmentation
LC-MS typically uses "soft" ionization techniques like electrospray ionization (ESI), which produce minimal in-source fragmentation, often yielding only the protonated ([M+H]+) or deprotonated ([M-H]-) molecular ion [29] [76]. To obtain structural information, these precursor ions are selectively fragmented in a second stage (MS/MS) using techniques like collision-induced dissociation (CID). However, the resulting MS/MS spectra can be highly dependent on the instrument and collision energy, complicating the creation of universal libraries [29] [75].
The following diagram illustrates the core identification workflows for each technology:
Performance Data: Quantitative Comparison of Key Metrics
The different principles of the two technologies lead to measurable differences in performance, particularly in the areas of identification confidence, coverage, and throughput.
Table 1: Comparative Performance of GC-MS and LC-MS in Metabolite Identification
| Performance Metric | GC-MS with Spectral Libraries | LC-MS with MS/MS Fragmentation |
|---|---|---|
| Primary ID Method | Matching to reference libraries [4] | Interpretation of MS/MS spectra [29] |
| Typical Ionization | Electron Ionization (EI) [74] | Electrospray Ionization (ESI) [29] |
| Fragmentation Reproducibility | High and standardized [75] | Variable (instrument-/energy-dependent) [29] |
| Spectral Library Size | ~242,000 compounds (NIST14) [4] | ~8,000-12,000 compounds [4] |
| Identification Confidence | High (2 orthogonal parameters: spectrum & retention index) [4] | Moderate (often requires authentic standards for confirmation) [75] |
| Coverage of Primary Metabolism | Excellent (acids, sugars, amino acids) [4] [77] | Broad, but can miss some polar metabolites [29] |
| Throughput | High (mature, automated deconvolution) [4] | Moderate (data-dependent acquisition can be stochastic) [29] |
| Key Limitation | Requires volatile/derivatized metabolites [4] | Susceptible to ion suppression [75] [76] |
Experimental Protocols: Detailed Methodologies
GC-MS Metabolite Profiling Protocol
The following established protocol is widely used for profiling primary metabolites in biological samples (e.g., plasma, urine, tissues) [4].
Sample Preparation and Metabolite Extraction:
- Homogenize tissue or extract biofluids with a cold ternary solvent system (e.g., acetonitrile:isopropanol:water) to maximize metabolite coverage from polar to mid-polar [4].
- Centrifuge and collect the supernatant.
- Critical Step: Evaporate the supernatant to complete dryness under a gentle stream of nitrogen or vacuum. A lipid clean-up step is recommended for lipid-rich samples to prevent GC system contamination and derivatization issues [4].
Chemical Derivatization (Two-Step):
- Methoximation: Reconstitute the dried extract in methoxyamine hydrochloride in pyruvate to protect carbonyl groups (e.g., in sugars) by forming methoximes. Incubate at a defined temperature (e.g., 70°C for 1 hour) [74].
- Silylation: Add a silylating agent like N,O-Bis(trimethylsilyl)trifluoroacetamide (BSTFA) with 1% TMCS. This step replaces active hydrogens in -COOH, -OH, -NH, and -SH groups with trimethylsilyl groups, making metabolites volatile and thermally stable. Incubate (e.g., 70°C for 1 hour) [4] [75].
GC-MS Data Acquisition:
- Inject the derivatized sample into the GC system equipped with a non-polar or mid-polar capillary column (e.g., 5% phenyl-siloxane).
- Use a temperature gradient to separate metabolites based on their volatility.
- The eluate is introduced into the mass spectrometer operating in EI mode at 70 eV. Data is collected in full-scan mode (e.g., m/z 50-600) [4].
Data Processing and Metabolite Identification:
- Use Automated Mass Spectral Deconvolution and Identification Software (AMDIS) or similar tools (e.g., ChromaTOF) to deconvolve co-eluting peaks and purify mass spectra [4].
- Search the deconvolved spectra against commercial (e.g., NIST, Wiley) or public (e.g., FiehnLib, Golm Metabolome Database) spectral libraries. Confident identification requires matching both mass spectrum and retention index [4] [74].
LC-MS Untargeted Profiling Protocol
This protocol outlines a common untargeted approach for discovering metabolites that differentiate biological groups [29].
Sample Preparation and Metabolite Extraction:
- Quench metabolism rapidly using cold acidic acetonitrile:methanol:water to prevent metabolite interconversion [53].
- Extract metabolites using methods appropriate for the sample matrix (e.g., liquid-liquid extraction, solid-phase extraction). The choice between single-phase or two-phase extraction depends on the desired metabolite coverage [29].
- Remove proteins and particulates by centrifugation.
LC-MS Data Acquisition:
- Inject the extract onto a reversed-phase (e.g., C18) or HILIC LC column to separate metabolites based on hydrophobicity or polarity, respectively.
- The eluate is ionized using ESI in both positive and negative ionization modes to maximize coverage [29].
- Data is acquired using a high-resolution mass spectrometer (e.g., Q-TOF, Orbitrap) in data-dependent acquisition (DDA) mode:
- MS1 Survey Scan: A full-scan high-resolution MS1 spectrum is collected.
- MS/MS Fragmentation: The most intense ions from the MS1 scan are sequentially isolated and fragmented to produce MS/MS spectra [29].
Data Processing and Metabolite Identification:
- Process raw data using software (e.g., MZmine, XCMS) for peak picking, alignment, and normalization.
- Statistically analyze the data to find features (m/z and retention time pairs) that differ significantly between sample groups.
- Annotate significant features by:
- Querying their accurate mass against metabolic databases (e.g., HMDB).
- Interpreting their MS/MS spectra by searching against MS/MS spectral libraries (e.g., MassBank, NIST MS/MS). The lack of standardized fragmentation often limits confident identification to level 2 (putative annotation) without an authentic standard [29] [75].
The Scientist's Toolkit: Essential Research Reagents and Materials
Successful execution of metabolomics experiments requires specific reagents and materials tailored to each platform.
Table 2: Essential Research Reagent Solutions for Metabolite ID
| Item | Function / Application | Example Use-Case |
|---|---|---|
| BSTFA with 1% TMCS | Silylation derivatization reagent for GC-MS | Converting polar functional groups (-OH, -COOH) into volatile TMS derivatives [75] |
| Methoxyamine Hydrochloride | Methoximation reagent for GC-MS | Protecting carbonyl groups in sugars and keto acids to prevent cyclization and multiple peaks [74] |
| Deuterated / 13C-Labeled Internal Standards | Quantitation control for both GC-MS and LC-MS | Correcting for matrix effects and losses during sample preparation; used for absolute quantitation [53] |
| Cold Acidic Acetonitrile:MeOH:H2O | Quenching and extraction solvent | Rapidly halting enzyme activity during sample harvesting for accurate snapshot of metabolite levels [53] |
| C18 and HILIC LC Columns | Orthogonal separation for LC-MS | Expanding metabolite coverage; C18 for mid-nonpolar, HILIC for polar metabolites [29] |
| NIST Mass Spectral Library | Reference database for GC-MS | Tentative identification of metabolites via spectral matching [4] |
| Human Metabolome Database (HMDB) | Reference database for LC-MS | Querying accurate mass and MS/MS data for metabolite annotation [53] |
GC-MS and LC-MS offer complementary strengths for metabolite identification. GC-MS provides high confidence identifications for a well-defined set of primary metabolites through robust, reproducible spectral matching, making it ideal for validated targeted analyses [4] [77]. LC-MS offers broader potential coverage of the metabolome, including thermally unstable and non-volatile compounds, and is indispensable for hypothesis-generating untargeted studies and lipidomics, though it often faces challenges in achieving confident identifications [29] [78].
The future of metabolite identification lies in leveraging the strengths of both techniques. As one study concluded, "GC-EI-MS data complements ESI-MS data" and is invaluable for resolving structural questions left unanswered by LC-MS alone [75]. Furthermore, emerging computational tools like the Mass Spectrometry Query Language (MassQL) are enabling researchers to flexibly mine complex MS data for patterns of interest, potentially bridging the gap between the two platforms and unlocking more biological insights from existing datasets [79]. Researchers should select the technology based on their specific biological questions, the chemical classes of interest, and the required level of identification confidence.
In the field of metabolite analysis, achieving high chromatographic resolution is a prerequisite for accurate identification and quantification. The challenge is particularly acute when dealing with structural isomers and complex biological mixtures, where compounds exhibit nearly identical chemical properties yet possess distinct biological activities. Liquid Chromatography-Mass Spectrometry (LC-MS) and Gas Chromatography-Mass Spectrometry (GC-MS) represent two foundational technological approaches for such separations, each with unique strengths and limitations [1] [80] [3]. This guide provides an objective, data-driven comparison of these platforms, framing their performance within the specific context of metabolomics research. For researchers and drug development professionals, selecting the appropriate technique is not merely a technical choice but a strategic decision that directly impacts data quality, coverage, and ultimately, the reliability of biological conclusions.
The fundamental challenge in separating structural isomers—including positional isomers, E/Z (cis-trans) isomers, and diastereomers—lies in their identical mass-to-charge ratios, rendering mass spectrometry alone insufficient for differentiation [81]. Resolution, therefore, depends entirely on the separation power of the chromatographic system prior to mass analysis. This comparison examines how LC-MS and GC-MS systems meet this challenge, supported by experimental data on sensitivity, application coverage, and practical workflow considerations.
Core Technology Comparison: LC-MS vs. GC-MS
Liquid Chromatography-Mass Spectrometry (LC-MS) and Gas Chromatography-Mass Spectrometry (GC-MS) combine chromatographic separation with mass spectrometric detection, but they operate on fundamentally different principles. Understanding their core mechanisms is essential for selecting the right platform for specific analytical challenges.
LC-MS utilizes a liquid mobile phase (under high pressure) to separate compounds based on their differential interaction with a solid stationary phase. Separated analytes are then ionized at atmospheric pressure using techniques like Electrospray Ionization (ESI) or Atmospheric Pressure Chemical Ionization (APCI), which gently transfer ions into the mass spectrometer for analysis [1] [80] [82]. This process is particularly suited for non-volatile, thermally labile, and polar molecules [1] [3].
GC-MS employs an inert gas mobile phase (such as helium) to separate volatile compounds based on their boiling points and polarity within a long, temperature-controlled column [1]. Analytes are typically ionized using Electron Impact (EI) ionization, a "hard" ionization method that fragments molecules into characteristic patterns, facilitating library-based identification [1]. This technique is ideal for volatile, thermally stable, and low- to medium-polarity compounds [1] [3].
The following workflow diagrams illustrate the key stages of analysis for each technique.
LC-MS Analysis Workflow
GC-MS Analysis Workflow
Performance Comparison for Metabolite Analysis
The choice between LC-MS and GC-MS significantly impacts the scope, depth, and quantitative accuracy of metabolomic studies. The following tables summarize their key performance metrics and characteristics.
Table 1: Key Performance Metrics for LC-MS and GC-MS [1]
| Platform | Sensitivity (mol) | Ionization Technique | Key Advantage | Primary Limitation |
|---|---|---|---|---|
| LC-MS | 10⁻¹⁵ | Electrospray Ionization (ESI), Atmospheric Pressure Chemical Ionization (APCI) | High sensitivity for a vast range of compounds, ideal for non-volatile and thermally labile molecules [1] [3] | Highly dependent on databases for identification; can be susceptible to ion suppression from co-eluting compounds [1] [83] |
| GC-MS | 10⁻¹² | Electron Impact (EI) | Extensive, universal spectral libraries for confident identification; high chromatographic resolution [1] | Limited to volatile compounds; often requires complex sample derivatization, which adds time and can introduce errors [1] |
Table 2: Application Suitability and Compound Coverage
| Feature | LC-MS | GC-MS |
|---|---|---|
| Optimal for Compound Types | Lipids, amino acids, flavonoids, proteins, peptides, most pharmaceuticals [1] [3] | Volatile organic compounds, fatty acids, steroids, sugars (after derivatization), environmental contaminants [1] [3] |
| Isomer Separation Capability | Effective for diastereomers and epimers using specialized columns; requires chiral columns for enantiomers [81] | Excellent for separating a wide range of structural isomers due to high-efficiency, long chromatographic columns [1] |
| Sample Throughput | Generally fast; minimal sample preparation for many applications | Can be slower due to mandatory derivatization steps for many metabolites |
| Quantitative Robustness | Excellent, but requires careful optimization to mitigate ion suppression [83] | Highly robust, favored in many standardized clinical and forensic applications [1] |
Experimental Protocols for Metabolite Analysis
Robust experimental design is critical for generating reliable and reproducible metabolomic data. The following protocols outline standardized workflows for both LC-MS and GC-MS analysis of complex biological samples.
Standard LC-MS Metabolomics Protocol
1. Sample Collection and Quenching:
- Collect biological samples (cells, tissue, biofluids) under standardized conditions to minimize metabolic variation [2].
- Immediately quench metabolism using flash freezing in liquid nitrogen or cold methanol (-40°C to -80°C) to preserve the metabolic profile at the time of collection [2].
2. Metabolite Extraction:
- Use a biphasic liquid-liquid extraction system for comprehensive coverage. A common method involves adding a cold mixture of methanol, chloroform, and water (e.g., in a 2:1:1 ratio) to the sample [2].
- Vigorously vortex and centrifuge to separate phases. The upper polar phase (methanol/water) contains polar metabolites, while the lower organic phase (chloroform) contains lipids [2].
- Add appropriate internal standards (e.g., stable isotope-labeled compounds) to the extraction solvent prior to processing to correct for variations in extraction efficiency and instrument performance [2].
3. LC-MS Analysis:
- Chromatography: Inject the extract onto a reversed-phase UPLC/HPLC column (e.g., C18). Use a gradient elution from aqueous to organic mobile phase (e.g., water to acetonitrile, both modified with 0.1% formic acid) at a flow rate of 0.2-0.4 mL/min [83] [2].
- Ionization and MS: Use electrospray ionization (ESI) in both positive and negative ion modes. Optimize key source parameters (voltages, gas flows, temperature) to maximize signal intensity and stability. Data can be acquired in full-scan mode for untargeted profiling or Selected Reaction Monitoring (SRM) for targeted quantification [83].
Standard GC-MS Metabolomics Protocol
1. Sample Collection and Extraction:
- Follow similar collection and quenching procedures as for LC-MS.
- Perform a single-phase extraction, typically with methanol or acetonitrile, to precipitate proteins and extract a broad range of metabolites [2].
2. Chemical Derivatization:
- Dry a portion of the extract under a gentle stream of nitrogen or in a vacuum concentrator.
- Redissolve and derivatize the dried extract to increase volatility and thermal stability. A common two-step protocol involves:
3. GC-MS Analysis:
- Chromatography: Inject the derivatized sample into a GC system equipped with a non-polar or mid-polar capillary column. Use a temperature ramp (e.g., 60°C to 330°C) to separate compounds based on their volatility [1].
- Ionization and MS: Use electron impact (EI) ionization at 70 eV. Acquire data in full-scan mode (e.g., m/z 50-600). Identify metabolites by comparing the acquired fragmentation spectra to libraries of standard compounds [1].
The Scientist's Toolkit: Essential Research Reagents and Materials
Successful separation of isomers and complex mixtures relies on a carefully selected suite of reagents and materials. The following table details key solutions and their functions in the experimental workflow.
Table 3: Essential Reagents and Materials for Chromatographic Metabolite Analysis
| Item | Function/Purpose | Application Notes |
|---|---|---|
| Methanol (MeOH) & Chloroform (CHCl₃) | Primary solvents for biphasic liquid-liquid extraction, separating polar (MeOH/H₂O phase) and non-polar metabolites (CHCl₃ phase) [2]. | The solvent ratio can be optimized; e.g., 2:1 MeOH:CHCl₃ is common. Must be HPLC/MS grade for purity. |
| Stable Isotope-Labeled Internal Standards | Compounds (e.g., ¹³C-labeled amino acids) added in known quantities to correct for sample loss, matrix effects, and instrument variability, enabling accurate quantification [2]. | Should be added as early as possible in the workflow, ideally before the extraction step. |
| Ammonium Formate/Ammonium Acetate Buffers | Volatile buffers for LC mobile phases; they facilitate efficient ionization in the MS and prevent source contamination, unlike non-volatile salts [83]. | Typically used at concentrations of 2-20 mM, with pH adjusted to optimize separation and ionization (e.g., pH 3-5 for positive mode) [83]. |
| Methoxyamine Hydrochloride & MSTFA | Key derivatization reagents for GC-MS. Methoximation stabilizes sugars, and silylation (MSTFA) increases analyte volatility [1]. | Derivatization is a critical, time-sensitive step that must be performed under anhydrous conditions. |
| Specialized HPLC Columns | Cogent UDC-Cholesterol: Separates geometric (cis/trans) isomers based on shape selectivity [81]. Cogent Phenyl Hydride: Resolves positional isomers via π-π interactions with aromatic analytes [81]. | Column choice is one of the most impactful factors for achieving isomer resolution in LC-MS. |
The comparative analysis of LC-MS and GC-MS reveals a landscape defined by complementary strengths rather than outright superiority of one platform. LC-MS excels in its unparalleled sensitivity and expansive compound coverage, making it the tool of choice for probing the vast landscape of non-volatile lipids, pharmaceuticals, and polar metabolites without the need for complex derivatization [1] [3]. Conversely, GC-MS provides exceptional chromatographic resolution and the unique advantage of universal, library-searchable spectra, offering unmatched confidence in identifying volatile compounds and a wide array of structural isomers [1].
For the modern metabolomics researcher, the decision is not a binary one but a strategic consideration of the biological question at hand. The future lies in leveraging the synergistic potential of both techniques in a multi-platform framework. Such an integrated approach provides a more holistic and validated view of the metabolome, ultimately driving discovery in drug development, clinical diagnostics, and fundamental biological research.
For researchers in metabolomics and drug development, selecting the appropriate mass spectrometry technology is a critical decision with significant long-term financial implications. This guide provides an objective comparison of the Total Cost of Ownership (TCO) for Liquid Chromatography-Mass Spectrometry (LC-MS) and Gas Chromatography-Mass Spectrometry (GC-MS) systems, supporting strategic investment decisions for laboratory instrumentation.
The following table summarizes the fundamental cost distinctions between the two platforms, which are detailed throughout this guide.
| Cost Component | GC-MS | LC-MS |
|---|---|---|
| Typical Instrument Cost | \$100,000 - \$500,000 [84] [85] | \$50,000 - >\$1,000,000 [84] |
| Best Suited For | Volatile, thermally stable compounds (typically <500 Da) [18] | Non-volatile, polar, thermally labile, and larger molecules [17] [18] |
| Sample Preparation | Often requires derivatization, adding time and cost [17] [18] | Typically simpler; may require careful pH/buffer control [18] |
| Operational Cost Drivers | Inert carrier gases (e.g., Helium), columns, derivatization reagents [17] [1] | High-purity solvents, columns, higher maintenance contracts [84] [18] |
| Ionization Source | Electron Ionization (EI) [1] [18] | Electrospray Ionization (ESI), Atmospheric Pressure Chemical Ionization (APCI) [17] [32] |
Instrumentation Acquisition Costs
The initial capital outlay for a mass spectrometer varies significantly based on its performance specifications, which directly correlate with its application scope in metabolite analysis.
GC-MS Instrument Pricing
GC-MS systems are often a cost-effective choice for analyzing volatile metabolites. Pricing tiers are generally as follows [84] [85]:
- Entry-Level Systems: \$100,000 - \$150,000
- Mid-Range Systems: \$150,000 - \$500,000
LC-MS Instrument Pricing
LC-MS systems cover a much wider price range, reflecting their versatility in analyzing a broader spectrum of metabolites, from small polar molecules to large lipids and peptides [84].
- Entry-Level Systems (e.g., single quadrupole): \$50,000 - \$150,000
- Mid-Range Systems (e.g., triple quadrupole, TOF): \$150,000 - \$500,000
- High-End Systems (e.g., Orbitrap, FT-ICR): \$500,000 to over \$1,000,000
Operational and Maintenance Expenses
The ongoing costs of maintenance, consumables, and utilities constitute a major portion of the TCO, often exceeding the initial purchase price over the instrument's lifespan.
Maintenance and Service Contracts
Annual service contracts are essential for minimizing instrument downtime and ensuring data integrity. These typically cost between \$10,000 and \$50,000 per year, with LC-MS systems often residing at the higher end of this range due to greater complexity [84].
Consumables and Reagents
The day-to-day running costs differ markedly between the two platforms.
| Consumable Category | GC-MS | LC-MS |
|---|---|---|
| Mobile Phase | Inert gases (e.g., Helium); cost varies based on purity and market [1] | High-purity organic solvents (e.g., acetonitrile, methanol); significant recurring cost [17] [18] |
| Chromatography Columns | Capillary columns with various stationary phases [17] | Packed columns (e.g., C18 for RPLC); variety of chemistries available [17] |
| Sample Preparation | Derivatization reagents (e.g., TMS) add a significant per-sample cost [23] [18] | Filters, solid-phase extraction (SPE) cartridges [23] |
Outsourced Analysis Costs
For laboratories with intermittent needs, outsourcing analysis to a core facility can be a cost-effective alternative to in-house instrument ownership. The table below shows representative per-analysis costs from academic facilities [86] [87].
| Service Type | Internal Academic Rate | External Academic / Non-Profit Rate |
|---|---|---|
| GC-MS Analysis | ~\$78 | ~\$149 [87] |
| LC-MS or LC-MS/MS Analysis | ~\$78 | ~\$149 [87] |
| Standard Curve Quantitation | ~\$470 | ~\$890 [87] |
| Sample Preparation (10 samples) | ~\$157 | ~\$298 [87] |
| Method Development (Hourly) | ~\$78 | ~\$149 [87] |
Experimental Protocols and Cost Drivers
The choice between GC-MS and LC-MS dictates the required experimental workflow, directly impacting labor and consumable costs.
GC-MS Metabolite Analysis Workflow
GC-MS requires samples to be volatile and thermally stable. Many metabolites necessitate chemical derivatization before analysis, which adds steps, time, and reagent costs to the protocol [17] [23].
LC-MS Metabolite Analysis Workflow
LC-MS operates at ambient temperature and is ideal for thermolabile compounds. Sample preparation is typically less complex, though method development requires careful optimization of the liquid chromatography step to avoid ion suppression and manage matrix effects [32] [18].
The Scientist's Toolkit: Essential Research Reagents and Materials
The following table details key consumables and their functions in LC-MS and GC-MS workflows, which are critical to budget for in operational planning [17] [23].
| Item | Function in Analysis |
|---|---|
| C18 Chromatography Columns | Most common stationary phase for Reverse-Phase Liquid Chromatography (RPLC); separates metabolites based on hydrophobicity [17]. |
| Derivatization Reagents (e.g., TMS) | For GC-MS; chemically modifies non-volatile metabolites (e.g., organic acids, sugars) to increase their volatility and thermal stability [23]. |
| High-Purity Solvents (ACN, MeOH) | Mobile phase components for LC-MS; require high purity to minimize background noise and ion suppression [17]. |
| Solid-Phase Extraction (SPE) Cartridges | Used for sample clean-up and pre-concentration of metabolites from complex biological matrices to reduce matrix effects [23]. |
| Inert Gas Supply (Helium) | The mobile phase for GC-MS; carries vaporized samples through the chromatographic column [17] [1]. |
There is no universally superior technology; the optimal choice is dictated by the specific metabolites of interest and the research context.
- Choose GC-MS if your research focuses on volatile compounds, fatty acids, or organic acids, and you prioritize lower operational costs, robust separation, and the powerful, standardized identification provided by EI libraries [17] [18].
- Choose LC-MS if your research requires the analysis of a broad range of non-volatile, polar, or thermally unstable metabolites (e.g., lipids, peptides), where its superior versatility and sensitivity for these compounds justify the higher operational expenses [17] [32] [18].
For a comprehensive metabolomics profile, many leading research facilities employ both GC-MS and LC-MS as complementary techniques, thereby maximizing metabolite coverage but also incurring the combined total cost of ownership of both platforms [45].
Liquid Chromatography-Mass Spectrometry (LC-MS) and Gas Chromatography-Mass Spectrometry (GC-MS) represent two cornerstone technologies in modern analytical chemistry, each offering unique capabilities for metabolite analysis. These hyphenated techniques combine superior separation power with sensitive and selective mass detection, making them indispensable across diverse research domains including pharmaceuticals, clinical diagnostics, environmental science, and food safety [5] [47]. The fundamental distinction lies in their separation mechanisms: LC-MS separates compounds in a liquid phase, making it ideal for non-volatile, thermally labile, and polar molecules, while GC-MS utilizes a gas phase, excelling with volatile, thermally stable analytes [11].
The selection between these platforms is not merely a technical choice but a strategic decision that directly impacts data quality, coverage, and biological interpretation. This guide provides a practical, evidence-based framework to help researchers, scientists, and drug development professionals navigate this critical selection process. By understanding the complementary strengths and limitations of each technology, laboratories can optimize their analytical workflows to address specific research questions effectively and efficiently.
Fundamental Principles and Technological Comparisons
The operational dichotomy between LC-MS and GC-MS stems from their distinct separation and ionization mechanisms, which directly dictate their application scope.
LC-MS employs a liquid mobile phase to transport the sample through a chromatographic column. Separation occurs based on differential interaction between analytes, the mobile phase (liquid), and the stationary phase (column packing material) [11]. Common mechanisms include reversed-phase (polarity), ion-pairing, and size exclusion [19]. Critically, LC-MS typically uses softer ionization techniques like electrospray ionization (ESI) and atmospheric pressure chemical ionization (APCI), which are gentle enough to preserve molecular integrity for detection [5]. This makes LC-MS particularly suitable for a broad range of non-volatile and thermally unstable compounds, including large biomolecules like proteins, peptides, and polar metabolites [5] [11].
GC-MS relies on an inert gas mobile phase (e.g., helium) to carry a vaporized sample through a heated column. Separation is primarily based on analyte volatility and polarity [11]. GC-MS most often uses electron ionization (EI), a high-energy process that consistently generates fragment ions, providing reproducible spectral fingerprints valuable for compound identification and library matching [88] [6]. A significant requirement for GC-MS is that analytes must be volatile and thermally stable. For many non-volatile metabolites, this necessitates a derivatization step—chemical modification to increase volatility and thermal stability—prior to analysis [88].
Table 1: Core Technological Comparison of LC-MS and GC-MS
| Feature | LC-MS | GC-MS |
|---|---|---|
| Separation Principle | Differential partitioning between liquid mobile phase and solid stationary phase [19] | Partitioning between inert gas mobile phase and liquid/solid stationary phase in a heated column [11] |
| Typical Ionization Methods | Electrospray Ionization (ESI), Atmospheric Pressure Chemical Ionization (APCI) [5] | Electron Ionization (EI) [88] |
| Sample Requirements | Non-volatile, polar, thermally labile compounds [5] | Volatile and thermally stable compounds; often requires derivatization for non-volatile metabolites [88] |
| Key Strength | Broad coverage of metabolites without derivatization; analysis of large, polar biomolecules [5] [19] | High separation efficiency and reproducible, library-searchable fragmentation patterns [88] |
Quantitative Performance and Analytical Capabilities
When selecting a platform, practical considerations such as detection limits, analytical scope, and operational costs are paramount. A comparative study analyzing pharmaceuticals and personal care products in water provides illustrative data, demonstrating that the optimal choice is highly analyte-dependent [6].
Table 2: Comparative Analytical Performance and Practical Considerations
| Parameter | LC-MS | GC-MS |
|---|---|---|
| Detection Limits | Lower detection limits for many pharmaceuticals (e.g., carbamazepine, loratadine) in a direct comparison study [6] | Higher detection limits for some compounds in the same study, but highly sensitive for volatile organics [6] |
| Metabolite Coverage | Excellent for polar and non-polar metabolites, especially with orthogonal columns (e.g., RP and HILIC) [89] | Excellent for volatile compounds, organic acids, sugars; coverage extended via derivatization [19] [88] |
| Typical Applications | Biomarker discovery, drug metabolism studies, proteomics, lipidomics, non-targeted screening [5] | Volatile compound analysis, forensics (drug detection), environmental contaminants, metabolomics of derivatized samples [5] [88] [11] |
| Operational Cost | Higher; requires more specialized training and has more components requiring maintenance [11] | More affordable operation; easier to operate and has fewer maintenance needs [11] |
The publication trends in PubMed from 1995-2023 reveal a steady annual publication rate of approximately 3,042 for GC-MS and 3,908 for LC-MS, indicating a slightly higher contemporary utilization rate for LC-MS (ratio of 1.3:1) [47]. This likely reflects the growing application of LC-MS in the analysis of complex biological molecules. However, both techniques remain fundamental and widely used, often in a complementary fashion.
Experimental Workflows and Protocols
A successful metabolomics study hinges on a robust and well-optimized experimental workflow. The following diagrams and protocols outline the standard procedures for both LC-MS and GC-MS based metabolomics.
Sample Preparation and Metabolite Extraction
Proper sample preparation is critical for generating reliable and reproducible data. The initial steps of sample collection and rapid quenching (e.g., using liquid nitrogen or cold methanol) are universal, as they halt enzymatic activity and preserve the metabolic profile at the moment of sampling [2]. This is followed by metabolite extraction, which aims to comprehensively isolate metabolites while removing proteins and other interfering compounds.
- Liquid-Liquid Extraction (LLE): This is a common and versatile approach. A typical biphasic system uses methanol/chloroform/water [2]. In this system, polar metabolites partition into the methanol/water phase, while non-polar lipids partition into the chloroform phase, allowing for broad coverage [2] [19]. The solvent ratios can be adjusted; for instance, a high methanol-to-chloroform ratio (e.g., 9:1) favors the extraction of highly polar metabolites [2].
- Internal Standards: To control for variability during extraction and analysis, stable isotope-labeled internal standards should be added to the sample at the beginning of the extraction process. These standards correct for analyte loss and ionization efficiency variations, enabling accurate quantification [2].
LC-MS Specific Protocol for Untargeted Metabolomics
For LC-MS, the extracted and reconstituted samples are analyzed directly.
- Chromatographic Separation: Reversed-Phase (RP) Liquid Chromatography with a C18 column is most common, effectively separating non-polar to moderately polar compounds [19]. To capture the highly polar metabolites that are poorly retained by RP, Hydrophilic Interaction Liquid Chromatography (HILIC) is used as an orthogonal method [19] [89]. Advanced dual-column systems that integrate RP and HILIC within a single workflow are emerging to increase metabolite coverage and reduce analytical blind spots [89].
- Mass Spectrometry Analysis: The separated analytes are ionized, typically via Electrospray Ionization (ESI), and introduced into the mass spectrometer. High-resolution mass analyzers like Time-of-Flight (TOF), Orbitrap, or hybrid systems (e.g., Q-TOF, quadrupole-Orbitrap) are preferred for untargeted metabolomics due to their high mass accuracy and resolution, which aids in confident metabolite annotation [5].
- Data Processing: Raw data is processed using software (e.g., MetaboScape, XCMS) for peak picking, alignment, and normalization. For functional interpretation, enrichment analysis methods like Mummichog can be applied directly to untargeted MS data to predict activity in biological pathways without requiring full metabolite identification [90]. Statistical analysis (e.g., PCA, PLS-DA) is then used to identify significant metabolic features.
GC-MS Specific Protocol with Derivatization
The GC-MS workflow requires an additional derivatization step to make metabolites volatile.
- Two-Step Derivatization: A well-established protocol involves:
- Methoximation: The sample is treated with methoxyamine hydrochloride (MeOX) in pyridine to protect carbonyl groups (e.g., in sugars) by converting them to methoximes, reducing the formation of multiple isomeric forms during the next step [88].
- Silylation: This is the primary derivatization step, using a reagent like N-Methyl-N-(trimethylsilyl)trifluoroacetamide (MSTFA). Silylation replaces active hydrogens (e.g., in -OH, -COOH, -NH groups) with a trimethylsilyl group, rendering the metabolites volatile and thermally stable [88].
- GC Separation and MS Analysis: The derivatized samples are injected into a GC system equipped with a non-polar column (e.g., DB-5MS). The column is housed in a temperature-programmed oven, and the separated compounds are ionized by electron ionization (EI) at 70 eV [88]. The major advantage of EI is that it produces reproducible, compound-specific fragmentation patterns. The resulting mass spectra can be searched against extensive standard spectral libraries (e.g., NIST, Fiehn) for metabolite identification [88].
The Scientist's Toolkit: Essential Reagents and Materials
Table 3: Key Research Reagent Solutions for Metabolomics
| Item | Function | Example Use Case |
|---|---|---|
| Methanol/Chloroform | Biphasic solvent system for comprehensive extraction of polar (methanol/water phase) and non-polar (chloroform phase) metabolites [2]. | Standard liquid-liquid extraction from cells or tissues [2]. |
| Stable Isotope-Labeled Internal Standards | (e.g., ¹³C, ²H-labeled metabolites). Correct for losses during sample prep and variations in MS ionization for accurate quantification [2]. | Added at the start of metabolite extraction in both LC-MS and GC-MS workflows [2]. |
| MSTFA with TMCS | Silylation reagent. Derivatizes polar functional groups (-OH, -COOH) for volatility in GC-MS. TMCS acts as a catalyst [88]. | Final step in GC-MS sample preparation, following methoximation [88]. |
| C18 Chromatography Column | Reversed-phase (RP) stationary phase. Separates metabolites based on hydrophobicity; the workhorse column for LC-MS [19]. | Analysis of non-polar to moderately polar metabolites (e.g., lipids, many pharmaceuticals) [19]. |
| HILIC Chromatography Column | Hydrophilic interaction liquid chromatography (HILIC) stationary phase. Retains and separates highly polar metabolites poorly captured by RP [19] [89]. | Analysis of polar metabolites like sugars, amino acids, and organic acids [19]. |
| Quality Control (QC) Pooled Sample | A sample created by mixing small aliquots of all study samples. Used to monitor instrument stability and performance throughout the analytical run [2]. | Injected repeatedly at the beginning and at regular intervals during the sequence in both LC-MS and GC-MS [2]. |
Integrated Decision Framework and Future Perspectives
The choice between LC-MS and GC-MS is not mutually exclusive; they are often complementary. The following decision framework synthesizes the information presented to guide researchers in selecting the most appropriate platform.
The analytical landscape is continuously evolving. Key trends are shaping the future of both platforms. The integration of Artificial Intelligence (AI) and Machine Learning (ML) is revolutionizing data analysis, enabling the uncovering of hidden patterns, predicting disease risks, and identifying novel biomarkers with unprecedented accuracy [91]. To address the challenge of comprehensive metabolite coverage, dual-column chromatography systems that combine orthogonal separation mechanisms (e.g., RP and HILIC) within a single LC-MS workflow are gaining traction, reducing analytical blind spots and improving standardization [89]. Finally, there is a strong push towards workflow standardization and improved quality assurance, as evidenced by initiatives like the Metabolomics Quality Assurance and Quality Control Consortium (mQACC), which aims to enhance data reliability and reproducibility across the field [2].
In conclusion, a one-size-fits-all approach does not exist for selecting between LC-MS and GC-MS. GC-MS remains the gold standard for volatile compounds and applications requiring robust library-based identification, while LC-MS offers unparalleled flexibility for analyzing a wider range of molecules, especially large, polar, and thermally labile metabolites. The most powerful strategy for comprehensive metabolomic profiling, particularly in untargeted studies, often involves leveraging the complementary strengths of both platforms. By applying the structured framework and considering future trends, researchers can make an informed decision that optimally aligns with their specific analytical goals and resources.
Conclusion
LC-MS and GC-MS are not competing but complementary pillars of modern metabolomics. LC-MS is indispensable for analyzing polar, ionic, and thermally labile molecules, offering exceptional sensitivity for a broad range of biomolecules. In contrast, GC-MS, often requiring derivatization, remains the gold standard for volatile compounds and provides superior chromatographic resolution and robust library-based identification. The choice between them hinges on the specific analytes, required sensitivity, and available resources. For a comprehensive view of the metabolome, integrating both platforms is the most powerful strategy, as it dramatically expands metabolite coverage. Future directions point toward increased automation, improved computational tools for data integration, and the development of standardized, optimized workflows, all of which will deepen our understanding of biological systems and accelerate biomarker discovery and therapeutic development.
References
- 1. LC-MS VS GC-MS: What's the Difference [https://www.metwarebio.com/lc-ms-vs-gc-ms-whats-the-difference/]
- 2. Mass-spectrometry based metabolomics: an overview of ... [https://proteomesci.biomedcentral.com/articles/10.1186/s12953-025-00241-8]
- 3. The Difference Between GC/MS and LC/MS Systems [https://conquerscientific.com/the-difference-between-gc-ms-and-lc-ms-systems/]
- 4. Metabolomics by Gas Chromatography-Mass Spectrometry [https://pmc.ncbi.nlm.nih.gov/articles/PMC4829120/]
- 5. Recent Advances in Liquid Chromatography–Mass ... [https://pmc.ncbi.nlm.nih.gov/articles/PMC12204688/]
- 6. Comparison of LC–MS and GC–MS for the Analysis ... [https://www.chromatographyonline.com/view/comparison-lc-ms-and-gc-ms-analysis-pharmaceuticals-and-personal-care-products-surface-water-and-t-0]
- 7. Comparison of GC-MS/MS and LC-MS/MS for the analysis ... [https://pubs.rsc.org/en/content/articlelanding/2019/ay/c8ay02774a]
- 8. Best practices and tools in R and Python for statistical ... [https://www.nature.com/articles/s41467-025-63751-1]
- 9. Effective data visualization strategies in untargeted ... [https://pubs.rsc.org/en/content/articlehtml/2025/np/d4np00039k]
- 10. Effective data visualization strategies in untargeted ... [https://pubmed.ncbi.nlm.nih.gov/39620439/]
- 11. The Difference Between GC/MS and LC/MS Systems [https://gentechscientific.com/the-difference-between-gc-ms-and-lc-ms-systems/]
- 12. LCMS vs. GCMS: When to Choose Each for Optimal ... [https://emerypharma.com/blog/lcms-vs-gcms-when-to-choose-each-for-optimal-results-in-your-analytical-chemistry/]
- 13. Do experimental projection methods outcompete retention ... [https://pubs.rsc.org/en/content/articlehtml/2025/an/d5an00323g]
- 14. GC/MS and LC/MS serum metabolomic analysis of ... [https://www.nature.com/articles/s41598-024-52137-w]
- 15. MassCube improves accuracy for metabolomics data ... [https://www.nature.com/articles/s41467-025-60640-5]
- 16. Correction of gas chromatography–mass spectrometry long ... [https://www.nature.com/articles/s41598-025-24794-y]
- 17. Principles and Differences between GC-MS and LC-MS [https://metabolomics.creative-proteomics.com/resource/principles-and-differences-between-gc-ms-and-lc-ms.htm]
- 18. GC-MS vs LC-MS: How to Choose for Metabolomics ... [https://www.arome-science.com/metabolomics/gc-ms-vs-lc-ms-how-to-choose-for-metabolomics-research/]
- 19. Mass spectrometry-based metabolomic as a powerful tool to ... [https://pmc.ncbi.nlm.nih.gov/articles/PMC12067679/]
- 20. Comparison of LC–MS-MS and GC–MS Analysis ... [https://pmc.ncbi.nlm.nih.gov/articles/PMC4885916/]
- 21. and developmental stage- specific metabolites in qingke [https://www.sciencedirect.com/science/article/abs/pii/S0168945225002584]
- 22. Performance evaluation of three liquid chromatography ... [https://www.sciencedirect.com/science/article/abs/pii/S0009898110003797]
- 23. Comparison of GC/MS and LC/MS methods for the analysis ... [https://www.sciencedirect.com/science/article/pii/S1570023212002838]
- 24. Electron Ionization in GC-MS: The Gold Standard for ... [https://www.metwarebio.com/electron-ionization-gc-ms-volatile-compound-analysis/]
- 25. Please explain the principles, advantages, and [https://www.shimadzu.com/an/service-support/technical-support/gas-chromatograph-mass-spectrometry/faq/ei/index.html]
- 26. Efficiency of ESI and APCI ionization sources in LC-MS ... [https://www.sciencedirect.com/science/article/abs/pii/S0308814619310295]
- 27. Atmospheric pressure chemical ionisation mass ... [https://pmc.ncbi.nlm.nih.gov/articles/PMC8054169/]
- 28. Comparison of EI-GC-MS/MS, APCI-LC-MS/MS, and ESI ... [https://pubmed.ncbi.nlm.nih.gov/34678926/]
- 29. LC-MS-based metabolomics - PMC [https://pmc.ncbi.nlm.nih.gov/articles/PMC3699692/]
- 30. Metabolomics Quality Control, Reproducibility & Validation [https://www.arome-science.com/metabolomics-faqs/metabolomics-quality-control-reproducibility-method-validation-guide/]
- 31. Development and Validation of Targeted Metabolomics ... [https://www.mdpi.com/1420-3049/30/3/706]
- 32. Metabolite identification and quantitation in LC-MS ... [https://pmc.ncbi.nlm.nih.gov/articles/PMC3278153/]
- 33. Comparison of LC–MS and GC–MS for the Analysis ... [https://www.spectroscopyonline.com/view/comparison-lc-ms-and-gc-ms-analysis-pharmaceuticals-and-personal-care-products-surface-water-and-tre]
- 34. Rapid and reproducible LC-HRMS for combined lipidomics ... [https://www.sciencedirect.com/science/article/pii/S0026265X25032254]
- 35. From Complexity to Clarity: Expanding Metabolome Coverage ... [https://pmc.ncbi.nlm.nih.gov/articles/PMC11836935/]
- 36. Enhancing metabolite coverage using dedicated mobile ... [https://link.springer.com/article/10.1007/s00216-025-06189-0]
- 37. Metabolomics and Pharmacometabolomics [https://www.mdpi.com/2218-1989/15/11/750]
- 38. Gas Chromatography-Mass Spectrometry (GC-MS) ... [https://www.news-medical.net/life-sciences/Gas-Chromatography-Mass-Spectrometry-(GC-MS)-Applications.aspx]
- 39. Gas Chromatography Mass Spectrometry (GC-MS) ... [https://www.thermofisher.com/us/en/home/industrial/mass-spectrometry/mass-spectrometry-learning-center/gas-chromatography-mass-spectrometry-gc-ms-information.html]
- 40. Optimization of GC-MS run time for untargeted metabolomics [https://www.sciencedirect.com/science/article/abs/pii/S0731708525004091]
- 41. Comparison of GC-MS and LC-MS methods for the ... [https://pubmed.ncbi.nlm.nih.gov/17468851/]
- 42. An Easy-To-Understand Guide To GCMS Testing ... [https://www.newdirectionsaromatics.com/blog/an-easy-to-understand-guide-to-gcms-testing/]
- 43. The Highs and Lows of GC-MS in Essential Oil Analysis [https://tisserandinstitute.org/highs-lows-gc-ms-essential-oil-analysis/]
- 44. Targeted analysis of organic acids with GC-MS/MS [https://www.sciencedirect.com/science/article/pii/S0003269724001647]
- 45. Integration of GC–MS and LC–MS for untargeted ... [https://www.sciencedirect.com/science/article/abs/pii/S0731708520313959]
- 46. Integration of GC-MS and LC-MS for untargeted ... [https://pubmed.ncbi.nlm.nih.gov/32814263/]
- 47. Perspectives of Quantitative GC-MS, LC-MS, and ICP-MS in ... [https://pmc.ncbi.nlm.nih.gov/articles/PMC11641993/]
- 48. Comparison of GC-MS and GC×GC-MS in the Analysis ... [https://pmc.ncbi.nlm.nih.gov/articles/PMC4849136/]
- 49. Integrated LC–MS and GC–MS-based untargeted ... [https://www.nature.com/articles/s41598-020-58796-9]
- 50. A Cross-Platform Metabolomics Comparison Identifies ... [https://pmc.ncbi.nlm.nih.gov/articles/PMC8370474/]
- 51. 8 Essential Characteristics of LC-MS/MS Method Validation [https://www.resolian.com/bioanalytics/8-essential-characteristics-of-lc-ms-ms-method-validation/]
- 52. A suggested standard for validation of LC-MS/MS based ... [https://pmc.ncbi.nlm.nih.gov/articles/PMC8600988/]
- 53. Metabolite Measurement: Pitfalls to Avoid and Practices to ... [https://pmc.ncbi.nlm.nih.gov/articles/PMC5734093/]
- 54. - LC Orbitrap-based metabolomics using a novel hybrid zwitterionic... MS [https://pubs.rsc.org/en/content/articlehtml/2025/ra/d5ra01044f]
- 55. Systematic Comparison of Reverse Phase and Hydrophilic ... [https://pmc.ncbi.nlm.nih.gov/articles/PMC3689152/]
- 56. Global LC - MS /MS targeted metabolomics using a combination of HILIC ... [https://pubmed.ncbi.nlm.nih.gov/37708770/]
- 57. LC-MS/MS-based simultaneous quantification of ... [https://pubmed.ncbi.nlm.nih.gov/41015203/]
- 58. A detailed evaluation of the advantages and limitations ... [https://www.sciencedirect.com/science/article/abs/pii/S0021967323000717]
- 59. HPLC 2025 Preview: Boosting the Separation Power of LC ... [https://www.chromatographyonline.com/view/boosting-the-separation-power-of-lc-lc]
- 60. Trends Shaping the Gas Chromatography Industry, 2025- ... [https://www.businesswire.com/news/home/20250421690152/en/Trends-Shaping-the-Gas-Chromatography-Industry-2025-2035-Portable-and-Miniaturized-GC-Systems---ResearchAndMarkets.com]
- 61. Temperature Programming for Better GC Results [https://www.phenomenex.com/knowledge-center/gc-knowledge-center/what-is-temperature-programming-in-gc?srsltid=AfmBOoqDhy9tV085cihXpHIl9UTWUdjNgUNXkdAqe8WclbhUdiuodX9T]
- 62. Data on the optimization of a GC–MS procedure for ... [https://pmc.ncbi.nlm.nih.gov/articles/PMC4969248/]
- 63. GC Temperature Program Development [https://www.elementlabsolutions.com/uk/chromatography-blog/post/gc-temperature-program-development]
- 64. Optimization of large volume injection-programmable ... [https://www.sciencedirect.com/science/article/pii/S0021967310014937]
- 65. The Importance of Quality Control and Calibration in LC-MS ... [https://utak.com/blog/the-importance-of-quality-control-and-calibration-in-lc-ms-gc-ms-analysis/]
- 66. What are the Best Practices of LC-MS/MS Internal ... [https://www.nebiolab.com/what-are-the-best-practices-of-lc-ms-internal-standards/]
- 67. When Should an Internal Standard be Used? [https://www.chromatographyonline.com/view/when-should-internal-standard-be-used-0]
- 68. Internal Standards in LC−MS Bioanalysis [https://dmpkservice.wuxiapptec.com/articles/404-internal-standards-in-lc-ms-bioanalysis-which-when-and-how/]
- 69. LC-MS and GC-MS Data Fusion Metabolomics Profiling ... [https://pmc.ncbi.nlm.nih.gov/articles/PMC10045819/]
- 70. Metabolomics in drug research and development: The recent ... [https://pmc.ncbi.nlm.nih.gov/articles/PMC10465962/]
- 71. DoE-assisted HPLC method development and validation of ... [https://pmc.ncbi.nlm.nih.gov/articles/PMC11486095/]
- 72. Comparison of LC/MS and GC/MS Techniques [https://www.shimadzu.com/an/service-support/technical-support/analysis-basics/fundamental/comparison_of_lcms.html]
- 73. LC-MS vs. GC-MS: Understanding the Key Differences and Uses [https://www.hplcvials.com/faq/lc-ms-vs-gc-ms-understanding-the-key-differences-and-uses.html]
- 74. GC-MS Metabolomics Analysis | Thermo Fisher Scientific - US [https://www.thermofisher.com/us/en/home/industrial/mass-spectrometry/mass-spectrometry-learning-center/mass-spectrometry-applications-area/metabolomics-mass-spectrometry/practical-guide-metabolomics/gc-ms-metabolomics-analysis.html]
- 75. Identification of Metabolites from LC-EC Profiling: GC-MS and Re-Fractionation Provide Essential Information Orthogonal to LCMS/microNMR - PMC [https://pmc.ncbi.nlm.nih.gov/articles/PMC4034759/]
- 76. Targeted Metabolomics - Techniques, Advantages, and LC ... [https://www.creative-proteomics.com/resource/targeted-metabolomics-techniques-advantages-lc-ms.htm]
- 77. Extending the breadth of metabolite profiling by gas ... [https://pmc.ncbi.nlm.nih.gov/articles/PMC2394193/]
- 78. Advances in high throughput LC/MS based metabolomics [https://www.sciencedirect.com/science/article/pii/S0165993623000419]
- 79. A universal language for finding mass spectrometry data ... [https://www.nature.com/articles/s41592-025-02660-z]
- 80. Liquid chromatography–mass spectrometry [https://en.wikipedia.org/wiki/Liquid_chromatography%E2%80%93mass_spectrometry]
- 81. Types of Chemical Isomers and Recommended HPLC ... [https://www.mtc-usa.com/kb-article/aa-02316]
- 82. High-performance liquid chromatograph with mass ... [https://www.mpi-bremen.de/en/HPLCMS.html]
- 83. Tips for Optimizing Key Parameters in LC–MS [https://www.chromatographyonline.com/view/tips-optimizing-key-parameters-lc-ms]
- 84. Mass Spectrometer Costs: How Much Should You Budget? [https://www.excedr.com/blog/mass-spectrometer-pricing-guide]
- 85. Cost of GC-MS Analysis: In-House vs. Outsourced Testing [https://resolvemass.ca/cost-of-gc-ms-analysis/]
- 86. Rate Schedule Liquid Chromatography/Mass Spectrometry ... [https://www.esf.edu/ats/lcms-rates.php]
- 87. Rates | Harvard Center for Mass Spectrometry [https://massspec.fas.harvard.edu/pages/rates]
- 88. Analytical workflow for comprehensive blood metabolomics ... [https://www.sciencedirect.com/science/article/abs/pii/S0021967325002729]
- 89. Advances in Dual-Column Chromatography for ... [https://www.sciencedirect.com/science/article/pii/S2772391725000647]
- 90. Comparison of popular enrichment methods for untargeted ... [https://pubmed.ncbi.nlm.nih.gov/40715905/]
- 91. Metabolomics Market Value Analysis | Forecast 2025-2030 [https://www.nextmsc.com/report/metabolomics-market-3458]