Mastering HPLC Impurity Profiling in Pharmaceuticals: A Comprehensive Guide from Method Development to Regulatory Validation
This article provides a definitive guide to High-Performance Liquid Chromatography (HPLC) method development for impurity profiling in drug substances and products.
Mastering HPLC Impurity Profiling in Pharmaceuticals: A Comprehensive Guide from Method Development to Regulatory Validation
Abstract
This article provides a definitive guide to High-Performance Liquid Chromatography (HPLC) method development for impurity profiling in drug substances and products. Tailored for researchers, scientists, and drug development professionals, it covers the foundational principles of impurity classification and regulatory requirements (ICH Q3). It details systematic methodologies for method development, including column selection, mobile phase optimization, and detector choice. The guide addresses critical troubleshooting scenarios, peak anomalies, and system suitability challenges, alongside strategies for robustness testing and method optimization. Finally, it outlines the rigorous validation process per ICH Q2(R1) guidelines and compares HPLC with complementary techniques like LC-MS and UPLC. This comprehensive resource equips practitioners with the knowledge to establish reliable, compliant, and scientifically sound impurity control strategies essential for drug safety and quality.
The Essential Guide to Pharmaceutical Impurities and HPLC Fundamentals
Impurity profiling is a critical analytical activity in pharmaceutical development and quality control, mandated by global regulatory bodies including the FDA and ICH. It involves the identification, quantification, and characterization of organic and inorganic impurities, as well as residual solvents, present in Active Pharmaceutical Ingredients (APIs) and finished drug products. These impurities can arise from starting materials, by-products, degradation products, or interactions with packaging and storage conditions. Effective control is essential as impurities may impact drug safety (e.g., genotoxicity), efficacy, and stability.
Regulatory guidelines, primarily ICH Q3A(R2), Q3B(R2), and Q3C, establish thresholds for identification, qualification, and reporting of impurities. The control strategy is based on a thorough understanding gained through systematic profiling.
Key Quantitative Thresholds and Classifications
The following tables summarize key ICH thresholds and common impurity classifications.
Table 1: ICH Reporting, Identification, and Qualification Thresholds for Drug Substances (ICH Q3A(R2))
| Maximum Daily Dose | Reporting Threshold | Identification Threshold | Qualification Threshold |
|---|---|---|---|
| ≤ 2 g/day | 0.05% | 0.10% or 1.0 mg/day | 0.15% or 1.0 mg/day |
| > 2 g/day | 0.03% | 0.05% | 0.05% |
Table 2: ICH Classification of Common Impurities
| Impurity Type | Origin/Source | Typical Control Strategy |
|---|---|---|
| Organic Impurities | Starting materials, intermediates, by-products, degradation products | HPLC/LC-MS profiling, reference standards, fate studies |
| Inorganic Impurities | Reagents, ligands, catalysts, heavy metals | ICP-MS, ion chromatography, pharmacopoeial tests |
| Residual Solvents | Process solvents (Class 1, 2, or 3 per ICH Q3C) | GC-MS, GC-FID |
| Genotoxic Impurities | Structurally alerting compounds (e.g., alkyl halides, aryl amines) | Specific LC-MS/MS methods, SCT thresholds (e.g., 1.5 µg/day) |
Application Note: A Systematic HPLC-DAD/HRMS Workflow for Impurity Profiling
Objective
To establish a systematic, stability-indicating HPLC method coupled with Diode Array Detection (DAD) and High-Resolution Mass Spectrometry (HRMS) for the separation, detection, identification, and semi-quantification of impurities in a model API.
Research Reagent Solutions & Essential Materials
Table 3: Key Research Reagent Solutions for HPLC Impurity Profiling
| Item / Reagent | Function / Explanation |
|---|---|
| High-Purity Reference Standards (API, known impurities, forced degradation products) | Essential for method validation, peak identification, and quantification. Confirms chromatographic retention and spectroscopic properties. |
| LC-MS Grade Solvents (Acetonitrile, Methanol, Water) | Minimizes baseline noise and system artifacts in UV and MS detection. Critical for reproducible retention times and sensitivity in HRMS. |
| Volatile Buffers & Additives (Ammonium formate, Ammonium acetate, Formic acid) | Provides consistent pH control for separation. Volatile additives are compatible with MS detection, preventing source contamination. |
| Stressed Sample Solutions (Acid/Base, Oxidative, Thermal, Photolytic) | Generated via forced degradation studies to reveal potential degradation products and validate method stability-indicating capability. |
| Solid Phase Extraction (SPE) Cartridges (C18, Mixed-Mode) | For sample clean-up or impurity enrichment from complex matrices (e.g., formulations), improving detection of low-level impurities. |
| QDa or HRMS Mass Detector Calibration Solution (e.g., Sodium formate) | Ensures accurate mass measurement (< 5 ppm error) for elemental composition determination of unknown impurities. |
| System Suitability Test (SST) Mixture | A blend of API and key impurities to verify resolution, peak symmetry, and reproducibility before analytical runs. |
Detailed Experimental Protocol
Protocol: Forced Degradation and Impurity Profile Analysis via HPLC-DAD-HRMS
I. Sample Preparation
- Stock Solutions: Prepare a 1 mg/mL solution of the API in a suitable diluent (e.g., water:acetonitrile 50:50).
- Forced Degradation:
- Acidic Hydrolysis: Mix 1 mL API stock with 1 mL of 0.1M HCl. Heat at 60°C for 1-8 hours. Neutralize with 0.1M NaOH.
- Basic Hydrolysis: Mix 1 mL API stock with 1 mL of 0.1M NaOH. Heat at 60°C for 1-8 hours. Neutralize with 0.1M HCl.
- Oxidative Stress: Mix 1 mL API stock with 1 mL of 3% H₂O₂. Keep at room temperature for 1-24 hours.
- Thermal Stress: Expose solid API to 70°C in a dry oven for 1-7 days. Then prepare solution.
- Photolytic Stress: Expose solid API and solution to controlled UV (e.g., ICH Option 2) and visible light for 1-7 days.
- Control Sample: Prepare an unstressed API solution in diluent.
II. Instrumentation and Chromatographic Conditions
- HPLC System: UHPLC system with quaternary pump, autosampler (set to 10°C), and column oven.
- Detectors: DAD (scanning 200-400 nm) coupled in-line to a Q-TOF or Orbitrap HRMS system.
- Column: C18, 100 x 2.1 mm, 1.7 µm particle size.
- Mobile Phase A: 10 mM Ammonium formate in water, pH 3.0 (adjusted with formic acid).
- Mobile Phase B: 10 mM Ammonium formate in acetonitrile:water (95:5).
- Gradient: 5% B to 95% B over 25 min, hold 2 min, re-equilibrate.
- Flow Rate: 0.4 mL/min.
- Temperature: 35°C.
- Injection Volume: 5 µL.
- MS Conditions: ESI source in positive/negative switching mode. Mass range: 100-1000 m/z. Accurate mass calibration performed daily.
III. Data Acquisition and Analysis Workflow
- Perform system suitability test (SST) to ensure resolution (R > 2.0 between critical pair), tailing factor (< 2.0), and %RSD of retention time (< 2.0%).
- Inject control and stressed samples in randomized sequence.
- Process DAD data: Compare chromatograms of stressed vs. control samples. Flag any new peaks exceeding the reporting threshold (e.g., 0.05%).
- Process HRMS data: For each flagged peak, extract accurate mass and isotope pattern. Generate potential molecular formulas.
- Use MS/MS fragmentation (if available) to propose structural elucidation.
- Perform semi-quantification using the API as external standard (assuming similar response factors) or using a closely related reference standard.
Visualization of Workflows and Relationships
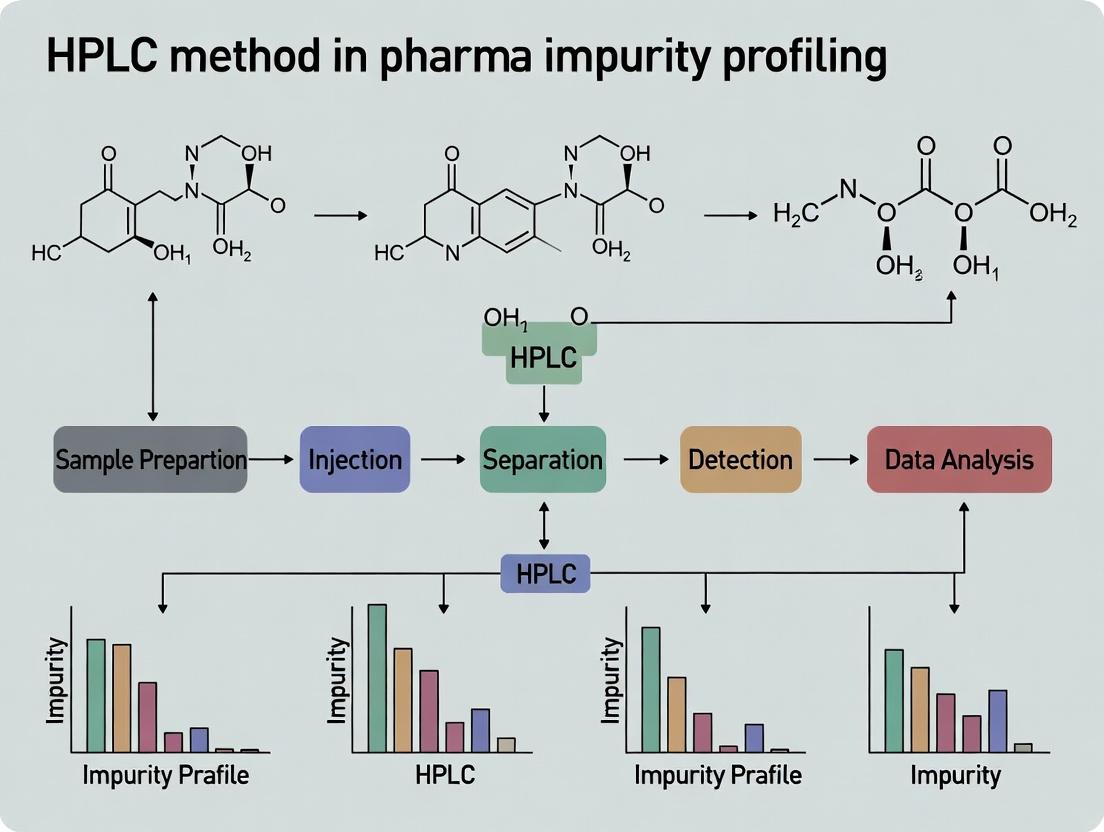
Diagram 1: Systematic Impurity Profiling Workflow
Diagram 2: HPLC Method Development Critical Factors
A robust, stability-indicating HPLC method, enhanced by HRMS detection, forms the cornerstone of modern impurity profiling. This systematic approach, aligned with ICH guidelines, enables pharmaceutical scientists to identify and quantify impurities at trace levels. The generated data directly informs risk assessment, process optimization, and the establishment of scientifically justified specifications, ultimately safeguarding patient safety and ensuring drug efficacy throughout the product lifecycle. Continuous advancement in chromatographic and spectrometric techniques will further elevate the capability to characterize impurities with greater speed and certainty.
Within pharmaceutical research focused on developing robust High-Performance Liquid Chromatography (HPLC) methods for impurity profiling, the ICH Q3A(R2), Q3B(R2), and Q3D guidelines form the definitive regulatory triad. These documents translate scientific analysis into regulatory compliance. A thesis exploring novel stationary phases or detection strategies for impurity separation must ultimately validate its methodology against the thresholds, identification requirements, and toxicological principles mandated by these guidelines. They provide the "what" (limits), the "when" (reporting, identification, qualification), and the "why" (risk-based assessment) that direct experimental design.
Guideline Synopsis and Quantitative Data Tables
Table 1: Core Scope and Limits of ICH Q3A(R2) and Q3B(R2)
| Guideline | Scope | Reporting Threshold | Identification Threshold | Qualification Threshold |
|---|---|---|---|---|
| ICH Q3A(R2)Impurities in New Drug Substances | Chemical impurities arising from synthesis, degradation, or extraction. Excludes process solvents. | ≥ 0.05% | 0.10% or 1.0 mg/day intake (whichever is lower) | 0.15% or 1.0 mg/day intake (whichever is lower) |
| ICH Q3B(R2)Impurities in New Drug Products | Degradation products & reaction impurities in formulated product. Excludes degradation products of excipients. | ≥ 0.05% | 0.10% or 1 mg/day intake (whichever is lower) | 0.15% or 1 mg/day intake (whichever is lower) |
Table 2: ICH Q3D Elemental Impurity Classification and PDE Limits (Oral Drug, μg/day)
| Class | Risk Basis | Elements | PDE (μg/day) | Typical HPLC-Relevant Concern |
|---|---|---|---|---|
| 1 | Human toxicants, significant likelihood of occurrence | Cd, Pb, As, Hg, Co | Cd: 2, Pb: 5, As: 15, Hg: 3, Co: 50 | Potential leaching from equipment/catalysts. |
| 2A | Route-dependent toxicity, likely in drug components | V, Ag, Au, Pd, Ir, Os, Rh, Ru, Se, Tl | V: 100, Ag: 150, Pd: 100, Se: 150 | Leaching from catalysts (Pd, Ir, Ru). |
| 2B | Route-dependent toxicity, low likelihood | Tl, Au, Li, Sb, Ba, Mo, Cu, Sn, Ni, Pt | Tl: 8, Ni: 200, Cu: 3000 | Minimal risk from HPLC method itself. |
| 3 | Relatively low toxicity | Al, B, Ca, Fe, K, Mg, Mn, Na, W, Zn | 1000 - 1300000 (e.g., Fe: 1300) | Generally not a concern for impurities. |
Application Notes for HPLC Method Development
Note 1: Threshold-Driven Method Sensitivity and Validation The reporting thresholds (typically 0.05%) dictate the required sensitivity (Limit of Quantitation, LOQ) of the HPLC method. For a 100 mg/day drug, the LOQ must reliably detect impurities at 0.05% (50 μg absolute). Method validation must demonstrate specificity, accuracy, and precision at the reporting threshold level.
Note 2: Forced Degradation Studies and Peak Purity Forced degradation (acid/base, oxidative, thermal, photolytic) is performed to validate the stability-indicating power of the HPLC method. It must demonstrate resolution between degradation products and the active ingredient. Peak purity assessment using diode array or mass spectrometric detectors is critical to prove that impurity peaks are unimodal, directly supporting Q3A(R2)/Q3B(R2) identification requirements.
Note 3: Identification Protocol for Unknown Impurities When an impurity exceeds the identification threshold, a protocol must be initiated:
- Enrichment: Scale up the synthesis or degradation to isolate the impurity.
- Hyphenated Analysis: Employ LC-MS (Liquid Chromatography-Mass Spectrometry) for preliminary structural elucidation (molecular weight, fragmentation pattern).
- Definitive Identification: Isolate the impurity via preparative HPLC and conduct nuclear magnetic resonance (NMR) spectroscopy for conclusive structural confirmation.
- Toxicological Assessment: If the impurity exceeds the qualification threshold, a literature search or (Q)SAR assessment is required. If no data exists, a dedicated safety study may be necessary.
Note 4: Q3D Considerations for HPLC Hardware Elemental impurities from Class 1 and 2A are a concern for HPLC systems used in analysis of drug substances/products. Protocols should consider:
- System Suitability for Metal-Sensitive Compounds: For drugs that chelate metals (e.g., certain antibiotics), passivation of the HPLC system (stainless steel to PEEK tubing) or inclusion of a chelating agent in the mobile phase may be required to prevent adsorption and false impurity peaks.
- Leachables from System Components: In ultra-trace analysis, metal ions can leach from pump seals, valve rotors, or column hardware. Biocompatible or metal-free HPLC systems are recommended for Q3D risk mitigation studies.
Experimental Protocols
Protocol 1: HPLC Method Validation for Impurity Quantitation per Q3A(R2)/Q3B(R2) Objective: To validate an HPLC method for the accurate and precise quantitation of specified and unspecified impurities down to the reporting threshold. Materials: Drug substance/product, impurity reference standards, HPLC system with DAD/UV, qualified column, analytical balance, calibrated pipettes. Procedure:
- Specificity/Forced Degradation: Inject separately: blank (mobile phase), placebo (if any), drug sample, stressed samples (e.g., 0.1N HCl, 0.1N NaOH, 3% H₂O₂, heat, light). Confirm baseline separation of all degradation peaks from the main peak and from each other (resolution > 2.0). Apply peak purity tool.
- Linearity: Prepare impurity stock solutions and dilute to at least 5 concentrations from LOQ to 150% of specification limit (e.g., 0.05% to 0.225%). Inject in triplicate. Plot peak area vs. concentration. Calculate correlation coefficient (R² > 0.998) and y-intercept.
- Accuracy (Recovery): Spike placebo or drug matrix with impurities at 50%, 100%, and 150% of specification level (n=3 each). Inject and compare measured amount to added amount. Average recovery should be 95-105%.
- Precision:
- Repeatability: Inject 6 replicates of drug spiked with impurities at 100% specification. Calculate %RSD for each impurity (< 10%).
- Intermediate Precision: Different analyst, different day, different instrument. Repeat repeatability study. Compare results.
- LOQ/LOD: Serial dilute impurity solution until signal-to-noise (S/N) is 10:1 for LOQ and 3:1 for LOD.
Protocol 2: Risk Assessment for Elemental Impurities per ICH Q3D Objective: To assess the potential for elemental impurity (EI) contribution from the synthetic route and HPLC analytical process. Materials: Inductively Coupled Plasma-Mass Spectrometry (ICP-MS), nitric acid (trace metal grade), controlled environment. Procedure:
- Component Inventory: List all reagents, catalysts, solvents, and excipients used in the final synthetic step(s) and drug product formulation.
- Theoretical Risk Assessment: Cross-reference inventory against ICH Q3D Tables A.1 and A.2. Assign potential Class 1/2A/2B elements.
- Experimental Screening (Option 1 - Direct Analysis): Digest representative batches of drug substance (API) and drug product using microwave-assisted digestion with nitric acid. Analyze via ICP-MS against standard solutions. Quantify all Q3D elements.
- Experimental Screening (Option 2 - Leachables): For HPLC method risk, recirculate mobile phase through the entire HPLC flow path (pump, injector, column, detector) for 24-48 hours. Collect eluent and analyze via ICP-MS for metal leachables (e.g., Fe, Cr, Ni from stainless steel; Pd from old catalyst residues).
- Summation and Comparison: Sum the measured or theoretically calculated daily intake of each element from all components. Compare to the Permitted Daily Exposure (PDE). If below 30% of PDE for all routes, the risk is controlled.
Visualizations
Impurity Assessment Decision Tree
ICH Q3D Elemental Impurity Risk Flow
The Scientist's Toolkit: Research Reagent Solutions
Table 3: Essential Materials for HPLC Impurity Profiling Aligned with ICH
| Item | Function & ICH Relevance |
|---|---|
| Pharmaceutical Grade Reference Standards | Certified impurities for peak identification, method validation, and accurate quantitation against thresholds (Q3A/B). |
| High-Purity HPLC Solvents (LC-MS Grade) | Minimize baseline noise and ghost peaks that could be misidentified as impurities, ensuring accurate reporting. |
| Validated HPLC Column (e.g., C18, phenyl) | Provides reproducible selectivity and resolution critical for separating complex impurity/degradant mixtures. |
| Diode Array Detector (DAD) / Mass Spectrometer (MS) | DAD enables peak purity analysis. MS is essential for structural elucidation of unidentified impurities exceeding ICH thresholds. |
| ICP-MS System & Trace Metal Grade Acids | The gold-standard for quantitative elemental impurity analysis as required by ICH Q3D risk assessment. |
| Forced Degradation Reagents (e.g., HCl, NaOH, H₂O₂) | Used in stress studies to validate the stability-indicating capability of the HPLC method (Q3A/B). |
| Passivated (PEEK) or Biocompatible HPLC System | Reduces risk of metal leaching and adsorption for metal-sensitive APIs, supporting Q3D compliance. |
Within a broader thesis on HPLC method development for impurity profiling in pharmaceuticals, the systematic classification and control of impurities is paramount. Impurities, undesired chemical entities present in active pharmaceutical ingredients (APIs) and drug products, are categorized based on their origin and chemical nature. This classification dictates the analytical strategy, risk assessment, and regulatory control strategy. The four primary classes are Organic Impurities, Inorganic Impurities, Residual Solvents, and Genotoxic Impurities (GTIs), each with distinct sources, analytical challenges, and control thresholds as per ICH Q3A(R2), Q3B(R2), Q3C(R8), and ICH M7(R2) guidelines.
Classification and Control Thresholds
Table 1: Classification, Sources, and Typical Control Thresholds for Pharmaceutical Impurities
| Impurity Class | Primary Sources | Typical Analytical Techniques | Key Regulatory Guidelines | Common Thresholds for Identification/Qualification (API) |
|---|---|---|---|---|
| Organic Impurities | Starting materials, by-products, intermediates, degradation products, reagents, ligands, catalysts. | HPLC-UV/PDA, LC-MS, GC-MS. | ICH Q3A(R2), Q3B(R2) | >0.10% (Identification), >0.15% (Qualification) |
| Inorganic Impurities | Reagents, ligands, catalysts, heavy metals, inorganic salts, filter aids, charcoal. | ICP-MS, ICP-OES, Ion Chromatography, Pharmacopoeial tests (e.g., sulfated ash, heavy metals). | ICH Q3A(R2), Q3D | Varies by element (e.g., Pb: ≤5 ppm, Pd: ≤10-100 ppm) |
| Residual Solvents | Synthesis, purification, or excipient manufacturing processes. | GC-FID, GC-MS, Headspace GC. | ICH Q3C(R8) | Class 1: Avoid (e.g., Benzene: 2 ppm). Class 2: Limit (e.g., Methanol: 3000 ppm). Class 3: Low risk (e.g., Ethanol: 5000 ppm). |
| Genotoxic Impurities | Reactive reagents, intermediates, by-products, degradation products with structural alerts. | LC-MS/MS, GC-MS/MS (high sensitivity). | ICH M7(R2) | Threshold of Toxicological Concern (TTC): 1.5 µg/day intake (default for lifetime exposure). |
Application Notes & Detailed Protocols
HPLC Method for Organic and Genotoxic Impurity Profiling
Application Note: A gradient reversed-phase HPLC method with photodiode array (PDA) and mass spectrometric (MS) detection forms the cornerstone of impurity profiling for organic and genotoxic impurities. Method development must achieve separation of all known and unknown impurities from the API peak. For GTIs, trace-level quantification demands high sensitivity LC-MS/MS.
Protocol: Forced Degradation Study for Organic Impurity Method Validation
- Objective: To demonstrate the stability-indicating capability of the HPLC method and identify potential degradation products.
- Materials: API, 0.1M HCl, 0.1M NaOH, 3% H₂O₂, solid for thermal stress, photostability chamber.
- Procedure:
- Prepare separate solutions of the API (~1 mg/mL) in the following stress conditions:
- Acidic Hydrolysis: Treat with 0.1M HCl at 60°C for 1-8 hours. Neutralize.
- Basic Hydrolysis: Treat with 0.1M NaOH at 60°C for 1-8 hours. Neutralize.
- Oxidation: Treat with 3% H₂O₂ at room temperature for 24 hours.
- Thermal: Expose solid API to 70°C for 1-2 weeks.
- Photolytic: Expose solid API to 1.2 million lux hours of visible and 200 watt-hours/m² of UV light.
- Analyze stressed samples and unstressed controls using the developed HPLC-PDA method (e.g., C18 column, gradient of 10mM ammonium formate and acetonitrile, 220-280 nm detection).
- Monitor for new peaks, changes in the API peak area, and peak purity index via PDA.
- Perform LC-MS on degraded samples to tentatively identify degradation products.
- Prepare separate solutions of the API (~1 mg/mL) in the following stress conditions:
Protocol for Residual Solvent Analysis by Headspace GC
Application Note: Static headspace gas chromatography (HS-GC) is optimal for volatile residual solvents. Method development involves optimizing headspace equilibration temperature/time, matrix modification (e.g., water or DMF as diluent), and GC column selection.
Protocol: HS-GC Method for Class 1 and 2 Solvents
- Objective: Quantify residual solvents per ICH Q3C in a drug substance.
- Materials: API, N,N-Dimethylformamide (DMF, high purity), mixed standard solutions of target solvents (e.g., benzene, toluene, methanol, acetone).
- Procedure:
- Sample Prep: Weigh 100 mg of API into a 20 mL headspace vial. Add 5 mL of DMF, seal immediately with a crimp cap.
- Standard Prep: Prepare a standard mixture in DMF at concentrations corresponding to the ICH limits (e.g., benzene at 2 ppm relative to API).
- HS Conditions: Equilibration at 100°C for 30 minutes. Injection loop/transfer line at 110°C.
- GC Conditions: Use a DB-624 or equivalent column (6% cyanopropylphenyl, 94% dimethylpolysiloxane), 30 m x 0.53 mm, 3.0 µm. Oven program: 40°C hold 10 min, ramp 10°C/min to 200°C. Carrier gas: Helium. Detection: FID at 250°C.
- Analysis: Inject headspace gas from standards and samples. Quantify using an external standard calibration curve.
Protocol for Trace Metal Analysis by ICP-MS
Application Note: Inductively Coupled Plasma Mass Spectrometry (ICP-MS) is used for ultra-trace multi-element analysis of inorganic impurities, including elemental catalysts (Pd, Pt, etc.) and heavy metals per ICH Q3D.
Protocol: Quantification of Palladium Catalyst Residue
- Objective: Determine Pd content in an API at the 10 ppm specification level.
- Materials: API, concentrated nitric acid (trace metal grade), internal standard solution (e.g., Rhodium at 10 ppb), Pd calibration standards (1, 5, 10, 20, 50 ppb).
- Procedure:
- Microwave Digestion: Accurately weigh ~50 mg of API into a digestion vessel. Add 3 mL concentrated HNO₃. Digest using a stepped microwave program (e.g., ramp to 180°C over 10 min, hold for 15 min). Cool, transfer, and dilute to 50 mL with ultrapure water (final dilution factor ~1000x).
- Standard Preparation: Prepare calibration standards in 2% HNO₃ matrix. Add internal standard (Rh) to all standards and samples at the same concentration.
- ICP-MS Analysis: Use instrument conditions: RF power 1550 W, plasma gas 15 L/min, carrier gas 0.9 L/min. Monitor isotopes: ¹⁰⁵Pd (analyte) and ¹⁰³Rh (internal standard). Use collision/reaction cell (He mode) to remove polyatomic interferences.
- Quantification: Plot intensity ratio (Pd/Rh) vs. concentration for standards. Determine sample concentration from the calibration curve and apply dilution factor.
Visualizations
Impurity Classification & HPLC Profiling Workflow
ICH M7 Genotoxic Impurity Risk Assessment
The Scientist's Toolkit
Table 2: Essential Research Reagent Solutions for Impurity Analysis
| Item | Function/Application |
|---|---|
| HPLC-MS Grade Solvents (Acetonitrile, Methanol) | Minimize background noise and system artifacts in LC-MS impurity profiling. |
| Ammonium Formate/Acetate (HPLC Grade) | Provide volatile buffer systems for LC-MS mobile phases to prevent ion source contamination. |
| ICH Residual Solvent Mix Standard | Certified reference material for accurate identification and quantification of Class 1 & 2 solvents in GC. |
| Multi-Element Calibration Standard (ICP-MS) | Certified standard solution for calibrating ICP-MS instruments across a wide range of elemental impurities. |
| Bacterial Reverse Mutation Test Kit (Ames Test) | In vitro test system for assessing the mutagenic potential of genotoxic impurities as per ICH M7. |
| Forced Degradation Reagents (HCl, NaOH, H₂O₂) | To induce and study degradation pathways for stability-indicating method validation. |
| SPE Cartridges (C18, Mixed-Mode) | For selective clean-up and trace enrichment of impurities from complex matrices prior to analysis. |
| Deuterated Internal Standards (for LC/GC-MS) | To correct for variability in sample preparation and instrument response for accurate quantification. |
Introduction Within a comprehensive thesis on HPLC method development for impurity profiling in pharmaceuticals, understanding the core principles governing separation is paramount. The ability to selectively resolve a complex mixture of active pharmaceutical ingredients (APIs) and their structurally similar impurities directly impacts the accuracy, sensitivity, and regulatory acceptance of the analytical method. This document details the fundamental separation mechanisms and critical selectivity parameters, providing application notes and protocols to guide robust method development.
1.0 Primary HPLC Separation Mechanisms Separation in HPLC is achieved through differential interactions of analytes between a stationary phase and a mobile phase. The mechanism is defined by the chemistry of the stationary phase.
Table 1: Core HPLC Separation Mechanisms
| Mechanism | Stationary Phase Chemistry | Primary Interactions | Typical Application in Impurity Profiling |
|---|---|---|---|
| Reversed-Phase (RPLC) | Nonpolar (e.g., C18, C8, phenyl) | Hydrophobic (van der Waals, dispersion forces) | Separation of nonpolar to moderately polar APIs and impurities; >70% of all pharmaceutical analyses. |
| Normal-Phase (NPLC) | Polar (e.g., silica, cyano, amino) | Polar (hydrogen bonding, dipole-dipole) | Separation of highly polar/isomeric impurities, chiral separations, and lipid analysis. |
| Ion-Exchange (IEX) | Charged functional groups (e.g., -SO3-, -NR3+) | Electrostatic (Coulombic) | Separation of ionic species, nucleotides, peptides, and charged degradation products. |
| Size-Exclusion (SEC) | Porous (inert) material | Steric (size exclusion) | Separation of polymers, aggregates, or large biomolecules from small-molecule APIs. |
| Hydrophilic Interaction (HILIC) | Polar (e.g., bare silica, amide) | Hydrophilic partitioning & hydrogen bonding | Retention of very polar compounds that elute too quickly in RPLC. |
2.0 Critical Selectivity Parameters Selectivity (α) is the ratio of the capacity factors (k) of two adjacent peaks (α = k₂/k₁, where k₂ > k₁). It defines the ability to distinguish between analytes. Key parameters to modulate selectivity include:
2.1 Mobile Phase Composition
- Organic Modifier Type: Changing from methanol to acetonitrile or tetrahydrofuran can dramatically alter selectivity due to differences in polarity, hydrogen-bonding, and solvation properties.
- pH: Critical for ionizable compounds. Operating at a pH where the analyte is partially or fully ionized changes its hydrophobicity and interaction with the stationary phase.
- Buffer Type and Concentration: Influences ionic strength and can participate in secondary interactions (e.g., ion-pairing).
2.2 Stationary Phase Chemistry
- Ligand Type: C18 vs. C8 vs. phenyl vs. polar-embedded groups offer different selectivity due to varying hydrophobicity and potential for π-π interactions.
- Particle Morphology: Solid-core particles offer different mass transfer characteristics compared to fully porous particles, affecting peak shape for critical impurity pairs.
2.3 Temperature Temperature affects retention, efficiency, and selectivity by altering thermodynamic parameters (enthalpy/entropy) of the transfer process between phases.
Table 2: Quantitative Impact of Selectivity Parameters on Retention (k) and Selectivity (α)
| Parameter | Typical Adjustment Range | Effect on Retention (k) | Potential Impact on Selectivity (α) | Protocol Reference |
|---|---|---|---|---|
| % Organic Modifier | ± 2-10% v/v | Exponential decrease with increase | High - Can reverse elution order | Protocol 3.1 |
| Mobile Phase pH | pKa ± 1.5 units | Significant for ionizable compounds; maxima at pKa | Very High - Critical for acids/bases | Protocol 3.2 |
| Buffer Concentration | 5-50 mM | Minor direct effect | Moderate - Can affect ionizable/ionic interactions | Protocol 3.2 |
| Column Temperature | 25°C to 60°C | Linear decrease with increase (RPLC) | Low to Moderate - Can resolve specific impurity pairs | Protocol 3.3 |
3.0 Experimental Protocols for Selectivity Optimization
Protocol 3.1: Scouting Gradient Elution for Initial Impurity Separation Objective: To obtain a first chromatographic view of a forced-degraded API sample and identify critical impurity pairs. Materials: See "The Scientist's Toolkit" below. Procedure:
- Prepare stock solutions of API (1 mg/mL) and a forced-degraded sample (exposed to heat, acid, base, oxidation, light).
- Equilibrate a C18 column (100 x 4.6 mm, 2.7 µm) at 40°C with 5% mobile phase B (0.1% Formic Acid in Acetonitrile) in A (0.1% Formic Acid in Water).
- Inject 5 µL of the degraded sample. Run a linear gradient from 5% to 95% B over 20 minutes at a flow rate of 1.0 mL/min.
- Use a DAD detector (scanning 210-400 nm). Identify the number of peaks and note any unresolved critical pairs (peak valley < 50%).
Protocol 3.2: Systematic Optimization of pH and Organic Modifier Objective: To maximize selectivity (α) for a critical pair of impurities (Imp-A and Imp-B) identified in Protocol 3.1. Materials: Phosphoric acid or formic acid for low pH, ammonium formate/acetic acid buffers for mid-pH. Procedure:
- Prepare three separate mobile phase A buffers: (i) pH 2.5, (ii) pH 4.5, (iii) pH 6.5, all at 20 mM concentration. Use Acetonitrile as phase B.
- On a C18 column, perform three isocratic scouting runs at 30% B for each pH, using a standard mixture of API, Imp-A, and Imp-B.
- Calculate k and α for Imp-A/Imp-B at each pH. Select the pH providing the highest α.
- At the selected optimal pH, vary the %B in 2% increments around the initial condition (e.g., 28%, 30%, 32% B) to fine-tune retention (target k between 2 and 10).
Protocol 3.3: Investigating Temperature as a Selectivity Parameter Objective: To assess the effect of temperature on the resolution (Rs) of a critical impurity pair. Procedure:
- Using optimized conditions from Protocol 3.2, set the column oven to 25°C, 40°C, and 55°C.
- After full thermal equilibration at each temperature, inject the impurity mixture in triplicate.
- Record the retention times and peak widths at half-height for the critical pair.
- Calculate Rs at each temperature using the formula: Rs = 2(tR2 - tR1) / (w1 + w2). Plot Rs vs. Temperature.
4.0 Visualizing Method Development Strategy
The Scientist's Toolkit: Key Reagents & Materials for HPLC Impurity Method Development
| Item | Function & Rationale |
|---|---|
| Water (HPLC/MS Grade) | Ultrapure, low TOC water is the base for aqueous mobile phase to minimize baseline noise and column contamination. |
| Acetonitrile & Methanol (HPLC Grade) | Primary organic modifiers. Acetonitrile offers lower viscosity and UV cut-off; methanol provides different selectivity. |
| Ammonium Formate & Acetate Buffers | Volatile buffers for LC-MS compatibility. Used for pH control in the ~3.5-5.5 range. |
| Trifluoroacetic Acid (TFA) / Formic Acid | Ionic modifiers for low-pH mobile phases. TFA offers excellent peak shape for bases but is MS-unfriendly. Formic acid is MS-compatible. |
| C18, C8, Phenyl-Hexyl Columns | Complementary reversed-phase columns with differing hydrophobicity and selectivity for primary scouting. |
| HILIC Column (e.g., bare silica) | Essential for resolving very polar impurities that are unretained in RPLC. |
| Forced Degradation Reagents | 0.1M HCl/NaOH, 3% H₂O₂, for generating impurity samples for method challenging. |
| Reference Standards | Highly purified API and available impurity standards for peak identification and method calibration. |
Within the broader thesis on HPLC method development for comprehensive impurity profiling in pharmaceuticals, the selection of chromatographic mode is paramount. This note details the application of three core HPLC modes—Reversed-Phase (RP), Ion-Exchange (IEX), and Hydrophilic Interaction Liquid Chromatography (HILIC)—for the separation and quantification of diverse pharmaceutical impurities. Each mode addresses specific analyte characteristics, ensuring a holistic analytical strategy.
Reversed-Phase HPLC (RP-HPLC)
RP-HPLC is the most prevalent mode, separating analytes based on hydrophobicity using a non-polar stationary phase and a polar mobile phase.
Application Notes: Ideal for neutral, non-polar to moderately polar impurities, and organic molecules. It is the first-line choice for most active pharmaceutical ingredients (APIs) and related organic impurities. It is less suitable for very polar or ionic compounds without ion-pairing reagents.
Key Protocol for Impurity Profiling:
- Column: Acquity UPLC BEH C18 (100 mm x 2.1 mm, 1.7 µm).
- Mobile Phase A: 0.1% Formic acid in water (v/v).
- Mobile Phase B: 0.1% Formic acid in acetonitrile (v/v).
- Gradient: 5% B to 95% B over 10 minutes, hold for 2 minutes.
- Flow Rate: 0.4 mL/min.
- Temperature: 40°C.
- Detection: UV at 254 nm; coupled with high-resolution MS for impurity identification.
- Sample Prep: Dissolve API and spiked impurity standards in diluent (mobile phase starting conditions) to a concentration of 1 mg/mL. Filter through a 0.22 µm PVDF syringe filter.
Ion-Exchange HPLC (IEX-HPLC)
IEX separates ionic or ionizable compounds based on charge, using a charged stationary phase and a buffer-containing mobile phase of varying ionic strength or pH.
Application Notes: Critical for analyzing charged impurities, including counterions, degradation products of biologics (e.g., monoclonal antibody charge variants), and process-related impurities like salts or nucleotides. Divided into cation-exchange (SCX) and anion-exchange (SAX).
Key Protocol for Charge Variant Analysis:
- Column: ProPac SCX-10 (250 mm x 4 mm).
- Mobile Phase A: 10 mM Sodium phosphate buffer, pH 6.0.
- Mobile Phase B: 10 mM Sodium phosphate buffer, pH 6.0, with 500 mM NaCl.
- Gradient: 0% B to 100% B over 30 minutes.
- Flow Rate: 1.0 mL/min.
- Temperature: 25°C.
- Detection: UV at 280 nm.
- Sample Prep: Buffer exchange monoclonal antibody sample into Mobile Phase A using a desalting column. Dilute to 1 mg/mL in Mobile Phase A.
Hydrophilic Interaction Liquid Chromatography (HILIC)
HILIC separates polar compounds using a polar stationary phase (e.g., silica, amino, amide) and a mobile phase typically consisting of acetonitrile with a small percentage of aqueous buffer.
Application Notes: Complementary to RP-HPLC, it is the mode of choice for highly polar, hydrophilic impurities that are poorly retained in RP. Ideal for small polar molecules, carbohydrates, polar degradation products, and some counterions.
Key Protocol for Polar Impurity Analysis:
- Column: XBridge BEH Amide (150 mm x 4.6 mm, 3.5 µm).
- Mobile Phase A: Acetonitrile.
- Mobile Phase B: 50 mM Ammonium formate buffer, pH 4.5.
- Gradient: 85% A / 15% B to 60% A / 40% B over 15 minutes.
- Flow Rate: 1.0 mL/min.
- Temperature: 30°C.
- Detection: UV at 210 nm and/or charged aerosol detection (CAD).
- Sample Prep: Dissolve sample in a high-organic solvent mixture (e.g., 80% acetonitrile, 20% water). Ensure sample solvent strength is stronger than the starting mobile phase.
Quantitative Data Comparison of HPLC Modes
Table 1: Comparison of Key HPLC Modes for Impurity Profiling
| Parameter | Reversed-Phase (RP) | Ion-Exchange (IEX) | HILIC |
|---|---|---|---|
| Primary Mechanism | Hydrophobicity | Ionic Charge | Partitioning/Polar Interactions |
| Stationary Phase | Non-polar (C18, C8, phenyl) | Charged (SCX, SAX, WAX, WCX) | Polar (silica, amino, amide, zwitterionic) |
| Mobile Phase | Polar (Water/Organic + modifier) | Aqueous Buffer (varying pH/ionic strength) | High Organic (>60% ACN) with aqueous buffer |
| Ideal Analyte Property | Non-polar to moderately polar | Ionic / Ionizable | Highly Polar / Hydrophilic |
| Typical Impurities | Organic synth. by-products, neutral deg. products | Counterions, charge variants, nucleotides, peptides | Polar deg. products, sugars, small polar molecules |
| Key Strength | Broad applicability, robustness | Specificity for charged species | Retention of polar analytes missed by RP |
| Common Detection | UV-Vis, MS | UV-Vis, Conductivity | UV, CAD, MS |
| Method Development Complexity | Moderate, well-understood | High (pH/ionic strength optimization) | High (buffer pH, %organic, column chemistry) |
The Scientist's Toolkit: Essential Research Reagent Solutions
Table 2: Key Materials for HPLC Impurity Method Development
| Item | Function / Explanation |
|---|---|
| High-Purity Water (LC-MS Grade) | Aqueous mobile phase component; minimizes baseline noise and system contamination. |
| LC-MS Grade Acetonitrile/Methanol | Organic mobile phase solvents; high purity is critical for UV low-wavelength and MS detection. |
| Ammonium Formate/Acetate | Volatile buffers for MS-compatible methods (RP & HILIC). |
| Sodium/Potassium Phosphate | Non-volatile buffers for UV-detected IEX or RP methods requiring precise pH control. |
| Formic/Trifluoroacetic Acid | Ion-pairing and pH modifiers; enhances peak shape for ionizable compounds in RP. |
| Ion-Pairing Reagents (e.g., HFBA, TEA) | Used in RP to retain and separate ionic analytes by masking charge. |
| Column Regeneration Solutions | High-strength solvents/buffers for cleaning and preserving column lifetime (e.g., 100% ACN for RP, 2M NaCl for IEX). |
| PVDF/Nylon Syringe Filters (0.22 µm) | For sample clarification to prevent column blockage and system damage. |
Experimental Workflows & Decision Pathways
HPLC Mode Selection for Impurity Analysis
HPLC Impurity Profiling Workflow
Setting Analytical Target Profiles (ATPs) for Impurity Methods
Within the framework of a thesis on HPLC method development for pharmaceutical impurity profiling, the establishment of Analytical Target Profiles (ATPs) is a fundamental, systematic, and quality-by-design (QbD) aligned activity. An ATP is a prospective summary of the required quality characteristics of an analytical method. It defines the intended purpose of the method by specifying the critical analytical attributes (CAAs) and their required performance levels, thereby guiding development, validation, and lifecycle management. For impurity methods, which are critical for ensuring drug safety and efficacy, a well-defined ATP is non-negotiable.
Core Components of an ATP for an Impurity Method
An ATP for an impurity method must be precise and comprehensive. The key elements are summarized in the table below.
Table 1: Essential Components of an ATP for an Impurity Method
| Component | Description | Typical Target for Impurity Methods |
|---|---|---|
| Intended Purpose | A clear statement of what the method measures and its role in control strategy. | "To separate, identify, and quantify specified and unspecified impurities in [Drug Substance] from 0.05% to 5.0% relative to the drug substance concentration." |
| Analyte of Interest | The specific chemical entities to be measured. | Drug substance, specified known impurities (A, B, C), unspecified impurities, degradation products. |
| Sample Matrix | Description of the sample material. | Drug substance (active pharmaceutical ingredient), drug product (formulation blend). |
| Critical Analytical Attributes (CAAs) | The performance characteristics the method must exhibit. | Specificity/Selectivity, Accuracy, Precision (Repeatability, Intermediate Precision), Range, Quantitation Limit (QL), Detection Limit (DL), Linearity, Robustness. |
| Target Performance Levels | The quantitative or qualitative standards for each CAA. | See Table 2 for detailed targets. |
| System Suitability Tests (SSTs) | Defined checks to ensure the method is functioning correctly at the time of analysis. | Resolution (Rs > 2.0 between critical pair), Tailing Factor (T ≤ 2.0), Repeatability (%RSD of standard ≤ 2.0%), Signal-to-Noise (S/N for QL standard ≥ 10). |
Table 2: Example Quantitative Performance Targets for Key CAAs
| Critical Analytical Attribute (CAA) | Target Performance Level (Example) |
|---|---|
| Specificity | No interference at the retention times of all analytes. Peak purity index (by PDA) ≥ 990. |
| Accuracy (% Recovery) | 98–102% for impurities at the specification level (e.g., 0.5%). |
| Precision (Repeatability, %RSD) | ≤ 5.0% for impurity content at the specification level. |
| Quantitation Limit (QL) | Signal-to-Noise Ratio (S/N) ≥ 10. Able to quantify at 0.05% with accuracy and precision. |
| Detection Limit (DL) | Signal-to-Noise Ratio (S/N) ≥ 3. Corresponds to 0.02% level. |
| Linearity | Correlation coefficient (r²) ≥ 0.998 across range from QL to 150% of specification. |
| Range | QL to 150% of the highest specified impurity limit (e.g., 0.05% to 7.5%). |
Protocol for Defining and Verifying ATP Components
Protocol 1: Establishing Specificity and Separation Criticality
Objective: To experimentally verify the method's ability to unequivocally assess the analyte(s) in the presence of potential interferents (degradants, process impurities, excipients).
Materials: See "The Scientist's Toolkit" below.
Procedure:
- Prepare Solutions: a. Blank: Mobile phase or placebo solution. b. Standard: Drug substance spiked with all available impurity reference standards at the specification threshold. c. Stressed Samples: Subject drug substance to stress conditions (e.g., 0.1M HCl, 0.1M NaOH, 3% H₂O₂, heat, light). Prepare solutions at appropriate concentrations. d. Sample with Matrix: For drug product, prepare a placebo solution spiked with impurities.
- Chromatographic Analysis: a. Inject the blank. Note any peaks. b. Inject the standard solution. Record retention times and confirm peak shapes. c. Inject each stressed sample and the spiked placebo. d. Use photodiode array (PDA) detector to collect spectra across all peaks.
- Data Analysis: a. Check for baseline resolution (Rs ≥ 2.0) between the drug substance and the nearest eluting impurity (critical pair). b. Ensure no interference from blank or placebo at the retention time of any analyte. c. For all peaks in stressed samples, calculate peak purity index using the PDA software. d. Document the chromatographic conditions that achieve this specificity.
Protocol 2: Determining Quantitation Limit (QL) and Detection Limit (DL)
Objective: To experimentally determine the lowest levels at which an impurity can be reliably quantified and detected.
Procedure:
- Prepare a Series of Dilutions: Start from a stock solution of an impurity standard at the specification level (e.g., 0.5%). Serially dilute to approximately 0.1%, 0.05%, and 0.02%.
- Chromatographic Analysis: Inject each solution at least six times.
- Calculation: a. For the 0.05% solution, calculate the Signal-to-Noise Ratio (S/N). S/N is calculated by the data system (typically peak height divided by noise from a blank region). b. QL Verification: If S/N ≥ 10, inject six replicates. The %RSD of the area must be ≤ 5.0% and recovery 80-120%. If not, adjust the target QL concentration. c. DL Verification: For the 0.02% solution, confirm S/N ≥ 3.
- Documentation: The concentration achieving S/N ≥ 10 with acceptable precision becomes the validated QL.
Workflow and Decision Logic
Title: ATP-Driven HPLC Method Development Workflow
Title: Relationship Between ATP, QbD, and Method Operable Region
The Scientist's Toolkit
Table 3: Key Research Reagent Solutions for ATP Experiments
| Item | Function |
|---|---|
| High-Purity Reference Standards | Drug substance and individual impurity standards of known purity and identity. Essential for specificity, linearity, accuracy, and QL/DL studies. |
| Stressed Samples | Drug substance subjected to forced degradation (acid, base, oxidative, thermal, photolytic). Used to demonstrate specificity and stability-indicating capability. |
| Placebo Formulation | All excipients of the drug product without the active ingredient. Critical for drug product method specificity assessment. |
| Chromatography Data System (CDS) with PDA Detector | Software for instrument control, data acquisition, and analysis. PDA is mandatory for peak purity assessment and spectral confirmation. |
| Qualified HPLC System | Instrument with precise pumps, autosampler, column oven, and detectors. Must meet performance criteria for sensitivity and reproducibility. |
| Method Robustness Test Solutions | Solutions used in Design of Experiments (DoE) to test the method's resilience to small, deliberate changes in parameters (pH, temperature, gradient time). |
Step-by-Step HPLC Method Development for Impurity Separation and Detection
Within the context of developing a robust HPLC method for impurity profiling in pharmaceutical research, a structured, systematic workflow is paramount. This application note details a strategic approach, from initial definition to final validation, ensuring regulatory compliance and scientific rigor.
The development of an impurity profiling method requires a logical, phased approach to efficiently arrive at a robust, validated procedure.
Diagram Title: Strategic Phases of HPLC Method Development
Detailed Protocols & Application Notes
Phase 1: Goal Definition & Scouting
Objective: Establish analytical target profile (ATP) and select initial column/chemistry. Protocol:
- ATP Definition: Document required separation goals: resolution (Rs > 1.5) between all critical pairs (API, known impurities, degradation products), detection limits (typically ≤ 0.05% for impurities), and run time target (< 20 min).
- Sample & Standard Prep: Prepare solutions of API (1 mg/mL) and available impurity standards (0.1% w/w relative to API) in a suitable solvent (e.g., diluent matching initial mobile phase).
- Scouting Chromatography: Using a UHPLC system with photodiode array (PDA) detection, perform rapid gradients (e.g., 5-95% organic in 10 min) on three distinct column chemistries:
- C18 (e.g., Acquity UPLC BEH C18, 2.1x50 mm, 1.7 µm)
- Phenyl-Hexyl (e.g., Kinetex PFP, 2.1x50 mm, 1.7 µm)
- Polar-Embedded C18 (e.g., XBridge Shield RP18, 2.1x50 mm, 3.5 µm)
- Evaluation: Assess peak shape (asymmetry factor 0.8-1.5), early elution of polar impurities, and overall selectivity. Select the column providing the best baseline characteristics.
Phase 2: Screening & Initial Conditions
Objective: Identify key mobile phase factors (pH, organic modifier, buffer) influencing selectivity. Protocol:
- Factor Screening: Using the selected column, perform a set of isocratic or shallow gradient runs.
- Variables:
- pH: Test aqueous buffers at pH 3.0 (ammonium formate), 4.5 (ammonium acetate), and 6.0 (ammonium phosphate). Keep buffer concentration constant (e.g., 10 mM).
- Organic Modifier: Test acetonitrile and methanol separately.
- Temperature: Test 30°C and 45°C.
- Analysis: Evaluate changes in elution order and critical resolution. Select the pH and organic modifier providing the best separation of the most critical pair.
Phase 3: Critical Parameter Optimization via Design of Experiments (DoE)
Objective: Mathematically model the effect of critical variables and define the optimal operable region. Protocol:
- DoE Setup: A central composite design (CCD) is recommended. Factors include:
- A: Gradient Time (e.g., 10 to 20 min)
- B: Temperature (e.g., 30 to 50°C)
- C: Initial %B (e.g., 5% to 15%)
- Response Variables: Measured for each run: Resolution of critical pair (Rs), total run time, and peak width of the API.
- Execution & Modeling: Perform all randomized runs. Use software (e.g., Design-Expert, MODDE) to generate a predictive model and identify significant factor interactions (e.g., Temperature x Gradient Time).
Table 1: Example DoE Results (Critical Pair Resolution)
| Run | Gradient Time (min) | Temp (°C) | Initial %B | Resolution (Rs) |
|---|---|---|---|---|
| 1 | 15.0 | 40.0 | 10.0 | 2.5 |
| 2 | 20.0 | 40.0 | 10.0 | 3.1 |
| 3 | 15.0 | 50.0 | 10.0 | 2.8 |
| 4 | 10.0 | 40.0 | 10.0 | 1.7 |
| 5 | 15.0 | 30.0 | 10.0 | 2.3 |
Phase 4: Robustness Testing & Design Space
Objective: Verify method resilience to small, deliberate parameter variations. Protocol:
- Plackett-Burman or Fractional Factorial Design: Test variations around nominal conditions (± limits).
- Flow Rate: Nominal ± 0.05 mL/min
- Column Temp: Nominal ± 2°C
- Buffer pH: Nominal ± 0.1 units
- Gradient Slope: Nominal ± 2%
- Acceptance Criteria: All runs must maintain Rs > 1.5 for all critical pairs and tailing factor < 2.0 for API.
Diagram Title: Robustness Testing Decision Flow
Phase 5 & 6: Final Specification & Validation
Objective: Document the final method and perform ICH Q2(R1) validation. Protocol for Specificity/Forced Degradation:
- Stress Conditions: Treat API sample separately with:
- 0.1M HCl (60°C, 1h), neutralize.
- 0.1M NaOH (60°C, 1h), neutralize.
- 3% H₂O₂ (RT, 1h).
- Heat (80°C, 24h).
- Light (1.2 million lux hours).
- Analysis: Inject stressed samples. Ensure peak purity (by PDA) for the main peak and baseline separation of all degradation products. The method must be stability-indicating.
Table 2: Summary of Validation Parameters & Acceptance Criteria
| Parameter | Acceptance Criteria for Impurity Quantitation (≤0.5%) |
|---|---|
| Specificity | No interference from blanks, excipients. Rs > 1.5. |
| Linearity & Range | R² > 0.998 over range from LOQ to 150% of spec. |
| Accuracy (Recovery) | 90-110% for each impurity at multiple levels. |
| Precision (Repeatability) | RSD ≤ 5.0% for impurity area (n=6). |
| Intermediate Precision | RSD ≤ 7.0% across analysts/days/instruments. |
| LOD/LOQ | S/N ≥ 3 for LOD, ≥ 10 for LOQ; LOQ typically ≤ 0.05%. |
| Robustness | As demonstrated in Phase 4. |
The Scientist's Toolkit: Key Research Reagent Solutions
Table 3: Essential Materials for HPLC Impurity Method Development
| Item | Function & Rationale |
|---|---|
| UHPLC/HPLC System with PDA Detector | Provides high-resolution separation and peak purity assessment via spectral data. |
| C18, Phenyl, and Polar-Embedded HPLC Columns (2.1 mm ID) | Core screening tool for varying selectivity based on hydrophobic, π-π, and polar interactions. |
| LC-MS Grade Solvents (Acetonitrile, Methanol, Water) | Minimizes baseline noise and ghost peaks, crucial for trace impurity detection. |
| Ammonium Formate, Acetate, and Phosphate Salts (HPLC Grade) | For preparing buffered mobile phases at different pH values to manipulate ionization. |
| Trifluoroacetic Acid (TFA) or Formic Acid (LC-MS Grade) | Common ion-pairing/acidifying agents for improving peak shape of ionizable analytes. |
| Reference Standards (API and Known Impurities) | Essential for positive identification, retention time marking, and response factor determination. |
| Forced Degradation Reagents (HCl, NaOH, H₂O₂) | Used in specificity protocols to generate degradation products and prove method stability-indicating capability. |
| Design of Experiments (DoE) Software | Enables efficient multivariate optimization and generation of predictive models and design spaces. |
Within pharmaceutical impurity profiling, the selection of high-performance liquid chromatography (HPLC) stationary phases is critical. The choice dictates selectivity, retention, and the ability to resolve complex mixtures of active pharmaceutical ingredients (APIs) and their structurally similar impurities. This application note details the properties and protocols for four pivotal column chemistries: traditional C18, polar-embedded, phenyl, and charged surface hybrid (CSH) phases, providing a framework for method development in alignment with ICH Q3A and Q3B guidelines.
Comparative Phase Properties and Applications
The following table summarizes the key characteristics and primary applications of each column chemistry.
Table 1: Comparative Summary of HPLC Stationary Phases for Impurity Profiling
| Phase Type | Key Chemical Feature | Primary Retention Mechanism | Optimal for Impurity Types | Typical Mobile Phase Consideration |
|---|---|---|---|---|
| C18 (Octadecyl) | Long alkyl chain (C18H37) | Hydrophobic (van der Waals) | Non-polar to moderately polar impurities; general forced degradation products. | Standard reversed-phase (high aqueous start). |
| Polar-Embedded | C18/Silica with amide, urea, or ether group | Mixed-mode: Hydrophobic + Polar (H-bonding) | Polar impurities, especially in 100% aqueous conditions; early eluting analytes. | Enhanced stability in 100% aqueous mobile phases. |
| Phenyl | Phenyl ring bonded to silica | Hydrophobic + π-π Interactions | Aromatic/planar impurities; separation of isomers differing in ring substitution. | Can exploit π-π interactions for selectivity tuning. |
| Charged Surface Hybrid (CSH) | C18 on low-level charged particle surface | Hydrophobic + Electrostatic (ion-exchange) | Ionizable/basic impurities; reduces peak tailing for amines at low pH. | Low pH buffers (< pH 3) to protonate silanols and engage CSH charge. |
Detailed Experimental Protocols
Protocol 1: Screening for Optimal Selectivity in Impurity Profiling
Objective: To rapidly identify the most selective stationary phase for separating an API from its key known and unknown degradation products. Materials: HPLC system with PDA detector, columns (e.g., 150 x 4.6 mm, 3.5 µm) of C18, polar-embedded, phenyl, and CSH chemistry. API and impurity standards, if available. Mobile Phase: A: 0.1% Formic Acid in Water, B: 0.1% Formic Acid in Acetonitrile. Gradient: 5% B to 95% B over 25 minutes. Equilibration: 5 minutes. Procedure:
- Prepare stock solutions of API and available impurities at ~1 mg/mL in a suitable solvent (e.g., diluent: 50:50 water:ACN).
- Spiked Solution: Prepare a sample containing the API at its nominal analytical concentration (e.g., 0.5 mg/mL) spiked with all available impurities at the specification threshold (e.g., 0.5%).
- Forced Degradation Sample: Subject the API to mild stress conditions (acid, base, oxidative, thermal) to generate a mixture of degradation products. Neutralize and dilute to the same nominal concentration.
- Inject the spiked and forced degradation samples onto each of the four columns under the identical gradient method.
- Record chromatograms. Compare the peak capacity, resolution (Rs) of critical pairs, and the number of observed impurities.
- Data Analysis: The phase yielding the highest average resolution between the API and its nearest eluting impurity, and the greatest number of baseline-resolved peaks in the forced degradation sample, is selected for further method optimization.
Protocol 2: Method Optimization for Basic Compounds Using CSH Phases
Objective: To develop a robust method for a basic API and its impurities with minimal peak tailing. Materials: CSH C18 column (100 x 3.0 mm, 2.5 µm), volatile buffers (ammonium formate, ammonium acetate). Procedure:
- pH Scouting: Prepare mobile phase A as 10 mM ammonium formate, adjusted to pH 3.0 with formic acid. Mobile phase B is acetonitrile. Use a shallow gradient (e.g., 10-50% B in 15 min).
- Analyze the basic API sample. Observe the peak shape (asymmetry factor, As).
- Compare against a standard C18 column under identical conditions. CSH should exhibit significantly reduced tailing (As closer to 1.0).
- Selectivity Adjustment: To modulate selectivity, vary the buffer pH (e.g., between 2.5 and 3.5) or the organic modifier (methanol vs. acetonitrile). The low-level positive charge on the CSH surface can provide unique selectivity changes for protonated bases compared to traditional phases.
The Scientist's Toolkit: Essential Materials for Impurity Profiling Method Development
Table 2: Key Research Reagent Solutions and Materials
| Item | Function in Impurity Profiling |
|---|---|
| HPLC Columns (C18, PE, Phenyl, CSH) | Core separation media; different selectivity origins are leveraged to resolve impurities from API and each other. |
| High-Purity Water & Acetonitrile | Primary mobile phase constituents; low UV absorbance and purity are critical for baseline stability and sensitivity. |
| Volatile Buffers (Ammonium Formate/Acetate) | Provide pH control and ion-pairing effects; volatile for LC-MS compatibility. |
| Formic Acid / Trifluoroacetic Acid | Common mobile phase additives to control pH, improve protonation, and modify selectivity. |
| Forced Degradation Reagents | (e.g., 0.1M HCl, 0.1M NaOH, 3% H2O2) Used to generate degradation impurities for method validation. |
| Reference Standards (API & Impurities) | Essential for peak identification, method qualification, and quantification. |
Visualization: Column Selection Workflow for Impurity Profiling
Diagram Title: HPLC Column Selection Logic Flow for Impurities
Within the broader thesis on developing a robust HPLC method for impurity profiling in pharmaceuticals, the optimization of the mobile phase is the single most critical factor determining success. Precise control over pH, buffer strength, and organic modifier gradient is paramount for achieving the necessary resolution between the active pharmaceutical ingredient (API) and its structurally similar impurities, degradants, and by-products. This document provides detailed application notes and protocols for systematic mobile phase optimization, targeting researchers and scientists in drug development.
Key Parameters and Their Impact
Mobile Phase pH
The pH of the aqueous buffer is the primary tool for controlling the ionization state of analytes in reversed-phase HPLC (RP-HPLC). For ionizable compounds, a pH at which the analyte is neutral typically increases retention, while a pH promoting ionization decreases retention due to increased hydrophilicity. The target pH is usually selected to be at least 1.0 pH unit away from the analyte's pKa to ensure a consistent, non-ionized state. For separation of ionizable impurities from the API, a pH that differentially affects their ionization is chosen.
Buffer Strength and Selection
Buffer concentration (typically 10-100 mM) impacts peak shape and reproducibility. Insufficient buffer capacity leads to peak tailing and retention time drift as the pH shifts during the run. Phosphate and acetate buffers are common. The choice of buffer is also constrained by the detection method (e.g., UV transparency, MS compatibility).
Organic Modifier Gradient
The gradient profile (slope, shape, and duration) of the organic solvent (typically acetonitrile or methanol) controls the elution order and critical pair resolution. A shallower gradient improves resolution but increases run time. The initial and final organic percentages must be optimized to elute all components while minimizing post-run re-equilibration time.
Table 1: Effect of Mobile Phase pH on Retention (k) and Resolution (Rs) for a Hypothetical API (pKa 4.2) and Its Acidic Impurity
| pH | API Retention (k) | Impurity Retention (k) | Critical Resolution (Rs) | Observation |
|---|---|---|---|---|
| 2.5 | 8.5 | 6.2 | 1.5 | Both protonated; low resolution. |
| 4.2 | 6.1 | 3.0 | 4.8 | At API pKa; impurity ionized, max resolution. |
| 6.0 | 5.8 | 2.8 | 4.5 | Both ionized; resolution maintained. |
Table 2: Impact of Buffer Concentration (Ammonium Formate, pH 3.5) on Peak Asymmetry (As)
| Buffer Conc. (mM) | API As | Impurity As | Retention Time RSD (%) (n=6) |
|---|---|---|---|
| 5 | 1.8 | 2.1 | 1.25 |
| 20 | 1.2 | 1.3 | 0.45 |
| 50 | 1.1 | 1.1 | 0.15 |
Table 3: Gradient Time Optimization for a Complex Impurity Profile
| Gradient Time (min) | Total Run Time (min) | Minimum Rs | Number of Peaks >1.5 |
|---|---|---|---|
| 20 | 30 | 1.0 | 8 |
| 45 | 55 | 2.2 | 12 |
| 60 | 70 | 2.5 | 12 |
Experimental Protocols
Protocol 1: Systematic Scouting of pH and Gradient Slope
Objective: To identify the initial optimal pH window and gradient slope for separating an API from its known impurities. Materials: See "The Scientist's Toolkit" below. Method:
- Prepare buffer solutions at pH 2.5, 3.5, 4.5, 5.5, and 6.5 using ammonium formate (for MS compatibility) or phosphate. Adjust pH with formic acid or ammonium hydroxide. Filter through a 0.45 µm nylon membrane.
- Prepare mobile phase A: Buffer. Mobile phase B: Acetonitrile.
- Set up a linear gradient from 5% B to 95% B over 20, 45, and 60 minutes on a C18 column (150 x 4.6 mm, 3.5 µm). Hold at 95% B for 5 min, then re-equilibrate at 5% B for 10 min.
- Inject a sample containing the API spiked with known impurities at ~0.5% level each.
- Measure retention factors (k), resolution (Rs) between all critical pairs, and peak asymmetry (As).
- Plot pH vs. Rs for each critical pair. The pH yielding the highest Rs for the most difficult pair is selected for further optimization.
Protocol 2: Fine-Tuning Buffer Strength and Gradient Shape
Objective: To optimize peak shape and finalize the gradient profile. Method:
- At the optimal pH identified in Protocol 1, prepare buffers at 10, 25, and 50 mM concentrations.
- Using the optimal gradient time, test different gradient shapes (linear, multi-linear, curved) to improve early, middle, or late eluting peak pairs.
- For a typical impurity profile with clustered early eluters, implement a shallow initial gradient (e.g., 5-15% B in 10 min), followed by a steeper ramp (15-80% B in 30 min).
- Inject samples and evaluate peak capacity, valley separation between all peaks, and overall run time. The goal is Rs > 2.0 for all specified impurity/API pairs.
Diagrams
Title: HPLC Mobile Phase Optimization Workflow
Title: How Mobile Phase Parameters Affect Method Outcomes
The Scientist's Toolkit: Essential Research Reagents & Materials
Table 4: Key Reagents and Materials for Mobile Phase Optimization
| Item | Function & Specification | Rationale |
|---|---|---|
| HPLC-Grade Water | Resistivity >18 MΩ·cm, filtered (0.22 µm). | Prevents baseline noise, column contamination, and particulate formation. |
| HPLC-Grade Acetonitrile & Methanol | Low UV cutoff, low particle content. | Primary organic modifiers for RP-HPLC. Acetonitrile offers lower viscosity. |
| Ammonium Formate | MS/MS and UV compatible buffer salt. | Volatile for LC-MS methods; useful pH range ~3-5. |
| Potassium Phosphate | High UV compatibility buffer salt. | Offers excellent buffering capacity in pH 2-3 and 6-8 ranges for UV detection. |
| Formic Acid & Ammonium Hydroxide (LC-MS Grade) | For precise pH adjustment. | High purity minimizes ion suppression in MS and background UV absorbance. |
| pH Meter with ATC Probe | Accurate to ±0.01 pH units. | Essential for reproducible buffer preparation. |
| 0.45 µm & 0.22 µm Nylon Membrane Filters | Filtration of all aqueous and organic solvents. | Protects HPLC system and column from particulates. |
| C18 Reversed-Phase Column (150 x 4.6 mm, 3.5 µm) | High-efficiency, end-capped stationary phase. | Standard column for impurity profiling; provides a balance of efficiency and speed. |
| Column Heater/Oven | Precise temperature control (±0.5°C). | Essential for retention time reproducibility; sometimes used as a selectivity parameter. |
| Impurity Reference Standards | Chemically characterized impurities/degradants. | Necessary for peak identification and assigning resolution criteria. |
Within the broader thesis on HPLC method development for impurity profiling in pharmaceuticals, detector selection is a critical determinant of method specificity, sensitivity, and robustness. No single detector is universally optimal for all impurity classes. This application note provides a structured comparison and detailed protocols for employing Ultraviolet/Diode Array Detection (UV/DAD), Fluorescence Detection (FLD), and Refractive Index Detection (RID) to address the analytical challenges posed by diverse pharmaceutical impurities, including those lacking strong chromophores.
Comparative Detector Performance Data
Table 1: Key Performance Characteristics of HPLC Detectors for Impurity Analysis
| Characteristic | UV/DAD | Fluorescence (FLD) | Refractive Index (RID) |
|---|---|---|---|
| Typical Sensitivity | 0.1-1 ng (for good chromophores) | 1-10 pg (for fluorescent compounds) | 0.1-1 µg |
| Selectivity | Moderate (based on UV absorbance) | Very High (specific excitation/emission) | Very Low (universal) |
| Gradient Compatibility | Excellent | Excellent | Poor (requires meticulous baseline subtraction) |
| Structural Requirement | Requires chromophore (π-electrons, conjugated systems) | Requires fluorophore (rigid, planar conjugated systems) | None (responds to all compounds) |
| Primary Use in Profiling | Quantification of main API & most impurities; peak purity assessment via DAD. | Trace analysis of specific fluorescent impurities (e.g., polyaromatics). | Impurities with no UV absorbance: sugars, alcohols, polymers, excipients. |
| Key Limitation | Insensitive to satur./aliph. compounds. | Limited scope; quenching possible. | Low sensitivity; temp. & flow sensitive. |
Table 2: Applicability to Common Impurity Classes
| Impurity Class | Recommended Primary Detector | Complementary Detector(s) | Notes |
|---|---|---|---|
| Process-Related (Alkyl Halides, Aliphatic Intermediates) | RID | Charged Aerosol Detector (CAD) / Evaporative Light Scattering (ELSD) | UV often fails. |
| Degradation Products (Oxidized, Hydrolyzed API) | UV/DAD | FLD (if fluorophore forms) | DAD spectra crucial for identification. |
| Genotoxic Impurities (Nitrosamines, Alkyl Sulfonates) | UV/DAD (some) | MS (essential for most) | FLD for specific aromatic GTIs. |
| Polymer/Saccharide Excipients | RID | ELSD | High molecular weight, no UV. |
| Isomeric Impurities | UV/DAD (if spectra differ) | FLD / Polarimetric | RID rarely distinguishes. |
| Trace Fluorescent Degradants | FLD | UV/DAD for confirmation | Offers unparalleled sensitivity for this subset. |
Experimental Protocols
Protocol 1: Systematic Screening for Detector Suitability in Impurity Profiling
Objective: To empirically determine the optimal detector(s) for a new chemical entity and its potential impurities.
Materials:
- HPLC system with quaternary pump, autosampler, column oven.
- Detectors in series or parallel: DAD, FLD, RID. (Note: RID must be last if in series due to flow cell backpressure).
- Columns: C18 (e.g., 150 x 4.6 mm, 3.5 µm) and HILIC (e.g., 100 x 4.6 mm, 3.5 µm) for broad coverage.
- Research Reagent Solutions:
- API Stock Solution (1 mg/mL): Primary reference standard in suitable solvent.
- Forced Degradation Sample: API stressed under acid, base, oxidative, thermal, and photolytic conditions.
- Process Impurity Mix: Synthetic intermediates and known by-products.
- Mobile Phase A: 0.1% Formic Acid in Water.
- Mobile Phase B: 0.1% Formic Acid in Acetonitrile.
- Mobile Phase for RID (Isocratic): Acetonitrile:Water (50:50, v/v) – requires high-purity HPLC-grade solvents.
Procedure:
- System Setup: Configure detectors. Set DAD to scan 200-400 nm. Optimize FLD Ex/Em wavelengths based on API structure; if unknown, use an initial generic setting (e.g., Ex 230 nm, Em 350 nm) or an excitation/emission scan mode.
- Chromatographic Run: Inject the forced degradation sample. Use a generic gradient: 5-95% B over 30 min. Collect data simultaneously from all detectors.
- Data Analysis: Overlay chromatograms. Identify peaks detected by UV but not RID (strong chromophores). Identify peaks detected by RID but not UV (UV-transparent impurities). Note any peaks with exceptionally high response in FLD.
- Wavelength Optimization: For major impurities found by DAD, extract spectra and choose optimal quantification wavelengths. For fluorescent peaks, perform automated Ex/Em scans to determine optimal FLD conditions.
- Sensitivity Assessment: Prepare a dilution series of API and available impurity standards. Determine signal-to-noise ratios for each detector to establish approximate detection limits.
Protocol 2: Quantification of a Non-UV Absorbing Impurity using RID
Objective: To accurately quantify a residual alcohol or sugar impurity using RID with an isocratic method.
Materials:
- HPLC system with isocratic pump, autosampler, column oven, and RID.
- Column: Carbohydrate or NH2-based column (e.g., 250 x 4.6 mm, 5 µm) for polar compound retention.
- Research Reagent Solutions:
- Impurity Standard Stock: Accurately weigh the non-UV absorbing impurity (e.g., mannitol, propylene glycol).
- Internal Standard (IS) Solution: A similar, well-resolved compound (e.g., sorbitol for sugars). Required for improved RID quantification precision.
- Isocratic Mobile Phase: Acetonitrile:Water (75:25, v/v). Degas thoroughly for 30 min.
Procedure:
- RID Stabilization: Equilibrate the RID with mobile phase flowing at 1.0 mL/min for at least 2 hours. Maintain a constant temperature (±0.1°C) in the detector and column oven.
- Calibration Curve: Prepare a series of standard solutions containing the impurity and a fixed concentration of IS across the expected range (e.g., 10-500 µg/mL). Inject in triplicate.
- Sample Preparation: Spike the API sample with the same concentration of IS as in the standards.
- Chromatography: Run isocratically at 1.0 mL/min. Monitor baseline stability; a stable baseline is critical.
- Quantification: Plot the peak area ratio (Impurity/IS) against concentration. Use the resulting calibration curve to determine impurity levels in samples.
Visualization of Detector Selection Logic
Diagram 1: Detector Selection Logic Flow for Impurity Analysis
Table 3: Research Reagent Solutions & Essential Materials Toolkit
| Item | Function in Impurity Profiling | Example/Note |
|---|---|---|
| Forced Degradation Samples | Generates potential degradation products for detector response assessment. | Prepare under ICH Q1B conditions (acid, base, oxid., heat, light). |
| Process Impurity Standards | Provides reference for detector response & retention of known synthetic by-products. | Sourced from synthesis pathway. |
| Diode Array Detector (DAD) | Provides spectral data for peak purity assessment and identity confirmation. | Essential for distinguishing co-eluting peaks. |
| Fluorometer / FLD Scan Software | To determine optimal Ex/Em wavelengths for fluorescent analytes. | Use 3D scans on impurity standards or key peaks. |
| Isocratic HPLC Pump System | Required for stable baseline operation with RID. | Gradient RID is possible but analytically challenging. |
| Chemically Inert LC Tubing | Critical for RID to prevent baseline drift from leaching. | Use PEEK or high-quality stainless steel throughout. |
| Internal Standard (for RID) | Improves quantification precision by correcting for flow and temperature drift. | Must be stable, pure, and elute near target impurity. |
| High-Purity Solvents (RID Grade) | Minimizes baseline noise and drift in universal detectors. | Specifically labeled for RID or LC-MS use. |
Forced Degradation Studies (Stress Testing) to Predict and Identify Potential Impurities
Forced degradation studies, or stress testing, are an integral component of the analytical method development lifecycle within pharmaceutical research, particularly for High-Performance Liquid Chromatography (HPLC) methods aimed at impurity profiling. These studies proactively subject a drug substance or product to conditions more severe than accelerated stability testing. The primary objectives are to:
- Degrade the sample intentionally to generate potential impurities and degradation products.
- Evaluate the specificity of the proposed HPLC method—its ability to measure the analyte accurately in the presence of all potential degradation products.
- Identify major degradation pathways and elucidate the structure of degradation products, informing formulation development, packaging, and storage conditions.
- Establish the stability-indicating power of the method, a regulatory expectation for all new drug applications.
This application note details current protocols and best practices for designing and executing forced degradation studies to support the development of a validated, stability-indicating HPLC method.
Core Stress Conditions and Protocols
The International Council for Harmonisation (ICH) guidelines Q1A(R2) and Q1B provide the framework for stress testing. Studies typically encompass a variety of conditions to challenge the chemical integrity of the molecule.
Table 1: Standard Forced Degradation Conditions and Parameters
| Stress Condition | Typical Protocol Parameters | Target Degradation (10-20%*) | Purpose & Key Considerations |
|---|---|---|---|
| Acidic Hydrolysis | 0.1-1 M HCl,室温 or 40-70°C, 24h-7 days. | Ester/amide hydrolysis, rearrangement. | Use aqueous or hydroalcoholic solutions. Neutralize before HPLC analysis. |
| Alkaline Hydrolysis | 0.1-1 M NaOH,室温 or 40-70°C, 24h-7 days. | Ester/amide hydrolysis, dehalogenation, oxidation. | Neutralize immediately after stress to prevent ongoing degradation. |
| Oxidative Stress | 0.1-3% H₂O₂,室温, 24h-7 days. | Sulfoxide formation, N-oxidation, hydroxylation. | Concentration and time are critical; can be very aggressive. |
| Thermal Stress (Solid) | Drug substance: 5-10°C above accelerated conditions (e.g., 70°C), up to 4 weeks. | Dehydration, polym. formation, cyclization. | Assess inherent thermal stability. Use open and closed containers. |
| Thermal & Humidity (Solid) | e.g., 40°C/75% RH or 70°C/75% RH, up to 4 weeks. | Hydrolysis, hydrate formation. | Evaluates sensitivity to moisture. Critical for dosage form design. |
| Photolytic Stress | Per ICH Q1B: >1.2 million lux hours of visible light and 200 W·h/m² of UV. | Radical-mediated reactions: decarboxylation, dimerization, discoloration. | Use controlled photostability chamber. Protect one sample as control. |
| Neutral Hydrolysis | Water or buffer (pH 5-7), heated (e.g., 70°C), several days. | Hydrolysis in absence of acid/base catalysis. | Simulates degradation in aqueous formulations. |
Note: The goal is not complete degradation but to induce approximately 10-20% degradation of the active pharmaceutical ingredient (API) to generate sufficient levels of impurities for detection and identification.
Detailed Experimental Protocol: Forced Degradation Sample Preparation for HPLC Analysis
Title: Sample Preparation for Acid, Base, and Oxidative Stress
Materials: API (Drug Substance), 1.0 M HCl, 1.0 M NaOH, 30% w/w H₂O₂, pH meter, heating block, volumetric flasks, HPLC vials.
Procedure:
- Stock Solution: Prepare a stock solution of the API at a concentration near the nominal analytical concentration (e.g., 1 mg/mL) in a suitable solvent (often the HPLC mobile phase or a mixture of water and organic solvent).
- Stress Application:
- Acid Stress: Transfer 2.0 mL of stock solution to a vial. Add 0.2 mL of 1.0 M HCl. Seal and heat at 60°C for 24-48 hours. Cool. Neutralize with 0.2 mL of 1.0 M NaOH.
- Base Stress: Transfer 2.0 mL of stock solution to a vial. Add 0.2 mL of 1.0 M NaOH. Seal and heat at 60°C for 6-24 hours (often shorter than acid). Cool. Immediately neutralize with 0.2 mL of 1.0 M HCl.
- Oxidative Stress: Transfer 2.0 mL of stock solution to a vial. Add 0.1 mL of 30% H₂O₂ (final ~1.5%). Keep at 室温 for 24 hours. No neutralization required.
- Control Sample: Prepare a control by diluting the stock solution with the same proportion of neutral solvent (e.g., water) and subjecting it to the same thermal conditions.
- HPLC Analysis: Dilute all stressed and control samples appropriately with the HPLC diluent to match the nominal concentration. Analyze using the developmental HPLC method alongside an unstressed standard.
Data Interpretation and Method Evaluation
The resulting chromatograms are compared to the control and unstressed standard.
Table 2: Key HPLC Method Performance Metrics from Stress Testing
| Metric | Calculation/Assessment | Acceptance Criteria for Stability-Indicating Method |
|---|---|---|
| Peak Purity | Assessed via Photodiode Array (PDA) detector; spectral homogeneity across the peak. | Peak purity index > 990 (or as per instrument spec). No co-elution indicated. |
| Mass Balance | (Sum of Areas of Degradation Peaks + Area of Main Peak)stressed / (Area of Main Peak)unstressed x 100%. | Ideally 98-102%. Acceptable range 95-105% upon justification. |
| Specificity/Resolution | Resolution (Rs) between the main peak and the closest eluting degradation peak. | Rs > 2.0 (baseline separation) for critical pair. |
| Degradation Products | Number, relative retention time (RRT), and relative area (%) of new peaks. | Document all peaks > reporting threshold (e.g., 0.05%). |
The Scientist's Toolkit: Essential Research Reagent Solutions
Table 3: Key Reagents and Materials for Forced Degradation Studies
| Item | Function/Explanation |
|---|---|
| High-Purity Acids & Bases (HCl, H₂SO₄, NaOH, KOH) | Used for hydrolytic stress testing. Analytical grade ensures no introduction of interfering impurities. |
| Hydrogen Peroxide (H₂O₂), 30% w/w | Standard reagent for oxidative stress testing. Concentration must be verified via titration if stored long-term. |
| Photostability Chamber | Calibrated chamber meeting ICH Q1B light requirements (cool white fluorescent, UV lamp) for controlled photolytic stress. |
| Stability Chambers (Temp/Humidity) | Provide controlled thermal and humidity conditions (e.g., 40°C/75% RH) for solid-state stress studies. |
| HPLC with Photodiode Array (PDA) Detector | Essential for online peak purity assessment and spectral identification of degradation products. |
| LC-MS System (Single Quad or Q-TOF) | Used for structural identification of degradation products. Provides molecular weight and fragmentation data. |
| pH Meter & Buffers | For accurate neutralization of hydrolytic stress samples and preparation of buffer solutions. |
| Inert HPLC Vials & Septa | Prevent additional, unintended degradation or adsorption of samples during storage and analysis. |
Workflow and Relationship Diagrams
Title: Forced Degradation Study Workflow for HPLC Method Development
Title: Role of Stress Testing in Drug Development
Within the context of an HPLC method for impurity profiling in pharmaceuticals, establishing scientifically justified and regulatory-aligned sensitivity thresholds is paramount. These thresholds—Reporting, Identification, and Qualification—define the action required for impurities detected in a drug substance or product. They are critical for patient safety, product quality, and regulatory compliance. This document provides application notes and protocols for establishing these thresholds based on the International Council for Harmonisation (ICH) Q3A(R2), Q3B(R2), and recent regulatory guidelines.
Key Threshold Definitions and ICH Basis
Thresholds are typically based on the maximum daily dose (MDD) of the drug product. The following table summarizes the standard ICH thresholds for drug substances (new chemical entities) and drug products.
Table 1: Standard ICH Thresholds for Impurities
| Threshold | Drug Substance (Q3A(R2)) | Drug Product (Q3B(R2)) | Required Action |
|---|---|---|---|
| Reporting | ≥ 0.05%* | ≥ 0.05%* (< 1g MDD) | Report impurity in certificate of analysis. |
| Identification | ≥ 0.10%* | ≥ 0.10%* (< 1g MDD) or 1.0mg/day (whichever is lower) | Identify impurity structure (e.g., via LC-MS, NMR). |
| Qualification | ≥ 0.15%* | ≥ 0.15%* (< 1g MDD) or 1.0mg/day (whichever is lower) | Provide safety data (e.g., toxicological assessment). |
*Percentage thresholds are relative to the drug substance. Thresholds are lower for higher MDDs. See guidelines for full details.
Experimental Protocol: Establishing Method Sensitivity (LOQ) Relative to Thresholds
Objective: To validate an HPLC method such that its Limit of Quantitation (LOQ) is at or below the Reporting Threshold concentration. Materials: Reference standard of drug substance, impurity standards (if available), appropriate HPLC system with UV/DAD or MS detector. Procedure:
- Calculate Threshold Concentrations: Based on the test concentration of your assay (e.g., 1 mg/mL), calculate the absolute concentration corresponding to the Reporting Threshold (e.g., 0.05% of 1 mg/mL = 0.5 µg/mL).
- Prepare LOQ Solution: Prepare a dilute solution of an impurity or the API at the concentration calculated in Step 1.
- Chromatographic Analysis: Inject the LOQ solution (n=6) using the candidate HPLC method.
- LOQ Confirmation: Calculate the signal-to-noise ratio (S/N). The S/N should be approximately 10:1. Calculate the precision (RSD%) of the peak response; it should be ≤ 10%.
- Verification: Ensure the method's LOQ is ≤ the Reporting Threshold concentration. If not, method parameters (e.g., injection volume, detection wavelength, cell path length) must be optimized to achieve necessary sensitivity.
- Specificity: Confirm that the impurity peak(s) at the threshold level are baseline resolved from the main peak and any other known impurities.
Workflow for Impurity Threshold Management
Title: Decision Flow for Impurity Thresholds
The Scientist's Toolkit: Key Research Reagent Solutions
Table 2: Essential Materials for Impurity Profiling & Threshold Studies
| Item | Function & Rationale |
|---|---|
| High-Purity Reference Standards | Certified API and known impurity standards are essential for accurate method calibration, identification, and threshold level setting. |
| MS-Grade Mobile Phase Additives (e.g., Formic Acid, Ammonium Acetate) | Essential for LC-MS identification work. Provides consistent ionization and minimizes ion suppression. |
| Forced Degradation Materials (e.g., acid, base, peroxide, light chambers) | Used to generate potential degradants, ensuring the HPLC method can detect impurities relevant to stability. |
| Toxicological Qualification Kits (e.g., Ames test kits, in vitro cytotoxicity assays) | Tools for initial safety assessment of impurities above qualification thresholds. |
| Stable-Labeled Internal Standards (^13C, ^15N) | Critical for accurate quantitation in LC-MS, especially when impurity standards are unavailable. |
Protocol: Stressed (Forced Degradation) Studies to Validate Threshold Applicability
Objective: To demonstrate the method's capability to separate and quantify degradant impurities that may arise during storage, ensuring thresholds are relevant to real-world stability profiles. Materials: Drug substance/product, 0.1N HCl, 0.1N NaOH, 3% H₂O₂, heat chamber, UV light chamber, HPLC system. Procedure:
- Sample Preparation: Subject the drug to various stress conditions: acid/base hydrolysis (room temp, 1-24h, neutralized), oxidation (H₂O₂, room temp, hours), thermal (e.g., 70°C, days), and photolytic (per ICH Q1B).
- HPLC Analysis: Analyze stressed samples alongside controls using the validated impurity method.
- Peak Assessment: Identify new degradation peaks. Compare their levels (as % of parent peak) to the established thresholds.
- Specificity & Resolution: Confirm that all significant degradants (especially those near or above reporting threshold) are resolved from the main peak and from each other (resolution > 2.0).
- Data Integration: Document the fate of the sample and the purity of the main peak. This study validates that the method is "stability-indicating" and that the set thresholds are actionable for control of real impurities.
Table 3: Example Threshold Application for a Drug Product (MDD = 500 mg)
| Impurity | Level Found (%) | Reporting (0.05%) | Identification (0.10%) | Qualification (0.15%) | Action Taken |
|---|---|---|---|---|---|
| Impurity A | 0.03% | Below | Below | Below | No action (monitor). |
| Degradant B | 0.08% | Above | Below | Below | Reported in CoA. |
| Unknown C | 0.12% | Above | Above | Below | Structure identified via LC-MS. |
| Process Byproduct D | 0.20% | Above | Above | Above | Qualified via literature toxicology data. |
Final method validation must include demonstration of accuracy, precision, and linearity across a range from the LOQ to at least 150% of the specification level (which is often aligned with the Qualification Threshold).
Solving Common HPLC Impurity Method Problems and Enhancing Performance
Application Notes
Within the critical framework of HPLC method development for pharmaceutical impurity profiling, peak shape is a paramount indicator of method robustness and data reliability. Anomalies such as tailing, fronting, splitting, and ghost peaks directly compromise resolution, accurate quantification, and the ability to detect low-level impurities. These anomalies are symptomatic of underlying issues in the chromatographic system, often stemming from mismatched or degraded stationary phases, inappropriate mobile phase conditions, hardware malfunctions, or sample-related problems.
Table 1: Summary of Common HPLC Peak Anomalies, Causes, and Diagnostic Checks
| Anomaly | Primary Causes | Key Diagnostic Experiments |
|---|---|---|
| Tailing (Asymmetry >1.5) | 1. Active silanol sites on column2. Column overload (mass/volume)3. Extra-column volume post-column4. Mobile phase pH mismatched with analyte pKa | 1. Inject a smaller sample mass.2. Use a mobile phase pH 2 units away from analyte pKa.3. Add a competing base (e.g., triethylamine).4. Test with a new, "less-active" column. |
| Fronting (Asymmetry <0.8) | 1. Column degradation (voids)2. Sample solvent stronger than mobile phase3. Mass overload (saturation of binding sites) | 1. Check column efficiency (N) and compare to specification.2. Inject sample dissolved in mobile phase or weaker solvent.3. Reduce injection volume/mass. |
| Splitting | 1. Column inlet frit/void issues2. Partially blocked inlet line or frit3. Incorrect column connection (leaks, voids)4. Sample precipitation upon injection | 1. Reverse and flush the column.2. Inspect and replace column end frits.3. Ensure zero-dead-volume fittings are tight.4. Change sample solvent. |
| Ghost Peaks | 1. Contaminated mobile phase or reservoir2. Late elution of compounds from previous injections3. Leaking injector seal (carryover)4. Bacterial growth in aqueous mobile phase | 1. Run a blank gradient (no injection).2. Perform an extended blank run after a sample.3. Replace/clean injector rotor seal.4. Use fresh, HPLC-grade solvents with preservatives. |
Table 2: Quantitative Impact of Peak Asymmetry (Tailing Factor, Tf) on Key Impurity Profiling Metrics
| Tailing Factor (Tf) | Impact on Resolution (Rs) | Impact on Quantification Error (at 0.1% level) | Impact on Limit of Detection (LOD) |
|---|---|---|---|
| 1.0 (Ideal) | Baseline (Reference) | ≤ 2% | Reference |
| 1.5 (Acceptable Limit) | Decrease of ~15% | ~5-10% | Increase of ~20% |
| 2.0 | Decrease of ~30% | ~15-25% | Increase of ~50% |
| >2.0 (Severe) | Decrease of >50%, risking co-elution | >30%, potentially invalidating data | Can obscure low-level impurities |
Experimental Protocols
Protocol 1: Systematic Diagnosis of Peak Tailing in an Impurity Method
Objective: To identify the root cause of peak tailing observed for a basic pharmaceutical compound and its potential impurities. Materials: See "Scientist's Toolkit" below. Procedure:
- Initial Assessment: Inject the standard solution (main compound at reporting threshold concentration and spiked impurities at 0.5%). Calculate the tailing factor (Tf) for all peaks per USP guidelines.
- Experiment A: Mobile Phase pH Optimization:
- Prepare mobile phase A (aqueous buffer) at three pH values: analyte pKa - 2, at pKa, and pKa + 2.
- Keep mobile phase B (acetonitrile) constant. Use a linear gradient from 5% B to 95% B over 30 minutes.
- Inject the standard. Plot Tf vs. mobile phase pH.
- Experiment B: Silanol Masking Test:
- To the mobile phase at the optimal pH from Exp. A, add 0.1% v/v triethylamine (TEA) or use a column specifically engineered for basic compounds (e.g., charged surface hybrid).
- Re-inject the standard and compare Tf values.
- Experiment C: Mass Overload Check:
- Perform sequential injections of the standard at 50%, 100%, 200%, and 500% of the target concentration.
- Plot peak area and Tf vs. concentration. A sharp increase in Tf with concentration indicates overload. Analysis: The intervention that yields Tf closest to 1.0 without compromising selectivity is the preferred corrective action.
Protocol 2: Investigation and Elimination of Ghost Peaks
Objective: To identify the source of consistent ghost peaks in a blank gradient run for a stability-indicating method. Procedure:
- Blank Gradient Run:
- Run the full method gradient with an injection of the sample solvent (e.g., water:acetonitrile 80:20).
- Note retention times and areas of any ghost peaks.
- Systematic Component Isolation:
- Step 1: Replace mobile phase reservoirs with fresh, newly prepared solvents. Repeat blank run.
- Step 2: If ghost peaks persist, disconnect the column and replace it with a zero-dead-volume union. Run the gradient. This isolates the HPLC instrument (pumps, autosampler, detector). Any peaks are from the instrument.
- Step 3: If peaks are from the instrument, perform an intensive wash of the autosampler injection port and needle seat. Replace the injector rotor seal.
- Step 4: Reconnect the column. Perform 5 consecutive blank runs. If ghost peaks diminish run-over-run, they are due to carryover. If consistent, they may be leaching from the column – flush with strong solvents.
- Contamination Source Confirmation:
- Prepare mobile phase from a different lot of solvents and high-purity salts.
- Use a dedicated, cleaned glass reservoir.
- Perform a final blank run. The absence of ghost peaks confirms solvent/container contamination.
Visualization Diagrams
Title: Diagnostic Workflow for HPLC Peak Fronting
Title: Systematic Isolation of Ghost Peak Sources
The Scientist's Toolkit: Key Research Reagent Solutions
Table 3: Essential Materials for HPLC Anomaly Diagnosis in Impurity Profiling
| Item | Function & Rationale |
|---|---|
| HPLC Column for Basic Compounds (e.g., Charged Surface Hybrid, Shielded RP) | Core tool to mitigate tailing of basic APIs and impurities by reducing silanol interaction. |
| Triethylamine (TEA) or Dimethyloctylamine | Mobile phase additive to mask active silanol sites on conventional C18 columns. |
| Trifluoroacetic Acid (TFA) | Ion-pairing agent for acidic analytes; also improves peak shape for proteins/peptides. |
| Fresh, HPLC-Grade Solvents & Buffers | Prevents ghost peaks from solvent degradation or microbial contamination. |
| Certified Reference Standards | Essential for accurately quantifying peak asymmetry and resolution changes during troubleshooting. |
| In-Line Degasser & Filter Unit | Removes dissolved air (prevents baseline noise) and particulates (protects column frit) from mobile phase. |
| Zero-Dead-Volume Unions & Fittings | For system isolation experiments to pinpoint the source of extra-column volume or contamination. |
| Column Frit Replacement Kit | Allows restoration of column inlet to resolve splitting caused by a blocked frit. |
| Needle Wash Solvent (Strong) | High-strength solvent (e.g., 50:50 ACN:IPA) to minimize autosampler carryover. |
| pH Meter & Certified Buffers | Critical for accurate mobile phase preparation, as pH is a primary variable controlling selectivity and peak shape. |
Managing Baseline Noise, Drift, and Unwanted Artifacts
In the development and validation of HPLC methods for pharmaceutical impurity profiling, the integrity of the chromatographic baseline is paramount. Excessive baseline noise, drift, and unwanted artifacts can obscure low-level impurities, compromise quantitative accuracy, and lead to erroneous conclusions about drug substance purity. This application note details protocols to identify, troubleshoot, and mitigate these critical baseline disturbances, ensuring robust method performance suitable for regulatory submission.
Table 1: Common Sources and Quantitative Impact of Baseline Disturbances
| Disturbance Type | Common Causes | Typical Impact on Impurity Quantification (% RSD increase) | Key Diagnostic Parameter |
|---|---|---|---|
| High-Frequency Noise | Detector lamp aging, electronic instability, high flow cell temperature gradient. | Can increase LOD/LOQ by 15-50%. | Detector time constant (too fast), signal-to-noise ratio (S/N < 10 for peak of interest). |
| Short-Term Drift | Mobile phase degassing issues, column temperature fluctuations (±1°C), improper mixer equilibration. | May cause ±5-20% variation in peak area for late-eluting impurities. | Baseline slope over 10 column volumes. |
| Long-Term Drift | Mobile phase composition or pH drift, column degradation (stationary phase bleed), slow contamination buildup. | Can lead to significant retention time shifts (>2%) and inaccurate baseline integration. | Retention time stability over 6+ injections. |
| Cyclical Artifacts (Periodic Noise) | Pump piston seal wear, improper plunger synchronization, solvent mixer cavitation, HVAC cycling. | Creates false peaks or valleys; may be misinterpreted as impurities. | Fast Fourier Transform (FFT) frequency matching pump stroke rate (e.g., 1-2 Hz). |
| Spikes (Sharp Artifacts) | Air bubbles in flow cell, voltage spikes, particulate matter in mobile phase/column. | Causes false peak integration, invalidates data points. | Sudden, high-amplitude deviation lasting <30s. |
Experimental Protocols
Objective: To isolate the component responsible for excessive baseline noise. Materials: HPLC system with UV/Vis or DAD, degassed mobile phase (e.g., 50:50 ACN:Water, 0.1% TFA), sealed vial of water, zero-dead-volume union, opaque tubing. Procedure:
- Detector/Electronics Test: Disconnect the column. Connect the injector outlet directly to the detector via a zero-dead-volume union. Set flow rate to 1.0 mL/min with mobile phase. Record baseline for 20 minutes with detector sampling rate at 10 Hz. Calculate noise (peak-to-peak) over 1-minute segments.
- Pump/Mixer Test: Reconnect the column. Install a pre-column filter. Place the detector outlet line into a waste container. Run the method with a blank injection (mobile phase). Record baseline. Perform spectral analysis (FFT if available) to identify periodic noise frequency.
- Environmental/Light Test: Cover the detector flow cell with opaque tubing to eliminate ambient light interference. Record baseline. Compare noise levels before and after.
- Data Analysis: Compare noise amplitudes from steps 1-3. The component introducing the dominant noise source will be identified by the highest noise level under its test conditions.
Protocol 3.2: Minimizing Baseline Drift During Gradient Impurity Profiling
Objective: To establish a stable, reproducible baseline for gradient elution methods. Materials: HPLC-grade solvents, high-purity buffers (e.g., ammonium formate, phosphate), in-line degasser, thermostatted column compartment. Procedure:
- Mobile Phase Preparation: Precisely prepare buffers daily. Adjust pH at the temperature used in the method (±0.05 units). Filter all phases through 0.22 µm membranes and degass continuously with helium sparging or in-line degassing.
- System Equilibration: After initial pump priming and mixer purge, set the initial gradient conditions. Flow at 1.0 mL/min through the column for at least 10-15 column volumes before the first injection. Monitor pressure and baseline stability.
- Blank Gradient Run: Execute the full gradient method with a blank injection (dissolution solvent). Record the baseline.
- Drift Correction/Subtraction: Use the system's software to create a "blank gradient" baseline signature. Subtract this signature from subsequent sample runs, if the software allows for calibrated subtraction. Note: This is for diagnostic purposes; a validated method should inherently have low drift.
- Column Temperature Control: Ensure column compartment temperature is stable to ±0.5°C. Use a pre-heater coil if the mobile phase is not thermally equilibrated prior to the column.
Protocol 3.3: Artifact Identification and Suppression
Objective: To distinguish true impurity peaks from system-generated artifacts. Materials: DAD or LC-MS system, reference standard of API, column with different selectivity (e.g., C8 vs. C18). Procedure:
- Spectral Purity Assessment (with DAD): For every suspected impurity peak, acquire its UV spectrum across the peak (apex, upslope, downslope). Use the detector's purity algorithm (e.g., threshold match, peak homogeneity) to flag peaks where spectra are not identical, indicating co-elution or an artifact.
- Mass Detection Confirmation (with LC-MS): Operate the MS in full-scan mode. True analyte peaks will show a rational mass ion (e.g., [M+H]+). Artifacts from pump seals or tubing often show no consistent mass spectral pattern or correspond to known polymer ions (e.g., phthalates, PEG).
- Change Experimental Parameter: Alter a single parameter likely to affect artifacts but not true impurities (e.g., replace pump seal, use a different lot of mobile phase, change column temperature by 10°C). Re-inject the sample. True impurities will remain with consistent retention time trends; many artifacts will disappear or shift erratically.
Visualization of Workflows and Relationships
Title: HPLC Baseline Anomaly Troubleshooting Decision Tree
Title: Protocol for Minimizing Gradient Baseline Drift
The Scientist's Toolkit: Key Reagent and Material Solutions
Table 2: Essential Materials for Managing Baseline Performance
| Item | Function & Rationale |
|---|---|
| In-line Degasser (Helium Sparging Kit) | Removes dissolved oxygen and microbubbles from mobile phase, which are primary sources of detector noise and spikes. Continuous degassing is superior to offline sonication. |
| Pre-column In-line Filter (0.5 µm, 2 mm diameter) | Protects the column from particulate matter that can cause pressure fluctuations, block frits, and generate artifact peaks. |
| Pulse-Dampener/Active Mixer | Smoothes out pressure pulses from reciprocating pumps, directly reducing periodic noise correlated to piston stroke. Active mixers ensure homogeneous mobile phase composition. |
| Thermostatted Column Compartment (±0.1°C stability) | Maintains constant column temperature, critical for reproducible retention times and preventing baseline drift from changing analyte partitioning kinetics. |
| PEEKsil or Stainless-Steel Capillary Tubing | Reduces unwanted analyte adsorption and provides consistent, low-dead-volume connections. PEEK is inert; stainless steel is durable for high pressure. |
| HPLC-Grade Solvents & High-Purity Salts/Buffers | Minimizes UV-absorbing contaminants present in lower-grade reagents that elevate baseline absorbance and noise, especially at low wavelengths (<220 nm). |
| Guard Column (of identical stationary phase) | Traps irreversibly adsorbing impurities from samples and mobile phase, preserving the lifetime and performance of the analytical column. |
| Seal Wash Kit | For high-salt or extreme pH mobile phases, flushes buffer from pump seal area, preventing crystallization and salt damage that cause leak artifacts and noise. |
Application Notes
Within pharmaceutical impurity profiling using HPLC, system suitability tests (SSTs) are critical checkpoints to validate the analytical system's performance at the time of testing. Failures in resolution (Rs), tailing factor (T), and repeatability (%RSD) directly compromise data integrity, leading to incorrect impurity quantification and jeopardizing method validity.
1. Resolution (Rs) Failures: Insufficient resolution between critical peak pairs, particularly between an impurity and the main API peak, prevents accurate integration. Current research indicates this is often a symptom of chromatographic method parameters being at the "edge of failure." Primary causes include:
- Mobile Phase pH Drift: Degradation of silica-based columns at high pH or insufficient buffering capacity alters the ionization state of analytes.
- Column Degradation/Damage: Loss of stationary phase integrity from high pH, extreme temperatures, or particulate contamination.
- Inaccurate Mobile Phase Preparation: Slight deviations in organic modifier or buffer concentration disproportionately impact selectivity.
2. Tailing Factor (T) Failures: Peak tailing (T > 2.0 typically fails SST) indicates secondary interactions or hardware issues, increasing integration variability and lowering detection sensitivity for late-eluting impurities. Root causes are:
- Active Sites in Column: Un-capped silanol groups interacting with basic analytes.
- Inadequate Mobile Phase pH/Modifier: Incorrect pH for analyte pKa, or insufficient ionic strength/scavenger to mask silanol activity.
- Extra-Column Volume & Hardware Faults: Dead volume in fittings post-column, detector cell issues, or a worn injection valve rotor seal.
3. Repeatability (%RSD) Failures: High variability in retention time or peak area for replicate injections indicates system instability, invalidating impurity quantification. This is a systemic failure linked to:
- Incomplete System Equilibration: Especially after gradient methods or mobile phase changes.
- Inconsistent Injection Volume: Faulty autosampler syringe or seal, or sample solvent strength mismatch with mobile phase.
- Mobile Phase Delivery Issues: Pump check valve failures, leaks, or inadequate mobile phase degassing causing pump cavitation.
Data Summary Table: Common SST Failure Modes and Diagnostic Parameters
| SST Parameter | Typical Acceptance Criteria | Primary Failure Symptom | Key Diagnostic Checkpoints |
|---|---|---|---|
| Resolution (Rs) | Rs ≥ 2.0 between critical pair | Co-elution or valley between peaks > Vmin | Retention time stability; peak shape of both analytes; selectivity factor (α). |
| Tailing Factor (T) | T ≤ 2.0 | Asymmetric peak with trailing edge | Peak width at 5% height vs. 50% height; comparison across different columns. |
| Repeatability (Area %RSD) | %RSD ≤ 2.0% (n=5 or 6) | High variability in impurity peak areas | Retention time %RSD; injection volume precision test; baseline noise. |
Experimental Protocols
Protocol 1: Diagnostic and Corrective Protocol for Resolution/Tailing Failures
Objective: Systematically identify and resolve root causes of poor resolution and peak tailing.
Materials: See Research Reagent Solutions table.
Procedure:
- Initial Diagnosis:
- Inject the system suitability standard. Note the specific failing parameter.
- For Low Rs: Identify which peak pair is critical. Calculate selectivity (α) and efficiency (N).
- For High T: Measure T at 5% peak height for the main peak.
- Mobile Phase & Column Health Check:
- Prepare a fresh batch of mobile phase with precise buffer pH (±0.05 units) and organic composition.
- Equilibrate system with fresh mobile phase for 30 column volumes.
- If issues persist, replace with a new column of identical lot/type.
- If resolved with new column: The original column is degraded. Investigate method conditions (pH, temperature limits) and sample clean-up.
- Method Parameter Investigation (If Fresh Column Fails):
- For Rs: Perform a scouting run. Adjust mobile phase pH (±0.2 units) or gradient slope (±2% change in organic per minute). Monitor impact on α.
- For T: For basic analytes, increase buffer concentration to 50 mM or add 0.1% triethylamine as a silanol modifier. For acidic analytes, ensure mobile phase pH is at least 1.0 unit below analyte pKa.
- Hardware Check:
- Inspect system for loose fittings post-column. Measure system dwell volume.
- Perform a zero-volume injection (empty loop) to check for detector cell artifacts.
- Replace injection valve rotor seal if wear is suspected.
Protocol 2: Protocol for Investigating Repeatability (%RSD) Failures
Objective: Isolate and correct sources of system instability leading to high %RSD.
Materials: See Research Reagent Solutions table.
Procedure:
- Baseline Stability Test:
- Disconnect column, connect union. Run the method gradient while monitoring baseline. Excessive noise/drift indicates pump or detector issues.
- Pump Performance Verification:
- Perform a step-gradient test (e.g., 5% to 50% B in 1 min) while monitoring pressure and UV trace. Ripples indicate check valve failure.
- Prime check valves with isopropanol or replace.
- Autosampler Precision Test:
- Perform 10 consecutive injections of a well-defined standard from the same vial. Calculate %RSD for area and retention time.
- If Area %RSD is high: Inspect syringe for bubbles, replace needle seal, ensure sample homogeneity.
- If RT %RSD is high: Confirm full system equilibration (stable backpressure). Verify column oven temperature stability (±1°C).
- Mobile Phase Degassing:
- Sparge all mobile phases with helium for 10 minutes or use in-line degassing. Observe baseline for negative peaks or periodic noise.
Diagrams
Title: Systematic Troubleshooting Workflow for HPLC SST Failures
Title: Root Cause Relationships for Poor Repeatability (%RSD)
The Scientist's Toolkit: Research Reagent Solutions
| Item | Function in SST Troubleshooting |
|---|---|
| pH Buffer Standards (pH 4.0, 7.0, 10.0) | To calibrate pH meter for accurate mobile phase preparation, crucial for reproducibility and selectivity. |
| HPLC-Grade Water & Organic Solvents (ACN, MeOH) | High-purity, low-UV absorptive solvents to minimize baseline noise and ghost peaks. |
| Silanol Modifier (e.g., Triethylamine) | Added to mobile phase (0.1-0.5%) to mask active silanol sites on silica columns, reducing tailing for basic compounds. |
| Column Test Mix (USP/EP) | Contains compounds to evaluate column efficiency (N), tailing (T), and retention (k). Diagnoses column health independently of method. |
| Seal Wash Solvent (e.g., 90:10 Water:IPA) | Flushes autosampler injection seal to prevent buffer crystallization and carryover, improving area %RSD. |
| In-Line Degasser or Helium Sparging Kit | Removes dissolved air from mobile phase to prevent pump cavitation and baseline noise/drift. |
| Replacement Check Valves & Needle Seals | Critical spare parts to address common pump and autosampler failures causing retention time and area variability. |
Strategies for Improving Peak Capacity and Resolution of Critical Impurity Pairs
1. Introduction
Within pharmaceutical impurity profiling, the separation of critical impurity pairs—structurally similar compounds with nearly identical chromatographic behavior—is a paramount challenge. The resolution (Rs) and peak capacity (n) of a High-Performance Liquid Chromatography (HPLC) method directly dictate its ability to quantify these impurities accurately. This application note, framed within the broader thesis of developing robust HPLC methods for impurity profiling, details contemporary strategies and protocols to enhance these key parameters, ensuring method reliability for drug substance and product characterization.
2. Key Optimization Parameters & Quantitative Data Summary
The resolution equation, Rs = (¼) * (α - 1) * √N * (k/(1+k)), governs separation. Strategies target selectivity (α), efficiency (N), and retention factor (k). The following table summarizes the impact of various parameters.
Table 1: Optimization Strategies and Their Quantitative Impact on Resolution and Peak Capacity
| Strategy Category | Specific Parameter | Typical Adjustable Range | Primary Impact (Rs / n) | Key Consideration |
|---|---|---|---|---|
| Mobile Phase | pH (±0.2 units) | 2.0 - 8.0 (for silica) | High on α (Rs) | pKa-driven; maximizes ionization difference. |
| Mobile Phase | Organic Modifier Type | e.g., Acetonitrile vs. Methanol | Moderate on α (Rs) | Solvatochromic effects; changes H-bonding. |
| Mobile Phase | Gradient Slope (%B/min) | 0.5 - 5.0 | High on n | Shallower slopes increase n at cost of time. |
| Column | Column Temperature (°C) | 25 - 60 | Moderate on N, α (Rs) | ~2% N increase per °C; can affect α. |
| Column | Column Length (mm) | 50 - 150 | Direct on √N (Rs) | Doubling length increases N ~2x, time ~2x. |
| Column | Particle Size (µm) | 1.7 - 3.5 | High on N & n | Smaller particles increase efficiency (Van Deemter). |
| Flow Rate | Flow Rate (mL/min) | 0.2 - 1.0 (for 2.1mm) | Optimal for N (Rs) | Adjusted to Van Deemter curve minimum. |
3. Detailed Experimental Protocols
Protocol 1: Systematic Screening for Selectivity (α) Optimization
Objective: To identify the optimal combination of column chemistry and mobile phase pH for separating a critical pair of acidic/impurities.
Materials: See "Scientist's Toolkit" below. Workflow:
- Prepare stock solutions of the main drug substance and the two critical impurities at ~1 mg/mL in a suitable diluent.
- Prepare mobile phase buffers: 10 mM ammonium formate, pH 3.0; 10 mM ammonium acetate, pH 5.0; and 10 mM ammonium bicarbonate, pH 8.0. Adjust pH with formic acid or ammonium hydroxide.
- Set up a screening gradient: 5-95% organic (acetonitrile) over 20 minutes, 0.5 mL/min, 30°C, detection at 220 nm.
- Inject the impurity mix sequentially on three different column chemistries (e.g., C18, phenyl-hexyl, HILIC) at each of the three pH conditions.
- Calculate α for the critical pair in each run: α = k₂/k₁, where k = (tᵣ - t₀)/t₀.
Protocol 2: Fine-Tuning via Gradient Slope and Temperature
Objective: To maximize peak capacity (n) and resolution after initial selectivity is established.
Materials: Column and mobile phase identified from Protocol 1. Workflow:
- Using the selected column and mobile phase pH, set the starting %B to achieve a k of ~1 for the first peak of interest.
- Run three gradients with varying slopes: e.g., 0.5, 1.0, and 2.0 %B/min.
- For the optimal gradient, perform three isocratic or shallow gradient runs at 25°C, 40°C, and 55°C.
- Calculate peak capacity: n = 1 + (tG / wavg), where tG is gradient time and wavg is the average peak width at 13.4% height (in time units). Calculate Rs for the critical pair.
4. Visualization of Method Development Strategy
Title: HPLC Method Development Workflow for Impurity Separation
5. The Scientist's Toolkit
Table 2: Essential Research Reagent Solutions for Impurity Method Development
| Item | Function & Rationale |
|---|---|
| Ultra-Pure Water & HPLC-Grade Solvents | Minimizes baseline noise and ghost peaks, essential for trace impurity detection. |
| Volatile Buffers (Ammonium Formate/Acetate/Bicarbonate) | Provides pH control for ionizable compounds; compatible with MS detection if needed. |
| Stationary Phase Screening Kit | Set of columns (e.g., C18, Polar-embedded, Phenyl, HILIC) to exploit different selectivity mechanisms. |
| Precision pH Meter & Buffers | Accurate pH adjustment is critical for reproducible selectivity of ionizable analytes. |
| Thermostatted Column Compartment | Precise temperature control (±0.5°C) is necessary for reproducible retention times and efficiency. |
| Certified Reference Standards | High-purity samples of the drug substance and suspected impurities for accurate identification and quantification. |
| Low-Volume, Low-Dispersion Autosampler Vials | Reduces extra-column band broadening, preserving the efficiency gained from column optimization. |
Within the broader thesis on developing a stability-indicating High-Performance Liquid Chromatography (HPLC) method for impurity profiling in pharmaceuticals, robustness testing is a critical validation step. It systematically evaluates the method's capacity to remain unaffected by small, deliberate variations in method parameters, as per ICH Q2(R1) guidelines. This ensures reliable performance during routine use and transfer between laboratories, which is paramount for accurate quantification of impurities and degradation products in drug substances and products.
Application Notes & Protocols
1. Protocol for Designing a Robustness Test Using a Plackett-Burman Design A Plackett-Burman screening design is efficient for evaluating the main effects of multiple parameters with a minimal number of experimental runs.
Experimental Protocol:
- Step 1 – Parameter Selection: Identify critical method parameters to vary. For a reversed-phase HPLC impurity method, common parameters include: % of organic solvent in mobile phase B (±1-2%), pH of aqueous buffer (±0.1-0.2 units), column temperature (±2-3°C), flow rate (±0.1 mL/min), gradient time (±1-2%), and detection wavelength (±2-3 nm).
- Step 2 – Define Variation Ranges: Set realistic, deliberate variation ranges that represent expected fluctuations in routine operation.
- Step 3 – Experimental Design: Configure an 8-run Plackett-Burman design matrix for the 6 selected factors. Each parameter is set at a "high" (+1) or "low" (-1) level relative to the nominal method condition (0).
- Step 4 – Sample Preparation: Prepare a system suitability solution containing the active pharmaceutical ingredient (API) and key known impurities at specification levels (e.g., 0.1% w/w relative to API).
- Step 5 – Execution: Run the HPLC method according to each of the 8 experimental conditions in random order. Record chromatograms.
- Step 6 – Response Monitoring: For each run, measure critical responses: retention time of the API peak, resolution between the most critical pair of peaks, tailing factor of the API peak, and peak area of a low-level impurity.
Table 1: Example Plackett-Burman Design Matrix and Results Table showing the effect of 6 parameters (A-F) on 4 chromatographic responses across 8 experimental runs.
| Run | %Org (A) | pH (B) | Temp (C) | Flow (D) | Wavelength (E) | Grad.Time (F) | tR (API) | Resolution | Tailing |
|---|---|---|---|---|---|---|---|---|---|
| 1 | -1 | +1 | +1 | -1 | -1 | +1 | 10.2 | 4.5 | 1.05 |
| 2 | +1 | -1 | +1 | +1 | -1 | -1 | 9.8 | 3.8 | 1.12 |
| 3 | -1 | -1 | -1 | +1 | +1 | -1 | 11.1 | 5.1 | 1.01 |
| 4 | +1 | +1 | -1 | -1 | +1 | +1 | 9.5 | 4.0 | 1.08 |
| 5 | -1 | +1 | -1 | +1 | +1 | +1 | 10.8 | 4.8 | 1.03 |
| 6 | +1 | -1 | -1 | -1 | -1 | +1 | 9.7 | 3.9 | 1.10 |
| 7 | -1 | -1 | +1 | -1 | +1 | +1 | 10.5 | 4.9 | 1.02 |
| 8 | +1 | +1 | +1 | +1 | -1 | -1 | 9.3 | 3.5 | 1.15 |
2. Protocol for One-Parameter-at-a-Time (OPAT) Robustness Testing While less efficient for multifactor analysis, OPAT testing provides straightforward, interpretable data for a limited number of parameters.
Experimental Protocol:
- Step 1 – Establish Baseline: Perform six replicate injections of the system suitability solution under nominal method conditions.
- Step 2 – Systematic Variation: Change one parameter to its "high" level while keeping all others nominal. Perform three replicate injections. Return the parameter to nominal, then change it to its "low" level and perform three more replicates.
- Step 3 – Repeat: Repeat Step 2 for each parameter under investigation (e.g., column temperature, flow rate).
- Step 4 – Data Analysis: Calculate mean and relative standard deviation (RSD) for each response under each condition. Compare to acceptance criteria (e.g., RSD for peak area ≤ 2.0%; resolution ≥ 2.0).
Table 2: Example OPAT Results for Critical Responses Table summarizing the impact of individual parameter variations on method performance metrics.
| Parameter Varied | Level | Mean tR (API) | RSD Area% | Mean Resolution | Mean Tailing |
|---|---|---|---|---|---|
| Nominal | 0 | 10.0 | 0.5% | 4.5 | 1.05 |
| Column Temp. | +3°C | 9.7 | 0.6% | 4.3 | 1.04 |
| Column Temp. | -3°C | 10.4 | 0.7% | 4.7 | 1.07 |
| Flow Rate | +0.1 mL/min | 9.6 | 0.8% | 4.2 | 1.06 |
| Flow Rate | -0.1 mL/min | 10.5 | 0.9% | 4.8 | 1.05 |
| Mobile Phase pH | +0.1 | 9.9 | 1.2% | 4.1* | 1.05 |
| Mobile Phase pH | -0.1 | 10.1 | 1.5% | 4.4 | 1.06 |
*Value may be approaching a critical limit, indicating pH is a sensitive parameter.
Visualizations
Title: Robustness Testing Experimental Workflow
Title: How Parameter Variation Affects HPLC Results
The Scientist's Toolkit: Research Reagent Solutions
| Item | Function in Robustness Testing |
|---|---|
| HPLC-MS Grade Solvents (Acetonitrile, Methanol) | Ensures low UV absorbance and minimal background interference, critical for sensitive impurity detection when varying mobile phase composition. |
| High-Purity Buffer Salts (e.g., Potassium Phosphate, Ammonium Acetate) | Provides precise pH control; variations in buffer quality can affect reproducibility when testing pH robustness. |
| Pharmaceutical Secondary Standards (API and Impurities) | Certified reference materials used to prepare system suitability mixtures for accurate measurement of chromatographic responses. |
| Validated HPLC Column (C18, etc.) | The primary stationary phase; using a single, specified column from a defined lot is essential for a controlled robustness study. |
| Column Heater/Oven | Provides precise and stable temperature control, allowing deliberate, accurate variation of column temperature as a test parameter. |
| pH Meter with NIST-Traceable Buffers | Calibrates mobile phase pH accurately, fundamental for setting correct "high" and "low" pH variation levels. |
| Data Acquisition & Analysis Software (e.g., CDS) | Records chromatograms and calculates response variables (retention time, area, resolution) for statistical evaluation. |
Method Transfer Best Practices and Pitfalls from R&D to QC Laboratories
Application Notes
Within the framework of developing a robust HPLC method for impurity profiling in pharmaceuticals, the transfer from Research and Development (R&D) to Quality Control (QC) is a critical juncture. This process ensures that an analytical method, developed and validated in a research setting, performs consistently and reliably in a quality control laboratory, which is essential for routine release and stability testing. This document outlines best practices, common pitfalls, and structured protocols to facilitate a successful method transfer.
Key Quantitative Parameters for Transfer Success
The success of a method transfer is quantitatively assessed through comparative testing. Key system suitability and validation parameters must meet pre-defined acceptance criteria in both the sending (R&D) and receiving (QC) laboratories. The following table summarizes the critical parameters for an impurity profiling HPLC method.
Table 1: Critical Quantitative Parameters for HPLC Impurity Method Transfer
| Parameter | Typical Acceptance Criteria (Example) | Purpose in Transfer |
|---|---|---|
| Retention Time (RT) Shift | NMT ± 2% for main peak | Confirms method reproducibility across systems/labs. |
| Peak Area %RSD | NMT 2.0% for replicate injections | Demonstrates precision of the instrumental response. |
| Theoretical Plates (N) | NLT 2000 for the main peak | Indicates column performance and method robustness. |
| Tailing Factor (T) | NMT 2.0 for the main peak | Ensures adequate peak shape and potential for impurity separation. |
| Resolution (Rs) | NLT 2.0 between critical pair | Verifies specificity for separating impurities from API. |
| Signal-to-Noise (S/N) | NLT 10 for specified reporting threshold | Confirms sensitivity for low-level impurity detection. |
| %Recovery | 98.0–102.0% for spiked impurities | Demonstrates accuracy of the method in the new environment. |
NMT: Not More Than; NLT: Not Less Than
Core Protocol: The Method Transfer Experiment
This protocol describes a systematic approach for the comparative testing phase of an HPLC impurity method transfer.
Protocol Title: Comparative Testing for HPLC Impurity Profiling Method Transfer
Objective: To verify that the receiving laboratory (QC) can successfully execute the HPLC impurity profiling method and obtain results equivalent to those from the sending laboratory (R&D).
Materials:
- Test Sample: A homogeneous batch of drug substance or product, along with a spiked sample containing known impurities at the specification level(s).
- Reference Standards: Drug substance reference standard and qualified impurity standards.
- Mobile Phase: Prepared according to the method specification by both labs from the same source or recipe.
- HPLC Systems: Qualified systems in both laboratories (pumps, autosamplers, detectors, columns from the same manufacturer and lot if possible).
- Chromatography Data System (CDS): Method files and processing methods transferred.
Experimental Procedure:
- Pre-Transfer Agreement: Develop and sign a Method Transfer Protocol (MTP) detailing the objective, experimental design, acceptance criteria (Table 1), responsibilities, and documentation requirements.
- Knowledge Transfer: R&D provides comprehensive training to QC analysts on the method's rationale, critical parameters, and troubleshooting history. A formal method walkthrough is conducted.
- System Suitability Test (SST): Both labs perform a minimum of six replicate injections of the SST solution per the method. Calculate and compare RT, area %RSD, plate count, and tailing factor. Both must meet criteria.
- Sample Analysis: a. Both labs analyze the unspiked test sample in triplicate. Compare the impurity profile qualitatively and quantitatively. b. Both labs analyze the spiked test sample in triplicate. Calculate the recovery of each spiked impurity.
- Data Comparison and Reporting: The receiving lab compiles all data into a Method Transfer Report. Statistical comparison (e.g., t-test of means, F-test of variances) is performed on key quantitative data against the predefined acceptance criteria and the sending lab's results.
- Acceptance and Closure: If all criteria are met, the transfer is deemed successful. Any deviations are investigated, and corrective actions are taken before re-testing or method refinement.
Diagram: HPLC Method Transfer Workflow
Common Pitfalls and Mitigation Strategies
Table 2: Common Transfer Pitfalls and Mitigation
| Pitfall Category | Example | Mitigation Strategy |
|---|---|---|
| Knowledge Gap | QC analysts unaware of method's critical steps or "black box" parameters. | Mandatory, documented training and co-development of a detailed, unambiguous SOP. |
| Equipment Disparity | Different HPLC detector cell volumes, mixer types, or column heater designs. | Conduct gap analysis early. Perform instrument qualification with standard tests. Adjust method parameters if justified and validated. |
| Reagent/Column Variance | Different grades of solvents, buffer salts, or column batches affecting selectivity. | Specify brands/grades in the method. Procure columns from the same supplier/lot for transfer. |
| Data Processing Differences | Inconsistent integration parameters or calculation algorithms in CDS. | Transfer and lock electronic processing method. Manually review key chromatograms together. |
| Environmental Factors | Lab temperature/humidity affecting sensitive mobile phases (e.g., low-pH TFA). | Control and document environmental conditions. Specify preparation and shelf-life of solutions. |
Diagram: Pitfall Analysis and Decision Logic
The Scientist's Toolkit: Key Research Reagent Solutions
Table 3: Essential Materials for HPLC Impurity Method Transfer
| Item | Function & Rationale |
|---|---|
| High-Purity Reference Standards (API & known impurities) | Essential for system suitability, peak identification, and accuracy/recovery experiments. Certified purity ensures quantitative reliability. |
| HPLC-Grade Solvents & Buffers (specified brands/grades) | Critical for reproducible mobile phase preparation. Variances in UV cutoff, acidity, or trace impurities can alter baseline and selectivity. |
| Specified Chromatography Column (make, model, lot) | The stationary phase is the heart of the method. Even minor differences between columns can drastically change impurity resolution. |
| System Suitability Test (SST) Solution | A ready-to-inject solution containing key analytes to verify the entire HPLC system's performance meets method requirements before sample analysis. |
| Stable, Homogeneous Test Samples (unspiked and spiked) | Provides a consistent matrix for inter-lab comparison. Spiked samples with impurities at qualification/specification levels are vital for accuracy assessment. |
| Standardized Data Processing Template | Ensures consistent integration, calculation, and reporting of results (e.g., relative retention times, area percent), eliminating a major source of variability. |
Validating Your HPLC Method per ICH Q2(R1) and Comparing Advanced Techniques
Within a comprehensive thesis on HPLC method development for impurity profiling in pharmaceuticals, the validation of the analytical procedure is paramount. Per ICH Q2(R1) guidelines, validation provides documented evidence that the method is suitable for its intended purpose of accurately quantifying trace impurities. This article details the application notes and experimental protocols for four critical validation parameters: Specificity, Linearity, Accuracy, and Precision, framed within the context of an impurity profiling method for a hypothetical active pharmaceutical ingredient (API), "Substance X."
Specificity (Selectivity)
Objective: To unequivocally assess the analyte (impurities A, B, C) in the presence of other components, such as the API, excipients, and degradation products.
Protocol:
- Sample Preparation:
- Blank: Mobile phase.
- Placebo: Mixture of all formulation excipients.
- Standard Solution: Individual solutions of Impurity A, B, C, and API at specification level (e.g., 0.1% relative to API concentration).
- Forced Degradation Samples: Stress API under acid, base, oxidative, thermal, and photolytic conditions. Neutralize where applicable.
- Spiked Sample: Placebo spiked with impurities and API at specification level.
- Chromatographic Conditions: Use the developed HPLC method (e.g., C18 column, gradient elution, UV detection).
- Analysis: Inject all preparations and record chromatograms.
- Acceptance Criteria: The method is specific if:
- No interference (peaks) at the retention times of impurities or API in blank and placebo.
- All peaks are baseline separated (Resolution, Rs > 2.0 between all critical peak pairs).
- Peak purity tests (using a diode array detector) confirm homogeneous peaks for impurities in the stressed samples.
Table 1: Specificity Test Results for Impurity Profiling Method
| Sample Component | Retention Time (min) | Resolution from Nearest Peak | Peak Purity Index (Match Threshold > 990) | Interference? |
|---|---|---|---|---|
| Blank | N/A | N/A | N/A | No |
| Placebo | N/A | N/A | N/A | No |
| API (Substance X) | 12.5 | N/A | 998 | N/A |
| Impurity A | 9.8 | 4.2 (from Impurity B) | 997 | N/A |
| Impurity B | 10.5 | 4.2 (from A), 3.8 (from C) | 999 | N/A |
| Impurity C | 11.5 | 3.8 (from Impurity B) | 996 | N/A |
| Acid Degradation Prod. | 8.2 | 5.1 (from Impurity A) | 995 | N/A |
Linearity
Objective: To demonstrate a directly proportional relationship between analyte concentration and detector response across the specified range (e.g., from LOQ to 150% of specification level).
Protocol:
- Preparation: Prepare a minimum of 5 concentrations of each impurity (e.g., at LOQ, 25%, 50%, 100%, 125%, 150% of the specification level, which is 0.1% w.r.t. API).
- Analysis: Inject each solution in triplicate.
- Data Analysis: Plot mean peak area vs. concentration. Perform linear regression analysis.
- Acceptance Criteria: Correlation coefficient (r) > 0.998. Y-intercept not statistically significantly different from zero. Residuals are randomly distributed.
Table 2: Linearity Data for Impurity A (Range: 0.05% to 0.15%)
| Concentration (% w.r.t. API) | Mean Peak Area (n=3) | Standard Deviation |
|---|---|---|
| 0.05 (LOQ) | 12545 | 240 |
| 0.0625 | 31280 | 410 |
| 0.10 (Specification) | 50120 | 605 |
| 0.125 | 62585 | 720 |
| 0.15 | 75150 | 890 |
| Regression Results | Value | |
| Slope | 500,150 | |
| Y-Intercept | 95 | |
| Correlation Coefficient (r) | 0.9995 |
Accuracy
Objective: To determine the closeness of agreement between the value found and the value accepted as a true or reference value (recovery).
Protocol (Recovery Study):
- Preparation: Prepare placebo blends. Spike them with impurities at three levels: 50%, 100%, and 150% of the specification level (n=3 per level). Also prepare corresponding standard solutions of impurities in solvent.
- Analysis: Inject all samples and standards.
- Calculation: Calculate % Recovery for each spike level: (Measured Amount in Spiked Placebo / Theoretical Added Amount) x 100.
- Acceptance Criteria: Mean recovery between 90–110% for each impurity at each level.
Table 3: Accuracy (Recovery) Results
| Impurity | Spike Level (%) | Mean Recovery (%) (n=3) | RSD (%) |
|---|---|---|---|
| A | 50 | 98.5 | 1.2 |
| A | 100 | 99.8 | 0.9 |
| A | 150 | 101.2 | 0.8 |
| B | 50 | 97.8 | 1.5 |
| B | 100 | 100.5 | 1.1 |
| B | 150 | 99.7 | 0.7 |
Precision
Objective: To express the closeness of agreement between a series of measurements.
Protocol:
- Repeatability (Intra-day Precision): Analyze six independent sample preparations of the API spiked with impurities at 100% specification level on the same day, by the same analyst, with the same instrument.
- Intermediate Precision: Repeat the repeatability study on a different day, with a different analyst, and on a different HPLC system.
- Calculation: Calculate the % Relative Standard Deviation (%RSD) of the impurity content for each set.
- Acceptance Criteria: %RSD ≤ 5.0% for each impurity.
Table 4: Precision Study Results
| Precision Type | Impurity A Content (% w/w) Mean (n=6) | Impurity A %RSD | Impurity B Content (% w/w) Mean (n=6) | Impurity B %RSD |
|---|---|---|---|---|
| Repeatability (Day 1, Analyst A, System 1) | 0.099 | 1.8 | 0.101 | 2.1 |
| Intermediate Precision (Day 2, Analyst B, System 2) | 0.102 | 2.3 | 0.098 | 2.5 |
| Overall (Pooled Data) | 0.1005 | 2.2 | 0.0995 | 2.4 |
Experimental Workflow for ICH Q2(R1) Validation
Title: ICH Q2(R1) Validation Workflow for HPLC Method
The Scientist's Toolkit: Key Research Reagent Solutions
Table 5: Essential Materials for Impurity Profiling Method Validation
| Item | Function & Rationale |
|---|---|
| High-Purity Reference Standards (API, Impurities A, B, C) | Essential for accurate identification, linearity, and accuracy studies. Certified purity ensures reliable quantification. |
| Chromatographically Pure Solvents (HPLC-grade Acetonitrile, Methanol, Water) | Minimizes baseline noise and ghost peaks, ensuring method specificity and detector stability. |
| Buffer Salts (e.g., Potassium Dihydrogen Phosphate, Ammonium Acetate) | Used in mobile phase to control pH, influencing selectivity and peak shape for ionizable impurities. |
| Forced Degradation Reagents (0.1M HCl, 0.1M NaOH, 3% H₂O₂) | Used in specificity studies to generate degradation products and prove method stability-indicating capability. |
| Solid-Phase Extraction (SPE) Cartridges (C18, Mixed-Mode) | May be used for sample clean-up of complex formulations to remove interfering excipients before HPLC analysis. |
| Certified Volumetric Glassware & Micropipettes | Critical for accurate and precise preparation of standard and sample solutions for all quantitative parameters. |
| pH Meter with Certified Buffer Solutions | Ensures accurate and reproducible mobile phase pH preparation, a key factor in method robustness. |
| Diode Array Detector (DAD) | Enables peak purity assessment by comparing spectra across a peak, a crucial tool for confirming specificity. |
Determining Limits of Detection (LOD) and Quantification (LOQ) for Trace Impurities.
Application Notes and Protocols
Within the broader thesis research on developing a robust, stability-indicating HPLC method for impurity profiling of novel pharmaceutical compounds, accurately determining the Limits of Detection (LOD) and Quantification (LOQ) for trace-level process-related impurities and degradation products is paramount. This protocol details the experimental and statistical approaches for establishing these limits, ensuring the method's suitability for monitoring impurities at levels mandated by ICH Q3B(R2) guidelines.
Theoretical and Regulatory Framework
The LOD is the lowest concentration of an analyte that can be detected but not necessarily quantified under the stated experimental conditions. The LOQ is the lowest concentration that can be quantified with acceptable precision and accuracy (typically RSD ≤ 5% and accuracy of 80-120%). For impurity profiling, LOQ must be at or below the reporting threshold (e.g., 0.05% or 0.10%).
Experimental Protocols for Determination
Three primary methodologies are employed, each with detailed protocols below.
Protocol 2.1: Signal-to-Noise Ratio (S/N) Method This is a practical, chromatographic approach suitable for methods where baseline noise is measurable and consistent.
- Materials: HPLC system with suitable detector (typically UV or PDA), analytical column, mobile phases, stock solution of analyte (impurity) and API.
- Procedure:
- Prepare a spiked sample of the impurity at a concentration near the expected LOQ (e.g., at the reporting threshold).
- Inject the sample and record the chromatogram.
- Measure the peak-to-peak noise (N) over a region free of peaks, typically over a distance equal to 20 times the peak width at baseline.
- Measure the height of the analyte peak (H).
- Calculate S/N = H / N.
- An S/N ratio of 3:1 is generally accepted for LOD, and 10:1 for LOQ.
- If the S/N does not meet the criteria, prepare and inject samples at different concentrations to empirically determine the concentrations yielding S/N=3 and S/N=10.
Protocol 2.2: Standard Deviation of the Response and the Slope This statistical method, recommended by ICH Q2(R1), is based on the standard deviation of the response (y-intercept) and the slope of the calibration curve.
- Materials: As above, with precise standard preparation capabilities.
- Procedure:
- Prepare a minimum of five independent spiked samples of the impurity at the expected LOQ level (or a very low level in the linear range).
- Analyze all samples and generate a linear calibration curve (Response vs. Concentration) using low-level standards.
- Calculate the standard deviation (SD) of the y-intercepts of regression lines or the residual standard deviation of the regression line.
- Calculate using the formulae:
- LOD = 3.3 * (SD / S)
- LOQ = 10 * (SD / S) Where SD is the standard deviation of the response and S is the slope of the calibration curve.
Protocol 2.3: Visual Inspection and Empirical Determination Used as a supportive or preliminary method.
- Procedure:
- Prepare a series of spiked impurity solutions at descending concentrations.
- Inject each solution and identify the lowest concentration at which the peak is reliably detectable (LOD) and the lowest concentration at which quantitative measurements can be made with predefined precision (e.g., RSD < 5% for six replicate injections) (LOQ).
Table 1: Comparison of LOD/LOQ Determination Methods
| Method | Key Principle | Advantages | Disadvantages | Typical Use Case in Thesis Research |
|---|---|---|---|---|
| Signal-to-Noise (S/N) | Direct measurement from chromatogram. | Simple, quick, chromatographically relevant. | Subjective noise measurement; requires representative baseline. | Initial method validation; routine verification of sensitivity. |
| SD of Response/Slope | Statistical estimation from calibration data. | Robust, statistical basis; compliant with ICH. | Requires preparation of multiple low-level samples. | Final validation report; regulatory submission data package. |
| Visual/Empirical | Practical assessment of detectability. | Intuitive, directly observed. | Lacks statistical rigor; subjective. | Preliminary method development scoping. |
Table 2: Example Data Set from Thesis Work (Impurity A in Compound X)
| Determination Method | Calculated LOD (ng/mL) | Calculated LOD (% w/w to API) | Calculated LOQ (ng/mL) | Calculated LOQ (% w/w to API) | Meets Reporting Threshold (0.10%)? |
|---|---|---|---|---|---|
| S/N Ratio | 15.2 | 0.030% | 46.5 | 0.093% | Yes |
| SD/Slope | 12.8 | 0.026% | 38.9 | 0.078% | Yes |
| Empirical (n=6) | ~18.0 | 0.036% | ~50.0 | 0.100% | Yes |
The Scientist's Toolkit
Table 3: Key Research Reagent Solutions & Materials
| Item | Function & Specification |
|---|---|
| High-Purity Reference Standards | Certified impurities and API for accurate calibration curve generation. |
| HPLC-Grade Solvents | Mobile phase components (acetonitrile, methanol, water) to minimize baseline noise and artifact peaks. |
| Volumetric Glassware (Class A) | For precise preparation of stock and spiked solutions, critical for SD/Slope method accuracy. |
| Stable, Low-Drift UV/PDA Detector | Essential for reliable signal measurement at trace levels with minimal noise. |
| Data Acquisition/Processing Software | For precise measurement of peak height/area and baseline noise (S/N method). |
Experimental and Logical Workflows
Title: Decision Workflow for LOD/LOQ Determination in Impurity Profiling
Title: Relationship Between Sensitivity, Noise, and Calculated LOD/LOQ
Assessing Method Robustness and System Suitability as Ongoing Verification
Within the development and lifecycle management of an HPLC method for pharmaceutical impurity profiling, method validation is a discrete event, while ongoing verification ensures continual reliability. This application note positions the assessment of method robustness and system suitability as the core operational mechanism for this verification. The broader thesis posits that a well-characterized robustness space, monitored by strategically designed system suitability tests (SST), provides a scientific and regulatory-compliant framework for ensuring data integrity throughout the method's application in drug development.
Key Concepts & Application Framework
Method Robustness: The measure of a method's capacity to remain unaffected by small, deliberate variations in procedural parameters. It defines the operational design space (ODS) where the method is valid without requiring re-validation.
System Suitability: A set of analytical checks performed prior to or during sample analysis to verify that the total analytical system functions adequately for the intended application.
Thesis Integration: For impurity profiling, the critical quality attributes (CQAs) are resolution, tailing factor, and precision of quantitation for known and potential impurities. Robustness testing defines the allowable limits for instrumental parameters (e.g., flow rate, column temperature, mobile phase pH) that still meet these CQAs. SST parameters are then derived from the worst-case conditions within this ODS, serving as a daily check for system performance within the verified robustness space.
Experimental Protocols
Protocol 1: Design of Experiments (DoE) for Robustness Assessment
- Objective: To systematically evaluate the effect of key HPLC parameters on separation CQAs.
- Materials: Qualified HPLC system, reference standards (API and all available impurity standards), columns from at least two different lots/batches.
- Method:
- Identify Critical Factors: Select 5-7 factors for evaluation (e.g., Flow Rate (±0.1 mL/min), Column Temperature (±2°C), Mobile Phase pH (±0.1 units), Gradient Time (±1-2%), Wavelength (±2 nm)).
- Select DoE Model: A fractional factorial (e.g., Plackett-Burman) or central composite design is appropriate for screening.
- Prepare Solutions: Prepare a system suitability solution containing the API and key impurities at specification level (e.g., 0.1%).
- Execute Experiments: Run the method according to the experimental design matrix.
- Data Analysis: For each run, record CQAs: Resolution (Rs) between critical pair, tailing factor (Tf) for main peak, plate count (N), and retention time (tR) of the main peak.
- Define ODS: Using statistical analysis (e.g., ANOVA, Pareto charts), identify factors with significant effects. Establish permissible ranges for each factor where all CQAs meet pre-defined acceptance criteria (e.g., Rs > 2.0, Tf < 2.0).
Protocol 2: Derivation and Execution of System Suitability Test
- Objective: To create an SST protocol that monitors the method's performance within the verified ODS.
- Materials: System suitability test solution (SSTS), qualified HPLC column.
- Method:
- Set SST Parameters from Robustness Data: Define SST criteria based on the worst-case results observed within the ODS during Protocol 1. Include a safety margin.
- Prepare SSTS: A mixture of the API and critical impurities at concentrations relevant to the reporting threshold (e.g., 0.05% or 0.1%).
- Injection Sequence: Prior to sample batch analysis, inject six replicates of the SSTS.
- Evaluation Criteria (Example):
- Relative Standard Deviation (RSD): Retention time (tR) of API peak (RSD ≤ 1.0%).
- Theoretical Plates (N): For API peak (N > 2000).
- Tailing Factor (Tf): For API peak (Tf ≤ 2.0).
- Resolution (Rs): Between the critical pair of peaks (Rs ≥ 2.0).
- Signal-to-Noise (S/N): For a specified impurity at the reporting threshold (S/N ≥ 10).
Table 1: Summary of Robustness Testing Effects on Critical Quality Attributes (CQAs)
| Varied Parameter | Tested Range | Effect on Resolution (Critical Pair) | Effect on Tailing Factor (API) | Conclusion (Within ODS?) |
|---|---|---|---|---|
| Flow Rate | ±0.1 mL/min | ΔRs < 0.3 | ΔTf < 0.1 | Yes |
| Column Temp. | ±2°C | ΔRs < 0.5 | ΔTf < 0.1 | Yes |
| Mobile Phase pH | ±0.1 units | ΔRs > 1.0* | ΔTf < 0.2 | *Critical - Narrow Range |
| Gradient Slope | ±2% | ΔRs < 0.4 | ΔTf < 0.1 | Yes |
| Detection Wavelength | ±3 nm | N/A (Impurity S/N varies) | N/A | Yes (for identity confirmed impurities) |
*Indicates a critical parameter requiring tight control in the SST.
Table 2: Derived System Suitability Test (SST) Acceptance Criteria
| SST Parameter | Acceptance Criterion | Rationale (Linked to Robustness) |
|---|---|---|
| Retention Time RSD (n=6) | ≤ 1.0% | Verifies system precision under normal variation. |
| Theoretical Plates (API) | > 2000 | Ensures column performance is within acceptable efficiency limits. |
| Tailing Factor (API) | ≤ 2.0 | Monitors column integrity and mobile phase suitability. |
| Resolution (Critical Pair) | ≥ 1.8 | Set below validation spec (2.0) as an early warning of trending failure. |
| S/N (0.1% Impurity) | ≥ 10 | Confirms sensitivity is maintained for impurity detection. |
Visualization: The Ongoing Verification Workflow
Diagram 1: Ongoing Verification Workflow (96 chars)
The Scientist's Toolkit: Research Reagent Solutions
Table 3: Essential Materials for Robustness & SST Studies in Impurity Profiling
| Item | Function in Context |
|---|---|
| Pharmaceutical Reference Standards (API & Impurities) | Essential for identifying peaks, determining relative retention times, and establishing response factors for accurate quantitation. |
| System Suitability Test Solution (SSTS) | A mixture of API and key impurities at defined levels used to verify chromatography performance meets pre-set criteria before sample analysis. |
| HPLC Columns from Multiple Lots | Used in robustness testing to assess method performance across expected column variability, ensuring the method is not column-specific. |
| Buffered Mobile Phase Components (High-purity salts, pH meters) | Critical for methods sensitive to pH; small variations are a key factor in robustness testing for ionizable compounds. |
| Class A Volumetric Glassware & Certified Pipettes | Ensures accurate and precise preparation of solutions for robustness and SST studies, minimizing introduction of variability. |
| Data Acquisition & Chromatography Data System (CDS) | Software capable of executing sequence runs, calculating system suitability parameters automatically, and managing large DoE data sets. |
| Statistical Analysis Software | For designing DoE matrices and analyzing robustness data to identify significant factors and define the operational design space. |
Within a pharmaceutical research thesis focused on impurity profiling via HPLC, the evolution from High-Performance Liquid Chromatography (HPLC) to Ultra-Performance Liquid Chromatogy (UPLC/HPLC) represents a pivotal technological shift. This application note details the core benefits of UPLC—increased speed, resolution, and sensitivity—providing quantitative comparisons, validated protocols for impurity profiling, and essential resource guides for implementation.
Comparative Performance Data
The advantages of UPLC over traditional HPLC are quantifiable across key chromatographic parameters.
Table 1: Quantitative Comparison of HPLC vs. UPLC for Impurity Profiling
| Parameter | Traditional HPLC (5 µm) | UPLC (1.7 µm) | Improvement Factor |
|---|---|---|---|
| Particle Size | 3.5 - 5 µm | 1.7 - 1.8 µm | ~3x smaller |
| Operational Pressure | Up to 400 bar | Up to 1000-1500 bar | 2.5-3.75x higher |
| Typical Analysis Time | 10-30 minutes | 3-10 minutes | ~3x faster |
| Peak Capacity | ~100-200 | ~200-500 | ~2x higher |
| Detection Sensitivity (S/N) | Baseline | Up to 3-5x increase | Up to 5x |
| Solvent Consumption per Run | ~5-10 mL | ~1-3 mL | ~70% reduction |
Experimental Protocols
Protocol 1: Method Transfer from HPLC to UPLC for Impurity Profiling
This protocol outlines the systematic conversion of an existing HPLC impurity method to UPLC.
Objective: To achieve equivalent or superior separation of process-related impurities and degradation products in an active pharmaceutical ingredient (API) with reduced analysis time.
Materials & Equipment:
- UPLC system with photodiode array (PDA) detector.
- UPLC column: C18, 1.7 µm, 2.1 x 50 mm.
- Original HPLC method: C18, 5 µm, 4.6 x 150 mm, 1.0 mL/min flow rate.
- Sample: API spiked with known impurities at 0.1% level.
Procedure:
- Calculate Scaling Factor: Use the column volume conversion formula. For constant linear velocity, the flow rate (F) scales by the square of the column radius ratio.
- Factor = (rUPLC² * LUPLC) / (rHPLC² * LHPLC)
- For the columns above: ( (1.05)² * 50 ) / ( (2.3)² * 150 ) ≈ 0.07
- Scaled UPLC Flow Rate: 1.0 mL/min * 0.07 ≈ 0.14 mL/min.
- Adjust Gradient: Maintain the same number of column volumes. Reduce gradient time proportionally to the change in column void time (t0).
- t0 = Column Volume / Flow Rate.
- Calculate t0 for both systems and scale each gradient segment by the ratio (t0UPLC / t0HPLC).
- Inject Appropriately: Reduce injection volume by the same volume scaling factor (0.07) or based on column mass loadability. A 10 µL HPLC injection scales to ~0.7 µL on UPLC.
- Optimize Detection: Adjust PDA detector settings: reduce data acquisition rate to 20 pts/sec and filter width to maintain sensitivity without introducing noise.
- Execute Run: Perform the scaled method. Monitor backpressure and peak shape.
- Validate: Ensure resolution of critical impurity pair meets requirements (R_s > 2.0). Perform system suitability testing.
Protocol 2: Forced Degradation Study with Enhanced UPLC-PDA/MS Sensitivity
This protocol leverages UPLC’s sensitivity and speed for rapid profiling of degradation products.
Objective: To identify and characterize low-level degradation impurities generated under stress conditions.
Materials & Equipment:
- UPLC system coupled with PDA and Quadrupole Time-of-Flight (Q-ToF) Mass Spectrometer.
- Column: HSS T3, 1.8 µm, 2.1 x 100 mm.
- Mobile Phase: A: 0.1% Formic acid in water; B: 0.1% Formic acid in acetonitrile.
- Stressed API samples (acid, base, oxidative, thermal, photolytic).
Procedure:
- Chromatographic Separation:
- Gradient: 5-95% B over 10 minutes.
- Flow Rate: 0.4 mL/min.
- Column Temp: 40°C.
- Injection Volume: 2 µL (API at 1 mg/mL).
- PDA Detection: Scan 210-400 nm.
- Mass Spectrometric Detection:
- Ionization Mode: Electrospray Ionization (ESI), positive and negative modes.
- Capillary Voltage: 3.0 kV.
- Source Temp: 150°C.
- Desolvation Temp: 500°C.
- Cone Gas Flow: 50 L/hr.
- Desolvation Gas Flow: 800 L/hr.
- Mass Range (ToF): 50-1200 m/z.
- Lock Mass: Leucine enkephalin for real-time calibration.
- Data Analysis:
- Use chromatography software to align peaks across stress samples.
- Extract ion chromatograms (EICs) for potential degradation products.
- Compare accurate mass and MS/MS fragments with proposed structures for identification.
Visualization of Workflows
The Scientist's Toolkit: Research Reagent Solutions
Table 2: Essential Materials for UPLC Impurity Profiling
| Item | Function & Description |
|---|---|
| Acetonitrile (LC-MS Grade) | Low-UV absorbance, minimal ion suppression for MS detection. Primary organic mobile phase component. |
| Ammonium Formate/Acetate (MS Grade) | Volatile buffer salts for mobile phase pH control in MS-compatible methods. |
| Formic Acid (MS Grade) | Common volatile acid additive (typically 0.1%) to improve protonation and peak shape in positive ion mode MS. |
| C18 UPLC Columns (1.7-1.8 µm) | Core separation media. Sub-2µm particles provide high efficiency. Variants (e.g., BEH for pH stability, HSS for polar compounds) are selected based on analyte. |
| Vial Inserts with Polymer Feet | Minimize sample volume (e.g., 250 µL inserts) and ensure proper needle reach in low-volume vials, critical for low injection volumes. |
| Reference Standard of API & Impurities | Critical for system suitability, peak identification, and method validation. Used to establish relative retention times (RRT) and response factors. |
| Mass Spectrometry Tuning & Calibration Solution | Standard mix (e.g., sodium formate, leucine enkephalin) for accurate mass calibration and instrument performance verification in MS detection. |
| Deionized Water (18.2 MΩ·cm) | Ultrapure water from a validated system to prevent contamination, baseline noise, and column degradation. |
The Role of LC-MS and LC-MS/MS for Impurity Identification and Structural Elucidation
Within the broader thesis on HPLC method development for impurity profiling in pharmaceuticals, Liquid Chromatography-Mass Spectrometry (LC-MS and tandem LC-MS/MS) stands as the definitive orthogonal technique for identification and structural elucidation. While HPLC-UV provides quantitative data on impurity levels, it offers limited structural information. LC-MS bridges this gap by combining the separation power of HPLC with the mass-specific detection and structural interrogation capabilities of mass spectrometry.
Key Applications:
- Identification of Unknown Impurities: Determining the molecular weight and proposing structures for impurities detected by HPLC-UV but not present in reference standards.
- Degradation Pathway Elucidation: Using forced degradation studies to generate impurities and employing MS/MS to fragment them, mapping degradation pathways (e.g., hydrolysis, oxidation, photolysis).
- Genotoxic Impurity (GTI) Assessment: Sensitive and selective monitoring and identification of low-level GTIs, often requiring high-resolution MS (HRMS) for exact mass confirmation.
- Metabolite Identification: Although more common in bioanalysis, the principles are applied to identify process-related impurities that are metabolic-like.
- Structural Confirmation of Synthetic Byproducts: Differentiating isomers and elucidating the structures of synthesis intermediates carried through the manufacturing process.
Instrumentation Workflow: The general workflow involves the separation of the sample by reversed-phase HPLC, ionization (typically Electrospray Ionization - ESI), mass analysis (by quadrupole, Time-of-Flight - TOF, or Orbitrap systems), and targeted fragmentation in MS/MS mode for structural details.
Table 1: Comparison of LC-MS/MS Systems for Impurity Analysis
| System Type | Mass Accuracy (ppm) | Resolving Power | Dynamic Range | Key Application in Impurity Profiling |
|---|---|---|---|---|
| Single Quadrupole LC-MS | 100-500 | Unit (Low) | ~10³ | Molecular weight confirmation, simple purity checks. |
| Triple Quadrupole LC-MS/MS (QQQ) | 100-500 | Unit (Low) | ~10⁵ | Targeted, quantitative analysis of known impurities (e.g., GTIs) with high sensitivity using MRM. |
| Quadrupole-Time of Flight (Q-TOF) | <5 | 20,000 - 50,000 (High) | ~10⁴ | Unknown impurity identification, exact mass measurement, formula assignment, non-targeted screening. |
| Orbitrap-based LC-HRMS | <3 | 60,000 - 500,000 (Very High) | ~10³ - 10⁴ | Definitive structural elucidation, complex impurity characterization, distinction of isobaric species. |
Table 2: Common Impurity Types and Typical LC-MS/MS Signatures
| Impurity Type | Origin | Key LC-MS/MS Data Points |
|---|---|---|
| Process-Related (Starting materials, intermediates) | Synthesis | [M+H]+ consistent with suspected structure; MS/MS fragments match synthetic pathway. |
| Degradation Products | Stress Conditions (acid/base/oxidative) | Mass shift from API (e.g., +16 Da for oxidation, +18 for hydrolysis, -16 for reduction). Diagnostic fragments indicate site of modification. |
| Dimer/Aggregates | Formulation or Storage | m/z at 2x (or n x) molecular weight of API. May dissociate in ionization source. |
| Isomers | Synthesis or Degradation | Identical molecular weight and similar MS/MS, but differentiated by retention time and possibly fragment intensity ratios. |
Experimental Protocols
Protocol 1: General Workflow for Impurity Identification using LC-Q-TOF
Objective: To separate, detect, and propose a structure for an unknown impurity observed at 0.15% in a stability sample of an active pharmaceutical ingredient (API).
Materials: See "The Scientist's Toolkit" below.
Method:
- HPLC Separation:
- Use the developed impurity-profiling HPLC method (typically C18 column, 150 x 4.6 mm, 3.5 µm).
- Modify the method for MS compatibility: replace non-volatile buffers (e.g., phosphate) with volatile alternatives (e.g., ammonium formate, ammonium acetate). Use formic acid or trifluoroacetic acid for pH adjustment.
- Split the flow post-column if necessary (~0.5 mL/min to ESI source).
- MS Data Acquisition:
- Ionization: Use ESI in positive and/or negative mode. Set source parameters (gas temp, flow, nebulizer, capillary voltage) using the API for optimization.
- Full Scan MS (TOF): Acquire data over m/z 100-1200 with high resolution (>20,000 FWHM) to obtain exact masses of all components.
- Auto-MS/MS (Information Dependent Acquisition - IDA): Set criteria to trigger MS/MS on ions above an intensity threshold (e.g., 1000 counts) not from the API. Fragment using collision-induced dissociation (CID) with a rolling collision energy (e.g., 20-40 eV).
- Data Analysis:
- Process the total ion chromatogram (TIC) and extracted ion chromatograms (EICs) for the unknown.
- Using the exact mass of the [M+H]+ ion, generate a list of possible elemental formulas (with constraints for drug-like compounds: C, H, N, O, S, etc.).
- Interpret the MS/MS spectrum: assign key fragments, propose cleavages, and compare to the fragmentation pattern of the parent API to identify the likely site of modification.
- Propose a chemical structure consistent with the HPLC retention time (polarity), exact mass, and MS/MS fragments.
Protocol 2: Targeted Method for Quantifying a Genotoxic Impurity using LC-MS/MS (MRM)
Objective: To develop a validated method for the quantification of a sulfonate ester genotoxic impurity at a level of 1 ppm relative to the API.
Method:
- Sample Preparation: Prepare API samples at 50 mg/mL. Use standard addition for calibration curves of the impurity from 0.05 to 2.0 ng/mL (equivalent to 0.1-4 ppm).
- LC Separation: Use a polar-embedded C18 column for retention. Mobile Phase A: 0.1% Formic acid in water; B: 0.1% Formic acid in acetonitrile. Fast gradient: 5% B to 95% B over 5 minutes. Flow: 0.6 mL/min.
- MS/MS Method Development:
- Directly infuse a standard of the impurity to optimize ESI parameters (typically positive mode for esters).
- Perform a product ion scan to identify 2-3 characteristic fragment ions.
- Optimize MRM transitions: Select the most intense precursor > product ion transition as the quantifier and a second as the qualifier. Optimize collision energy for each.
- Example MRM: Quantifier: m/z 155 > 93 (CE 15 eV), Qualifier: m/z 155 > 65 (CE 25 eV).
- Analysis: Run samples in MRM mode. Quantify using the quantifier ion peak area against the calibration curve. Confirm identity via the qualifier/quantifier ion ratio.
Visualization Diagrams
Diagram 1: LC-MS Impurity Profiling Workflow
Diagram 2: Key Impurity Fragmentation Pathways
The Scientist's Toolkit: Research Reagent Solutions
Table 3: Essential Materials for LC-MS Impurity Identification
| Item | Function & Rationale |
|---|---|
| LC-MS Grade Water & Acetonitrile/Methanol | Minimizes chemical noise and background ions, crucial for detecting low-level impurities. |
| Volatile Buffers (Ammonium formate/acetate, Formic acid, TFA) | Replace non-volatile HPLC buffers to prevent source contamination and ion suppression in the MS. |
| C18 or Polar-Embedded C18 HPLC Columns (e.g., 150 x 2.1/4.6 mm, 3-5 µm) | Standard workhorse columns for small molecule pharmaceutical separations compatible with MS. |
| Drug Substance & Placebo | Required for control experiments to distinguish API-related impurities from excipient-related signals. |
| Forced Degradation Samples (acid, base, oxidative, thermal, photolytic) | Generate a range of degradation impurities for structural investigation and method robustness testing. |
| High-Purity Nitrogen & Argon Gas | Nitrogen for source drying and nebulizing gas; Argon as the common collision gas for CID in MS/MS. |
| Accurate Mass Calibrant Solution | A standard mix (e.g., sodium formate) for internal calibration of TOF or Orbitrap systems to ensure <5 ppm mass accuracy. |
| Structural Elucidation Software (e.g., [M+h]+ Calculators, Fragment Predictors) | Tools to generate candidate formulas from exact mass and predict/compare fragmentation patterns. |
Comparing Compendial (Pharmacopeial) Methods vs. In-House Developed Methods
Within the broader thesis on HPLC method development for impurity profiling in pharmaceuticals, the choice between implementing a pharmacopeial (compendial) method or developing an in-house validated method is critical. This decision impacts regulatory strategy, analytical performance, resource allocation, and time-to-market. Compendial methods are official methods published in recognized pharmacopeias (e.g., USP, Ph. Eur., JP). In-house methods are developed internally to meet specific analytical needs not addressed by compendia.
Key Comparative Analysis
Table 1: Core Comparison of Compendial vs. In-House Methods
| Aspect | Compendial Method | In-House Developed Method |
|---|---|---|
| Regulatory Acceptance | High; pre-approved for monograph substances. Requires verification. | Requires full validation (ICH Q2(R1)) and justification. |
| Development Time/Cost | Low (primarily verification). | High (requires extensive R&D and validation). |
| Flexibility | None; must be followed exactly as prescribed. | High; can be optimized for specific sample matrix and impurity profile. |
| Specificity for Sample | May be suboptimal for a specific drug product formulation. | Tailored to the specific API, formulation, and expected impurities. |
| IP and Control | Public knowledge. | Proprietary; company controls knowledge and modifications. |
| Applicability | Ideal for well-established APIs with published monographs. | Essential for new chemical entities (NCEs), novel formulations, or when compendial method is inadequate. |
| Validation Requirement | Verification of suitability under actual conditions of use (USP <1226>). | Full validation as per ICH Q2(R1) guidelines. |
Table 2: Typical Performance Data Comparison (Hypothetical Case: Impurity Profiling of Acetaminophen)
| Performance Parameter | USP Method for Acetaminophen | In-House Optimized Method |
|---|---|---|
| Run Time | 25 minutes | 12 minutes |
| Resolution (Critical Pair) | 1.8 | 2.5 |
| Number of Impurities Detected | 4 | 7 |
| LOQ for Key Impurity | 0.05% | 0.02% |
| Column Used | L1 (C18), 250 x 4.6 mm, 5 µm | Polar-embedded C18, 100 x 4.6 mm, 2.7 µm |
| Mobile Phase Cost/Run | $5.20 | $3.80 |
Experimental Protocols
Protocol 1: Verification of a Compendial HPLC Method (USP <1226>)
Objective: To demonstrate that a compendial method is suitable for use under actual conditions of use (specific instrument, analyst, laboratory).
Materials: See "The Scientist's Toolkit" below.
Procedure:
- Acquire Method: Obtain the latest version of the pharmacopeial monograph (e.g., USP-NF online). Document all method parameters: column type, dimensions, and packing (L-number); mobile phase composition and pH; flow rate; injection volume; column temperature; detection wavelength; and gradient profile.
- System Suitability Test (SST): Prepare the system suitability solution as specified in the monograph (typically a mixture of the drug substance and known impurities). Inject the specified number of replicates.
- Evaluation: Calculate and compare SST parameters to monograph requirements. Typical parameters include:
- Resolution: Between specified peaks.
- Tailing Factor: For the main peak.
- Relative Standard Deviation (RSD): For peak area or retention time of the main peak from replicate injections.
- Analysis of Sample: Analyze the test sample (drug substance or product) as per the monograph procedure.
- Documentation: Prepare a verification report confirming the method meets all SST criteria and is suitable for its intended use.
Protocol 2: Development and Validation of an In-House HPLC Method for Impurity Profiling
Objective: To develop a selective, sensitive, and robust HPLC method for the separation and quantification of impurities in a new drug substance (ICH Q3A/B).
Phase 1: Scouting and Optimization
- Literature and Knowledge Review: Analyze chemical structures of API and known impurities (process-related, degradation).
- Initial Conditions: Based on API solubility and pKa, select a starting buffer (e.g., phosphate or ammonium formate, pH 3-7) and organic modifier (acetonitrile or methanol). Use a generic gradient (e.g., 5-95% organic over 20 min) on a versatile column (e.g., C18).
- Design of Experiments (DoE): Use a fractional factorial design to optimize critical parameters: pH of aqueous buffer (±0.5 units), gradient slope, column temperature (±5°C). Evaluate responses: resolution of all critical pairs, overall run time.
- Final Method Conditions: Based on DoE results, define the final isocratic or gradient method.
Phase 2: Analytical Method Validation (ICH Q2(R1))
- Specificity: Inject blank, placebo, API spiked with all available impurity standards, and stress samples (forced degradation: acid, base, oxidation, heat, light). Demonstrate peak purity (e.g., via PDA) and baseline separation of all critical impurities.
- Linearity & Range: Prepare standard solutions of API and each impurity at minimum 5 concentration levels (e.g., from LOQ to 120% of specification). Plot peak area vs. concentration. Calculate correlation coefficient (r) and y-intercept.
- Accuracy (Recovery): Spike placebo with known amounts of impurities at three levels (e.g., 50%, 100%, 150% of specification). Calculate % recovery for each impurity.
- Precision:
- Repeatability: Inject 6 replicates of a sample spiked at 100% specification. Calculate RSD of impurity content.
- Intermediate Precision: Repeat the study on a different day, with a different analyst and instrument. Compare results.
- Detection and Quantitation Limits (LOD/LOQ): Determine by signal-to-noise ratio (S/N=3 for LOD, S/N=10 for LOQ) or based on standard deviation of the response and slope.
- Robustness: Deliberately vary key method parameters (flow rate ±0.1 mL/min, column temperature ±2°C, organic phase composition ±2%) and assess impact on resolution of critical pair.
Visualization of Decision and Workflow
Title: Decision and Workflow for HPLC Method Selection
The Scientist's Toolkit: Key Research Reagent Solutions
Table 3: Essential Materials for HPLC Impurity Method Development & Verification
| Item | Function/Benefit | Example/Criteria |
|---|---|---|
| HPLC/UHPLC System | Instrumentation for separation and detection. | System with quaternary pump, autosampler, column oven, and PDA/UV detector. Low-dispersion for UHPLC. |
| Pharmaceutical Columns | Stationary phases for selectivity. | C18, phenyl, polar-embedded, HILIC columns. Sub-2µm or core-shell particles for efficiency. |
| HPLC-Grade Solvents | Mobile phase components. | Acetonitrile, methanol, water (low UV absorbance, high purity). |
| Buffer Salts & Additives | Control pH and ion-pair interactions. | Potassium phosphate, ammonium formate/acetate, trifluoroacetic acid (TFA). |
| Reference Standards | For identification and quantification. | API primary standard, certified impurity standards (from USP, EP, or reliable supplier). |
| Forced Degradation Reagents | To generate degradation impurities for specificity. | 0.1M HCl/NaOH, 3% H2O2, heat (e.g., 60°C), UV light chamber. |
| Volumetric Glassware | Precise solution preparation. | Class A pipettes, volumetric flasks. |
| Method Validation Software | For statistical analysis of validation data. | Empower, Chromeleon, or standalone statistical packages for linearity, precision, etc. |
Conclusion
Effective HPLC impurity profiling is a cornerstone of modern pharmaceutical quality by design, ensuring patient safety and regulatory compliance. This guide has traversed the journey from understanding the foundational importance of impurities and regulatory mandates, through a systematic method development and application process. It highlighted practical troubleshooting to maintain method integrity and concluded with the rigorous validation required for regulatory submission. The integration of forced degradation studies and robustness testing strengthens the predictive power of the control strategy. Looking forward, the field is evolving towards hyphenated techniques like LC-MS for definitive identification and the adoption of advanced separation platforms like UPLC for higher throughput. Furthermore, the principles of analytical quality by design (AQbD) and the use of modeling software are set to make method development more predictive and efficient. Ultimately, a well-designed, validated, and maintained HPLC impurity method is not just a regulatory requirement but a critical scientific tool that underpins the entire lifecycle of a safe and effective pharmaceutical product.