Mastering Ionization Efficiency in LC-MS: From Fundamental Principles to Advanced Quantification Strategies
This article provides a comprehensive examination of the factors influencing ionization efficiency in Liquid Chromatography-Mass Spectrometry (LC-MS), a cornerstone technique in bioanalysis, drug development, and clinical diagnostics.
Mastering Ionization Efficiency in LC-MS: From Fundamental Principles to Advanced Quantification Strategies
Abstract
This article provides a comprehensive examination of the factors influencing ionization efficiency in Liquid Chromatography-Mass Spectrometry (LC-MS), a cornerstone technique in bioanalysis, drug development, and clinical diagnostics. Tailored for researchers and drug development professionals, we explore the foundational principles of electrospray ionization, detailing how analyte properties and mobile phase composition dictate signal response. The scope extends to practical methodologies for mitigating pervasive challenges like ion suppression, advanced optimization protocols for instrument parameters, and rigorous validation frameworks as per international guidelines. Furthermore, we investigate cutting-edge strategies, including machine learning and non-targeted quantification, that are pushing the boundaries of quantitative bioanalysis, ensuring robust, sensitive, and reliable results.
The Core Principles: Unraveling the Fundamentals of Ionization in LC-MS
In liquid chromatography-mass spectrometry (LC-MS), the ionization source serves as the critical interface, transforming neutral analyte molecules from the liquid chromatograph into gas-phase ions for mass analysis. The selection and optimization of this ionization process are paramount, as it fundamentally dictates the sensitivity, scope, and reliability of the entire analytical method. Within the context of factors affecting ionization efficiency in LC-MS research, two atmospheric pressure ionization (API) techniques have become foundational: Electrospray Ionization (ESI) and Atmospheric Pressure Chemical Ionization (APCI). A third technique, Atmospheric Pressure Photoionization (APPI), serves as an important tool for specific applications. This whitepaper provides an in-depth technical guide to the core mechanisms, performance characteristics, and experimental considerations of these techniques, equipping researchers and drug development professionals with the knowledge to optimize their analytical workflows.
Core Ionization Mechanisms
Electrospray Ionization (ESI): Liquid-Phase Ionization
ESI is a soft ionization technique ideal for polar and thermally labile compounds, including large biomolecules [1] [2]. Its mechanism involves multiple stages:
- Nebulization and Charged Droplet Formation: The sample solution is sprayed through a narrow capillary (needle) to which a high voltage (±3 to 5 kV) is applied. This creates a fine mist of charged droplets [2].
- Droplet Shrinking and Coulomb Fission: As the solvent evaporates, assisted by a nebulizing gas and heat, the charged droplets shrink. The increasing charge density on the droplet surface eventually overcomes the liquid's surface tension (the Rayleigh limit), causing the droplet to disintegrate into smaller, progeny droplets [2].
- Ion Emission: This cycle of evaporation and fission repeats until the droplets are sufficiently small that individual, desolvated analyte ions are emitted into the gas phase (as described by the Ion Evaporation Model) [2].
A key characteristic of ESI is its ability to generate multiply charged ions, particularly for analytes with multiple charge-accepting sites, such as proteins. This reduces the mass-to-charge ratio ((m/z)), enabling the analysis of macromolecules beyond the nominal mass range of the mass analyzer [2]. The following diagram illustrates the ESI process for positive ion formation.
ESI Process for Positive Ions
Atmospheric Pressure Chemical Ionization (APCI): Gas-Phase Ionization
APCI is also a soft ionization technique but is better suited for less polar and thermally stable compounds with low to medium molecular weights (typically < 1500 Da) [1] [3]. Unlike ESI, ionization in APCI occurs in the gas phase after the analyte is vaporized. The mechanism proceeds as follows:
- Nebulization and Vaporization: The sample solution is nebulized into a fine spray and immediately vaporized in a heated tube (typically 350–500 °C) [2] [3].
- Corona Discharge and Reagent Ion Formation: A corona discharge needle (with a current of 2–5 µA) emits electrons that ionize the nebulizer gas (typically N₂) and solvent vapor. This initiates a cascade of ion-molecule reactions, ultimately leading to the formation of stable reagent ions, such as hydronium ion clusters H⁺(H₂O)ₙ when water is the primary solvent [3].
- Chemical Ionization of Analyte: The gaseous analyte molecules (M) are ionized via proton transfer reactions with the reagent ions. In positive mode, this produces protonated molecules [M+H]⁺. Deprotonation or anion attachment can occur in negative mode [2] [3].
APCI generally produces singly charged ions and is less prone to severe matrix effects compared to ESI, making it valuable for analyzing neutral lipids, steroids, and various pharmaceuticals [4] [3]. The APCI mechanism is depicted below.
APCI Ionization Process
Atmospheric Pressure Photoionization (APPI): An Emerging Technique
APPI is particularly useful for non-polar compounds that ionize poorly by both ESI and APCI, such as polyaromatic hydrocarbons (PAHs) and certain lipids [1] [2]. Its mechanism shares the initial vaporization step with APCI but differs in the primary ionization energy source:
- Photoionization: A vacuum ultraviolet (VUV) lamp (e.g., krypton, 10.0 eV or xenon, 8.4 eV) replaces the corona discharge needle. Photons from the lamp can directly ionize analyte molecules (M) if the photon energy exceeds the analyte's ionization energy (IE), producing radical cations M⁺• [2].
- Dopant-Assisted Ionization: For analytes with a higher IE than the photon energy, a dopant (e.g., toluene, acetone) is added. The dopant is ionized first and then transfers a charge to the analyte molecule through proton or electron transfer reactions [2].
Performance Comparison and Factors Affecting Ionization Efficiency
The choice between ESI and APCI is not trivial and has a profound impact on the success of an LC-MS analysis. Performance is governed by a complex interplay of analyte properties, mobile phase composition, and instrument parameters.
Analytical Performance in Applied Studies
Direct comparisons in real-world applications highlight the complementary nature of ESI and APCI. The following tables summarize key findings from targeted analyses in food safety and metabolomics.
Table 1: Comparison of ESI and APCI for Pesticide Analysis in a Cabbage Matrix [4] [5]
| Performance Parameter | ESI Performance | APCI Performance | Context and Implications |
|---|---|---|---|
| Linear Range | 0.5 - 200 μg/kg | 0.5 - 200 μg/kg | Both techniques showed acceptable linearity for multi-residue analysis over this range. |
| Limit of Quantification (LOQ) | 0.5 - 1.0 μg/kg | 1.0 - 2.0 μg/kg | ESI demonstrated superior sensitivity (lower LOQs) for most of the 22 pesticides studied. |
| Matrix Effect | Less intense | More intense | APCI suffered from greater matrix-induced signal suppression or enhancement, complicating quantification. |
| Overall Efficiency | Greater | Good | For this multi-residue analysis, ESI was determined to be the more efficient ionization source. |
Table 2: Comparison of ESI and APCI in Metabolomics Analysis of Grape Berry Extracts [6]
| Performance Parameter | ESI Performance | APCI Performance | Context and Implications |
|---|---|---|---|
| Ionization Preference | Moderately polar metabolites (flavanols, flavones, anthocyanins) | Strongly polar metabolites (sugars, organic acids) & weakly polar metabolites | The techniques are not merely complementary but have distinct optimal application spaces. |
| Typical Ions Generated | More adduct ions [M+Na]⁺, [M+K]⁺ | More fragment ions | ESI data may require careful adduct deconvolution, while APCI can provide more structural fragments. |
| Limit of Detection (LOD) | Lower for sucrose, tartaric acid | Higher for sucrose, tartaric acid | Contradicts the general rule that APCI is better for sugars, highlighting the need for empirical testing. |
| Linear Range | Narrower | Wider | APCI offered a wider dynamic range for the compounds studied. |
| Matrix Effects | Greater | Lesser | ESI was more susceptible to matrix effects in this complex plant extract. |
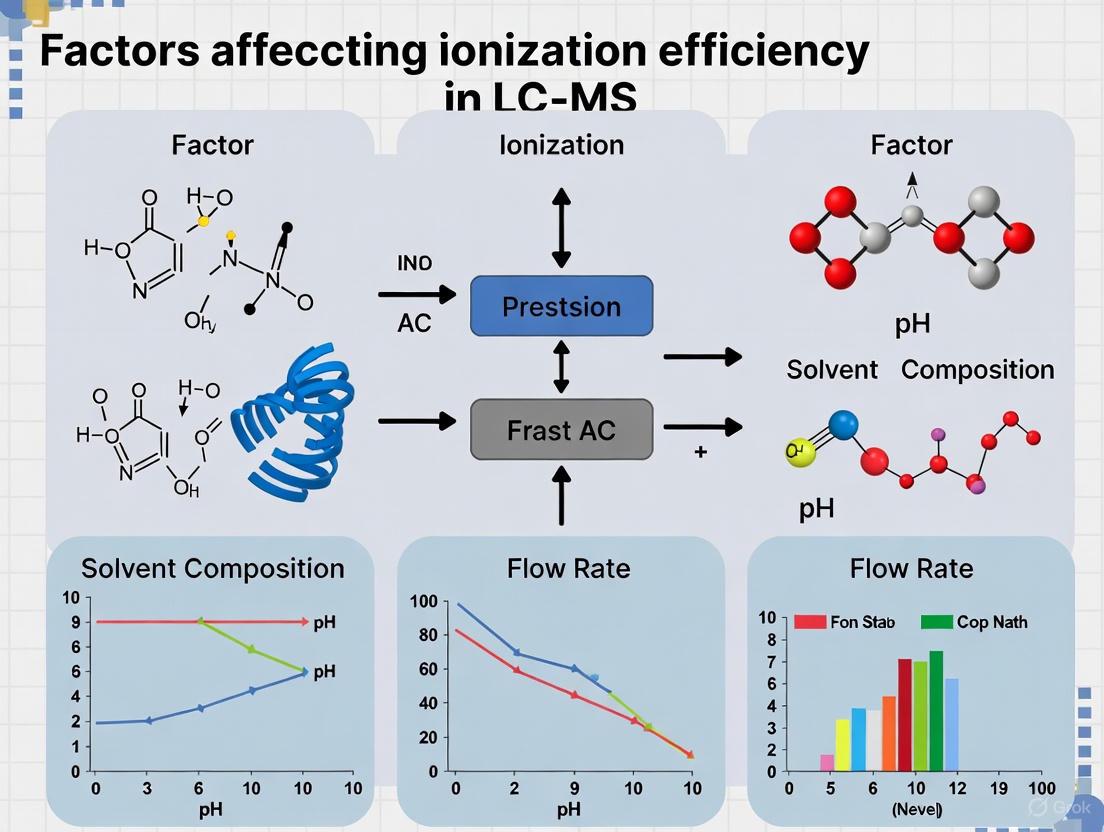
Key Factors Influencing Ionization Efficiency
The following diagram synthesizes the critical factors that researchers must control and optimize to maximize ionization efficiency in LC-MS.
Factors Affecting Ionization Efficiency
Experimental Protocols and Method Development
A systematic approach for evaluating ionization source performance in non-targeted metabolomics involves a minimal, resource-efficient pilot experiment [7].
1. Objective: To compare the sensitivity and selectivity of two LC-HRMS instrumental setups (e.g., a standard ESI source vs. an alternative high-temperature ESI source) for profiling a complex biological sample.
2. Sample Preparation:
- Prepare a dilution series of a representative pooled biological sample (e.g., urine, plasma extract, or tissue homogenate). An eight-point, sequential one-in-four dilution series is effective, ranging from the neat sample to a 1:16,384 dilution [7].
- This series accounts for the large dynamic range of metabolites and avoids signal saturation when comparing sources with different inherent sensitivities.
3. Instrumental Analysis:
- Analyze the entire dilution series for each instrumental setup (REF and ALT) using identical LC conditions. It is advisable to test multiple chromatographic methods (e.g., Reversed-Phase and HILIC) to ensure robustness [7].
- LC Conditions (Example):
- Column: C18 (for RPC) or amide (for HILIC), 2.0 mm internal diameter to optimize ESI flow rates.
- Flow Rate: 0.2 - 0.4 mL/min.
- Mobile Phase: Appropriate gradients for RPC (Water/Acetonitrile with 0.1% Formic Acid) and HILIC (Acetonitrile/Water with Ammonium Acetate or Formate).
- MS Conditions:
- Mass Analyzer: High-resolution mass spectrometer (e.g., Q-TOF, Orbitrap).
- Scan Mode: Full-scan MS in both positive and negative ionization modes.
- Source Parameters: Optimize and fix parameters for each source (capillary voltage, vaporizer temperature, gas flows) according to manufacturer guidelines.
4. Data Processing and Statistical Evaluation:
- Process raw data using non-targeted software (e.g., XCMS, Progenesis QI) for feature detection, alignment, and integration. A "feature" is defined by a unique (m/z) and retention time pair [7].
- Feature-based Evaluation:
- Assemble all feature intensities into a data matrix.
- Calculate "robust" fold-changes for features across all dilution levels to compare the overall sensitivity (REF vs. ALT). A large proportion of features (e.g., 76-83%) with higher intensity in one setup indicates a clear sensitivity advantage [7].
- Analyze the subset of features unique to each setup to assess selectivity differences.
- Chemical Interpretation:
- Perform compound identification on a subset of significant features using accurate mass, MS/MS libraries, and standard matching.
- Classify compounds by chemical class (e.g., sugars, lipids, amino acids) to determine if performance differences are structure-dependent.
5. Validation with Targeted Analysis (Optional but Recommended):
- Validate conclusions by analyzing a large panel of authenticated metabolite standards (e.g., 300+ compounds) under the same conditions.
- Compare LODs, LOQs, and linear dynamic ranges for a direct, quantitative performance assessment [7].
The Scientist's Toolkit: Essential Research Reagent Solutions
The following table details key reagents and materials essential for developing and optimizing LC-MS methods with ESI and APCI.
Table 3: Essential Research Reagent Solutions for LC-MS Ionization
| Reagent / Material | Function / Purpose | Technical Considerations |
|---|---|---|
| HPLC-Grade Solvents (Water, Methanol, Acetonitrile) | Mobile phase constituents; must be high-purity to minimize chemical noise and contamination. | Low UV cutoff, low residue after evaporation, and minimal ion-pairing agent content are critical. |
| Volatile Buffers & Additives (Formic Acid, Acetic Acid, Ammonium Formate, Ammonium Acetate) | Adjust mobile phase pH to promote analyte protonation/deprotonation. Facilitate ion formation in ESI. | Typical concentrations are 0.05% - 0.1% for acids and 2-10 mM for ammonium salts. Avoid non-volatile buffers (e.g., phosphate). |
| Mass Spectrometry Calibration Solution | Accurate mass calibration of the mass spectrometer before analysis. | Commercially available solutions (e.g., Pierce LTQ Velos ESI Positive Ion Calibration Solution) containing a mixture of compounds across a broad (m/z) range. |
| Chemical Standard Mixtures | Method development, optimization, and quantitative calibration. | Used to test ionization efficiency, chromatographic separation, and determine LOD/LOQ for target analytes. |
| QuEChERS Extraction Kits | Sample preparation for complex matrices (e.g., food, biological tissues). | A standardized "Quick, Easy, Cheap, Effective, Rugged, Safe" method for multi-residue analysis, often used prior to LC-ESI/APCI-MS/MS [4]. |
| Dopants (Toluene, Acetone) | Enhance ionization efficiency in APPI. | The dopant has a lower ionization energy (IE) than the mobile phase solvents and is ionized by the VUV lamp, subsequently ionizing the analyte [2]. |
Emerging Trends and Future Directions
The field of LC-MS ionization continues to evolve, driven by demands for higher sensitivity, robustness, and broader chemical comprehensiveness.
- Source Integration and High-Throughput: The development of fast-switching dual ionization sources that can operate in both ESI and APCI modes, either simultaneously or in rapid alternation, is a significant advancement. This allows a single instrument to cover a wider chemical space without manual source swapping, thereby increasing laboratory throughput and efficiency [8].
- Advanced Source Design: New ion source geometries and technologies are being introduced to improve ionization efficiency and reduce matrix effects. Examples include sources with redesigned gas sheaths and higher operating temperatures (e.g., "IonBooster" interfaces), which have shown promise in increasing sensitivity for a range of compound classes in metabolomics [7].
- Standardization and Data Science: As metabolomics and non-targeted analysis move into regulatory and clinical settings, there is a growing emphasis on method harmonization. Research is focusing on using non-targeted pilot experiments and machine learning to predict ionization efficiency, aiming to replace costly and time-consuming targeted evaluation procedures with more efficient, data-driven approaches [7] [9].
- Broadening Application Space: APCI is being re-evaluated and recognized as an essential tool for analyzing challenging low molecular weight, thermally labile, and low-polarity synthetic molecules that are problematic for both EI and ESI, thus expanding the accessible chemical space for routine analysis [10].
The ionization of an analyte is the critical first step in Liquid Chromatography-Mass Spectrometry (LC-MS) that determines the success of the entire analysis. Ionization efficiency directly influences the sensitivity, reproducibility, and overall capability of an LC-MS method. This guide details the core physicochemical properties—pKa, polarity, surface activity, and molecular structure—that govern ionization efficiency, providing a foundational framework for a broader thesis on factors affecting LC-MS performance. Understanding these properties enables researchers to predict analyte behavior, optimize methods systematically, and troubleshoot analytical challenges in drug development and other research applications. The principles discussed herein are particularly vital for the analysis of pharmaceutical compounds, a majority of which contain ionizable groups [11].
Core Properties and Their Impact on Ionization
pKa and Ionization State
The acid dissociation constant (pKa) is arguably the most significant property controlling ionization in LC-MS. It defines the pH at which a molecule exists in a dynamic equilibrium, with 50% of its population in an ionized state and 50% in a neutral state [11] [12]. The relationship between pH, pKa, and the degree of ionization for monoprotic acids and bases is quantitatively described by the Henderson-Hasselbalch equation [13].
For acids: pH = pKa + log([A⁻]/[HA]) For bases: pH = pKa + log([B]/[BH⁺])
At a pH equal to the analyte's pKa, the mixture of ionized and neutral species can lead to broad or tailing peaks in chromatography and inconsistent ionization in the mass spectrometer [11] [12]. To ensure stable and efficient ionization, the mobile phase pH should be adjusted to at least two units away from the analyte's pKa. This ensures the compound is predominantly (>99%) in a single, predictable ionization state [11]. It is crucial to remember that pKa is not a true constant but depends on temperature, ionic strength, and the solvent composition [13].
Table 1: pKa-Driven HPLC Method Development Strategy
| Analyte Type | Target Mobile Phase pH | Rationale | Impact on Ionization |
|---|---|---|---|
| Acidic | 2 units below pKa | Suppresses dissociation, maintains neutral form | Promotes protonation in positive mode; reduces ion suppression |
| Basic | 2 units above pKa | Suppresses protonation, maintains neutral form | Promotes deprotonation in negative mode; reduces ion suppression |
| At pKa | pH = pKa | 50% ionized, 50% unionized | Unstable ionization leads to poor peak shape and variable signal [12] |
Polarity and Lipophilicity
Polarity, often quantified by the octanol-water partition coefficient (log P), measures the relative affinity of a molecule for polar versus non-polar environments. In LC-MS, polarity is a double-edged sword. Highly polar compounds are readily soluble in the aqueous mobile phase but may not adsorb effectively to the charged droplet surface during electrospray ionization (ESI), leading to poor efficiency. Conversely, very non-polar (lipophilic) compounds, while easily concentrating at the droplet surface, often have low solubility in the LC mobile phase, risking precipitation and adsorption [14].
The optimal balance is a molecule with moderate lipophilicity. Such analytes can effectively partition to the droplet surface in ESI while remaining in solution throughout the chromatographic process. Lipophilicity is a critical parameter for all ADMET (Absorption, Distribution, Metabolism, Excretion, and Toxicity) properties of a drug, influencing not just ionization but also permeability and metabolic stability [14].
Surface Activity
Surface activity refers to an analyte's ability to preferentially concentrate at the interface between the liquid droplet and the gas phase in ESI. This property is governed by the compound's amphiphilic nature, meaning it possesses both polar and non-polar regions. Surface-active analytes (e.g., phospholipids, surfactants) will accumulate at the droplet surface, thereby gaining preferential access to the charge and leading to enhanced ionization efficiency. This phenomenon can cause significant ion suppression for less surface-active co-eluting compounds, as the surface-active agents effectively "compete" for the available charge and space on the limited droplet surface [15]. This is a primary component of the matrix effect in bioanalysis, where endogenous compounds from the sample matrix suppress or enhance the ionization of the target analyte [15].
Molecular Structure and Intrinsic Properties
The fundamental molecular structure of an analyte dictates its intrinsic potential for ionization.
- Ionizable Groups: The presence and type of functional groups (e.g., carboxylic acids, amines, phosphates) determine how readily a molecule can gain or lose a proton. Molecules with multiple ionizable centers can present complex ionization profiles [11].
- Gas-Phase Basicity/ Acidity: This is the thermodynamic propensity of an ionized molecule to retain its charge in the gas phase after the solvent has evaporated. A higher gas-phase basicity (for positive ions) or lower gas-phase acidity (for negative ions) leads to more stable ions and a stronger signal.
- Molecular Size and Lability: Large, labile molecules (e.g., proteins, peptides) can be gently ionized by ESI to produce a spectrum of multiply-charged ions [M+nH]ⁿ⁺, which allows the mass analysis of high-molecular-weight species on instruments with limited m/z range [16].
Table 2: Summary of Analyte Properties and Their Influence on Ionization
| Property | Mechanism of Influence | Primary Ionization Impact | Preferred ESI Mode |
|---|---|---|---|
| Low pKa (Acidic) | Proton donation in solution | Forms stable [M-H]⁻ ions | Negative Mode |
| High pKa (Basic) | Proton acceptance in solution | Forms stable [M+H]⁺ ions | Positive Mode |
| High Polarity | High aqueous solubility, poor surface activity | Low ionization efficiency; may require derivatization | Depends on ionizable group |
| High Surface Activity | Preferential concentration at droplet surface | High ionization efficiency; causes ion suppression | Depends on ionizable group |
| Multiple Ionizable Groups | Can accept/donate multiple protons | Can form multiply-charged ions [M+nH]ⁿ⁺ [16] | Positive or Negative Mode |
Experimental Protocols for Investigation
Protocol for Determining pKa and Its Ionization Impact
Objective: To determine the pKa of an analyte and experimentally observe its effect on LC-MS response. Background: The pKa of a compound can be determined by measuring a spectroscopic or chromatographic property as a function of pH. The resulting sigmoidal curve will have an inflection point at the pKa [13].
Materials:
- Test analyte at a known concentration.
- A series of buffered mobile phases covering a pH range from at least 3 units below to 3 units above the predicted pKa.
- LC-MS system with a UV detector and mass spectrometer.
Method:
- Sample Preparation: Prepare identical solutions of the test analyte in each of the buffered mobile phases.
- LC-MS Analysis: Inject each sample onto the LC-MS system. Use an isocratic or shallow gradient method to minimize retention time shifts.
- Data Collection: For each injection, record:
- The UV peak area.
- The MS extracted ion chromatogram (XIC) peak area.
- The analyte's retention time (k).
- Data Analysis:
- Plot the UV response, MS response, and retention time against the mobile phase pH.
- Fit a sigmoidal curve to the data. The pH at the inflection point of the retention time plot corresponds to the pKa.
- Identify the pH regions where the MS signal is maximized and most stable.
Protocol for Assessing Matrix Effect and Surface Activity
Objective: To quantify ion suppression/enhancement caused by matrix components and infer surface activity. Background: This protocol, based on the methods of Matuszewski et al., uses pre- and post-extraction spiking to differentiate between recovery losses and true ionization effects [15].
Materials:
- Blank biological matrix (e.g., plasma, urine) from at least 6 different lots [15].
- Neat solvent (mobile phase).
- Stock solutions of the analyte and internal standard (IS).
Method:
- Sample Set Preparation: Prepare three sets of samples for each matrix lot and at two concentration levels [15]:
- Set 1 (Neat Solution): Spike analyte and IS into neat solvent. This represents the 100% reference signal (A).
- Set 2 (Post-extraction Spiked): Spike analyte and IS into extracted blank matrix. This measures the matrix effect (ME); the signal is designated (B).
- Set 3 (Pre-extraction Spiked): Spike analyte into the blank matrix before extraction, then add IS after extraction. This measures the process efficiency (PE); the signal is designated (C).
- LC-MS/MS Analysis: Analyze all samples using the validated MRM method.
- Calculations:
- Matrix Effect (ME): ME% = (B / A) × 100. An ME < 100% indicates ion suppression; >100% indicates enhancement.
- Process Efficiency (PE): PE% = (C / A) × 100.
- Recovery (RE): RE% = (C / B) × 100. This isolates the extraction efficiency from the ionization effect.
- Interpretation: A low ME% with a high RE% indicates strong ion suppression, often caused by co-eluting, highly surface-active matrix components outcompeting the analyte for charge.
Ionization Pathways and Experimental Workflows
The following diagram illustrates the logical decision process for optimizing ionization based on analyte properties, leading to the appropriate experimental workflow for assessment.
The Scientist's Toolkit: Essential Research Reagents and Materials
Successful LC-MS analysis, particularly when investigating ionization properties, requires careful selection of reagents and materials. The following toolkit outlines essential items and their functions.
Table 3: Essential Research Reagent Solutions and Materials for Ionization Studies
| Item | Function / Purpose | Key Considerations |
|---|---|---|
| Buffers (e.g., Ammonium Formate/Acetate) | Controls pH of the mobile phase to manipulate analyte ionization state [11]. | Must be volatile to prevent clogging the MS interface and contaminating the ion source. |
| LC-MS Grade Solvents (Water, MeCN, MeOH) | Serves as the mobile phase for chromatographic separation and ionization matrix. | High purity minimizes background noise and prevents instrument contamination. |
| pKa Standards | Used for calibration and verification of predictive models or experimental determinations. | A set of compounds with known, well-defined pKa values across a broad pH range. |
| Stable Isotope-Labeled Internal Standards | Accounts for variability in sample preparation and ionization efficiency, correcting for matrix effects [15]. | Ideally, the IS is an isotopolog of the analyte and added at the earliest possible step. |
| Blank Matrix Lots (≥6) | Essential for experimental assessment of matrix effects and ion suppression [15]. | Sourced from multiple donors to account for biological variability. |
| Syringe Pumps | Provides precise, pulseless flow for direct infusion studies or for delivering calibration solutions [17]. | Crucial for fundamental ionization studies and instrument calibration. |
In Liquid Chromatography-Mass Spectrometry (LC-MS), successful analysis depends not only on effective chromatographic separation but also on efficient ionization of analytes for detection. The mobile phase composition is the critical bridge between these two processes, directly influencing the ionization efficiency in the electrospray ionization (ESI) source, which is the most commonly applied interface for LC-MS [18]. The chemical environment created by volatile buffers, specific pH levels, and organic modifiers either enhances or suppresses the signal of target analytes, ultimately determining method sensitivity, limits of detection, and quantification reliability [19]. This technical guide examines the fundamental relationships between mobile phase constituents and ESI response, providing evidence-based strategies for optimizing LC-MS methods within the broader context of ionization efficiency research.
Core Principles of Mobile Phase Effects on Ionization
The Electrospray Ionization Mechanism and Liquid-Phase Interactions
Electrospray ionization involves the formation of charged droplets from the LC eluent, followed by solvent evaporation and repeated droplet fissions until gas-phase ions are released [19]. The chemical composition of the mobile phase critically impacts the desorption efficiency of analytes from charged droplets into the gas phase [20]. Key properties influenced by the mobile phase include:
- Solution conductivity affecting Taylor cone stability
- Surface tension influencing initial droplet size
- Solvent evaporation rate controlling droplet shrinkage and fission events
- Gas-phase proton affinity governing final ion formation
Ionization efficiency varies significantly with the mobile phase environment, with response factors for chemicals spanning 4-6 orders of magnitude across different conditions [21]. This dramatic variation underscores the importance of systematic mobile phase optimization.
Volatile Buffers: MS-Compatibility and Ionization Mechanisms
Volatile buffers are essential for LC-MS because they produce minimal residue in the ion source, preventing contamination and signal suppression. Non-volatile buffers (e.g., phosphates) form crystalline deposits that degrade MS performance and necessitate frequent source cleaning [22].
Table 1: Common Volatile Buffers in LC-MS and Their Properties
| Buffer System | Useful pH Range | Molecular Weight | Volatility | Compatibility Notes |
|---|---|---|---|---|
| Ammonium Formate | 2.8-4.8 / 8.2-10.2 | 63.06 | High | Excellent for positive and negative mode |
| Ammonium Acetate | 3.8-5.8 / 8.2-10.2 | 77.08 | High | Most versatile; wide application range |
| Formic Acid | 3.3-4.3 | 46.03 | High | Excellent for positive ion mode |
| Acetic Acid | 4.3-5.3 | 60.05 | High | Weaker acidity than formic acid |
| Ammonium Bicarbonate | 5.9-6.9 / 8.8-9.8 | 79.06 | Moderate | Suitable for higher pH applications |
The chemical structure of buffer ions affects their ion-pairing potential and gas-phase proton transfer efficiency. For instance, alkylamines with higher Henry's Law Constant values (e.g., hexylamine, piperidine) can reduce charge state distribution of oligonucleotides by forming complexes that dissociate in the gas phase, while those with low values facilitate earlier ion emission [20].
Quantitative Optimization Strategies
Systematic Evaluation of Buffer Composition
A comprehensive study evaluating 240 FDA-approved drugs identified clear response patterns based on mobile phase composition [18]. The research employed standardized chromatographic conditions with a C18 reversed-phase column (ACQUITY UPLC BEH C18, 1.7µm, 2.1 × 100 mm) and electrospray ionization mass spectrometry.
Table 2: Optimal Mobile Phase Systems for Maximizing ESI Response [18]
| Organic Modifier | Buffer Additive | Relative Response | Applicable Compound Classes | Key Advantages |
|---|---|---|---|---|
| Methanol | Formic Acid | High | Largest number of compounds (including most drugs) | Best overall response for diverse analytes |
| Methanol | Ammonium Acetate | High | Broad applicability | Excellent for both positive and negative mode |
| Isopropanol | Formic Acid | Good | Selective compound classes | Good alternative to methanol systems |
| Isopropanol | Ammonium Acetate | Good | Selective compound classes | Complementary selectivity |
| Acetonitrile | Formic Acid | Moderate | Specific applications | Sharp peaks for certain separations |
| Acetonitrile | Acetic Acid | Moderate | Acid-stable compounds | Weaker ionization suppression |
The findings demonstrated that formic acid and ammonium acetate in methanol-based systems provided the best overall response for the largest number of compounds [18]. This combination offers optimal compatibility with ESI processes while maintaining effective separation for most small molecules.
pH Optimization and Charge State Control
Mobile phase pH significantly influences analyte ionization in solution prior to ESI, particularly for compounds with acidic or basic functional groups. The pH affects the degree of protonation for basic compounds in positive mode and deprotonation for acidic compounds in negative mode [18] [21].
For basic analytes, a pH 2-3 units below the pKa ensures >99% protonation, maximizing [M+H]+ signal. Conversely, for acidic compounds, a pH 2-3 units above the pKa promotes deprotonation, enhancing [M-H]- signal. When analyzing complex mixtures with diverse functional groups, pH selection represents a compromise that must be experimentally determined.
Organic Modifier Selection and Mechanisms
The organic modifier (typically acetonitrile, methanol, or isopropanol) affects multiple aspects of the LC-MS process:
- Solvation strength in reversed-phase chromatography
- Solution viscosity influencing droplet size in ESI
- Surface tension affecting Taylor cone formation
- Evaporation rate controlling desolvation efficiency
Methanol generally provides superior ionization efficiency compared to acetonitrile for most compounds, attributed to its protic nature which facilitates proton transfer reactions [18]. Isopropanol, while providing alternative selectivity, increases viscosity leading to broader peaks but can enhance response for certain hydrophobic compounds.
The modifier's impact extends to specialized applications; for oligonucleotide analysis, modifiers with specific Henry's Law Constants (e.g., hexafluoroisopropanol) significantly alter charge-state distribution and desorption efficiency [20].
Experimental Protocols for Method Development
Standardized Method Comparison Protocol
Objective: Systematically identify optimal mobile phase composition for maximum ESI response of target analytes.
Materials and Equipment:
- LC-MS system with ESI source and binary pump
- C18 reversed-phase column (e.g., 100 × 2.1 mm, 1.7-2.7 µm particle size)
- Volatile buffers: formic acid, acetic acid, ammonium acetate, ammonium formate (MS-grade)
- Organic modifiers: methanol, acetonitrile, isopropanol (MS-grade)
- Analytic standards prepared in compatible solvents
Procedure:
- Prepare mobile phase A: water with 0.1% buffer additive
- Prepare mobile phase B: organic modifier with 0.1% buffer additive
- Test buffer systems: formic acid (0.1%), acetic acid (0.1%), ammonium acetate (2-10 mM), ammonium formate (2-10 mM)
- For each buffer, test with different organic modifiers (methanol, acetonitrile)
- Employ a standardized gradient: 5-95% B over 10 minutes, hold 2 minutes
- Maintain constant flow rate (0.3-0.5 mL/min for 2.1 mm ID columns)
- Inject identical concentrations of analytes across all conditions
- Monitor peak areas, signal-to-noise ratios, and peak shapes
Data Analysis:
- Normalize responses to the highest signal for each analyte
- Identify compositions providing >80% of maximum response
- Evaluate peak symmetry and resolution
- Select conditions offering best compromise for multi-analyte methods
This systematic approach mirrors methodology successfully applied in pharmaceutical compound screening [18].
Ion Source Parameter Optimization Protocol
Objective: Fine-tune ESI source parameters for specific mobile phase composition.
Background: Optimal source conditions are dependent on mobile phase composition and flow rate [19].
Diagram: ESI Source Optimization Workflow. S/N = Signal-to-Noise ratio.
Procedure:
- Begin with manufacturer-recommended settings for your flow rate
- Inject a standard solution while varying capillary voltage (typically 2-4 kV in steps of 0.2 kV)
- Monitor total ion current stability and signal intensity
- Optimize nebulizer gas pressure (20-60 psi) to achieve stable spray
- Adjust desolvation temperature (200-500°C) for maximum signal without degrading thermally labile compounds
- Fine-tune source positions for optimal ion transmission
- Iterate process for critical analytes
Documented optimizations demonstrate 2-3 fold sensitivity improvements through systematic source parameter adjustment [19].
The Scientist's Toolkit: Essential Research Reagents
Table 3: Essential Materials for LC-MS Mobile Phase Optimization
| Category | Specific Reagents | Function | Application Notes |
|---|---|---|---|
| Volatile Acids | Formic Acid (0.05-0.1%)Acetic Acid (0.05-0.1%) | Protonate basic analytesProvide low pH environment | Formic acid: stronger acidityAcetic acid: alternative selectivity |
| Volatile Salts | Ammonium Acetate (2-20 mM)Ammonium Formate (2-20 mM) | pH ControlBuffer capacity | Ammonium formate: more volatileAmmonium acetate: wider application |
| Organic Modifiers | MethanolAcetonitrileIsopropanol | Solvation strengthImpact ESI efficiency | Methanol: best overall responseAcetonitrile: different selectivity |
| Specialty Additives | HexafluoroisopropanolAlkylamines (e.g., imidazole) | Modify charge stateEnhance desorption | Oligonucleotide analysisChallenging ionizations |
| Column Chemistry | C18 (standard)Phenyl-HexylHILICBiphenyl | Stationary phase selectivityAlternative interactions | Complementary selectivityChallenging separations [23] |
Advanced Applications and Emerging Trends
Machine Learning Approaches for Ionization Efficiency Prediction
Emerging approaches utilize machine learning models to predict ionization efficiency based on molecular descriptors and mobile phase composition [21]. Random forest regression models trained on PaDEL descriptors can predict response factors with median errors of 2.20× for SFC/ESI/HRMS and 5.11× when transferring models between techniques [21]. These quantitative structure-retention relationship (QSRR) models incorporate descriptors for:
- Molecular lipophilicity (log P)
- Polar surface area
- Hydrogen bonding capacity
- Aromaticity indices
- Charge distribution parameters
The most significant molecular descriptors show remarkable consistency across different chromatographic techniques, enabling cross-platform prediction models that accelerate method development [18] [21].
Inert Hardware for Challenging Analyses
Recent column technology innovations focus on inert hardware to minimize metal-analyte interactions that compromise recovery for metal-sensitive compounds [23]. These include:
- Metal-free fluid paths for phosphorylated compounds
- Passivated stainless steel for chelating analytes
- PEEK-lined systems for bioinert applications
Such technologies demonstrate enhanced peak shapes and improved analyte recovery for challenging molecules like phosphorylated drugs, chelating pesticides, and oligonucleotides [23].
Mobile phase composition serves as the critical link between chromatographic separation and mass spectrometric detection in LC-MS. Through strategic selection of volatile buffers, optimization of pH based on analyte physicochemical properties, and appropriate choice of organic modifiers, analysts can significantly enhance ionization efficiency and method sensitivity. The systematic experimental approaches outlined in this guide provide a framework for evidence-based method development, while emerging technologies in column hardware and predictive modeling offer new opportunities for optimization. As LC-MS applications continue to expand into increasingly complex analytical challenges, fundamental understanding of mobile phase effects on ionization processes remains essential for generating robust, sensitive, and reliable analytical methods.
Matrix effects represent a fundamental challenge in liquid chromatography-mass spectrometry (LC-MS), profoundly impacting the accuracy, reproducibility, and sensitivity of quantitative analyses across pharmaceutical, clinical, and environmental applications. These effects occur when components co-eluting with target analytes interfere with the ionization process in the mass spectrometer interface, leading to either suppression or enhancement of the analyte signal [24] [25]. Regardless of the sensitivity or selectivity of the mass analyzer used, matrix effects negatively affect critical analytical figures of merit including detection capability, precision, and accuracy [24]. The limited knowledge of the origin and mechanism of these effects makes them particularly difficult to solve in many cases, necessitating a comprehensive understanding of their causes, detection methods, and mitigation strategies [24].
The pervasive nature of matrix effects has been increasingly recognized since the early 1990s, when studies began reporting difficulties with reproducibility and accuracy when analyzing small quantities of analytes in complex samples such as biological fluids [24]. Kebarle and Tang originally described the matrix effect phenomenon as the result of co-eluted matrix components affecting the detection capability, precision, or accuracy for analytes of interest [24]. Ion suppression specifically refers to the manifestation of matrix effects associated with influencing the extent of analyte ionization, often observed as a loss in response [24]. The U.S. Food and Drug Administration's Guidance for Industry on Bioanalytical Method Validation clearly indicates the need for matrix effect assessment to ensure that precision, selectivity, and sensitivity will not be compromised, though specific assessment procedures are not prescribed [25].
Mechanisms and Origins of Ion Suppression and Enhancement
Fundamental Ionization Interference Processes
Matrix effects originate from competitive processes occurring during ionization where co-eluting compounds interfere with the efficient ionization of target analytes. In electrospray ionization (ESI), the most widely used LC-MS interface, ionization occurs through the formation of charged droplets that undergo desolvation and Coulombic fission until gas-phase ions are produced [24]. Matrix effects in ESI primarily arise from competition for charge and space on the surface of these droplets [24]. At high concentrations (>10⁻⁵ M), the approximate linearity of the ESI response is often lost due to either a limited amount of excess charge available on ESI droplets or saturation of the ESI droplets with analyte at their surfaces, thus inhibiting ejection of ions trapped inside the droplets [24].
The characteristics that determine whether a compound will out-compete others for the limited charge or space include its surface activity and basicity [24]. Biological matrices contain large amounts of endogenous compounds with potentially very high basicities and surface activities, causing the concentration limit of 10⁻⁵ M to be reached quickly, resulting in ion suppression [24]. Alternative theories propose that increased viscosity and surface tension of droplets from high concentrations of interfering compounds can reduce solvent evaporation and the ability of the analyte to reach the gas phase [24] [26]. Nonvolatile materials may also decrease droplet formation efficiency through coprecipitation of analyte or preventing droplets from reaching the critical radius required for gas phase ion emission [24].
Ionization Technique Dependencies
The mechanisms and severity of matrix effects differ significantly between ionization techniques. Atmospheric-pressure chemical ionization (APCI) frequently exhibits less ion suppression than ESI due to fundamental differences in their ionization mechanisms [24]. Unlike ESI, APCI does not involve competition between analytes to enter the gas phase, as neutral analytes are transferred into the gas phase by vaporizing the liquid in a heated gas stream [24]. Additionally, ion suppression in APCI is not directly related to charge saturation because the maximum number of ions formed by gas-phase ionization is much higher, with reagent ions being redundantly formed [24]. Nonetheless, APCI does experience ion suppression, which has been explained by considering the effect of sample composition on the efficiency of charge transfer from the corona discharge needle, or through solid formation either as pure analyte or as a solid coprecipitate with other nonvolatile sample components [24].
Emerging ionization techniques show promise for reducing matrix effects. Flexible microtube plasma (FμTP) ionization, a dielectric barrier discharge-based method, has demonstrated significantly reduced matrix effects compared to conventional ESI and APCI [27]. In comparative studies, between 76% and 86% of pesticides showed negligible matrix effects for FμTP, compared to 35–67% for ESI and 55–75% for APCI across different matrices [27]. This improvement is attributed to differences in ionization mechanisms, with plasma-based techniques potentially offering more robust performance in complex matrices.
The sources of ion suppression include both endogenous compounds originating from the sample matrices and exogenous substances introduced during sample preparation [24] [25]. Compounds with high concentration, mass, and basicity that elute in the same retention window as the analyte of interest are prime candidates for inducing ion suppression [24]. Phospholipids in plasma represent one of the most significant sources of matrix effects in bioanalysis [28]. Other common sources include salts, metabolites, dosing vehicle components, and polymers extracted from plastic tubes during sample preparation [24] [25]. Column bleed from chromatographic stationary phases can also contribute to matrix effects, with hydrolysis products from conventional silica-based mixed-mode columns causing significant ion suppression or enhancement, while hybrid particle-based columns demonstrate markedly lower effects [29].
Table 1: Common Sources of Matrix Effects in LC-MS Analysis
| Source Type | Specific Examples | Impact on Analysis |
|---|---|---|
| Endogenous | Phospholipids, bile acids, lipids, proteins, metabolites | High concentration in biological matrices; co-elution with analytes causes competitive ionization [30] [28] |
| Exogenous | Polymers from plasticware, dosing vehicle components, SPE cartridge leachates | Introduced during sample preparation; varies between batches and suppliers [24] [25] |
| Chromatographic | Stationary phase bleed, ion-pairing reagents, mobile phase additives | High background signal; interference with analyte ionization [29] [25] |
| Sample-Derived | High lipid content, salts, residual precipitating agents | Increases viscosity and surface tension; affects droplet formation and evaporation [24] [26] |
Detecting and Evaluating Matrix Effects
Established Experimental Protocols
Several experimental approaches have been developed to detect and evaluate matrix effects during method development and validation. The post-extraction spike method involves comparing the MRM response (peak areas or heights) of an analyte in a blank sample spiked post-extraction to that of the analyte injected directly into neat mobile phase [24] [26]. If the analyte signal in the matrix is significantly lower than in pure solvent, this indicates ion suppression from interfering agents [24]. While this approach quantitatively measures the extent of suppression, it does not provide information about the chromatographic location of the interference [24].
The post-column infusion method qualitatively identifies regions in the chromatogram affected by matrix effects [24] [26]. This technique involves continuous introduction of a standard solution containing the analytes of interest via a syringe pump connected to the column effluent [24]. After injecting a blank sample extract, a drop in the constant baseline indicates ionization suppression due to eluting interfering materials [24]. This method effectively maps suppression regions throughout the chromatogram, enabling method development to shift analyte retention away from problematic regions [24]. However, the process is time-consuming, requires additional hardware, and presents challenges for multianalyte methods [26].
Diagram 1: Post-Column Infusion Experiment Setup. This qualitative method identifies chromatographic regions affected by matrix effects by monitoring signal decreases during blank matrix injection.
Advanced Quantitative Assessment Methods
Recent advances in matrix effect assessment include more comprehensive quantitative approaches. The IROA TruQuant Workflow represents a significant innovation for non-targeted metabolomics, using a stable isotope-labeled internal standard (IROA-IS) library and companion algorithms to measure and correct for ion suppression [31]. This approach leverages a unique, formula-specific isotopolog ladder created by low ¹³C (natural abundance) signals and high ¹³C (95%) signals to distinguish real metabolites from artifacts and quantify suppression levels [31]. The method has demonstrated effectiveness across ion chromatography (IC), hydrophilic interaction liquid chromatography (HILIC), and reversed-phase liquid chromatography (RPLC)-MS systems in both positive and negative ionization modes, with detected metabolites exhibiting ion suppression ranging from 1% to >90% [31].
Another innovative approach involves calculating a matrix factor derived from the ratio of analyte signal response with and without matrix presence [29]. This method has been applied to evaluate column bleed from different stationary phases, demonstrating that silica-based mixed-mode columns produce matrix factors ranging from 0.04 to 1.86 (indicating severe suppression to significant enhancement), while hybrid particle-based columns yield matrix factors closest to 1 (0.74–1.16), showing minimal ion suppression or enhancement [29].
Consequences and Impact on Analytical Data Quality
Effects on Quantitative Analytical Figures of Merit
Matrix effects negatively impact multiple analytical performance characteristics essential for reliable quantitative analysis. The detection capability is reduced due to decreased analyte signal, leading to higher limits of detection (LOD), lower signal-to-noise (S/N) ratios, and a smaller dynamic range [25]. Precision is compromised as the degree of suppression may vary between samples due to natural biological variation in matrix composition [24] [25]. This variation can introduce both systematic and random errors in signal response, affecting ion intensity ratios and linearities [24]. In severe cases, ion suppression can lead to false negatives for existing analytes or false positives in applications where maximum residue limits are monitored, particularly if the internal standard experiences different suppression than the analyte [24].
The consequences extend beyond simple signal reduction. Matrix effects can significantly alter chromatographic behavior, with studies demonstrating that matrix components can change the retention time (Rt) and shape of LC peaks [30]. In extreme cases, matrix effects have been shown to cause a single compound to yield two LC peaks, fundamentally challenging the established rule that one chemical compound yields one LC-peak with reliable retention time [30]. This phenomenon was observed for bile acid standards including chenodeoxycholic acid, deoxycholic acid, and glycocholic acid when analyzed in urine samples from animals fed different diets [30]. The proposed mechanism suggests that some matrix components may loosely bond to analytes, changing their retention characteristics and interfering with ionization [30].
Table 2: Impact of Matrix Effects on Analytical Performance Parameters
| Analytical Parameter | Effect of Ion Suppression | Consequence for Data Quality |
|---|---|---|
| Detection Capability | Decreased analyte signal intensity | Higher LOD/LOQ; reduced sensitivity for trace analysis [25] |
| Precision | Variable suppression between samples | Poor reproducibility and method robustness [24] [25] |
| Accuracy | Altered analyte response factor | Inaccurate quantification; potential for false positives/negatives [24] |
| Linearity | Non-proportional response with concentration | Reduced dynamic range; compromised calibration reliability [25] |
| Retention Time | Altered interaction with stationary phase | Erroneous peak identification; integration errors [30] |
Strategies for Overcoming Matrix Effects
Sample Preparation and Chromatographic Solutions
Effective sample preparation represents the first line of defense against matrix effects. Selective extraction techniques, including liquid-liquid extraction (LLE) and solid-phase extraction (SPE), can remove interfering compounds before analysis [25]. The use of enhanced matrix removal-lipid (EMR) sorbents specifically targets phospholipids, a major source of matrix effects in biological samples [27]. Cleaner sample preparation approaches significantly reduce matrix component concentrations, though they may not eliminate compounds chemically similar to the analyte that are likely to co-elute [26].
Chromatographic optimization provides another crucial strategy for mitigating matrix effects. Improving separation to prevent co-elution of analytes and interfering compounds can significantly reduce ionization interference [26]. This includes adjusting stationary phase chemistry, mobile phase composition, and gradient profiles to shift analyte retention away from suppression regions identified by post-column infusion [24] [26]. However, modifying chromatographic conditions can be time-consuming, and some mobile phase additives may themselves suppress electrospray signals [26]. Alternative chromatographic approaches such as using longer columns, slower gradients, or multidimensional separation can improve resolution but at the cost of increased analysis time [25].
Internal Standardization and Calibration Techniques
Internal standardization represents the most effective approach for compensating for matrix effects rather than eliminating them. Stable isotope-labeled internal standards (SIL-IS) are considered the gold standard for quantitative compensation because they possess nearly identical chemical properties to the analytes, including retention time and ionization characteristics, and thus experience virtually the same matrix effects [26] [31]. The IROA TruQuant Workflow exemplifies an advanced implementation of this principle, using a comprehensive stable isotope-labeled internal standard library to correct for ion suppression across all detected metabolites in non-targeted studies [31].
When stable isotope-labeled standards are unavailable or prohibitively expensive, alternative calibration approaches may be employed. The standard addition method, widely used in spectroscopic techniques, shows promise for compensating matrix effects in LC-MS, particularly for endogenous analytes where blank matrix is unavailable [26]. This method involves spiking samples with increasing known concentrations of analyte and extrapolating to determine the original concentration [26]. Structural analogues that co-elute with the target analyte can also serve as internal standards, though with potentially lower compensation accuracy compared to SIL-IS [26].
Diagram 2: Comprehensive Matrix Effect Mitigation Workflow. Effective management requires multiple complementary approaches from sample preparation through data analysis.
Instrumental and Ionization Source Considerations
Instrumental modifications and alternative ionization techniques offer additional avenues for reducing matrix effects. Diluting samples before injection can minimize matrix component concentrations, though this approach is only feasible when assay sensitivity is sufficiently high [26]. Switching ionization modes (e.g., from positive to negative ionization) may reduce matrix effects since fewer compounds typically respond in negative mode [24]. Alternative ionization sources such as APCI often exhibit less severe matrix effects compared to ESI due to their different ionization mechanisms occurring primarily in the gas phase rather than in solution [24].
Emerging ionization technologies show particular promise for mitigating matrix effects. Flexible microtube plasma (FμTP) ionization, a dielectric barrier discharge-based technique, has demonstrated significantly reduced matrix effects compared to both ESI and APCI [27]. This source expands the chemical space coverage while providing more robust performance in complex matrices, making it valuable for both target and non-target screening applications [27]. The ionization mechanism in FμTP differs from conventional techniques, potentially involving charge transfer reactions less susceptible to competitive suppression from matrix components [27].
Table 3: Research Reagent Solutions for Matrix Effect Management
| Solution Category | Specific Examples | Function and Application |
|---|---|---|
| Sample Preparation | Primary-Secondary Amine (PSA), Enhanced Matrix Removal-Lipid (EMR), C18 sorbents | Remove phospholipids, fatty acids, and other interfering compounds during sample cleanup [27] |
| Internal Standards | Stable Isotope-Labeled Analytes (SIL-IS), IROA Internal Standard (IROA-IS) | Compensate for ionization suppression/enhancement through co-elution with identical properties [26] [31] |
| Chromatographic | Mixed-mode columns, HILIC columns, ion-pairing reagents | Alter separation selectivity to resolve analytes from matrix interferences [29] [32] |
| Ionization | Formic acid, ammonium formate, ammonia mobile phase additives | Enhance ionization efficiency; control adduct formation; improve chromatographic peak shape [29] [27] |
Emerging Trends and Future Perspectives
The landscape of matrix effect management continues to evolve with technological advancements in mass spectrometry and analytical methodologies. Recent innovations showcased at the 2025 American Society of Mass Spectrometry (ASMS) conference highlighted trends toward improved workflow efficiency, instrument miniaturization without performance compromise, and enhanced capabilities for top-down analysis of intact proteins [33]. These developments include novel ionization sources, improved instrument diagnostics, and smart analytics to address system inconsistencies [33].
The integration of artificial intelligence and machine learning (AI/ML) features in data analysis software represents a promising direction for more automated and intelligent matrix effect compensation [33]. These approaches may enable real-time correction and more sophisticated normalization strategies beyond current capabilities. Additionally, the continued development of alternative ionization sources like FμTP that demonstrate inherently reduced susceptibility to matrix effects suggests a future where analytical techniques may become more robust to matrix challenges rather than relying solely on compensation approaches [27].
The IROA TruQuant Workflow exemplifies the trend toward comprehensive, systematic solutions to the ion suppression problem, particularly for non-targeted analyses [31]. By providing a universal approach to correct ion suppression across diverse analytical conditions and biological matrices, this methodology addresses a long-standing limitation in metabolomics and other omics fields [31]. As these technologies mature and become more widely adopted, the analytical community may achieve unprecedented levels of quantitative accuracy and reproducibility in complex matrices, ultimately enhancing the reliability of LC-MS across pharmaceutical, clinical, and environmental applications.
Matrix effects remain a pervasive challenge in LC-MS analyses, significantly impacting the quality and reliability of quantitative results across diverse application areas. Understanding the fundamental mechanisms underlying ion suppression and enhancement—including competitive ionization, changes in droplet properties, and gas-phase proton transfer reactions—provides the foundation for effective mitigation strategies. Comprehensive detection and evaluation through methods such as post-column infusion and post-extraction spike experiments enable researchers to identify and quantify these effects during method development.
A multi-pronged approach combining selective sample preparation, optimized chromatographic separation, appropriate ionization source selection, and effective internal standardization represents the most effective strategy for managing matrix effects. While complete elimination is often impossible, particularly in complex matrices, the combination of these approaches with emerging technologies including alternative ionization sources and advanced computational correction methods continues to improve analytical performance. As mass spectrometry technologies evolve toward greater sensitivity, speed, and robustness, matrix effect management will remain an essential consideration in method development and validation to ensure data quality and regulatory compliance.
In liquid chromatography-mass spectrometry (LC-MS), the journey of an analyte from a dissolved molecule to a detectable gas-phase ion is complex and fraught with potential losses. The overall ion utilization efficiency—defined as the proportion of analyte molecules in solution that are successfully converted into detected gas-phase ions—is a critical metric of instrument performance [34]. This efficiency is not governed by a single component but is a cascade of processes, each with its own potential for ion discrimination or loss [34]. Two fundamental areas exert paramount influence: the ion source geometry, where the initial ionization and droplet formation occur, and the ion optics, the system of electrostatic lenses and guides that transport and focus the ion beam into the mass analyzer [34]. The design and configuration of these elements directly impact key performance parameters, including sensitivity, robustness, and the accuracy of quantitative analysis, especially for complex mixtures [7] [35]. This guide examines the foundational impact of these components within the broader context of factors affecting ionization efficiency in LC-MS research.
Ion Source Geometries and Interface Designs
The ion source and initial interface are the first and one of the most critical stages in determining the ultimate sensitivity of an LC-MS system. Their primary function is to efficiently generate ions from the LC effluent and transmit them from atmospheric pressure into the high vacuum of the mass spectrometer.
Conventional ESI-MS Interfaces
The conventional electrospray ionization (ESI) interface typically employs a single metallic inlet capillary, heated to aid droplet desolvation. The ESI emitter is positioned close ( ~2–3 mm) to this sampling inlet [34]. A significant limitation of this design is the restricted conductance of the single capillary and the inherent ion losses on its inner surfaces and at subsequent apertures [34]. To quantify this, researchers have measured the transmitted ion current through the interface and correlated it with the observed signal in the mass spectrum. A multi-capillary inlet, consisting of several capillaries arranged in a bundle, represents one approach to increase the total sampling area and thus the transmitted ion current [34].
The SPIN-MS Interface
A paradigm shift in interface design is the Subambient Pressure Ionization with Nanoelectrospray (SPIN) interface. This configuration removes the sampling capillary entirely by placing the nanoESI emitter directly within the first vacuum stage of the mass spectrometer (at a pressure of ~20 Torr), adjacent to the entrance of an electrodynamic ion funnel [34]. This removal of the atmospheric-vacuum barrier dramatically improves ion transmission. Experimental comparisons show that the SPIN-MS interface exhibits greater ion utilization efficiency than a conventional ESI-MS interface [34]. The gains are most pronounced when the SPIN interface is coupled with a brighter ion source, such as an ESI emitter array, demonstrating that improvements in ion production are only fully realized when paired with a high-transmission interface [34].
Vaporization Micro-Channel in LEI
In alternative ionization techniques like Liquid Electron Ionization (LEI), the design of the vaporization region is equally critical. The vaporization micro-channel (VMC) is responsible for the nebulization and complete vaporization of the liquid flow before it reaches the electron ionization source [36]. Studies optimizing the LEI interface have tested different VMC capillary internal diameters (I.D.) and materials. For instance, moving from a 400 µm I.D. silica VMC capillary to a 500 µm I.D. one improved detectability, achieving limit of detection (LOD) values almost five times lower for some analytes [36]. The use of a deactivated silica capillary further enhanced performance by improving inertness, reducing gas-phase interactions, and minimizing analyte deposition [36].
Table 1: Comparative Analysis of LC-MS Interface Geometries
| Interface Type | Key Feature | Measured Advantage | Potential Drawback |
|---|---|---|---|
| Single Capillary Inlet [34] | Single heated metal capillary | Standard, robust design | Restricted ion transmission; significant losses |
| Multi-Capillary Inlet [34] | Bundle of seven inlet capillaries | Increased total transmitted ion current | More complex manufacturing and alignment |
| SPIN Interface [34] | Emitter inside vacuum; no capillary | Highest measured ion utilization efficiency | Requires modification of MS vacuum chamber |
| LEI with Optimized VMC [36] | 500 µm I.D. deactivated silica capillary | LODs ~5x lower for some PAHs/pesticides | Specific to LEI systems; requires flow splitting |
Ion Optics and Instrumental Settings
Once ions pass through the initial interface, their trajectory through the ion optics system is crucial. In an ESI-ion trap mass spectrometer, this system typically consists of a series of skimmers, octopoles, and lenses, culminating in the ion trap itself. The DC and RF voltages applied to these components must be carefully tuned to transmit and focus ions across a broad mass range without discrimination.
Key Parameters in ESI-Ion Trap MS
The following parameters in an ESI-IT-MS system have been quantitatively shown to significantly impact ion transmission and detection, particularly for accurate relative quantification [35] [37]:
- Capillary Exit (Cap Exit) Voltage: This voltage, applied at the exit of the transfer capillary, accelerates ions into the subsequent vacuum stage. It is crucial for declustering but can also induce in-source fragmentation. Its setting is especially critical for the transmission and accurate quantification of low m/z ions [35] [37].
- Octopole DC and RF Voltages: The octopoles guide and focus the ion beam. The DC voltage (especially Oct 2 DC) and RF amplitude (Oct RF) significantly impact absolute and relative ion intensities. An equation has been established to describe the relationship between Oct 2 DC, m/z, and the optimal Trap Drive voltage, allowing for the calculation of settings that prevent m/z-based discrimination [35].
- Trap Drive (TD): This is the amplitude of the RF voltage applied to the ring electrode of the ion trap. It controls the stability of ion trajectories within the trap and is profoundly mass-dependent. The Trap Drive at maximum intensity (TDmax) for an ion is a key parameter for optimization [35].
Impact on Quantitative Accuracy
The need for precise control of these settings is starkly illustrated in the quantitative analysis of isotopologous compounds, such as in cellulose ether analysis. Using equimolar binary mixtures of per-O-methyl and per-O-deuteromethyl cellooligosaccharides, researchers found that standard, non-optimized "smart" settings led to a clear decrease in the intensity ratio of the deuterated to non-deuterated isotopologs with increasing degree of polymerization (DP)—a clear sign of m/z discrimination [37]. However, by individually optimizing the Cap Exit, Oct 2 DC, and TD for each DP, this trend was eliminated. The measured intensity ratios became consistent across DP 2–6, ranging between 0.971 and 1.040, thereby enabling accurate relative quantification [37].
Table 2: Impact of Key Ion Optics Parameters on Quantitative Analysis
| Instrumental Parameter | Primary Function | Impact on Analysis | Optimization Finding |
|---|---|---|---|
| Capillary Exit Voltage [35] [37] | Ion acceleration & declustering | Critical for low m/z ion transmission; can cause fragmentation | Essential for correct quantification of small molecules/DP2 oligosaccharides |
| Octopole 2 DC Voltage [35] | Ion beam guidance & focusing | Major impact on absolute ion intensity and m/z discrimination | Linked to m/z and Trap Drive; an optimization equation was established |
| Trap Drive (TD) [35] [37] | Controls ion stability in trap | Mass-dependent storage efficiency; key for relative signal accuracy | TDmax must be determined and set for the target m/z to avoid bias |
| Compound Stability / Target Mass [37] | Automated setting of Cap Exit & optics | Can introduce significant m/z bias in relative quantification | Manual "expert mode" optimization is required for precise work |
Experimental Protocols for Instrument Evaluation
To systematically evaluate and optimize ion source and ion optics performance, researchers can employ the following detailed experimental protocols, derived from recent studies.
This method quantifies the overall efficiency of an ESI-MS interface by correlating transmitted electric current with the observed MS signal [34].
- Solution Preparation: Prepare a 1 µM solution of a standard peptide (e.g., angiotensin I) in 0.1% formic acid in 10% acetonitrile.
- Interface Configuration: Set up the interface to be tested (e.g., single capillary, multi-capillary, or SPIN).
- Current Measurement: Use a picoammeter to measure the total electric current of ions transmitted through the high-pressure ion funnel. This current includes both desolvated ions and residual charged clusters.
- MS Measurement: Simultaneously, acquire a mass spectrum and extract the total ion current (TIC) or the extracted ion current (EIC) for the analyte.
- Efficiency Calculation: The ratio of the MS-measured ion current (a measure of "useful" desolvated ions) to the total transmitted electric current provides a metric of the interface's ion utilization efficiency. A higher ratio indicates more effective desolvation and transmission of gas-phase ions [34].
Protocol 2: Optimizing Ion Optics for Relative Quantification
This protocol is designed to eliminate m/z-based discrimination during relative quantification, as used in the analysis of cellulose ethers [35] [37].
- Sample Preparation: Synthesize or obtain equimolar binary mixtures of analytes with a constant mass difference. Examples include:
- Syringe Pump Infusion: Directly infuse the binary mixture at a concentration of 10⁻⁶ M in a suitable solvent via a syringe pump, bypassing the LC system to isolate MS effects.
- Parameter Screening (Expert Mode): Operate the mass spectrometer in "expert mode" to directly control key voltages.
- Systematically vary the Cap Exit voltage for the lowest DP/smallest m/z analyte to maximize signal without inducing fragmentation [37].
- For a range of m/z values, systematically vary the Oct 2 DC and Trap Drive (TD) voltages. For each combination, record the intensity of the target ions.
- Data Analysis and Model Application:
- For each m/z, identify the Trap Drive at maximum intensity (TDmax).
- Establish a mathematical relationship (e.g., linear or logarithmic) between m/z, Oct 2 DC, and TDmax. This model can then be used to predict optimal settings for other m/z values [35].
- Validation: Measure the intensity ratio of the binary mixture under optimized conditions. The result should be close to 1.0 and show no consistent trend with m/z or concentration, confirming the elimination of instrumental bias [37].
Visualization of Ion Pathways and Optimization Workflow
The following diagrams, generated using Graphviz, illustrate the core concepts and experimental workflows described in this guide.
ESI-MS Ion Transmission Pathway
Ion Optics Optimization Workflow
The Scientist's Toolkit: Essential Research Reagents and Materials
The following table details key reagents and materials used in the foundational experiments cited, which are essential for conducting similar optimization and evaluation studies.
Table 3: Essential Research Reagents and Materials for Ionization Efficiency Studies
| Item Name | Specification / Example | Function in Experiment |
|---|---|---|
| Metabolite/Peptide Standards [7] [34] | Human angiotensin I, bradykinin, commercial metabolite library | Model analytes for testing sensitivity, ionization efficiency, and ion transmission. |
| Isotopologous Analytes [37] | Per-O-Me-/Per-O-Me-d₃ cellooligosaccharides | Critical for quantifying m/z discrimination in relative quantification without chemical bias. |
| Labeling Reagents [35] | m-Aminobenzoic acid (mABA) | Introduces a fixed charge to carbohydrates for controlled ionization, improving quantitative accuracy. |
| Etched Fused Silica Emitters [34] | O.D. 150 µm, I.D. 10 µm, chemically etched | NanoESI emitters for stable, high-efficiency ion production at low flow rates. |
| Deactivated Silica Capillaries [36] | e.g., Agilent CP805310 | Used in vaporization regions (e.g., LEI-VMC) to improve inertness, reduce analyte interaction, and enhance detectability. |
| Syringe Pump [34] [37] | e.g., Harvard Apparatus Model 22 | For direct infusion experiments, allowing isolation of MS performance from LC separation effects. |
Strategic Method Development: Practical Approaches to Control Ionization Efficiency
In Liquid Chromatography-Mass Spectrometry (LC-MS), the path to reliable data begins long before the sample is injected into the instrument. The ionization efficiency of an analyte within the mass spectrometer's ion source is the pivotal determinant of sensitivity and signal robustness. This efficiency, however, is profoundly susceptible to compromise by co-eluting matrix components, a phenomenon known as ion suppression or matrix effects [24]. Sample preparation serves as the first and most crucial line of defense against these detrimental effects. It is not merely a preliminary step but a foundational strategy to ensure that ionization occurs in an unobstructed manner, leading to accurate quantification, superior detection limits, and robust method performance [38] [39]. This guide details the core techniques of Solid-Phase Extraction (SPE), Protein Precipitation (PPT), and matrix-specific cleanup, framing them within the essential context of safeguarding ionization efficiency in LC-MS research.
The Ionization Process and the Problem of Matrix Effects
Mechanisms of Ion Suppression
In electrospray ionization (ESI), the most common LC-MS interface, ion suppression occurs when non-analyte molecules in the sample co-elute and interfere with the efficient ionization of the target compound [40]. These interfering substances, which can include salts, phospholipids, metabolites, or residual proteins, compete for available charge or disrupt the droplet formation and desolvation processes at the ion source [41] [24]. The consequences are dire: a suppressed or enhanced analyte signal, reduced sensitivity, poor precision, and inaccurate quantification [24] [39]. Evidence suggests that ion suppression is more pronounced in ESI than in Atmospheric Pressure Chemical Ionization (APCI) because the ionization process in ESI occurs in the condensed phase before droplets enter the gas phase, making it more vulnerable to competing species [24].
The Strategic Imperative of Sample Cleanup
The primary goal of advanced sample preparation is to remove these interfering matrix components. A well-designed cleanup protocol directly enhances ionization efficiency by reducing the "noise" of the chemical background, thereby allowing the "signal" of the analyte's ionization to proceed unimpeded. This is not an optional refinement but a necessity for methods analyzing complex matrices like plasma, urine, or tissue homogenates, where the chemical background is rich and variable [38]. By implementing techniques like SPE and PPT, researchers can directly mitigate the risk of ion suppression, turning an unpredictable analysis into a controlled and reliable one.
Core Sample Preparation Techniques
Solid-Phase Extraction (SPE)
SPE is a highly versatile and selective sample preparation technique that utilizes a solid sorbent to isolate and concentrate analytes from a liquid sample. Its principle is based on the partitioning of compounds between a solid and a liquid phase, where analytes are retained on the sorbent based on specific chemical interactions and then eluted using a solvent that disrupts those interactions [42].
Experimental Protocol: A Generic SPE Procedure
The typical SPE procedure consists of five critical steps [42]:
- Sorbent Activation/Conditioning: The sorbent bed is treated with a strong solvent (e.g., methanol) to solvate the functional groups, followed by a weak solvent (e.g., water or buffer) that mimics the sample matrix. This prepares the sorbent surface for optimal analyte retention.
- Sample Loading: The prepared sample is passed through the cartridge. Analytes of interest are retained on the sorbent while some matrix interferences flow through.
- Washing: A wash solvent with weak elution strength is applied to remove weakly adsorbed matrix components without displacing the analytes. This is a key step for reducing ion suppression.
- Elution: The analytes are desorbed from the sorbent and collected using a small volume of a strong, volatile solvent that has a greater affinity for the analytes.
- Sample Reconstitution: The eluate is often evaporated to dryness and the residue is reconstituted in a solvent compatible with the LC-MS starting mobile phase, serving to concentrate the sample and improve sensitivity.
Sorbent Chemistry and Selection
The selectivity of SPE is governed by the chemistry of the sorbent. Choosing the correct sorbent is paramount for success. The table below summarizes common sorbent types and their applications.
Table 1: Common SPE Sorbents and Their Applications in LC-MS
| Sorbent Type | Abbreviation | Chemical Description | Mechanism | Ideal For |
|---|---|---|---|---|
| Reversed-Phase | C18, C8, ODS | Octadecyl or octyl chains bonded to silica | Hydrophobic interactions | Non-polar to moderately polar analytes |
| Hydrophilic-Lipophilic Balanced | HLB | Balanced copolymer of lipophilic and hydrophilic monomers | Mixed-mode (hydrophobic and hydrophilic) | Broad range of analytes; very versatile [43] |
| Normal-Phase | SIL | Underivatized silica gel | Polar interactions (hydrogen bonding, dipole-dipole) | Polar compounds |
| Strong Cation Exchange | SCX | Aromatic sulfonic acid groups | Ionic attraction to positively charged analytes | Basic compounds |
| Strong Anion Exchange | SAX | Quaternary amine groups | Ionic attraction to negatively charged analytes | Acidic compounds |
| Mixed-Mode | MCX, WAX, PSA+C18 | Combination of non-polar and ion-exchange groups | Mixed-mode (hydrophobic and ionic) | High selectivity; basic, acidic, or neutral compounds in complex matrices [43] |
Recent advances have focused on high-throughput formats. For instance, one study developed a robust SPE protocol in a 96-well plate format for exposomics, achieving acceptable extraction recoveries for >70% of analytes and significantly reducing matrix effects in plasma and urine, thereby meeting the throughput demands of large-scale studies [43].
Protein Precipitation (PPT)
Protein Precipitation is the simplest and fastest sample preparation technique, primarily used for biological fluids like plasma and serum. It involves adding an organic solvent (e.g., acetonitrile or methanol) to the sample in a specific ratio, which denatures and precipitates proteins. These precipitates are then removed by centrifugation, yielding a relatively clean supernatant for analysis [44].
Experimental Protocol: Standard PPT Procedure
- Sample Aliquoting: A measured volume of the biological sample (e.g., 100 µL of plasma) is transferred to a microcentrifuge tube.
- Precipitant Addition: A larger volume of organic solvent (typically 2-3 times the sample volume) is added. Acetonitrile is often preferred as it efficiently precipitates a wide range of proteins.
- Vortexing and Centrifugation: The mixture is vortexed vigorously to ensure complete protein denaturation and then centrifuged at high speed (e.g., 10,000-15,000 x g) for 10-15 minutes to form a solid protein pellet.
- Supernatant Collection: The clear supernatant is carefully collected, avoiding disturbance of the pellet.
- Evaporation and Reconstitution (Optional): The supernatant can be evaporated to dryness and the residue reconstituted in the LC-MS starting mobile phase. This step enhances sensitivity by concentrating the analytes and transferring them into a more compatible solvent.
While PPT is rapid and effective at removing proteins, it is a non-selective cleanup. Consequently, it leaves behind many non-protein matrix components (e.g., phospholipids, salts) in the supernatant, which can be a significant source of ion suppression in LC-MS analysis [38]. Its use is therefore best suited for applications where high throughput is a greater priority than ultimate sensitivity.
Comparative Analysis of SPE and PPT
The choice between SPE and PPT involves a trade-off between selectivity, cleanliness, and throughput. The following workflow diagram and quantitative table illustrate these key differences.
Diagram 1: A comparative workflow of SPE and PPT, highlighting the trade-off between throughput and sample cleanliness.
Table 2: Quantitative Comparison of SPE and PPT Performance
| Parameter | Protein Precipitation (PPT) | Solid-Phase Extraction (SPE) |
|---|---|---|
| Typical Extraction Recovery | Generally high, but analyte-dependent | Can be optimized for high recovery (>70% for most analytes) [43] |
| Matrix Effect Reduction (SSE*) | Limited; many interferences remain | Effective; can achieve SSE of 60-140% for >86% of analytes [43] |
| Analyte Concentration Factor | Low (unless supernatant is evaporated) | High (inherent to the elution process) |
| Selectivity | Very Low | High (depends on sorbent chemistry) |
| Sample Cleanliness | Low | High |
| Throughput | High (simple, fast, automatable) | Moderate to High (especially in 96-well format) [43] |
| Risk of Ion Suppression | Higher | Lower |
| Best Suited For | High-throughput screening, initial method scoping | Regulated bioanalysis, low-abundance analytes, complex matrices |
SSE: Signal Suppression and Enhancement. Values closer to 100% indicate negligible matrix effects.
The Scientist's Toolkit: Essential Research Reagent Solutions
Successful implementation of sample preparation techniques relies on a set of key reagents and materials. The following table details this essential toolkit.
Table 3: Essential Research Reagent Solutions for LC-MS Sample Preparation
| Item | Function & Importance |
|---|---|
| SPE Sorbents (C18, HLB, Mixed-Mode) | The core of SPE selectivity; chosen based on analyte chemistry (see Table 1) to retain targets and exclude matrix interferences [42]. |
| Protein Precipitants (Acetonitrile, Methanol, Acetone) | Denature and precipitate proteins in PPT. Acetonitrile is often favored for its superior protein precipitation efficiency. |
| Volatile Buffers (Ammonium Formate, Ammonium Acetate) | Used to adjust sample pH for SPE to ensure analytes are in the correct ionic form for retention. Their volatility prevents source contamination and ion suppression in the MS [41]. |
| High-Purity Organic Solvents (MeOH, ACN) | Used for SPE conditioning, washing, and elution, as well as for PPT. High LC-MS grade purity is critical to minimize background noise. |
| Ion-Pairing Reagents (TFA, HFBA) | Generally to be AVOIDED. While they can improve chromatography for some analytes, they are non-volatile and cause severe, persistent ion suppression [41]. Volatile alternatives should be sought. |
| Phospholipid Removal Sorbents (e.g., Zirconia-coated silica) | Specialized sorbents used in cleanup plates to selectively remove phospholipids, a major class of compounds responsible for ion suppression in ESI [42]. |
| Internal Standards (Stable Isotope-Labeled) | Added to the sample at the beginning of preparation. They correct for variability in recovery during extraction and for ion suppression/enhancement during analysis, improving data accuracy [38]. |
In the pursuit of optimal ionization efficiency in LC-MS, sample preparation is not a mere preliminary step but a foundational strategy. The choice between techniques like SPE and PPT represents a critical decision point that directly impacts the severity of matrix effects and the quality of the final data. SPE offers a powerful, selective defense, capable of purifying and concentrating analytes to deliver a clean sample to the ion source. PPT provides a rapid, high-throughput alternative, albeit with a higher residual risk of ion suppression. By understanding the mechanisms of ion suppression and applying the principles and protocols outlined in this guide, researchers and drug development professionals can design sample preparation workflows that act as a robust first line of defense. This ensures that the full sensitivity and precision of the LC-MS platform are realized, yielding data that is not only detectable but truly reliable.
Chromatographic Optimization to Separate Analytes from Interferences
In liquid chromatography-mass spectrometry (LC-MS), the goal of chromatographic optimization is to achieve the precise separation of target compounds from complex sample matrices. This process is not merely about resolution; it is a fundamental prerequisite for maximizing ionization efficiency and ensuring data integrity. Matrix components that co-elute with analytes can cause significant ion suppression or enhancement, directly impacting the accuracy and sensitivity of quantitative results [19] [45]. This guide details practical strategies for developing robust chromatographic methods that effectively isolate analytes from interferences, thereby enhancing the overall performance of LC-MS analyses within the broader context of ionization efficiency research.
Core Principles: Interferences and Ionization Efficiency
Understanding the nature of interferences and their impact on the ionization process is the first step in method development.
Types and Origins of Interferences
Interferences in LC-MS can be categorized based on their source and effect:
- Matrix Effects: These occur when non-target compounds from the sample matrix co-elute with the analyte and alter its ionization efficiency in the MS source [19]. Common matrix components include lipids, proteins, salts, and pigments [46]. These compounds compete for charge and space on the surface of the electrospray droplet, leading to signal suppression or, less commonly, enhancement [19] [45].
- Cross-Signal Contribution: This phenomenon describes the appearance of an unexpected peak in the MS/MS channel of one compound after the injection of another, supposedly pure, compound [45]. This can be caused by chemical contamination, in-source fragmentation, or insufficient purity of stable isotope-labeled internal standards (SIL-IS) [45].
The Link Between Separation and Ionization
The electrospray ionization (ESI) process is highly susceptible to the chemical environment. A stable and efficient spray, leading to a dense plume of gas-phase ions, is dependent on the composition of the LC eluent entering the source [19]. When interferences co-elute, they disrupt this environment. Effective chromatographic separation ensures that the analyte enters the ion source in a "clean" mobile phase, which minimizes charge competition and provides consistent droplet formation and desolvation, leading to optimal and reproducible analyte signal [19].
Optimization Strategies and Experimental Protocols
A systematic approach to optimization is key to developing a successful method. The following workflow outlines the critical stages.
Sample Preparation for Interference Removal
The first line of defense against interferences is sample clean-up. The choice of technique depends on the sample matrix and the analytes' physicochemical properties [19].
Detailed Protocol: Solid-Phase Extraction (SPE) SPE is a widely used technique for concentrating analytes and removing matrix interferences [47].
- Conditioning: Pass 3-5 mL of a strong solvent (e.g., methanol) through the SPE sorbent, followed by 3-5 mL of a weak solvent (e.g., water or a buffer matching the sample pH). This activates the sorbent and prepares it for sample loading.
- Equilibration: Do not allow the sorbent bed to dry. Pass 3-5 mL of the weak solvent again to ensure a compatible environment for the sample.
- Loading: Load the prepared sample (e.g., centrifuged and pH-adjusted) onto the cartridge at a slow, controlled flow rate (1-5 mL/min) to maximize analyte retention.
- Washing: Remove weakly retained interferences by passing 3-5 mL of a wash solvent. This is typically a mixture of water and a weak organic solvent (e.g., 5% methanol).
- Elution: Collect the target analytes by passing 1-2 mL of a strong solvent (e.g., pure methanol or acetonitrile, often acidified or basified) that disrupts the analyte-sorbent interaction.
- Reconstitution: Evaporate the eluent to dryness under a gentle stream of nitrogen and reconstitute the residue in the initial mobile phase composition of the LC method. This ensures compatibility with the chromatographic system.
Liquid Chromatography Method Development
The chromatographic conditions are the primary tool for achieving physical separation.
Stationary Phase Selection
The choice of LC column is critical for resolving analytes from structurally similar interferences.
Table 1: Guide to Reversed-Phase Column Selection
| Column Type | Best For | Key Mechanism | Considerations |
|---|---|---|---|
| C18 (Octadecyl) | Most non-polar to medium-polar compounds; universal first choice. | Hydrophobic interactions. | May not retain very polar analytes sufficiently. |
| Phenyl | Compounds with aromatic rings, planar molecules. | Hydrophobic interactions + π-π interactions. | Can offer different selectivity compared to C18. |
| Polar-Embedded | Polar compounds, basic analytes. | Hydrophobic interactions + H-bonding. | Can reduce peak tailing for basic compounds. |
| HILIC (Hydrophilic) | Very polar and hydrophilic compounds. | Partitioning into a water-rich layer on a polar stationary phase. | Uses high-organic mobile phases (e.g., >70% ACN). |
Mobile Phase and Gradient Optimization
The mobile phase composition and the gradient profile control elution strength and selectivity. A scouting gradient (e.g., 5-100% organic modifier over 10-20 minutes) is a good starting point. For fine-tuning, Design of Experiments (DoE) is a powerful efficiency tool [48]. For instance, a Box-Behnken Design can be applied to optimize three critical factors simultaneously: gradient time, mobile phase pH, and temperature [48]. The experimental responses to monitor are resolution between critical pairs and peak asymmetry.
Detailed Protocol: Performing a Scouting Gradient
- Install a C18 column (e.g., 100-150 mm x 2.1 mm, 2-3 µm).
- Set the mobile phase A to water with 0.1% formic acid and B to acetonitrile or methanol with 0.1% formic acid.
- Set a linear gradient from 5% B to 95% B over 15 minutes.
- Set the flow rate to 0.3-0.5 mL/min and the column temperature to 40°C.
- Inject a standard mixture containing your analytes and expected interferences.
- Analyze the chromatogram to identify co-elutions and determine the approximate elution window for each analyte.
Mass Spectrometry Source Optimization
Once chromatographic separation is achieved, the MS source parameters must be tuned to maximize the signal for the now-isolated analytes.
Detailed Protocol: Iterative Source Optimization
- Infusion Setup: Connect a syringe pump containing a standard solution of your analyte (in the mobile phase at its expected elution composition) directly to the MS source via a T-connector, with the LC flow running.
- Capillary Voltage: Start with a manufacturer-recommended value (e.g., 3.0 kV for ESI+). Adjust in small increments (±0.2 kV) while monitoring the total ion current (TIC) or the specific analyte signal. The goal is a stable, maximum signal.
- Desolvation Temperature: Start at 300°C. Increase in 25-50°C increments. Caution: Monitor for signal loss due to thermal degradation of labile analytes [19]. As shown in Figure 2 of the search results, an increase from 400°C to 550°C boosted the signal for methamidophos by 20%, but caused complete signal loss for the thermally labile emamectin B1a benzoate [19].
- Nebulizing and Drying Gas: Adjust flows to achieve a stable spray. Higher flows are often needed for higher aqueous mobile phases or faster flow rates [19]. This process can lead to a two- to threefold improvement in sensitivity [19].
Advanced Troubleshooting: Cross-Signal Contribution
Cross-signal contribution is a particularly challenging type of interference that requires specific diagnostic procedures [45].
Detailed Protocol: Testing for Cross-Signal Contribution
- Prepare Solutions: Prepare a pure standard of compound A and a pure standard of compound B at concentrations typical for your method.
- Inject and Monitor: Inject standard A and monitor the MRM channels for both A and B. Similarly, inject standard B and monitor the channels for both B and A.
- Analyze Results: An unexpected peak in the channel of B when A is injected indicates cross-signal contribution.
- Diagnose Source: Follow the diagnostic flowchart above. If the retention times of the interference and the true B standard match, the most likely cause is contamination of the A standard with B [45]. If they differ, investigate in-source fragmentation of A producing a fragment with the same m/z as B.
The Scientist's Toolkit: Essential Research Reagents and Materials
The following table catalogues key materials and reagents critical for experiments in this field.
Table 2: Essential Research Reagents and Materials for LC-MS Method Development
| Item | Function / Explanation |
|---|---|
| Stable Isotope-Labeled Internal Standards (SIL-IS) | Corrects for analyte loss during sample prep and for matrix effects during ionization; purity is critical to avoid cross-signal contribution [45]. |
| Ammonium Acetate / Formate Buffers | Provides volatile buffering capacity for mobile phases; essential for controlling pH for separation without causing ion source contamination. |
| Mass Spectrometry-Grade Acids & Solvents | High-purity formic acid, acetonitrile, and methanol minimize chemical noise and background ions, improving signal-to-noise ratio. |
| Solid-Phase Extraction (SPE) Cartridges | Selectively retains analytes or interferences for sample clean-up and pre-concentration; available in various sorbents (C18, Mixed-Mode, etc.) [47]. |
| U/HPLC Columns (e.g., C18, Phenyl, HILIC) | The core component for separation; particle size (e.g., sub-2µm), pore size, and surface chemistry dictate efficiency and selectivity [48]. |
Successfully separating analytes from interferences is a multi-faceted endeavor that is inextricably linked to achieving high ionization efficiency in LC-MS. It requires a holistic strategy that integrates effective sample preparation, meticulous chromatographic method development using modern tools like DoE, and precise tuning of the MS interface. Furthermore, analysts must be vigilant for subtle phenomena like cross-signal contribution. By adhering to the systematic protocols and diagnostic strategies outlined in this guide, researchers can develop robust, sensitive, and reliable LC-MS methods that yield high-quality data, ultimately supporting confident decision-making in drug development and other advanced research fields.
In Liquid Chromatography-Mass Spectrometry (LC-MS), the mobile phase is not merely a carrier; it is a critical component of the ionization environment that directly influences the sensitivity, robustness, and accuracy of the analysis. The ionization efficiency in the electrospray ionization (ESI) source can vary by over 6 orders of magnitude between different compounds, and the chemical composition of the mobile phase is a dominant factor in this process [21]. Mobile phase engineering—the strategic selection and optimization of volatile buffers and additives—is therefore foundational to method performance. Its impact extends to controlling chromatographic selectivity, shaping peak morphology, and most importantly, modulating the ionization efficiency of analytes, which is a core thesis of this work. Poor choices in mobile phase composition can lead to issues like ion suppression, unpredictable retention times, and poor peak shapes, ultimately compromising data quality [49] [38]. This guide provides an in-depth examination of how to select and optimize volatile buffers and additives to maximize LC-MS performance, framed within the critical context of ionization efficiency.
Core Principles: Buffer Capacity and Volatility
What Constitutes a Buffer in LC-MS?
A buffer is a solution that resists changes in pH upon the addition of small quantities of acid or base. This property is quantified by its buffer capacity (β), which is maximized when the mobile phase pH is within approximately ±1 unit of the buffering agent's pKa [49]. In LC-MS, this buffering action is essential for maintaining reproducible retention times for ionogenic analytes (acids, bases, amphoteric compounds). However, a crucial additional requirement for LC-MS is volatility. Non-volatile buffers (e.g., phosphates) can precipitate in the ion source and MS interface, causing severe signal suppression and instrument contamination. Volatile additives, such as ammonium salts of formic, acetic, and carbonic acids, are therefore mandatory for maintaining a stable spray and high sensitivity [49] [50] [51].
The Direct Link to Ionization Efficiency
The mobile phase composition directly affects ionization efficiency (IE) through several mechanisms:
- Droplet Chemistry: In ESI, the formation of gas-phase ions is a complex process that begins with charged droplets. The additives in the mobile phase determine the initial charge concentration of these droplets. Contrary to simple pH considerations, the electrochemical processes at the ESI needle are paramount. For instance, in negative ion mode, an acidic additive like formic acid readily deprotonates; the protons are reduced to hydrogen gas at the needle, leaving an excess of formate anions that populate the droplet surface. These anions are then available to deprotonate acidic analyte molecules, facilitating their detection as [M-H]⁻ ions. Using a basic buffer in negative mode can paradoxically reduce sensitivity because it is more difficult to build up the necessary excess negative charge [51].
- Solution Chemistry: While droplet processes are key, the pH and buffer type also influence the pre-ionization state of the analyte in solution. The efficiency of ion evaporation from the droplet surface is influenced by the surface activity and inherent polarity of the analyte [21].
- Physical Properties: The organic modifier content affects the surface tension and evaporation rate of the droplets, which in turn influences the rate at which Coulomb explosions occur and ions are released [21]. Higher organic content generally improves ionization efficiency.
Selecting Volatile Buffers and Additives
The choice of buffer and its concentration is a balance between providing sufficient buffering capacity for chromatographic stability and maximizing ionization efficiency and spray stability for detection.
A Guide to Common Volatile Additives
Table 1: Common Volatile Buffers and Additives for LC-MS.
| Additive/Buffer | Typical Concentration | Useful pH Range | Compatible MS Modes | Key Characteristics and Applications |
|---|---|---|---|---|
| Formic Acid | 0.05 - 0.2% (v/v)~ 10 - 50 mM | 1.8 - 3.8 (Acidic) | ESI(+) (Primary)ESI(-) | Strongly acidic; very volatile; can promote [M+H]+ formation; may cause formate adducts [M+HCOO]⁻ in ESI(-) [52] [51]. |
| Ammonium Formate | 2 - 10 mM | ~ 3 - 5 (Acidic) | ESI(+) & ESI(-) | Provides true buffering in acidic pH; common in metabolomics and lipidomics [52]. |
| Acetic Acid | 0.05 - 0.2% (v/v)~ 5 - 20 mM | 3.8 - 5.8 (Acidic) | ESI(+) (Primary)ESI(-) | Weaker acid than formic acid; less likely to cause adducts; useful for more fragile compounds [51]. |
| Ammonium Acetate | 2 - 10 mM | 3.8 - 5.8 (Near Neutral) | ESI(+) & ESI(-) | Most common "neutral" buffer; low buffering at pH 7 without organic solvent; beware of pH shifts with organic modifier [49] [50] [52]. |
| Ammonium Hydroxide /Ammonium Bicarbonate | 0.01 - 0.1% (v/v)2 - 10 mM | 8.5 - 10.5 (Basic) | ESI(-) (Primary) | Promotes [M-H]⁻ formation for strong acids; requires a column stable at high pH [52]. |
| Ammonium Fluoride | ~ 0.5 mM | Varies | ESI(-) | Niche additive reported to increase sensitivity in negative mode for some applications [51]. |
Optimizing Additive Composition for Analyte Classes
Systematic studies reveal that different analytical classes benefit from tailored mobile phase compositions to maximize the number of detected features, signal intensity, and chromatographic quality.
Table 2: Optimized Mobile Phase Compositions for Different Analytical Applications.
| Analytical Application | Recommended Separation Mode | Optimal Mobile Phase Modifiers | Experimental Findings and Rationale |
|---|---|---|---|
| Untargeted Metabolomics (Polar Metabolites) | HILIC (ESI+) | 10 mM Ammonium Formate + 0.125% Formic Acid | Provided best performance for amino acids, biogenic amines, sugars, nucleotides; enabled baseline separation of leucine/isoleucine isomers; superior to neutral or basic pH modifiers [52]. |
| Untargeted Metabolomics (Organic Acids) | RPLC (ESI-) | 0.1% Formic Acid | Outperformed buffered systems for organic acids like fumarate, lactate, and succinate in a fast LC-MS method [52]. |
| Lipidomics | RPLC (ESI+) | 10 mM Ammonium Formate OR10 mM Ammonium Formate + 0.1% Formic Acid | Both permitted high signal intensity for various lipid classes and provided robust retention times [52]. |
| Lipidomics | RPLC (ESI-) | 10 mM Ammonium Acetate + 0.1% Acetic Acid | Represented a reasonable compromise for signal intensity and stable retention times compared to the salt or acid alone [52]. |
| Broad-Spectrum Contaminants | RPLC (PFP Column) | Ammonium Formate or Acetate (concentration optimized via DoE) | A Design of Experiments (DoE) approach was used to optimize flow rate and temperature for 40 contaminants with wide logD ranges, achieving analysis in 29 min [53]. |
Experimental Protocols for Mobile Phase Optimization
Protocol 1: Systematic Assessment of Mobile Phase Modifiers
This protocol is adapted from untargeted metabolomics studies [52] and is ideal for screening different modifiers for a new application.
Objective: To identify the mobile phase modifier that provides the best combination of signal intensity, chromatographic peak shape, and retention time stability for a set of target analytes.
Materials:
- LC-MS system with ESI source.
- Appropriate analytical column (e.g., HILIC for polar metabolites, RPLC for lipids).
- Standard mixture of target analytes.
- LC-MS grade water and organic solvents (ACN, MeOH).
- Stock solutions of volatile additives: Formic acid, Acetic acid, Ammonium formate, Ammonium acetate, Ammonium hydroxide.
Methodology:
- Preparation: Prepare at least 1 liter of each mobile phase to be tested. For example:
- Modifier A: 0.1% Formic Acid
- Modifier B: 10 mM Ammonium Formate
- Modifier C: 10 mM Ammonium Formate + 0.125% Formic Acid
- Modifier D: 10 mM Ammonium Acetate
- Modifier E: 10 mM Ammonium Bicarbonate
- Column Equilibration: For each modifier condition, equilibrate the column with a minimum of 10 column volumes of the starting mobile phase composition.
- System Suitability: Inject the standard mixture and a representative matrix sample (e.g., serum extract) multiple times (n=5-10) to assess performance.
- Data Analysis: Evaluate the following responses for each analyte and modifier:
- Peak Area/Height: A proxy for ionization efficiency.
- Peak Width: Indicator of chromatographic efficiency.
- Retention Time Stability: Calculate the relative standard deviation (RSD%) across replicates.
- Separation of Isomers: Ability to resolve critical pairs (e.g., leucine/isoleucine).
- Total Number of Features: In untargeted analysis, the number of molecular features after blank subtraction.
Protocol 2: Multivariate Optimization Using Design of Experiments (DoE)
For methods requiring high robustness, a DoE approach is superior to the one-variable-at-a-time (OVAT) approach as it captures factor interactions [53] [50].
Objective: To define a Method Operable Design Region (MODR) where the analytical method consistently meets performance criteria.
Materials:
- As in Protocol 1.
- DoE software (e.g., JMP, Design-Expert, or open-source alternatives).
Methodology:
- Define Factors and Responses: Select critical factors (e.g., buffer concentration, pH, column temperature, gradient time) and measurable responses (e.g., critical resolution, peak capacity, signal-to-noise ratio).
- Create Experimental Design: A Face-Centered Central Composite Design is often suitable for 2-4 factors. This typically requires 15-30 experimental runs.
- Execute Experiments: Run the experiments in a randomized order to minimize bias.
- Model and Analyze: Fit the data to a quadratic model and generate response surfaces. These surfaces reveal how factors interact to affect the responses.
- Define the Design Space: Identify the multidimensional region where all responses meet the pre-defined acceptance criteria (Analytical Target Profile). Operating within this space ensures method robustness.
Diagram 1: DoE-based Method Optimization Workflow. The structured approach ensures a robust and well-understood method.
The Scientist's Toolkit: Essential Reagents and Materials
Table 3: Key Research Reagent Solutions for Mobile Phase Engineering.
| Item | Function / Rationale | Critical Notes |
|---|---|---|
| LC-MS Grade Solvents & Water | Base solvents for mobile phase preparation. Minimizes background ions and "ghost peaks" that contribute to noise and elevate detection limits [54] [55]. | Essential for high-sensitivity work. |
| High-Purity Volatile Additives | Source of buffering ions and pH control (e.g., Formic Acid, Ammonium Acetate). Purity minimizes contamination. | Use fresh acids (<7 days from opening) to prevent pH drift and microbial growth [55]. |
| 0.22 μm Nylon or PVDF Filters | Filtration of all aqueous buffers and samples. Prevents particulate buildup in LC tubing, column frits, and the MS source, avoiding pressure spikes and signal instability [55]. | Do not filter organic solvents through aqueous-compatible filters. |
| Dedicated Clean Glassware | Preparation and storage of mobile phases. Prevents cross-contamination from surfactants or previous chemicals [55]. | |
| pH Meter with ATC Probe | Verification of aqueous buffer pH before organic solvent mixing. Ensures reproducibility, as pH measurement in organic-rich solvents is complex and unreliable [50]. | Use the "weights-and-volumes" method for highest precision if a meter is unavailable [50]. |
| Core-Shell PFP Column | Stationary phase for separating complex mixtures with diverse polarities. Provides multiple interaction mechanisms (e.g., π-π, dipole-dipole) [53]. | Ideal for broad-spectrum contaminant analysis. |
| HILIC Column (e.g., BEH Amide) | Retention of highly polar metabolites not held by RPLC. Uses high-organic mobile phases, which can enhance ESI efficiency [52]. | Essential for comprehensive polar metabolomics. |
Troubleshooting Common Mobile Phase-Related Issues
Even with careful planning, issues can arise. The following decision tree helps diagnose and resolve common mobile phase-related problems in LC-MS.
Diagram 2: Mobile Phase Troubleshooting Guide. A logical pathway to diagnose common issues.
Mobile phase engineering is a precise science that sits at the intersection of separation chemistry and ionization physics. The strategic selection of volatile buffers and additives—guided by the principles of buffer capacity, analyte chemistry, and the nuances of the electrospray process—is not a mere preliminary step but a continuous optimization process. By adopting a systematic, evidence-based approach, such as the experimental protocols outlined herein, researchers can transform the mobile phase from a passive carrier into an active tool for enhancing ionization efficiency. This, in turn, unlocks higher sensitivity, improved robustness, and more reliable quantification in LC-MS, directly supporting critical research and development objectives in pharmaceuticals and life sciences.
In liquid chromatography-mass spectrometry (LC-MS), the sample matrix is defined as all components of the sample other than the target analyte [56]. Matrix effects occur when compounds co-eluting with the analyte interfere with the ionization process in the mass spectrometer, leading to either ion suppression or enhancement [26]. This phenomenon represents a fundamental challenge for quantitative bioanalysis because it directly impacts the accuracy, precision, and sensitivity of measurements [26] [57].
The mechanisms behind matrix effects are multifaceted. Less-volatile compounds may affect the efficiency of droplet formation and reduce the ability of charged droplets to convert into gas-phase ions [26]. Co-eluting interfering compounds, especially basic compounds, may deprotonate and neutralize analyte ions, reducing the formation of protonated analyte ions [26]. Additionally, high-viscosity interfering compounds can increase the surface tension of charged droplets, reducing droplet evaporation efficiency [26]. The electrospray ionization (ESI) interface is particularly susceptible to these effects compared to other ionization techniques like atmospheric pressure chemical ionization (APCI) [57].
Within the context of ionization efficiency research, matrix effects represent a significant confounding variable that can compromise the relationship between analyte concentration and detector response. This article explores how internal standards serve as a critical tool for correcting these effects, thereby ensuring data reliability in quantitative LC-MS analysis.
The Mechanisms of Matrix Effects and Their Impact on Quantitation
Matrix effects fundamentally disrupt the quantitation process in LC-MS by altering the detector response to the presence of an analyte [56]. In an ideal system, the detector response is linearly proportional to the analyte concentration, but matrix components can either enhance or suppress this response, leading to inaccurate quantification [26] [57].
The post-column infusion experiment provides a powerful visual demonstration of this phenomenon. In this setup, a constant flow of analyte is infused into the HPLC eluent while a blank sample extract is injected [26]. The resulting chromatogram shows regions where the analyte signal is suppressed or enhanced due to co-eluting matrix components, clearly identifying the retention time windows most affected by matrix effects [26]. This method, while qualitative, helps method developers adjust chromatographic conditions to avoid these critical regions.
Another common approach for assessing matrix effects is the post-extraction spike method, which compares the signal response of an analyte in neat mobile phase with the signal response of an equivalent amount of the analyte spiked into a blank matrix sample after extraction [26]. The difference in response indicates the extent of the matrix effect. However, this method requires blank matrix, which is not available for endogenous analytes [26].
Table 1: Common Methods for Detecting Matrix Effects in LC-MS
| Method | Principle | Advantages | Limitations |
|---|---|---|---|
| Post-Column Infusion | Constant analyte infusion with blank matrix injection to visualize suppression/enhancement zones | Qualitative identification of problematic retention time windows | Time-consuming; requires additional hardware; not ideal for multi-analyte samples [26] |
| Post-Extraction Spike | Comparison of analyte response in neat solvent vs. spiked blank matrix | Quantitative assessment of matrix effect magnitude | Requires blank matrix (unavailable for endogenous compounds) [26] |
| Internal Standard Normalized Matrix Effect | Evaluation of IS correction power across different sample lots | Assesses effectiveness of the chosen internal standard | Requires multiple sample lots for robust evaluation [58] |
The impact of matrix effects is particularly pronounced in complex biological matrices such as blood, plasma, urine, and tissue extracts, where composition varies significantly between samples [57]. Furthermore, matrix effects can occur even in the absence of sample matrix due to trace impurities in the mobile phase [57], highlighting the pervasive nature of this challenge in LC-MS analysis.
Diagram 1: Matrix Effect Mechanisms and Impact Pathway. This diagram illustrates how various factors lead to ionization interference and ultimately compromise quantitative accuracy in LC-MS analysis.
Internal Standard Selection: Strategies and Considerations
The fundamental principle of internal standard (IS) correction lies in adding a known quantity of a reference compound to all samples to account for variability introduced during sample preparation, chromatographic separation, and mass spectrometric detection [59]. By tracking the IS response relative to the analyte, researchers can normalize fluctuations caused by matrix effects [59].
Stable Isotope-Labeled Internal Standards (SIL-IS)
Stable isotope-labeled internal standards (SIL-IS) are considered the "gold standard" for compensating matrix effects in LC-MS [58]. These compounds are identical to the target analyte but contain one or several atoms replaced by stable isotopes (e.g., ( ^2\text{H} ), ( ^{13}\text{C} ), ( ^{15}\text{N} ), or ( ^{17}\text{O} )) [59]. The nearly identical chemical and physical properties ensure consistent extraction recovery during sample preparation and identical ionization suppression or enhancement from co-eluting matrix components [59].
Critical considerations for SIL-IS implementation include:
- Mass Difference: To minimize mass spectrometric cross-talk, the SIL-IS should ideally have a mass difference of 4–5 Da from the analyte [59].
- Deuterium Effects: ( ^2\text{H} )-labeled internal standards may undergo deuterium-hydrogen exchange, and increased deuteration can cause slight retention time shifts, leading to differential matrix effects [59]. ( ^{13}\text{C} ), ( ^{15}\text{N} ), or ( ^{17}\text{O} )-labeled IS are preferred when available [59].
- Purity Verification: Internal standard purity must be verified to avoid interference with the analyte [59].
Structural Analogue Internal Standards
When SIL-IS are unavailable or cost-prohibitive, structural analogue internal standards can serve as alternatives [26] [59]. These compounds exhibit chemical and physical similarities to the target analyte, particularly in hydrophobicity (logD) and ionization properties (pKa) [59]. Compounds with the same critical functional groups (e.g., -COOH, -SO2, -NH2, halogens, or heteroatoms) are ideal, as they minimize differences in extraction recovery and ionization efficiency [59].
While structural analogues help mitigate experimental variability during sample preparation and analysis, they cannot correct for matrix effects as effectively as SIL-IS because they may not co-elute exactly with the analyte and thus may experience different ionization conditions [26].
Table 2: Comparison of Internal Standard Types for Matrix Effect Correction
| Parameter | Stable Isotope-Labeled IS (SIL-IS) | Structural Analogue IS |
|---|---|---|
| Co-elution with Analyte | Nearly perfect due to identical chemical structure | May vary due to structural differences |
| Correction for Matrix Effects | Excellent, experiences identical ionization suppression/enhancement | Limited, may experience different ionization conditions |
| Extraction Recovery Tracking | Excellent due to identical physicochemical properties | Good, if hydrophobicity and functional groups are similar |
| Cost and Availability | Expensive; not always commercially available | More affordable; wider availability |
| Risk of Cross-Talk | Low with sufficient mass difference (≥4-5 Da) | Not applicable |
| Retention Time Shifts | Possible with deuterated IS due to deuterium isotope effects | More likely due to structural differences |
Experimental Protocols for ISTD Implementation and Validation
Internal Standard Addition Protocol
The timing of internal standard addition significantly impacts its effectiveness. Internal standards can be added at three stages [59]:
Pre-Extraction: For liquid-liquid extraction (LLE) or solid-phase extraction (SPE), internal standard is typically added before introducing buffers or organic solvents. This allows the IS to track analyte behavior throughout the entire sample preparation process [59].
Post-Extraction (Pre-chromatographic separation): In assays requiring simultaneous detection of free and encapsulated forms (e.g., liposomes), early IS addition may induce conversion between forms. Thus, internal standard is added post-SPE [59].
Post-Chromatographic Separation: For multi-component analyses involving complex preparation steps, the internal standard may be introduced via post-column infusion to ensure uniform detection conditions [59].
For simple sample preparation processes (e.g., protein precipitation), internal standard addition is flexible (e.g., added with the precipitant). For complex sample preparation processes (e.g., antibody-drug conjugate quantification via surrogate peptides), the internal standard should be added early to track analyte behavior throughout the process [59].
Internal Standard Concentration Optimization
The appropriate concentration of the internal standard is crucial for analytical accuracy. Several factors must be considered when determining IS concentration [59]:
Cross-Interference: According to ICH M10 guidelines, acceptable thresholds include equal to or less than 20% of the lower limit of quantification (LLOQ) for IS-to-analyte contributions, and equal to or less than 5% of the IS response for analyte-to-IS contributions [59].
Mass Spectrometric Sensitivity: When internal standard sensitivity is relatively high, its concentration can be lowered. Otherwise, high IS concentration should be used to achieve adequate signal-to-noise ratio (S/N) [59].
Matrix Effects: For methods with significant matrix effects, the internal standard concentration is typically matched in the range of 1/3 to 1/2 of the upper limit of quantification (ULOQ) concentration, as this range is expected to encompass the average peak concentration (Cmax) of most drugs and metabolites [59].
Solubility and SPE Plate Capacity: The concentration should not be excessively high to avoid solubility issues or exceeding the capacity of the SPE plate [59].
Internal Standard Normalized Matrix Effect Assessment
A standardized approach for evaluating the internal standard's effectiveness in correcting matrix effects involves calculating the "internal standard normalized matrix effect" [58]. This method assesses the inter-lot variability of the matrix effect and the correcting power of the chosen internal standard [58].
Protocol for IS-normalized Matrix Effect Assessment:
- Prepare post-extraction spiked samples in at least six different lots of the blank matrix.
- Compare the analyte peak areas in the presence of matrix to those in neat solution.
- Calculate the matrix effect (ME) as: ME = (Peak area in matrix / Peak area in neat solution) × 100.
- Calculate the IS-normalized matrix factor as: MF = (Matrix factor of analyte / Matrix factor of IS).
- The coefficient of variation (CV) of the IS-normalized matrix factor should be ≤15% to demonstrate consistent correction across different matrix lots [58].
Diagram 2: Internal Standard Implementation Workflow. This diagram outlines the key decision points and optimization factors in developing an effective internal standard strategy for matrix effect correction.
Alternative Approaches and Emerging Solutions
Standard Addition Method
The standard addition method serves as a viable alternative when stable isotope-labeled internal standards are unavailable or cost-prohibitive [57]. This technique involves spiking the sample with known amounts of the target analyte and constructing a calibration curve for each individual sample [57].
Standard Addition with Internal Standardization Protocol:
- Split the sample into multiple aliquots.
- Spike increasing known concentrations of the analyte to each aliquot (except one).
- Add a constant amount of internal standard to all aliquots.
- Analyze all aliquots and plot the analyte-to-IS response ratio against the added analyte concentration.
- The absolute value of the x-intercept represents the original analyte concentration in the sample [57].
This hybrid approach combines the benefits of standard addition (matrix-matched calibration for each sample) with internal standardization (correction for procedural errors) [57]. The method is particularly valuable for endogenous compound assays where blank matrix is unavailable [26] [57].
Recent research explores alternative ionization sources that may be less susceptible to matrix effects. Dielectric barrier discharge ionization techniques, such as flexible microtube plasma (FμTP), show promise in reducing matrix effects compared to conventional ESI [27]. One study found that between 76% and 86% of pesticides showed negligible matrix effects with FμTP, compared to 35-67% with ESI across different matrices [27].
Computational Approaches for Quantification Without Standards
Emerging computational methods aim to predict ionization efficiency for semi-quantification in non-targeted analysis. Random forest regression models have been developed to predict compound response in ESI/HRMS, with reported mean errors of 2.0-2.2 times for positive and negative modes, respectively [60]. While not yet replacement for internal standard correction, these approaches show potential for expanding quantitative capabilities in non-targeted screening [60].
The Scientist's Toolkit: Essential Research Reagent Solutions
Table 3: Key Research Reagents for Internal Standard Applications
| Reagent Category | Specific Examples | Function in ISTD Applications |
|---|---|---|
| Stable Isotope-Labeled Standards | Creatinine-d3; 13C, 15N-labeled analogs | Gold standard for matrix effect correction; co-elute with analyte and experience identical ionization effects [26] [59] |
| Structural Analogues | Cimetidine (for creatinine assays) | Alternative when SIL-IS unavailable; similar chemical properties help track extraction efficiency [26] [59] |
| Anchor Compounds for Ionization Efficiency Scales | Tetraethylammonium (ESI+); Benzoic acid (ESI-) | Reference points for establishing relative ionization efficiency scales in predictive models [60] |
| Mobile Phase Additives | Formic acid; Ammonium formate; Acetic acid | Modify ionization efficiency and chromatographic separation; can influence matrix effect magnitude [26] [61] |
| Sample Preparation Sorbents | Primary-secondary amine (PSA); Enhanced Matrix Removal-Lipid (EMR) | Remove specific matrix interferents during sample cleanup to reduce overall matrix effects [27] |
Internal standards play an indispensable role in managing matrix effects and ensuring data quality in quantitative LC-MS analysis. Stable isotope-labeled internal standards remain the gold standard due to their nearly identical behavior to target analytes throughout the entire analytical process. The systematic approach to IS selection, optimization, and validation outlined in this article provides a framework for developing robust quantitative methods. As LC-MS applications continue to expand into new areas of research and clinical application, the fundamental principles of internal standardization remain essential for generating reliable quantitative data, particularly within the broader context of understanding and controlling factors that influence ionization efficiency.
Systematic Method Development Workflow for Robust Bioanalytical Methods
Developing a robust bioanalytical method using Liquid Chromatography-Tandem Mass Spectrometry (LC-MS/MS) requires a systematic approach to overcome challenges such as ion suppression and matrix effects, which directly impact ionization efficiency and method reliability. This guide outlines a comprehensive workflow to enhance analytical robustness, focusing on parameters that influence ionization within complex biological matrices.
Ionization efficiency is the cornerstone of LC-MS/MS sensitivity and reliability. In bioanalysis, the complex nature of biological matrices introduces components that can co-elute with target analytes and suppress or enhance their ionization in the mass spectrometer source. This phenomenon, known as the matrix effect, is a pivotal factor in liquid chromatography-electrospray ionization-tandem mass spectrometry (LC-ESI-MS/MS) performance, impacting assay accuracy, precision, and sensitivity [15]. A systematic development workflow is therefore essential not just for method creation, but for understanding and controlling the fundamental physicochemical interactions that govern ionization yield. This ensures the generation of reliable, high-quality data capable of supporting critical decisions in drug development and clinical research [62].
Foundational Concepts: Matrix Effects and Ion Suppression
A thorough understanding of matrix effects is a prerequisite for effective method development.
- Definition and Impact: Matrix effect is defined as an alteration in the ionization efficiency of a target analyte due to co-eluted compounds from the matrix. This can result in either a loss (ion suppression) or a gain (ion enhancement) in signal response [15]. It is one of the most pervasive obstacles in LC-MS/MS, leading to decreased signal intensity and compromised quantification accuracy [62].
- Sources of Interference: These effects are primarily influenced by ionization mechanisms, the physicochemical properties of the analyte, the composition of the biofluid, sample pretreatment procedures, and chromatographic conditions [15]. Inadequate sample cleanup is a major contributor [62].
- Systematic Assessment: Evaluating matrix effect, along with recovery and process efficiency, is essential during method validation. Regulatory guidelines like those from the EMA and ICH M10 recommend using 6 different matrix lots at 2 concentration levels to assess the variability and magnitude of these effects [15].
Systematic Method Development Workflow
The following workflow provides a structured, phased approach to developing a robust LC-MS/MS bioanalytical method. The diagram below illustrates the integrated process and key decision points.
Systematic LC-MS/MS Method Development Workflow
Phase 1: Sample Preparation for Matrix Cleanup
The primary goal of sample preparation is to remove interfering matrix components while efficiently recovering the analyte.
- Solid-Phase Extraction (SPE): This technique uses a cartridge (e.g., with a C-18 stationary phase) to separate compounds from a solution. It is highly effective for removing endogenous interferences and can be optimized for specific analyte properties using different sorbent chemistries [62] [54].
- Liquid-Liquid Extraction (LLE): This method partitions the analyte of interest into an organic solvent. For example, testosterone can be extracted using methyl-tert-butyl-ether. It is particularly useful for separating analytes from proteins and phospholipids [54].
- Protein Precipitation (PPE): A simple and fast technique that uses organic solvents like acetone or methanol to cause protein aggregation and precipitation. While effective for protein removal, it may not efficiently remove phospholipids, which are a common cause of ion suppression [54].
Phase 2: Chromatographic Optimization
Chromatography separates the analyte from residual matrix components that escaped sample cleanup, which is critical for mitigating ion suppression.
- Column Selection: The choice of column is critical. Core-shell particles offer fast and efficient separations, while traditional fully porous silica provides extensive surface area. The column chemistry (e.g., C18) should be tailored to the analyte's properties [54].
- Mobile Phase Optimization: Using volatile buffers such as ammonium acetate or ammonium formate enhances spray stability and ionization efficiency in both positive and negative ionization modes [62]. The pH of the mobile phase can also be adjusted to influence analyte retention and separation.
- Gradient Elution: A well-optimized gradient method is essential for resolving analytes from matrix interferences. For complex mixtures like oxylipins, sophisticated gradients lasting over 20 minutes may be necessary to achieve sufficient separation of isomers and other compounds [61].
Phase 3: Mass Spectrometric Optimization
This phase focuses on maximizing the signal-to-noise ratio for the target analyte.
- Ion Source Optimization: A systematic Design of Experiments (DoE) approach is superior to the traditional one-factor-at-a-time method. As demonstrated for oxylipins, DoE can model the interaction of factors like interface temperature and collision gas pressure, leading to a 2-4 fold improvement in signal-to-noise ratios for various analyte classes [61].
- MRM Transition Selection: The mass spectrometer is configured to monitor specific precursor-to-product ion transitions for each analyte. Selecting the most abundant and unique transitions is key to achieving high specificity and a strong signal [62] [63].
- Collision Energy Tuning: The collision energy applied in the collision cell must be optimized for each MRM transition to generate an optimal yield of the product ion, thus maximizing sensitivity [63].
The following diagram details the key parameters and their interactions during the mass spectrometric optimization phase.
Mass Spectrometric Optimization via DoE
Phase 4: Method Validation and Robustness Testing
The final phase involves rigorous testing to ensure the method performs reliably under normal operating conditions.
- Matrix Effect Assessment: This is quantitatively evaluated by comparing the analyte response in a post-extraction spiked matrix to the response in a neat solution. As per guidelines, this should be tested using at least 6 independent matrix lots to account for biological variability. The acceptance criteria is typically a coefficient of variation (CV) of <15% for the IS-normalized matrix factor [15].
- Recovery and Process Efficiency: Recovery (the extraction efficiency) and process efficiency (the combined effect of recovery and matrix effect) are assessed using pre- and post-extraction spiked samples. These parameters are crucial for understanding the overall efficiency of the method [15].
- Accuracy and Precision: The method's accuracy (relative error) and precision (CV) are determined at multiple quality control levels. For a validated method, these should typically be within ±15% of the nominal concentration [63].
Experimental Protocols for Key Experiments
Protocol for Systematic Matrix Effect Assessment
This integrated protocol, based on the approach of Matuszewski et al., allows for the simultaneous assessment of matrix effect, recovery, and process efficiency in a single experiment [15].
- Sample Sets Preparation: Prepare three sets of samples using multiple lots of matrix (e.g., 6 lots of human plasma or CSF).
- Set 1 (Neat Solution): Spike analyte and internal standard (IS) into a neat mobile phase solution. This represents the 100% response baseline.
- Set 2 (Post-Extraction Spiked): Spike analyte and IS into a blank matrix extract after the extraction process. This set is used to calculate the matrix effect (ME).
- Set 3 (Pre-Extraction Spiked): Spike analyte and IS into the blank matrix before the extraction process. This set represents the real sample and is used to calculate recovery (RE) and process efficiency (PE).
- LC-MS/MS Analysis: Analyze all sample sets in replicate.
- Data Calculation:
- Matrix Effect (ME): = (Mean Peak Area of Set 2 / Mean Peak Area of Set 1) × 100.
- Recovery (RE): = (Mean Peak Area of Set 3 / Mean Peak Area of Set 2) × 100.
- Process Efficiency (PE): = (Mean Peak Area of Set 3 / Mean Peak Area of Set 1) × 100 = (ME × RE) / 100.
- IS-Normalized Values: Also calculate the matrix factor (MF) by normalizing the analyte response with the IS response in each set, which helps evaluate the effectiveness of the IS in compensating for variability.
Protocol for DoE-Based Ion Source Optimization
This protocol uses a statistical approach to efficiently find the optimal instrument settings [61].
- Screening Design: Begin with a Fractional Factorial Design (FFD) to identify the most influential factors. Test parameters like interface temperature, desolvation gas flow, CID gas pressure, and ion spray voltage at two levels ('low' and 'high').
- Response Measurement: For each experimental run in the design, inject a standard solution and record the signal intensity (peak area or height) for the target analytes.
- Statistical Analysis: Analyze the results to identify which factors have a statistically significant effect on the signal intensity.
- Optimization Design: For the significant factors, conduct a more detailed Central Composite Design (CCD) to explore a wider range of levels.
- Response Surface Modeling (RSM): Use the data from the CCD to build a mathematical model that describes the relationship between the factors and the response. The model can then predict the optimal instrument settings for maximum signal-to-noise ratio.
Quantitative Data and Guideline Comparison
A summary of key quantitative data from the search results and a comparison of international guidelines for matrix effect assessment are provided below.
Table 1: Reported Sensitivity and Signal Improvements from Optimized LC-MS/MS Methods
| Analyte Class | Matrix | Sample Preparation | Key Optimization | Improvement | LLOQ | Reference |
|---|---|---|---|---|---|---|
| Compound K | Human Plasma | Liquid-Liquid Extraction | ESI in positive mode, MRM transition m/z 621.4→161.0 | N/A | 1 ng/mL | [63] |
| Oxylipins (e.g., Lipoxins, Resolvins) | Standard Solutions | Not Specified | DoE for ion source and fragmentation | 2-4 fold increase in S/N | <1 pg on-column | [61] |
| Glucosylceramides | Human CSF | Protein Precipitation? | Systematic assessment of ME, RE, PE | Comprehensive validation per CLSI C62 & ICH M10 | 50 nM (Medium QC) | [15] |
| PAHs & Pesticides | Standard Solutions | Flow Injection Analysis | Liquid Electron Ionization (LEI) interface | 5x lower LOD with new VMC setup | Improved detectability | [36] |
Table 2: Comparison of International Guidelines for Matrix Effect Assessment
| Guideline | Matrix Lots | Concentration Levels | Key Recommendations | Acceptance Criteria |
|---|---|---|---|---|
| EMA (2011) | 6 | 2 | Evaluate absolute and relative matrix effects via post-extraction spiking. IS-normalized MF should be evaluated. | CV < 15% for Matrix Factor |
| ICH M10 (2022) | 6 | 2 | Evaluate matrix effect via precision and accuracy. Should also be tested in hemolyzed/lipaemic matrices. | Accuracy within ±15%; Precision < 15% |
| CLSI C62A (2022) | 5 | 7 | Evaluate absolute matrix effect (%ME). Refers to Matuszewski et al. as best practice. | CV < 15% for peak areas |
The Scientist's Toolkit: Essential Research Reagents and Materials
Table 3: Key Reagents and Materials for LC-MS/MS Bioanalysis
| Item | Function | Example Application |
|---|---|---|
| Ammonium Acetate/Formate | Volatile buffer salts for mobile phase | Enhances spray stability and ionization efficiency; used in compound K analysis [63]. |
| LC-MS Grade Solvents | High-purity water, methanol, acetonitrile | Minimizes background noise and contaminant introduction [54]. |
| Solid-Phase Extraction Cartridges | Selective cleanup of complex samples | Removes phospholipids and endogenous interferences to mitigate ion suppression [62] [54]. |
| Stable Isotope-Labeled Internal Standard | Normalizes for variability in extraction and ionization | Corrects for matrix effects and recovery losses; crucial for accurate quantification [15]. |
| C18 Chromatography Columns | Reversed-phase separation of analytes | Industry standard for separating small molecules; core-shell particles for high efficiency [64] [54]. |
| Design of Experiments Software | Statistical optimization of MS parameters | Systematically identifies optimal ion source conditions, improving S/N ratios [61]. |
Developing a robust LC-MS/MS bioanalytical method is a multidimensional process that demands a systematic and scientific strategy. The workflow presented—progressing through sample preparation, chromatographic separation, mass spectrometric optimization, and rigorous validation—provides a reliable framework for success. The consistent thread running through this process is the focus on understanding and controlling ionization efficiency. By systematically addressing matrix effects and leveraging modern optimization techniques like DoE, scientists can develop methods that are not only sensitive and specific but also robust and reproducible, thereby generating data that meets the stringent requirements of modern drug development and clinical research.
Troubleshooting and Optimization: Enhancing Sensitivity and Robustness in Bioanalysis
Ion suppression is a matrix effect in Liquid Chromatography-Mass Spectrometry (LC-MS) where co-eluting compounds reduce the ionization efficiency of target analytes, leading to diminished detector response and compromised data quality [65] [24]. This phenomenon represents a critical challenge in analytical chemistry, particularly for bioanalysis, where complex samples like plasma, urine, or tissue extracts contain numerous endogenous compounds that can interfere with analyte detection [66] [25].
The fundamental mechanism involves competition between the analyte and interfering substances during the ionization process [65]. In electrospray ionization (ESI), which is particularly susceptible, this competition can occur for charge on the droplet surface or space within the evaporating droplet [24]. The consequences of ion suppression extend to reduced detection capability, higher limits of detection, impaired precision and accuracy, and potentially false negative or positive results in severe cases [25]. Understanding, diagnosing, and mitigating ion suppression is therefore essential for developing robust LC-MS methods that yield reliable quantitative results, especially in regulated environments like clinical diagnostics and pharmaceutical development [67].
Mechanisms and Causes of Ion Suppression
The physical origins of ion suppression differ between the two primary atmospheric pressure ionization techniques: Electrospray Ionization (ESI) and Atmospheric Pressure Chemical Ionization (APCI) [24].
Ion Suppression in Electrospray Ionization (ESI)
ESI is highly susceptible to ion suppression through multiple proposed mechanisms [65] [24]:
- Competition for Charge: ESI operates on a charge-limited system where analytes compete for limited excess charge available on ESI droplets. High concentrations of interfering compounds can outcompete target analytes for this charge [24].
- Surface Activity Competition: Compounds with high surface activity preferentially occupy droplet surfaces, preventing less surface-active analytes from undergoing ion evaporation [65].
- Altered Droplet Properties: High concentrations of matrix components increase droplet viscosity and surface tension, reducing solvent evaporation rates and preventing droplets from reaching the critical radius required for ion emission [24].
- Non-Volatile Material Interference: Non-volatile compounds can cause co-precipitation of analyte or form crystalline structures that prevent efficient ion release [65].
Ion Suppression in Atmospheric Pressure Chemical Ionization (APCI)
APCI is generally less prone to pronounced ion suppression than ESI because ionization occurs in the gas phase after nebulization and evaporation of the LC effluent [65] [24]. The primary mechanisms in APCI include:
- Competition for Charge Transfer: Co-eluting compounds may compete for available charge from the corona discharge needle [24].
- Solid Formation: Non-volatile materials can form solids that incorporate analytes, preventing their vaporization and subsequent ionization [24].
- Change in Colligative Properties: Matrix components alter the evaporative properties of solute droplets, affecting the efficiency of analyte transfer to the gas phase [65].
Interfering compounds that cause ion suppression can originate from various sources [65] [25] [68]:
- Endogenous Materials: Phospholipids, salts, carbohydrates, amines, urea, lipids, peptides, and organic acids from biological samples.
- Exogenous Materials: Plasticizers leached from laboratory tubes and containers, ion-pairing agents, alkaline buffers, and impurities in solvents or reagents.
- Sample Preparation Artifacts: Polymers, additives, and contaminants introduced during sample processing.
Table 1: Common Sources of Ion Suppression and Their Characteristics
| Source Type | Example Compounds | Primary Mechanism | Most Affected Ionization |
|---|---|---|---|
| Endogenous | Phospholipids, salts, urea | Surface activity, charge competition | ESI |
| Exogenous | Plasticizers, ion-pairing agents | Gas-phase proton transfer, droplet formation | ESI and APCI |
| Sample Prep | Polymers, additives, buffers | Altered evaporation, chemical interference | ESI |
| Mobile Phase | Non-volatile buffers, additives | Ion-pairing, reduced evaporation | ESI |
Experimental Protocols for Diagnosing Ion Suppression
Rigorous assessment of ion suppression should be incorporated into every LC-MS method validation. The U.S. Food and Drug Administration's Guidance for Industry on Bioanalytical Method Validation requires matrix effect assessment to ensure that precision, selectivity, and sensitivity will not be compromised [24] [25]. Two principal experimental approaches are recommended for comprehensive evaluation.
Post-Column Infusion Method
This method provides a chromatographic profile of ion suppression throughout the separation, identifying specific retention times where suppression occurs [65] [24].
Materials and Equipment:
- LC-MS/MS system with appropriate ionization source
- Syringe pump capable of constant flow delivery
- Tee union for connecting infusion stream to column effluent
- Standard solution of analyte at appropriate concentration
- Blank matrix sample (e.g., drug-free plasma, urine)
Step-by-Step Protocol:
- System Setup: Connect the syringe pump containing the analyte solution to a tee union placed between the HPLC column outlet and the MS ion source.
- Infusion Parameters: Infuse the analyte solution at a constant rate (typically 5-20 μL/min) and concentration to establish a stable baseline signal in the mass spectrometer.
- Chromatographic Separation: Inject a blank matrix sample (prepared using the same extraction procedure as actual samples) onto the LC system using the intended chromatographic method.
- Signal Monitoring: Monitor the detector response throughout the chromatographic run. The signal should remain constant unless suppressing compounds elute from the column.
- Data Interpretation: Note regions where the signal drops significantly (negative peaks), indicating the retention times of ion-suppressing compounds.
- Extended Monitoring: Continue monitoring for several column volumes to detect strongly retained suppressing compounds that may affect subsequent injections.
Data Interpretation: A stable signal indicates no significant suppression, while signal decreases indicate the elution of ion-suppressing compounds. The magnitude of signal reduction correlates with the degree of suppression. This method is particularly valuable for identifying whether suppressing compounds co-elute with the target analyte, which would most severely impact quantification [65] [24].
Post-Extraction Spiking Method
This quantitative approach compares analyte response in different matrices to determine the absolute magnitude of ion suppression and recovery efficiency [65] [25].
Materials and Equipment:
- LC-MS/MS system
- Appropriate solvents for standard preparation
- Blank matrix samples
- Standard solution of analyte at known concentration
Step-by-Step Protocol:
- Neat Solvent Standard (A): Prepare the analyte at a specific concentration in pure mobile phase or a volatile solvent. This represents the maximum possible response (zero suppression).
- Post-Extraction Spiked Sample (B): Take a blank matrix extract (after sample preparation), spike with the same concentration of analyte as in A, and analyze.
- Pre-Extraction Spiked Sample (C): Spike the blank matrix with the analyte before sample preparation, then carry through the entire extraction and analysis procedure.
Calculations:
- Absolute Matrix Effect (Ion Suppression): (Response B / Response A) × 100%
- Extraction Recovery: (Response C / Response B) × 100%
- Process Efficiency: (Response C / Response A) × 100%
A value of 100% for Absolute Matrix Effect indicates no suppression, while values below 85-90% typically signify clinically relevant ion suppression that requires mitigation [25].
Table 2: Comparison of Ion Suppression Assessment Methods
| Parameter | Post-Column Infusion | Post-Extraction Spiking |
|---|---|---|
| Primary Information | Retention time of suppressing compounds | Magnitude of suppression |
| Identification of Co-elution | Excellent | Limited |
| Quantification of Effect | Semi-quantitative | Highly quantitative |
| Ease of Implementation | Moderate (requires infusion setup) | Simple |
| Method Development Stage | Early development | Final validation |
| Sample Consumption | Low | Moderate |
Visualization of Ion Suppression Assessment Workflow
The following diagram illustrates the logical process for diagnosing and addressing ion suppression during method development:
Ion Suppression Diagnosis and Mitigation Workflow
Strategies for Mitigating Ion Suppression
Once ion suppression is identified, multiple strategic approaches can minimize its impact on analytical results. The most effective solutions often combine several techniques.
Chromatographic Solutions
Modifying the chromatographic separation to physically separate analytes from suppressing compounds is often the most effective approach [65] [25].
- Increased Retention Time Resolution: Extend run times, use slower gradient slopes, or employ different gradient profiles to move analyte peaks away from regions of high suppression identified by post-column infusion.
- Alternative Stationary Phases: Switch from C18 to specialized columns (e.g., phenyl-hexyl, pentafluorophenyl, HILIC) that provide different selectivity, potentially resolving analytes from phospholipids or other interfering compounds.
- Column Chemistry Optimization: Use longer columns (150-250 mm vs. 50-100 mm) or smaller particle sizes (sub-2μm) to increase theoretical plates and improve separation efficiency.
- Mobile Phase Modifications: Adjust pH, use alternative buffers (ammonium formate/acetate instead of phosphate), or add modifiers to alter selectivity.
Sample Preparation Techniques
Comprehensive sample clean-up effectively removes ion-suppressing compounds before chromatographic separation [65] [25] [38].
- Solid-Phase Extraction (SPE): Select sorbents that retain either the analyte (and later elute it) or retain interfering compounds while allowing the analyte to pass through. Mixed-mode SPE (combining reversed-phase and ion-exchange) is particularly effective for removing phospholipids and salts from biological samples.
- Liquid-Liquid Extraction (LLE): Effective for removing highly polar interfering compounds when analytes are extractable into organic solvents.
- Protein Precipitation Limitations: While simple, protein precipitation often fails to remove phospholipids and other endogenous compounds that cause significant ion suppression. It should be combined with additional clean-up if suppression is observed.
- Dilution and Filtering: Sample dilution reduces absolute amounts of interfering compounds but also reduces analyte concentration. Centrifugal ultrafiltration can remove macromolecules that contribute to suppression.
MS Instrumentation and Parameter Adjustments
- Ionization Source Selection: Switching from ESI to APCI or APPI (Atmospheric Pressure Photoionization) can significantly reduce ion suppression because these techniques are less susceptible to matrix effects [24].
- Flow Rate Reduction: Employing microflow (10-100 μL/min) or nanoflow (<10 μL/min) LC-MS instead of conventional flow rates (200-1000 μL/min) improves ionization efficiency and reduces ion suppression by producing smaller droplets [65] [38].
- Source Condition Optimization: Adjusting desolvation temperature, nebulizer gas flow, and cone gas flow to improve desolvation and ion transmission efficiency.
Advanced Chemical Compensation Techniques
When ion suppression cannot be completely eliminated, chemical compensation methods can account for its effects [65] [69].
- Stable Isotope-Labeled Internal Standards (SIL-IS): The gold standard for compensation, SIL-IS experience nearly identical ion suppression as their corresponding analytes and normalize for these effects. They should be added as early as possible in sample preparation [65].
- Matrix-Matched Calibration: Prepare calibration standards in the same matrix as samples to experience similar suppression. This approach assumes consistent matrix composition across all samples, which may not hold true for biological samples from different individuals [65].
- Standard Addition: Spike samples with multiple known concentrations of analyte to create a calibration curve for each individual sample. While accurate, this approach is labor-intensive [65].
- The IROA TruQuant Workflow: A recently developed approach using a stable isotope-labeled internal standard library with companion algorithms to measure and correct for ion suppression in non-targeted metabolomics [69].
Table 3: Mitigation Strategies for Ion Suppression
| Strategy Category | Specific Techniques | Effectiveness | Implementation Complexity |
|---|---|---|---|
| Chromatographic | Modified gradients, alternative columns, pH adjustment | High | Moderate |
| Sample Preparation | SPE, LLE, PPT with clean-up | High | High |
| Instrumental | Flow rate reduction, source switching (ESI to APCI) | Moderate to High | Moderate |
| Chemical Compensation | Stable isotope internal standards, matrix-matched calibration | High (compensation) | Low to Moderate |
The Scientist's Toolkit: Essential Research Reagents and Materials
Successful management of ion suppression requires specific reagents and materials designed to diagnose, prevent, or compensate for matrix effects.
Table 4: Essential Research Reagents and Materials for Ion Suppression Management
| Reagent/Material | Function | Application Notes |
|---|---|---|
| Stable Isotope-Labeled Internal Standards | Compensates for ion suppression and variability in sample preparation | Ideally (^{13}C) or (^{15}N) labeled with ≥3 heavy atoms; should be added before sample preparation [65] |
| Mixed-Mode SPE Cartridges | Removes phospholipids and ionic interferences while retaining analytes | Combine reversed-phase and ion-exchange mechanisms; more effective than single-mode SPE [25] |
| Post-Column Infusion Tee Union | Enables post-column infusion experiments for suppression mapping | Must have minimal dead volume; PEEK material preferred for biocompatibility [24] |
| Syringe Pump | Provides constant infusion of analyte for suppression mapping | Required for post-column infusion method; should provide stable, pulse-free flow [65] |
| Matrix-Free Artificial Plasma | Method development and troubleshooting | Synthetic plasma with controlled composition for standardized testing [25] |
| Phospholipid Removal Plates | Specific removal of primary ion suppressors in biological samples | Specialized sorbents that selectively bind phospholipids while allowing analyte passage [38] |
| LC Columns with Alternative Selectivity | Chromatographic resolution of analytes from interfering compounds | PFP, phenyl-hexyl, HILIC, and charged surface hybrid columns provide different selectivity vs. C18 [25] |
| IROA Reference Standards | Advanced suppression correction in metabolomics | 95% (^{13}C) labeled internal standards for comprehensive suppression correction [69] |
Ion suppression remains a significant challenge in LC-MS analysis, particularly for complex biological matrices. Effective management requires a systematic approach beginning with comprehensive assessment using post-column infusion and post-extraction spiking methods. The most successful mitigation strategies typically combine improved sample preparation to remove interfering compounds, optimized chromatography to separate analytes from residual interferents, and appropriate internal standardization to compensate for any remaining suppression effects.
As LC-MS applications continue to expand into increasingly complex analytical challenges, including metabolomics and therapeutic drug monitoring, understanding and controlling ion suppression becomes ever more critical to generating reliable, reproducible data. By implementing the systematic diagnosis and mitigation strategies outlined in this guide, researchers can develop more robust methods that maintain accuracy and precision even in the most challenging matrices.
In liquid chromatography-mass spectrometry (LC-MS), the ion source serves as the critical interface where sample molecules are transformed into gas-phase ions, enabling their detection and analysis by the mass spectrometer. The efficiency of this ionization process fundamentally determines the sensitivity, reproducibility, and overall success of an analytical method [19]. Within electrospray ionization (ESI), the most prevalent LC-MS ionization technique, three categories of parameters exercise particularly profound influence on ionization efficiency: electrical settings (capillary voltage), pneumatic controls (nebulizing and drying gas flows), and thermal parameters (ion transfer tube and vaporizer temperatures) [70] [71]. This guide provides an in-depth examination of these critical parameters, framed within the broader context of factors affecting ionization efficiency, and presents systematically validated experimental protocols for their optimization to support researchers in drug development and related fields.
Theoretical Foundations of Ion Source Optimization
Electrospray ionization involves a complex sequence of events whereby charged droplets are formed at the capillary tip, undergo solvent evaporation and Coulombic fissions, and ultimately release gas-phase ions into the mass spectrometer. The positioning of the electrospray emitter relative to the MS inlet significantly impacts this process by determining the time available for droplet desolvation and ion formation before sampling [71] [72]. Analytes with differing physicochemical properties respond variably to emitter positioning; smaller polar molecules typically benefit from increased distance from the sampling cone, allowing more complete desolvation, while larger hydrophobic compounds often yield stronger signals with closer positioning [71] [72].
The physical properties of the LC mobile phase, particularly surface tension, directly influence the electrospray process. Solvents with lower surface tension (e.g., methanol, isopropanol, acetonitrile) facilitate stable Taylor cone formation at lower voltages and generally produce smaller initial droplets, enhancing ionization efficiency [71] [72]. The addition of small quantities (1-2% v/v) of low-surface-tension solvents to highly aqueous mobile phases can improve signal stability and intensity [71]. Under gradient elution conditions, the changing solvent composition means ionization efficiency varies throughout the analysis, creating "sweet spots" where signal intensity peaks for individual analytes [71] [72].
Figure 1: The electrospray ionization process and how key parameters influence different stages of ion formation.
Core Ion Source Parameters and Their Effects
Capillary Voltage
The capillary voltage (also referred to as spray voltage) establishes the electric field responsible for charging the eluent at the capillary tip and forming the Taylor cone. This parameter must be optimized for specific analyte classes and mobile phase compositions rather than relying solely on manufacturer defaults [71] [72]. Excessively high voltages can induce electrical discharge (particularly in negative ion mode with aqueous mobile phases) or promote unwanted redox reactions that compromise signal stability [71]. Optimal capillary voltage settings demonstrate significant dependence on mobile phase composition; higher aqueous content typically necessitates increased voltage to maintain stable spray formation [71] [72].
Gas Flow Parameters
Nebulizing gas (sometimes called sheath gas) flows coaxially with the ESI capillary to constrict droplet size and stabilize the electrospray, particularly at higher flow rates [71] [72]. Drying gas (often termed desolvation gas or auxiliary gas) facilitates solvent evaporation from charged droplets, a prerequisite for gas-phase ion release [71] [19]. The optimal configuration of these gas flows represents a balance between sufficient desolvation and avoiding premature droplet dispersal or cooling effects that might reduce ionization efficiency [19].
Temperature Parameters
Temperature settings in the ion source critically influence desolvation efficiency and ion transmission. The ion transfer tube temperature (also called vaporizer temperature or desolvation temperature) must be sufficient to completely desolvate analyte ions without inducing thermal degradation [70] [19]. Different compound classes exhibit varying thermal stability, necessitating compound-specific optimization; for instance, while methamidophos shows improved response with increased desolvation temperature (up to 550°C), emamectin B1a benzoate undergoes complete signal loss when temperatures exceed 500°C due to thermal decomposition [19].
Table 1: Optimal Ranges for Key Ion Source Parameters in ESI-LC-MS
| Parameter | Typical Optimal Range | Primary Function | Optimization Considerations |
|---|---|---|---|
| Capillary Voltage | 2.0-4.0 kV (positive mode)1.5-3.0 kV (negative mode) | Charging eluent and forming Taylor cone | Higher voltages needed for aqueous mobile phases; lower voltages reduce discharge risk [71] [72] |
| Nebulizing Gas Flow | 0.2-1.0 mL/min (micro-ESI)Up to 1.0 mL/min (pneumatically assisted) | Constricting initial droplet size | Optimized against specific eluent flow rate; critical for signal stability [71] [72] |
| Drying/Desolvation Gas Flow | 10-60 L/hr (instrument dependent) | Evaporating solvent from charged droplets | Increased flow needed for higher LC flow rates and aqueous mobile phases [70] [19] |
| Ion Transfer Tube Temperature | 150-550°C | Complete desolvation of ions | Balance between desolvation efficiency and thermal degradation of analytes [70] [19] |
Experimental Optimization Strategies
Systematic Parameter Optimization Using DoE
For comprehensive method development, experimental design (DoE) approaches provide a rational strategy for optimizing multiple ion source parameters simultaneously while evaluating potential interaction effects [73]. One validated methodology employs central composite designs comprising numerous experiments (e.g., 131 runs, each repeated three times for repeatability assessment) to systematically evaluate parameters including nebulizing gas, drying gas, and sweep gas flow rates alongside capillary voltage and temperature [73]. Response models (e.g., quadratic models for each analyte) built from this data enable simultaneous maximization of multiple responses, establishing robust optimal conditions validated with complex real-world samples [73].
Practical Single-Parameter Optimization
When full DoE approaches are impractical, systematic single-parameter optimization provides a viable alternative. This methodology involves repeatedly injecting a standard solution while incrementally adjusting a specific source parameter with each injection, monitoring the resulting impact on signal intensity [19]. For gradient elution methods, optimization should ideally employ the mobile phase composition at which each analyte elutes, achievable either by estimating the organic modifier concentration at retention time or through infusion of analyte dissolved in the appropriate eluent composition via a tee-piece [74] [19]. This approach typically delivers sensitivity improvements of two- to three-fold when properly executed [19].
Ionization Mode and Mobile Phase Selection
Initial optimization should establish the appropriate ionization mode (positive/negative) and mobile phase composition. A practical protocol recommends preparing 10 mM ammonium formate buffers at both pH 2.8 and 8.2, then infusing standards through a tee-piece at analytical flow rates using 50:50 mixtures of organic modifier with each buffer in both ionization modes [74]. This systematic evaluation identifies optimal pH and polarity conditions before fine-tuning instrument-specific parameters. Mobile phase selection should prioritize volatile additives (ammonium formate, ammonium acetate) compatible with ESI processes and avoid non-volatile salts and phosphates that cause ion suppression and source contamination [74] [38].
Table 2: Essential Research Reagent Solutions for Ion Source Optimization
| Reagent/Solution | Function in Optimization | Application Notes |
|---|---|---|
| Ammonium Formate Buffer (10 mM, pH 2.8 & 8.2) | Screening optimal ionization mode and pH | Enables systematic evaluation of analyte response across pH range in both positive and negative modes [74] |
| Volatile Acid Modifiers (Formic/Acetic Acid, 0.1%) | Enhancing protonation in positive ion mode | Promotes [M+H]+ formation for basic analytes; compatible with ESI process [70] [38] |
| Reference Standard Mixtures | Parameter optimization and system suitability | Should represent analyte classes of interest; used for response curve generation [70] [19] |
| Mobile Phase Grade Solvents (LC-MS Grade) | Minimizing chemical noise and contamination | Reduces sodium/lithium adduct formation from impurity metal ions [71] [72] |
Advanced Considerations for Complex Analyses
Matrix Effects and Mitigation Strategies
Ion suppression represents a significant challenge in LC-MS analyses, particularly for complex matrices like biological fluids, where co-eluting compounds can compete for charge during ionization, reducing analyte signal [19] [38]. Effective mitigation strategies include: (1) implementing robust sample preparation techniques (solid-phase extraction, protein precipitation, liquid-liquid extraction) to remove interfering compounds [19] [38]; (2) optimizing chromatographic separation to temporally resolve analytes from matrix components [38]; and (3) maintaining rigorous instrument cleaning protocols to prevent contamination-related suppression [38]. Alternative ionization techniques like atmospheric pressure chemical ionization (APCI) may reduce matrix effects for moderately polar, thermally stable compounds since ionization occurs in the gas phase rather than liquid phase [19].
Flow Rate Considerations
The impact of flow rate on ESI sensitivity involves complex relationships between ionization efficiency and ion transmission. In conventional ESI-MS, reduced flow rates generally produce smaller initial droplets, potentially enhancing ionization efficiency and yielding significantly improved sensitivity for biological molecules [75]. Nano-ESI systems operating at nL/min flow rates can achieve attomole-level detection limits for proteins [75]. However, contrasting observations exist in specialized applications like ESI-ion mobility spectrometry (IMS), where ion transmission remains relatively constant across flow rates, resulting in increased signal with higher flow rates [75]. This highlights the importance of considering the complete ion pathway when optimizing flow conditions for specific instrumental configurations.
Figure 2: A systematic experimental workflow for optimizing ion source parameters, including critical validation checks.
The strategic optimization of ion source parameters—capillary voltage, gas flows, and temperatures—represents a fundamental prerequisite for achieving maximum ionization efficiency in LC-MS analyses. Rather than applying generic instrument settings, researchers should implement systematic optimization protocols tailored to their specific analytes, matrices, and instrumental configurations. The experimental strategies outlined herein, ranging from comprehensive DoE approaches to practical single-parameter optimization, provide actionable methodologies for enhancing sensitivity, reproducibility, and overall analytical performance. As LC-MS applications continue to advance toward increasingly complex samples and lower detection limits, rigorous attention to ion source optimization will remain essential for generating high-quality data in drug development and related research fields.
In liquid chromatography-mass spectrometry (LC-MS) research, ionization efficiency is a pivotal factor dictating the sensitivity, accuracy, and robustness of bioanalytical methods. Ion suppression, a phenomenon where co-eluting matrix components reduce analyte ionization, remains a primary obstacle, particularly in complex biological matrices [38] [24]. Microflow liquid chromatography (Microflow LC) and hybrid surface technologies represent two advanced approaches that directly address this challenge by fundamentally improving sample introduction and ion transmission within the LC-MS workflow.
Microflow LC operates at flow rates typically between 1-50 µL/min, using columns with internal diameters of 1 mm or less [76]. This scale offers a superior compromise between the sensitivity gains of nanoflow and the robustness of analytical flow LC, enhancing ionization efficiency through smaller droplet formation and more efficient desolvation in the electrospray ionization (ESI) source [77]. Concurrently, hybrid surface technologies employ novel materials and surface coatings within the LC flow path to minimize nonspecific analyte adsorption, thereby improving signal stability and intensity, especially for challenging molecules like proteins and peptides [38]. This technical guide explores the implementation of these technologies within a structured framework to maximize ionization efficiency and data quality for researchers and drug development professionals.
Theoretical Foundations: Ionization Efficiency and Matrix Effects
The Ion Suppression Challenge
Ion suppression originates in the LC-MS interface when co-eluting compounds interfere with the ionization of target analytes. The mechanisms differ between ionization techniques:
- In Electrospray Ionization (ESI), competition for limited charge and space on the surface of evaporating droplets is the primary mechanism. Compounds with high surface activity or basicity can dominate this process, suppressing the ionization of other analytes [24]. This effect is particularly pronounced at high concentrations of interfering compounds (>10⁻⁵ M) where ESI response linearity is often lost [24].
- In Atmospheric Pressure Chemical Ionization (APCI), ion suppression typically involves gas-phase ion-molecule reactions where interfering compounds with high proton affinity can deprotonate analyte ions, though APCI generally experiences less suppression than ESI [24].
The consequences of ion suppression include reduced detection capability, compromised quantification accuracy, and both false-negative and false-positive results [24]. Biological matrices contain numerous endogenous compounds that can induce ion suppression, with phospholipids being particularly problematic due to their amphiphilic nature and consistent elution patterns [38].
Microflow LC: A Physicochemical Approach to Enhanced Ionization
The fundamental advantage of microflow LC stems from its improved ionization efficiency. As flow rates decrease, the initial droplet size in ESI reduces, leading to more efficient desolvation and a higher surface-to-volume ratio for charge transfer [77] [76]. This results in several key benefits:
- Enhanced Ionization Efficiency: Reduced competition for charge in smaller droplets translates directly to higher ion yields for target analytes.
- Reduced Matrix Effects: Lower flow rates decrease the introduction of matrix components into the ion source at any given time, minimizing co-elution effects [38].
- Improved Sensitivity: Studies demonstrate 5- to 10-fold lower lower limits of quantification (LLOQ) with microflow compared to analytical flow LC, allowing detection at picogram and femtogram levels [77] [38].
Figure 1: Microflow LC Impact on Ionization. Microflow LC fundamentally improves ionization efficiency through physicochemical processes that reduce droplet size and matrix effects.
Microflow LC Technology: Implementation and Workflow Integration
System Configuration and Method Translation
Implementing microflow LC requires specific instrumentation designed to handle low-flow regimes with high precision. Key components include:
- Microflow Capable Pumps: Specifically designed to deliver accurate and stable flow rates in the 1-50 µL/min range with minimal pulsation.
- Reduced Volume Flow Paths: Minimized connection diameters and reduced void volumes to maintain chromatographic integrity.
- Specialized Ion Sources: ESI sources optimized for low flow rates, featuring smaller nebulizer geometries and optimized positioning [77].
Transitioning from conventional analytical flow (typically 300-500 µL/min) to microflow methods requires more than simple flow rate reduction. Successful method translation involves column dimension scaling while maintaining linear velocity, adjusting gradient times to preserve the number of column volumes, and optimizing source parameters for the new flow regime [76].
Quantitative Performance Advantages
Microflow LC delivers measurable improvements in key analytical performance metrics, as demonstrated in comparative studies:
Table 1: Performance Comparison: Microflow vs. Analytical Flow LC-MS
| Performance Metric | Analytical Flow LC | Microflow LC | Improvement Factor |
|---|---|---|---|
| Flow Rate | 300-500 µL/min | 5-50 µL/min | 10-100x reduction |
| Sample Consumption | High (typically 10-50 µL) | Low (1-5 µL) | 5-10x reduction |
| Sensitivity (LLOQ) | Baseline | 5-10x lower LLOQ | 5-10x improvement |
| Ion Suppression | Significant matrix effects | Greatly reduced | Up to 6x improvement |
| Solvent Consumption | High (mL/min) | Low (µL/min) | 10-50x reduction |
These improvements make microflow LC particularly valuable for applications with limited sample availability, such as pediatric studies, cerebrospinal fluid analysis, or micro-sampling in preclinical trials [77] [76].
Hybrid Surface Technologies: Mitigating Analyte Loss
Technology Principles and Applications
Hybrid surface technologies address another critical challenge in LC-MS: nonspecific adsorption of analytes to surfaces within the chromatographic flow path. This adsorption is particularly problematic for amphiphilic compounds like proteins and peptides, which readily adhere to glass, plastic, and metal surfaces [78]. Hybrid surfaces employ specialized barrier coatings and inert materials that create a more bioinert environment, minimizing analyte interaction with system components [38].
The functional principle involves creating a molecular barrier that presents a non-adsorptive surface while maintaining chemical compatibility with mobile phases and analytes. This technology is especially beneficial for analyzing large biomolecules, such as monoclonal antibodies, antibody-drug conjugates (ADCs), and oligonucleotides, which have strong tendencies for surface interaction [78].
Impact on Data Quality
Implementation of hybrid surface technologies yields significant improvements in analytical data quality:
- Improved Signal Stability: Reduced analyte adsorption leads to more consistent peak areas and heights across sample batches.
- Enhanced Sensitivity: More analyte reaches the detector, lowering detection limits, particularly for low-abundance species.
- Better Recovery and Reproducibility: Minimized surface interaction improves accuracy and precision, especially for quantitative applications [38].
One study demonstrated that implementing a hybrid surface barrier significantly mitigated analyte-metal surface interactions, leading to improved sensitivity and reproducibility in the LC-MS/MS measurement of large biomolecules [38].
Integrated Experimental Protocols
Method Development Workflow for Microflow LC-MS
A systematic approach to microflow LC method development ensures optimal performance while mitigating ionization challenges:
Figure 2: Microflow LC Method Development Workflow. A systematic, phased approach ensures comprehensive method optimization.
Phase 1: Initial System Configuration
- Select appropriate microflow column (0.3-1.0 mm i.d.) based on application requirements.
- Install hybrid surface components in the LC flow path to minimize analyte adsorption.
- Configure microflow-capable LC system with minimal connection volumes.
Phase 2: Chromatographic Optimization
- Screen multiple column chemistries (C18, HILIC, phenyl, etc.) with different mobile phase compositions.
- Optimize gradient conditions to maximize separation while minimizing run time.
- Balance organic modifier percentage and buffer concentration for optimal ionization.
Phase 3: MS Source Tuning
- Systematically optimize desolvation temperature, nebulizer gas, and cone gas flow rates.
- Fine-tune capillary and cone voltages for specific analyte classes.
- Establish stable spray conditions at the specified microflow rate.
Phase 4: Matrix Effect Assessment
- Perform post-column infusion experiments to identify regions of ion suppression.
- Compare analyte response in neat solution versus spiked matrix.
- Validate method robustness across multiple lots of biological matrix.
Reagent and Material Solutions for Enhanced Ionization
Table 2: Essential Research Reagent Solutions for Ionization Efficiency
| Reagent/Material | Function | Application Context |
|---|---|---|
| Microflow LC Columns (0.3-1.0 mm i.d.) | Provides separation at low flow rates with high efficiency | Core separation component for all microflow applications |
| Hybrid Surface Liners/Components | Reduces nonspecific analyte adsorption | Critical for protein, peptide, and oligonucleotide analysis |
| Volatile Buffers (ammonium formate, ammonium acetate) | Maintains pH control without MS signal suppression | Mobile phase additive for both positive and negative ionization modes |
| High-Purity Solvents (LC-MS grade) | Minimizes chemical background noise | Essential for all mobile phases and sample preparation |
| Solid-Phase Extraction (SPE) Cartridges | Removes matrix interferents prior to analysis | Sample clean-up to mitigate ion suppression |
| Stable Isotope-Labeled Internal Standards | Compensates for variability in ionization efficiency | Essential for quantitative bioanalysis |
Application Case Studies in Pharmaceutical Research
Sensitive Bioanalysis of Oligonucleotide Therapeutics
The quantitative bioanalysis of antisense oligonucleotides presents significant challenges due to their polyanionic nature, propensity for nonspecific adsorption, and susceptibility to matrix effects. Implementing a microflow LC-MS/MS system with hybrid surface technologies has demonstrated remarkable improvements for these analytes. One study reported a sixfold sensitivity improvement through optimized flow rates and sample clean-up, significantly minimizing matrix interferences [38]. The hybrid surface barrier effectively mitigated analyte-metal surface interactions that typically plague oligonucleotide analysis, enabling robust quantification at clinically relevant concentrations.
Comprehensive Metabolomic Profiling
In global untargeted metabolomics, comprehensive coverage of polar and nonpolar metabolites is essential but challenging. A systematic comparison of analytical flow ion-pairing methods versus ion-pair-free microflow LC methods revealed significant advantages for the microflow approach [76]. The study documented average peak volume improvements of 7-fold and 22-fold in positive and negative ionization modes, respectively, alongside a 10-fold increase in the lower limit of detection for negative mode. When applied to wild-type mouse plasma, the microflow method demonstrated up to a 9-fold increase in peak volume, highlighting its value for metabolic phenotyping studies with limited sample volumes.
Industrialized Proteomics and Biopharmaceutical Characterization
Microflow LC has transformed large-scale proteomics and biopharmaceutical analysis by enabling high-throughput characterization while maintaining robustness. For proteomics applications, microflow LC allows analysis of up to 4x more samples per day while maintaining data quality compared to nanoflow approaches, bridging the sensitivity of nanoflow with the robustness of analytical flow [77]. In biopharmaceutical development, microflow systems enable more assays from the same sample volume or switching to smaller organism models due to reduced sample requirements, accelerating candidate screening and development timelines.
The strategic integration of microflow LC and hybrid surface technologies represents a significant advancement in addressing fundamental ionization challenges in LC-MS. By improving ionization efficiency through physicochemical optimization and mitigating analyte loss via surface engineering, these technologies deliver measurable enhancements in sensitivity, robustness, and data quality. The documented 5- to 10-fold improvements in sensitivity, coupled with substantial reductions in ion suppression, make these approaches particularly valuable for modern drug development challenges, including the analysis of novel modalities like oligonucleotides, peptides, and antibody-drug conjugates.
As pharmaceutical research continues toward more complex therapeutics and precision medicine applications, the demand for robust, sensitive bioanalytical methods will only intensify. Future developments will likely focus on further miniaturization, increased automation, and smarter integration of these technologies with advanced data acquisition strategies. The continuing evolution of microflow LC and hybrid surface technologies promises to expand their role in enabling the sensitive and robust characterization of tomorrow's therapeutics.
In the realm of targeted mass spectrometry, Multiple Reaction Monitoring (MRM) has emerged as a powerful technique for the selective detection and quantification of target analytes within complex biological samples. The exceptional sensitivity of MRM stems from its use of tandem quadrupoles to monitor specified precursor-to-fragment ion transitions, providing unparalleled selectivity. However, this sensitivity is profoundly dependent on the precise optimization of instrument parameters, with collision energy (CE) standing out as arguably the most critical factor for achieving maximum signal transmission [79] [80].
Collision energy governs the efficiency of collision-induced dissociation (CID) in the second quadrupole, determining how effectively precursor ions fragment into the product ions selected for monitoring. Within the broader context of ionization efficiency in LC-MS research, CE optimization represents a downstream yet vital component. While ionization efficiency determines how well an analyte is transferred from the liquid phase to gas-phase ions, CE optimization ensures that these precursor ions are productively fragmented into detectable transitions, thereby completing the analytical workflow from solution to signal [41]. For researchers and drug development professionals, mastering CE optimization is not merely a technical exercise but a fundamental requirement for developing robust, sensitive, and reproducible quantitative methods.
The Science of Fragmentation: Why Collision Energy Matters
Fundamental Principles of Collision-Induced Dissociation
Collision-induced dissociation is a process whereby precursor ions selected in the first quadrupole (Q1) are accelerated into a collision cell (Q2) filled with an inert gas such as argon or nitrogen. The kinetic energy imparted to these ions is converted into internal energy upon collision with the gas molecules, resulting in bond cleavage and fragmentation of the precursor ion into product ions. The collision energy parameter directly controls the amount of kinetic energy possessed by the ions entering the collision cell, thereby governing the extent and pattern of fragmentation [80].
The fundamental relationship between CE and signal intensity follows a bell-shaped response curve for any given transition. At low CE values, insufficient energy is available to efficiently break bonds, resulting in weak fragment ion signals. As CE increases, signal intensity rises to an optimum point where fragmentation is most efficient for the specific transition being monitored. Beyond this optimum, further increases in CE lead to decreased signal due to secondary fragmentation, where the product ions themselves undergo further breakdown into smaller, unmonitored fragments [79] [81].
Differential Optimization Requirements for Fragment Ion Types
A critical advancement in CE optimization has been the recognition that different types of fragment ions require distinct optimal CE values. b-type ions (containing the N-terminus of the peptide) and y-type ions (containing the C-terminus) demonstrate systematically different CE requirements due to their distinct chemical properties and fragmentation pathways [79].
Table 1: Comparative Optimal Collision Energies for Different Ion Types
| Ion Type | Relative CE Requirement | Typical Signal Performance | Key Characteristics |
|---|---|---|---|
| y-ions | Moderate | High, stable | Usually first-choice transitions for MRM |
| b-ions | Lower than y-ions | Lower, but improvable with optimization | Often undergo secondary fragmentation |
| D/E-X transitions | Higher than y-ions | Variable | Fragmentation at amide bonds bounded by aspartic/glutamic acid |
Research has demonstrated that b-ions generally require lower collision energies than y-ions for optimal fragmentation, while small y-type ions derived from fragmentation at amide bonds adjacent to aspartic or glutamic acid residues (D-X or E-X bonds) tend to require higher collision energies [79]. This differentiation challenges the historical "one-size-fits-all" approach to CE optimization and underscores the need for transition-specific parameter tuning.
Establishing the Experimental Framework: Optimization Methodologies
Comprehensive Workflow for Collision Energy Optimization
We present a robust, experimentally-validated workflow for systematic CE optimization that can be implemented on most triple quadrupole mass spectrometers. This methodology enables the rapid determination of optimal CE values for individual MRM transitions while minimizing run-to-run variability [80].
Table 2: Key Components for MRM Collision Energy Optimization
| Component | Specification | Function in Optimization |
|---|---|---|
| Chemical Standard | Pure compound, 50 ppb-2 ppm in appropriate solvent | Provides analyte signal without interference |
| Liquid Chromatography | Suitable column (e.g., C18 for non-polar compounds), methanol/acetonitrile/water mobile phase with volatile additives | Separates analyte from potential interferents |
| Mass Spectrometer | Triple quadrupole system with MRM capability | Fragments precursors and monitors product ions |
| Collision Gas | Argon or nitrogen | Facilitates collision-induced dissociation |
| Software Tools | Instrument-specific optimization modules or third-party solutions (e.g., Mr. M) | Automates parameter screening and data analysis |
Step-by-Step Optimization Protocol
Standard Preparation: Begin with a pure chemical standard of the target analyte, free from other interfering compounds. Dilute to a suitable concentration (typically 50 ppb-2 ppm) using a solvent that matches the initial mobile phase composition of your LC method [81].
Precursor Ion Identification: Directly infuse the standard solution to identify the precursor ion(s) of interest. For small molecules, this is typically the [M+H]+ or [M-H]- species, though adducts such as [M+NH4]+ may also form. For peptides and other biomolecules, multiple charge states (e.g., [M+3H]3+, [M+4H]4+) must be considered [81] [82].
Product Ion Discovery: Using a intermediate, fixed collision energy, conduct product ion scans to identify characteristic fragments. Select at least two abundant and specific product ions for each precursor ion—one for quantification and another for confirmation [81].
Systematic CE Ramping: For each precursor-product ion transition (MRM transition), program a series of experiments testing a range of CE values. A innovative approach to executing this in a single run involves subtly adjusting the precursor and product m/z values at the hundredth decimal place to create distinct MRM targets that can be cycled through rapidly without run-to-run variability [80].
Data Analysis and Optimal CE Selection: Analyze the resulting data to identify the CE value that generates the maximum signal intensity for each transition. Software tools such as Mr. M can facilitate this visualization and calculation [80].
The following workflow diagram illustrates this optimization process:
Advanced Techniques for Complex Matrices
When developing MRM methods for complex sample matrices such as biological fluids or tissue extracts, additional considerations apply. Matrix effects—where co-eluting compounds suppress or enhance ionization—can significantly impact optimal instrument parameters [41] [27]. To address this:
- Compare the optimal CE values determined in pure solvent versus spiked matrix samples
- Use post-column infusion to monitor matrix effects throughout the chromatographic run
- Consider alternative ionization sources such as atmospheric pressure chemical ionization (APCI) or dielectric barrier discharge ionization (DBDI) for compounds prone to severe matrix effects in electrospray ionization (ESI) [27]
Quantitative Data and Analytical Performance
Empirical Optimization Equations for Different Ion Types
Research with 80 doubly charged peptides has yielded empirical equations that predict optimal CE based on precursor m/z and product ion m/z. These equations demonstrate improved performance over single-parameter equations [79]:
Table 3: Empirical Collision Energy Equations for Different Ion Types
| Ion Type | Equation Form | Performance Notes |
|---|---|---|
| General y-ions | CE = f(m/zprecursor, m/zproduct) | Good performance, standard choice |
| b-ions | CE = f(m/zprecursor, m/zproduct) | Lower CE than y-ions; optimization provides several-fold signal increases |
| D/E-X transitions | CE = f(m/zprecursor, m/zproduct) | Higher CE than y-ions; specific to fragmentation at aspartic/glutamic acid bonds |
The specific coefficients for these equations are instrument-dependent and should be determined experimentally for each platform. While these equations provide excellent starting points, transition-specific optimization still yields the best results [79].
Impact of Optimization on Analytical Figures of Merit
Proper CE optimization delivers substantial improvements in key analytical performance metrics:
- Signal Intensity: Optimization commonly provides 2-5 fold signal increases, with b-ions particularly benefiting from proper CE selection [79]
- Limit of Detection: Lower LODs result from improved signal-to-noise ratios at optimal CE
- Reproducibility: Consistent fragmentation patterns at optimal CE improve retention time and peak area precision
- Selectivity: Optimal CE minimizes interfering transitions by promoting specific fragmentation pathways
Special Considerations for Biomolecules
The optimization workflow becomes more complex for biomolecules such as peptides, oligonucleotides, and proteins, which typically form multiple charge states in electrospray ionization [82]. Each charge state ([M+3H]3+, [M+4H]4+, etc.) may demonstrate different fragmentation behavior and require distinct optimal CE values. Furthermore, the dominant charge state can be influenced by mobile phase composition and flow rate, necessitating optimization under chromatographic conditions that mirror the final method [82].
Automated optimization tools, such as the MRM Optimization tool in waters_connect for Quantitation Software, significantly streamline this process by automatically detecting precursor ions across charge states, identifying product ions, and profiling CE for all potential transitions in a single integrated workflow [82].
Integration with Broader Ionization Efficiency Considerations
While this guide focuses on CE optimization, it is essential to recognize that collision energy represents one parameter in a broader optimization landscape that begins with ionization efficiency. The ionization process itself—governed by factors such as ionization source design, mobile phase composition, and source parameters—determines the abundance of precursor ions available for fragmentation [41] [60].
Recent research has explored machine learning approaches to predict ionization efficiency based on molecular structure and eluent composition, with random forest regression achieving prediction of electrospray response with a mean error of 2.0-2.2 times [60]. Such advancements highlight the growing sophistication of our understanding of the entire ionization and fragmentation pipeline.
The relationship between ionization sources and subsequent fragmentation optimization can be visualized as follows:
Alternative ionization sources, including flexible microtube plasma (FμTP), atmospheric pressure chemical ionization (APCI), and dielectric barrier discharge ionization (DBDI), can expand the chemical space amenable to LC-MS analysis and mitigate matrix effects, potentially altering subsequent CE optimization requirements [27].
Collision energy optimization represents a critical step in MRM method development that directly translates to improved analytical sensitivity and reliability. The experimental data and protocols presented in this guide provide a framework for systematic CE optimization that accounts for the differential requirements of various fragment ion types and the complexities of biomolecular analysis.
For the practicing analytical scientist, we recommend:
- Implementing transition-specific CE optimization rather than relying solely on generalized equations
- Accounting for differential requirements of b-ions versus y-ions in peptide analysis
- Utilizing automated optimization tools when working with multiply-charged biomolecules
- Validating optimal CE values in the presence of sample matrix to compensate for potential matrix effects
Through meticulous attention to CE optimization alongside other parameters affecting ionization and fragmentation, researchers can unlock the full potential of MRM technology for sensitive and robust quantification in even the most challenging analytical scenarios.
Proactive Maintenance and Monitoring to Prevent Performance Drift
In Liquid Chromatography-Mass Spectrometry (LC-MS) research, consistent instrument performance is paramount for generating reliable, reproducible data. Performance drift, a gradual deviation from established baseline performance, poses a significant threat to data integrity, particularly impacting the delicate process of ionization efficiency in the mass spectrometer source. Ionization efficiency—the ability to successfully generate gas-phase ions from analyte molecules—is highly sensitive to subtle changes in instrument condition, contamination levels, and component wear. This whitepaper provides an in-depth technical guide for researchers and drug development professionals, outlining a structured framework of proactive maintenance and monitoring protocols designed to preemptively counteract the root causes of performance drift, thereby safeguarding ionization efficiency and ensuring the validity of analytical results.
Understanding Performance Drift and Its Impact on Ionization
The Mechanisms of Drift Affecting Ionization Efficiency
Performance drift in an LC-MS system is characterized by gradual changes in key performance metrics, including reduced signal intensity, increased baseline noise, shifting retention times, and diminished mass accuracy. These observable symptoms are often the direct result of underlying physical changes within the system that directly interfere with the ionization process.
In Electrospray Ionization (ESI), a dominant technique in LC-MS, the process of converting liquid-phase analytes into a fine mist of charged droplets is exceptionally sensitive to its physical and chemical environment [19]. Contamination accumulating on the ion source components, such as the ESI probe, or within the ion transfer tubes, can disrupt the formation of a stable Taylor cone and the subsequent production of a consistent ion plume [38] [83]. This contamination often originates from the sample matrix or mobile phase, leading to ion suppression, where co-eluting compounds compete for charge, thereby reducing the ionization efficiency of the target analyte [38]. Furthermore, wear on mechanical components like pump seals or a degradation in the vacuum system's integrity can cause fluctuations in flow rates, pressure, and the local chemical environment, all of which contribute to variability in the ionization yield and a subsequent loss of sensitivity [83].
Proactive vs. Reactive Maintenance Paradigms
A proactive maintenance strategy is fundamentally different from a reactive approach. It is a systematic, condition-based methodology designed to prevent failures and performance degradation before they occur.
- Reactive Maintenance: Addresses problems only after they have caused a failure or a significant deviation in performance. This "run-to-failure" model leads to unplanned downtime, costly emergency repairs, and compromised data [84].
- Preventive Maintenance: Relies on scheduled servicing at fixed time intervals, regardless of the instrument's actual condition. This can sometimes lead to unnecessary maintenance or fail to address issues that arise between scheduled intervals.
- Proactive Maintenance: Focuses on identifying and mitigating the root causes of performance drift. It integrates continuous condition monitoring, routine performance checks, and scheduled upkeep based on the instrument's usage and observed performance metrics [84] [85]. This approach not only prevents unexpected downtime but also maintains the system within its optimal performance envelope, ensuring consistent ionization efficiency and data quality over the long term.
A Proactive Maintenance Framework for LC-MS Systems
Implementing a proactive maintenance program requires a scheduled, multi-level approach. The following framework outlines the critical tasks for each maintenance tier.
Scheduled Maintenance Protocols
Table 1: Proactive Maintenance Schedule for LC-MS Systems
| Interval | Key Tasks | Direct Impact on Ionization Efficiency |
|---|---|---|
| Daily | Check and refill solvent reservoirs; flush LC lines; inspect and clean autosampler needle and seal; verify system pressure and baseline stability [83]. | Prevents the introduction of particulates and ensures consistent mobile phase delivery, which is critical for stable ESI spray formation. |
| Weekly | Clean ion source components (ESI probe, cone); inspect and clean pump seals for leaks; clean sample loop and injector rotor seal; run system suitability tests [83]. | Removes recent buildup of contaminants from the ionization source to maintain high ion plume density and transmission. |
| Monthly | Replace pump seals and check valves; clean or replace nebulizer; clean ion optics; perform mass calibration and resolution checks; inspect vacuum system; replace solvent filters [83]. | Ensures optimal droplet formation and ion desolvation (nebulizer) and maximizes the transmission of ions through the mass analyzer (ion optics). |
| Quarterly | Comprehensive cleaning of the entire ion source and ion transfer tubing; service vacuum pumps (oil change); review system performance logs [83]. | Addresses accumulated contamination in hard-to-reach areas and maintains the high vacuum essential for ion flight and detection. |
| Annually | Full preventive maintenance service by a certified engineer; performance qualification; replacement of aged components [83]. | Verifies the overall health of the system and replaces components that have degraded over time, restoring the system to its original specifications. |
Critical Component Monitoring and Care
- Ion Source: The ESI probe is the heart of ionization. Weekly cleaning with methanol-soaked lint-free wipes is essential to remove salt and matrix deposits that can cause electrical discharge irregularities and arcing, directly suppressing ion formation [83]. The positioning of the capillary tip relative to the sampling orifice must be optimized for the flow rate; incorrect positioning can lead to an expanded, less dense ion plume, reducing transmission efficiency into the mass spectrometer [19].
- Sample Introduction System: The autosampler is a common source of contamination carryover. A dirty or worn injection needle seal can cause sample adsorption and cross-contamination, leading to ghost peaks and ion suppression in subsequent injections. Regular cleaning and periodic replacement of these seals are crucial for data fidelity [83].
- Liquid Chromatography System: Wear on pump seals and check valves results in flow rate inaccuracies and pressure fluctuations. This disrupts the consistent formation of charged droplets in the ESI source, leading to signal instability and drift. Proactive seal replacement, as per the monthly schedule, prevents this [83].
- Vacuum System: A declining vacuum, often due to degraded pump oil or contamination, increases the number of collisions between ions and neutral gas molecules. This scattering effect reduces the number of ions reaching the detector, manifesting as a loss of sensitivity. Regular oil changes and system checks are proactive measures to maintain optimal vacuum [83].
Monitoring and Experimental Protocols for Drift Detection
A proactive strategy is incomplete without robust monitoring to quantitatively detect the earliest signs of drift.
System Suitability and QC Testing
Regular analysis of a consistent quality control (QC) sample is the primary method for monitoring system performance. A system suitability test should be incorporated into every sequence, evaluating parameters such as signal intensity (sensitivity), signal-to-noise ratio, retention time stability, and peak area/height reproducibility [83] [86]. Establishing control charts for these metrics from the QC sample data allows for the statistical identification of drift trends before they exceed acceptable limits.
Experimental Protocol: Assessing Matrix Effects and Ion Suppression
Objective: To quantitatively evaluate the impact of matrix effects and ion suppression, a major cause of ionization efficiency drift, using the post-column infusion method [38].
Materials:
- LC-MS system with a post-column infusion tee.
- A standard solution of the target analyte(s).
- A clean, extracted control matrix (e.g., blank plasma, urine).
- A syringe pump for continuous infusion.
Methodology:
- Infusion Setup: Connect the syringe pump, loaded with the analyte standard, to the post-column infusion tee. Initiate a constant, low-flow infusion of the analyte.
- Blank Injection: Inject the clean, control matrix onto the LC column and run the intended chromatographic method while the analyte is being infused post-column.
- Data Acquisition: Monitor the selected MRM transition(s) for the infused analyte throughout the chromatographic run. A stable signal should be observed in the absence of matrix effects.
Data Interpretation: The resulting chromatogram will show deviations from the stable baseline. A suppression or dip in the signal at specific retention times indicates where co-eluting matrix components from the injected blank are interfering with the ionization of the infused analyte [38]. These "suppression zones" inform method development, guiding adjustments in sample clean-up or chromatographic separation to avoid these regions.
Experimental Protocol: Monitoring Long-Term Source Contamination
Objective: To proactively track the buildup of contamination in the ion source as a leading indicator of impending sensitivity loss.
Materials:
- A stable standard mixture at a low, fixed concentration.
- Data processing software.
Methodology:
- Baseline Establishment: During method validation, analyze the standard mixture repeatedly to establish a baseline for peak area and signal-to-noise ratio.
- Routine Monitoring: Incorporate this standard at the beginning and end of every analytical batch or once per day during continuous operation.
- Trend Analysis: Plot the peak area response of the standard over time.
Data Interpretation: A gradual, steady decline in the response of the monitoring standard is a clear indicator of source contamination. This proactive signal allows for scheduled source cleaning during natural downtime, preventing unplanned analytical interruptions and data corruption [83].
The logical workflow for implementing these protocols is outlined below.
The Scientist's Toolkit: Essential Reagents and Materials
The following reagents and materials are critical for executing the maintenance and monitoring protocols described in this guide.
Table 2: Essential Research Reagent Solutions for LC-MS Maintenance
| Item | Function / Purpose | Technical Notes |
|---|---|---|
| High-Purity Solvents (Methanol, Acetonitrile, Isopropanol) | Universal cleaning agents for LC flow paths, autosamplers, and ion sources; mobile phase constituents. | Use LC-MS grade to prevent introduction of impurities that can cause background noise and contamination [87] [83]. |
| Volatile Buffers (Ammonium Acetate, Ammonium Formate) | Mobile phase additives to control pH and enhance ionization efficiency in both positive and negative modes. | Volatility is key to preventing crystallization and buildup in the ion source and vacuum interface [38]. |
| Lint-Free Wipes & Swabs | Physical cleaning of ion source components, probes, and orifices without leaving fibers. | Essential for preventing secondary contamination during cleaning procedures [83]. |
| Calibration Standards | For periodic mass axis and detector response calibration to ensure mass accuracy and sensitivity. | Vendor-provided or traceable standards specific to the mass analyzer (e.g., for triple quadrupole or Q-TOF) [83]. |
| Stable Isotope-Labeled Internal Standards | Normalizes for variability in sample preparation, injection volume, and ionization efficiency, correcting for matrix effects [86]. | Should be added to all samples, calibrators, and QCs at the start of sample preparation. |
| Quality Control (QC) Materials | Monitoring system stability, precision, and accuracy over time through control charting. | Should be matrix-matched to real samples and cover the analytical range [86]. |
In LC-MS research, where the integrity of data is inextricably linked to the stability of ionization efficiency, a reactive approach to instrument maintenance is untenable. The implementation of a rigorous, scheduled proactive maintenance framework, coupled with systematic monitoring via suitability tests and specialized drift detection experiments, is a critical investment. This proactive philosophy empowers researchers to preempt performance drift at its root, ensuring the generation of robust, reliable, and reproducible data that can confidently support scientific conclusions and regulatory decisions in drug development.
Validation and Emerging Frontiers: Ensuring Accuracy and Embracing Innovation
The ICH M10 guideline, formally titled "Bioanalytical Method Validation and Study Sample Analysis," provides harmonized global recommendations for validating bioanalytical methods used in nonclinical and clinical studies. This guideline, adopted in May 2022 and implemented by regulatory agencies including the European Medicines Agency (EMA) and U.S. Food and Drug Administration (FDA) in 2023, establishes standardized requirements for assessing key analytical parameters including matrix effects (ME), recovery, and process efficiency [88] [89] [90]. The implementation of ICH M10 represents a significant achievement in global regulatory harmonization, replacing previous regional guidances such as the EMA's 2011 Bioanalytical Method Validation guideline and the FDA's 2018 Guidance for Industry [90] [91]. The primary objective of this unified framework is to ensure that concentration measurements of chemical and biological drugs and their metabolites in biological matrices produce reliable, reproducible data suitable for regulatory decisions regarding drug safety and efficacy [88].
Within the context of liquid chromatography-mass spectrometry (LC-MS) research, understanding and controlling factors affecting ionization efficiency is fundamental to developing robust bioanalytical methods. Ionization efficiency directly influences critical method parameters including sensitivity, detection capability, precision, and accuracy [24]. The ICH M10 guideline explicitly requires investigators to demonstrate that their methods are not compromised by matrix effects—a major manifestation of which is ion suppression in mass spectrometry [24] [90]. By providing specific recommendations for validation procedures, ICH M10 establishes a structured framework for systematically assessing and mitigating these analytical challenges throughout the method development and validation lifecycle.
Core Concepts: ME, Recovery, and Process Efficiency
In LC-MS bioanalysis, three interrelated parameters must be thoroughly characterized to ensure method reliability:
Matrix Effects (ME) refer to the alteration of ionization efficiency caused by co-eluting components from the biological matrix [24]. This phenomenon, particularly ion suppression, occurs when endogenous or exogenous compounds affect an analyte's ability to ionize in the LC-MS interface, ultimately impacting detection capability, precision, and accuracy [24]. ME is quantitatively expressed as the percentage of ion suppression or enhancement, calculated by comparing the analyte response in the presence of matrix components to the response in pure solvent [24].
Recovery measures the efficiency of extracting the analyte from the biological matrix through sample preparation procedures. It reflects the percentage of analyte successfully carried through the sample preparation process and is determined by comparing the response of extracted samples to those spiked post-extraction [90].
Process Efficiency represents the overall efficiency of the entire analytical procedure, incorporating both extraction recovery and the impact of matrix effects. It is evaluated by comparing the response of extracted samples to neat standards in solvent, providing a comprehensive assessment of the method's effectiveness [90].
These parameters are interconnected within the bioanalytical workflow, as illustrated below:
Diagram: Interrelationship between recovery, matrix effects, and process efficiency in the bioanalytical workflow. Process efficiency represents the combined impact of both extraction recovery and matrix effects on the final analytical result.
Regulatory Requirements for ME, Recovery, and Process Efficiency
ICH M10 Validation Criteria
ICH M10 establishes specific acceptance criteria for bioanalytical method validation, with particular emphasis on parameters affecting data reliability. For matrix effect investigations, the guideline mandates testing with at least six lots of individual matrix, including evaluation of hemolyzed and lipemic matrices [91]. The acceptance criteria require that the relative standard deviation (RSD) of the IS-normalized matrix factor across different matrix lots should not exceed 15% [90]. This ensures consistency in analytical response regardless of normal biological variation in sample matrices.
For recovery, ICH M10 does not mandate absolute recovery percentages but requires that recovery be consistent, precise, and reproducible [90]. The assessment of process efficiency must demonstrate that the combined effects of recovery and matrix effects do not compromise the method's ability to reliably quantify analytes across the calibration range. During sample analysis, the guideline stipulates that quality control samples must always bracket study samples, providing continuous monitoring of analytical performance [91].
Investigation of Trends
ICH M10 emphasizes the importance of investigating "trends of concern" through standardized procedures. According to the accompanying Q&A document, such investigations "should be driven by an SOP and should take into account the entire process, including sample handling, processing and analysis" [90]. This includes scientific assessment of potential issues impacting the bioanalytical method, such as interferences and instability that might affect ME, recovery, and process efficiency over time [90].
Table 1: ICH M10 Acceptance Criteria for Key Validation Parameters
| Parameter | Experimental Approach | ICH M10 Acceptance Criteria | Additional Considerations |
|---|---|---|---|
| Matrix Effects | Assessment of IS-normalized matrix factor across ≥6 matrix lots, including hemolyzed and lipemic | RSD ≤15% for IS-normalized matrix factor | Consideration of ion suppression/enhancement; investigation of source [24] [91] |
| Recovery | Comparison of extracted samples to post-extraction spiked samples | Consistent and reproducible (not necessarily 100%) | Should be evaluated at LQC, MQC, and HQC concentrations [90] |
| Process Efficiency | Combined assessment of recovery and matrix effects | No specific numerical criterion; must not compromise accuracy and precision | Reflects overall method effectiveness [90] |
| Selectivity | Analysis of blank matrix from ≥6 sources | No interference ≥20% of LLOQ for analyte and ≥5% for IS | Includes hemolyzed and lipemic lots [91] |
Experimental Protocols for Assessment
Matrix Effect Evaluation
ICH M10 endorses two primary experimental approaches for evaluating matrix effects:
The post-column infusion method involves continuous introduction of a standard solution containing the analyte of interest via a syringe pump connected to the column effluent [24]. After injecting a blank matrix extract, any depression in the constant baseline indicates suppression of analyte ionization due to co-eluting matrix components [24]. This method provides a chromatographic profile of ionization suppression regions, helping to identify retention times particularly susceptible to matrix effects.
The post-extraction spiking method compares the MRM response (peak areas or heights) of an analyte spiked into blank matrix after extraction to that of the analyte injected directly into neat mobile phase [24]. A significantly reduced analyte signal in the matrix indicates ion suppression from interfering agents. This approach quantitatively measures the extent of ion suppression but doesn't identify its chromatographic location.
Diagram: Experimental workflow for matrix effects assessment according to ICH M10, showing two complementary methodological approaches.
Recovery and Process Efficiency Assessment
Recovery experiments involve preparing three sets of samples: (1) neat standards in solution (Set A), (2) standards spiked into matrix before extraction (Set B), and (3) blank matrix extracted then spiked with standards (Set C) [90]. Recovery is calculated as (B/C)×100%, while process efficiency is calculated as (B/A)×100%. Matrix effects can be derived as (C/A)×100%, completing the interrelationship between these parameters.
For comprehensive validation, these assessments should be conducted at multiple concentration levels (low, medium, and high quality control levels) using at least six individual lots of matrix to account for biological variability [91]. The use of stable isotope-labeled internal standards is strongly recommended to correct for variability in both recovery and matrix effects [24].
Mitigation Strategies for Ionization Issues
Chromatographic and Sample Preparation Solutions
When ion suppression is detected during method validation, several strategic approaches can mitigate its impact:
Chromatographic optimization: Adjusting separation conditions to move analyte retention away from regions of significant ion suppression identified through post-column infusion experiments [24]. This may involve modifying gradient profiles, mobile phase composition, or column chemistry.
Enhanced sample cleanup: Implementing more selective extraction techniques such as solid-phase extraction (SPE) or liquid-liquid extraction (LLE) to remove interfering matrix components [24]. The choice of sample preparation method should be guided by the chemical properties of both the analyte and potential interferents.
Ionization mode switching: Changing from electrospray ionization (ESI) to atmospheric pressure chemical ionization (APCI) or vice versa, as these ionization techniques experience different mechanisms and extents of ion suppression [24]. APCI frequently demonstrates less ion suppression than ESI for certain compound classes due to differences in ionization mechanisms [24].
Advanced Approaches for Ionization Efficiency Prediction
Emerging computational approaches show promise for predicting ionization efficiency and addressing matrix effects in non-targeted analysis. Recent research has developed models using molecular fingerprints and cumulative neutral losses from fragmentation spectra to predict ionization efficiency with root-mean-square errors of 0.72-0.79 logIE units [92]. These approaches enable more informed method development by anticipating ionization challenges before extensive laboratory work.
Another innovative strategy uses random forest regression to predict compound response in ESI-HRMS, achieving prediction of ionization efficiency with mean errors of 2.0-2.2 times for positive and negative modes, respectively [93]. This enables semi-quantitative concentration estimation for compounds without authentic standards, particularly valuable in non-targeted screening applications.
Table 2: Research Reagent Solutions for ME, Recovery, and Process Efficiency Assessment
| Reagent/Material | Function in Assessment | Application Notes |
|---|---|---|
| Ammonium formate buffer (pH 2.8 and 8.2) | Mobile phase modifier for ionization optimization | Used to determine optimal pH and ionization mode; essential for initial method development [74] |
| Stable isotope-labeled internal standards | Correction for variability in ME and recovery | Should be added prior to sample preparation; corrects for both ME and recovery losses [24] |
| Individual matrix lots (≥6 sources) | Assessment of biological variability in ME | Must include normal, hemolyzed, and lipemic matrices [91] |
| Post-extraction spiking solutions | Quantification of absolute ME | Prepared at LQC, MQC, and HQC concentrations [24] |
| Reference compounds (e.g., tetraethylammonium, benzoic acid) | Anchor points for ionization efficiency scales | Used to establish relative ionization efficiency scales [93] |
Documentation and Compliance
Reporting Requirements
ICH M10 introduces specific documentation requirements to demonstrate proper assessment of ME, recovery, and process efficiency. For comparative bioavailability and bioequivalence studies, bioanalytical reports must include internal standard response plots from all runs, including failed runs [91]. This comprehensive documentation enables regulatory reviewers to assess analytical performance throughout the study.
The guideline emphasizes thorough investigation and documentation of any "trends of concern" through standardized procedures [90]. This includes systematic assessment of the entire analytical process—from sample handling and processing to final analysis—with scientific evaluation of potential issues impacting the bioanalytical method, such as interferences and instability [90].
Implementation Considerations
Successful implementation of ICH M10 requires careful attention to several updated technical requirements. The guideline specifies that quality control samples must bracket study samples during analysis, ensuring continuous monitoring of analytical performance [91]. For chromatographic methods, dilution QC samples must be included during sample analysis with concentrations exceeding that of diluted study samples [91].
The implementation of ICH M10 also affects study design considerations, expanding requirements for incurred sample reanalysis (ISR) to include bioavailability studies, first clinical trials, pivotal early patient trials, and first trials in patients with impaired renal or hepatic function [91]. This broader scope reflects the importance of verifying method performance across diverse patient populations and study types.
The ICH M10 guideline establishes a harmonized, comprehensive framework for assessing matrix effects, recovery, and process efficiency in bioanalytical methods. By providing specific recommendations for experimental protocols and acceptance criteria, this regulatory framework ensures that LC-MS methods supporting regulatory submissions produce reliable, reproducible data essential for evaluating drug safety and efficacy. The successful implementation of these requirements demands systematic approach to method development and validation, incorporating robust assessment of ionization efficiency parameters throughout the bioanalytical workflow. As mass spectrometry technologies continue to evolve, the principles embedded in ICH M10 provide a stable foundation for maintaining data quality while accommodating methodological innovations in bioanalysis.
Liquid Chromatography-Mass Spectrometry (LC-MS) has emerged as a cornerstone technique in clinical and bioanalytical laboratories due to its exceptional sensitivity, specificity, and multi-analyte capability [16]. However, the technique presents unique challenges, particularly concerning ionization efficiency and its susceptibility to matrix effects, which can significantly impact the accuracy and reliability of quantitative results. The electrospray ionization (ESI) process, while robust, is notably vulnerable to suppression or enhancement caused by co-eluting matrix components [15] [16]. This interplay between the analyte, the sample matrix, and the ionization process forms a critical focus of modern validation protocols.
Systematic validation approaches, pioneered by the work of Matuszewski et al., provide a structured framework to quantify these effects, ensuring that LC-MS methods deliver precise, accurate, and clinically relevant data [15]. These protocols have evolved from general method validation principles into LC-MS-specific guidelines that address the technology's distinct characteristics. Understanding this evolution—from foundational models to contemporary implementations—is essential for researchers and drug development professionals who rely on LC-MS data for critical decisions in biomarker discovery, therapeutic drug monitoring, and diagnostic applications. This guide examines these protocols within the broader context of factors affecting ionization efficiency, detailing both the theoretical underpinnings and practical implementation of systematic validation in LC-MS research.
Foundational Principles: The Matuszewski Model
The model established by Matuszewski and colleagues represents a paradigm shift in LC-MS method validation by introducing a standardized experiment to disentangle the distinct contributions of sample preparation and ionization to overall method performance. This approach quantitatively assesses three key parameters: the Matrix Effect (ME), Recovery (RE), and Process Efficiency (PE) [15].
The core innovation of this model lies in its experimental design, which employs pre-extraction and post-extraction spiking techniques across multiple lots of the biological matrix. By comparing analyte responses between these sets, the model allows for the precise quantification of ionization suppression/enhancement (ME) and the efficiency of the extraction process (RE). The product of these two factors yields the overall Process Efficiency (PE), providing a holistic view of the method's performance [15].
Experimental Design and Workflow
The foundational experiment involves preparing three distinct sets of samples for each matrix lot and concentration level investigated [15]:
- Set 1 (Neat Solution): Analyte and Internal Standard (IS) spiked into a neat solvent (e.g., mobile phase). This set establishes the baseline response in the absence of matrix.
- Set 2 (Post-extraction Spike): Blank matrix is extracted, and then the analyte and IS are spiked into the resulting cleaned extract. This set measures the Matrix Effect (ME) by revealing how residual matrix components influence ionization.
- Set 3 (Pre-extraction Spike): Analyte and IS are spiked into the blank matrix prior to the entire sample preparation process. This set reflects the combined impact of both the Recovery (RE) through extraction and the Matrix Effect (ME).
Table 1: Definitions of Key Validation Parameters in the Matuszewski Model
| Parameter | Definition | Calculation | Impact on Quantification |
|---|---|---|---|
| Matrix Effect (ME) | Alteration of ionization efficiency due to co-eluting matrix components. | ME (%) = (Mean Peak Area of Set 2 / Mean Peak Area of Set 1) × 100 |
Ion suppression (ME<100%) or enhancement (ME>100%) directly affects sensitivity and accuracy. |
| Recovery (RE) | Efficiency of the sample preparation and extraction process. | RE (%) = (Mean Peak Area of Set 3 / Mean Peak Area of Set 2) × 100 |
Incomplete recovery leads to a loss of analyte, biasing results low. |
| Process Efficiency (PE) | Overall efficiency combining both extraction recovery and ionization matrix effects. | PE (%) = (Mean Peak Area of Set 3 / Mean Peak Area of Set 1) × 100 = (ME × RE) / 100 |
Reflects the total method yield; the ultimate impact on the measured concentration. |
The following workflow diagram illustrates the logical relationship and experimental setup for determining these critical parameters:
Evolution and Current Guidelines: Beyond the Foundational Model
The principles established by Matuszewski have been adopted and refined by international standards organizations, leading to the development of formal guidelines tailored for LC-MS. These documents provide updated and nuanced recommendations for the validation of clinical and bioanalytical methods.
Contemporary Guideline Recommendations
Current guidelines have built upon the foundational model, emphasizing the need to assess variability across multiple matrix lots to understand relative matrix effects—the variation in matrix effect between different individual sources of a matrix. This is critical for determining the real-world robustness of an assay [15] [94].
Table 2: Comparison of Matrix Effect and Recovery Assessment in Current International Guidelines
| Guideline | Matrix Lots | Concentration Levels | Key Recommendations and Focus | Acceptance Criteria |
|---|---|---|---|---|
| ICH M10 (2022) | 6 | 2 | Evaluation of matrix effect precision and accuracy. Recovery in independent experiments. | Accuracy <15% of nominal; Precision <15% CV. |
| CLSI C62-A (2022) | 5 | 7 | Evaluation of absolute and IS-normalized matrix effect. Emphasizes pre-established requirements for sensitivity/specificity. | CV <15% for peak areas. Absolute %ME evaluated based on TEA limits. |
| EMA (2011) | 6 | 2 | Evaluation of standard and IS absolute/relative matrix effects via post-extraction spiking. | CV <15% for Matrix Factor. Fewer lots acceptable for rare matrices. |
The Clinical and Laboratory Standards Institute (CLSI) guideline C62-A, titled "Liquid Chromatography-Mass Spectrometry Methods," is a key modern document. It offers comprehensive guidance for development and verification, aiming to reduce inter-laboratory variance. Its scope covers critical steps from pre-examination factors and assay calibration to analytical variables, verification, and quality control [95]. A significant advancement in contemporary practice is the emphasis on IS-normalized Matrix Effects. By using a stable isotope-labelled internal standard (SIL-IS), which ideally co-elutes with the analyte and experiences identical matrix effects, one can compensate for and monitor ionization suppression/enhancement. The consistency of the IS-normalized matrix factor across different matrix lots is a key indicator of a robust method [15].
Practical Implementation: Protocols and Research Reagents
Translating theoretical models into robust laboratory practice requires carefully designed experiments and the use of high-quality reagents. The following section outlines a detailed protocol for a comprehensive validation study and lists essential research reagents for LC-MS method development and validation.
Detailed Experimental Protocol for a Comprehensive Validation Study
This protocol integrates the approaches from Matuszewski et al. and current guideline recommendations [15].
Step 1: Experimental Design and Sample Set Preparation
- Select a minimum of 5-6 independent lots of the biological matrix (e.g., human plasma, serum, CSF).
- For each matrix lot, prepare three sample sets at low, medium, and high concentrations (e.g., near the LOQ, mid-range, and upper limit of quantification).
- Set A (Neat Solvent): Spike analyte and IS into mobile phase B or a suitable solvent. This is your control for 100% response.
- Set B (Post-extraction Spike): Extract blank matrix from each lot. After extraction and reconstitution, spike the analyte and IS. This measures the absolute Matrix Effect (ME).
- Set C (Pre-extraction Spike): Spike the analyte and IS into the blank matrix from each lot, then carry out the entire sample preparation procedure. This measures the combined Process Efficiency (PE).
- Prepare all samples in triplicate to assess precision.
Step 2: Chromatographic and Mass Spectrometric Analysis
- Analyze all sample sets using the developed LC-MS/MS method, typically in Multiple Reaction Monitoring (MRM) mode for optimal sensitivity [16].
- Maintain consistent chromatographic conditions, including column temperature, mobile phase composition, and flow rate, throughout the validation run.
- Use a system suitability test (e.g., injecting a reference standard) before the sequence to ensure instrument performance [96].
Step 3: Data Analysis and Calculation
- Calculate the absolute Matrix Effect (ME%), Recovery (RE%), and Process Efficiency (PE%) for each matrix lot and concentration level using the formulas in Table 1.
- Calculate the IS-normalized Matrix Factor (IS-norm MF) by dividing the Matrix Factor of the analyte by the Matrix Factor of the IS.
- Determine the precision of these parameters by calculating the Coefficient of Variation (CV%) across the different matrix lots. A CV ≤ 15% is generally acceptable for the IS-normalized MF, indicating minimal relative matrix effects [15].
The Scientist's Toolkit: Essential Research Reagent Solutions
The reliability of LC-MS validation is contingent on the quality of standards and reagents used. The following table catalogues key research reagent solutions critical for conducting the experiments described above.
Table 3: Key Research Reagent Solutions for LC-MS Method Validation
| Reagent / Standard | Primary Application & Function | Example Product |
|---|---|---|
| Stable Isotope-Labelled Internal Standard (SIL-IS) | Compensates for matrix effects and losses during sample prep; essential for calculating IS-normalized matrix factors. | Analyte-specific (e.g., GluCer C22:0-d4 for lipidomics [15]). |
| Chromatography Performance Standard | Assesses LC system performance, retention time stability, and peak shape. | Pierce Peptide Retention Time Calibration Mixture [96]. |
| System Suitability and Sensitivity Standard | Evaluates overall LC-MS/MS system sensitivity and instrument readiness before validation runs. | Pierce Reserpine Standard [96]. |
| Complex Sample Control / Digest Standard | Serves as a control for sample analysis in complex matrices like digests; monitors system performance. | Pierce HeLa Protein Digest Standard [96]. |
| Multi-Component Protein Standard | Used for chromatography assessment and tuning the mass spectrometer for a range of molecular weights. | Pierce 6-Protein Mixture Standard [96]. |
The journey "from foundations to practice" in LC-MS validation is a continuous process of rigorous assessment. The Matuszewski model provided the essential framework for understanding and quantifying the separate challenges of ionization efficiency and sample preparation. Contemporary guidelines like CLSI C62-A have operationalized these principles, emphasizing standardized verification and management of relative matrix effects. For researchers in drug development and clinical science, the implementation of these systematic protocols—utilizing appropriate reagent tools and a thorough experimental design—is not merely a regulatory hurdle. It is a fundamental practice that ensures the generation of reliable, high-quality data, thereby solidifying the role of LC-MS as a trusted pillar in modern bioanalysis.
In liquid chromatography-mass spectrometry (LC-MS), the ionization source is a critical determinant of analytical performance, impacting sensitivity, coverage of the chemical space, and robustness against matrix effects. This review provides a comparative analysis of three prominent ionization techniques: Electrospray Ionization (ESI), Atmospheric Pressure Chemical Ionization (APCI), and Liquid Electron Ionization (LEI). Framed within the broader context of factors affecting ionization efficiency, this guide examines the fundamental mechanisms, strengths, and limitations of each technique to inform method development in research and drug development.
Fundamental Ionization Mechanisms and Workflows
The core function of any LC-MS ionization source is to efficiently convert analytes from a liquid effluent into gas-phase ions for mass analysis. The mechanisms by which this is achieved differ significantly, leading to varied performance characteristics. The following diagram illustrates the fundamental pathways and logical relationships between the ionization techniques and their resulting spectral features.
Electrospray Ionization (ESI)
ESI operates at atmospheric pressure by applying a high voltage to the LC effluent, creating a fine aerosol of charged droplets [97]. As the solvent evaporates, the charge concentration on the droplets increases until Coulombic repulsion overcomes surface tension, leading to the ejection of gas-phase ions. ESI is exceptionally well-suited for polar and thermally labile compounds, including large biomolecules, as it can produce multiply charged ions, effectively extending the mass range of the mass spectrometer [97]. A key challenge is its susceptibility to matrix effects, where co-eluting compounds can suppress or enhance ionization, impacting quantitative accuracy [98] [27].
Atmospheric Pressure Chemical Ionization (APCI)
In APCI, the LC effluent is first vaporized in a heated nebulizer. The resulting gas-phase molecules are then subjected to a corona discharge needle, which ionizes the solvent vapor to create reagent ions (e.g., H3O+). These reagent ions subsequently ionize the analyte molecules through gas-phase chemical reactions, primarily proton transfer for positive ionization [97]. APCI is generally more effective than ESI for less polar, low-to-medium molecular weight, and thermally stable compounds [6]. Its gas-phase ionization mechanism typically makes it less susceptible to matrix effects compared to ESI [98] [27].
Liquid Electron Ionization (LEI)
LEI is a more recent innovation that enables the direct coupling of liquid chromatography with hard electron ionization (EI). The interface uses a vaporization micro-channel (VMC) to rapidly vaporize a nano-flow of the LC effluent, transporting the gas-phase molecules directly into the high-vacuum EI source [36]. There, analytes are bombarded with 70 eV electrons, producing classic EI spectra characterized by a molecular ion (M+•) and extensive, reproducible fragment ions [36] [99]. This "hard" ionization provides rich structural information and allows for library-searchable spectra, a significant advantage for identifying unknowns or confirming compound identity [36]. However, the extensive fragmentation can lead to lower sensitivity for the molecular ion compared to the softer API techniques.
Comparative Performance Analysis
The choice between ESI, APCI, and LEI involves trade-offs between sensitivity, chemical coverage, matrix effects, and the type of spectral information required. The following table summarizes key performance metrics based on recent experimental studies.
Table 1: Quantitative Performance Comparison of ESI, APCI, and LEI
| Performance Metric | Electrospray Ionization (ESI) | Atmospheric Pressure Chemical Ionization (APCI) | Liquid Electron Ionization (LEI) |
|---|---|---|---|
| Ionization Mechanism | Liquid-phase, charge ejection [97] | Gas-phase, chemical ionization [97] | Gas-phase, electron bombardment [36] |
| Ionization Efficiency | High for pre-charged or polar molecules [6] | High for low-moderate polarity molecules [6] | Highly compound-dependent; efficient vaporization is key [36] |
| Typical Ions Formed | [M+H]+, [M+Na]+, [M-H]-; multiple charges [97] | [M+H]+, [M-H]-; mostly single charges [97] | M+• (molecular ion); characteristic fragments [36] |
| Matrix Effects | Pronounced; significant signal suppression/enhancement [98] [27] | Moderate; less susceptible than ESI [98] [27] | Low; reduced ion suppression from co-elutants [36] [27] |
| Spectral Information | Little fragmentation (soft ionization) | Limited fragmentation | Extensive, reproducible fragmentation (hard ionization) [36] |
| Library Searchability | Low | Low | High (compatible with EI libraries) [36] [99] |
| Representative LOD (Study) | 0.25 ng/mL (Levonorgestrel) [98] | 1.00 ng/mL (Levonorgestrel) [98] | ~5x lower LOD than previous LEI setup (PAHs/Pesticides) [36] |
Analysis of Ionization Selectivity and Chemical Space
The "ionization selectivity" of these techniques directly determines the accessible chemical space in an untargeted analysis. ESI and APCI are not simply complementary; they cover distinct regions of the metabolome and chemical space. A study on grapeberry metabolites demonstrated that ESI excelled for moderately polar metabolites like flavanols and glycosylated anthocyanins, while APCI was superior for strongly polar metabolites such as sugars and organic acids, as well as for non-polar compounds [6]. This challenges the conventional view that APCI is only for non-polar analytes.
Emerging plasma-based techniques like Flexible Microtube Plasma (FμTP) are being developed to bridge this selectivity gap. In a 2025 study, FμTP demonstrated broad chemical coverage, showing higher sensitivity than ESI for 70% of tested pesticides and exhibiting negligible matrix effects for 76-86% of pesticides, compared to 35-67% for ESI and 55-75% for APCI [27]. This highlights a ongoing trend towards developing more universal ionization sources.
Experimental Protocols for Technique Comparison
To ensure reliable and reproducible comparisons between ionization techniques, a structured experimental protocol is essential. The following workflow outlines a generalized approach for a systematic evaluation, which can be adapted for specific research goals.
Detailed Methodologies from Cited Experiments
Protocol 1: Comparing ESI and APCI for Pharmaceutical Analysis This protocol is adapted from a study on the determination of levonorgestrel in human plasma [98].
- Chemicals and Reagents: Levonorgestrel and internal standard (Canrenone) reference standards. HPLC-grade methanol, formic acid, sodium bicarbonate, and cyclohexane (analytical grade).
- Sample Preparation: Liquid-liquid extraction (LLE) was employed. To 500 µL of human plasma, 10 µL of internal standard working solution (200 ng/mL), 100 µL of saturated sodium bicarbonate, and 4 mL of cyclohexane were added. The mixture was vortexed for 3 minutes and centrifuged at 4000 rpm for 10 minutes. The organic layer was transferred and evaporated to dryness under nitrogen at 40°C. The residue was reconstituted in 150 µL of mobile phase [98].
- LC-MS/MS Conditions:
- Chromatography: A C18 column (150 mm × 2.0 mm, 4.6 µm for ESI; 150 mm × 4.6 mm, 4.6 µm for APCI). Isocratic mobile phase: methanol and 0.01% formic acid (80:20, v/v). Flow rates: 0.2 mL/min (ESI) and 1.0 mL/min (APCI).
- Mass Spectrometry: Triple quadrupole instrument. ESI parameters: interface voltage 4.5 kV, desolvation line temperature 250°C, heat block temperature 400°C. APCI parameters: APCI temperature 350°C, heat block 200°C. Detection performed in multiple reaction monitoring (MRM) mode [98].
- Matrix Effects Evaluation: Measured by comparing the analyte peak area in spiked post-extraction samples with the peak area of neat standard solutions at the same concentration. A value of 100% indicates no matrix effects [98].
Protocol 2: Optimizing the LEI Interface This protocol is derived from research aimed at boosting LEI instrumental efficiency [36].
- Chemicals and Materials: Analytical standards of PAHs (naphthalene, anthracene, pyrene) and pesticides (atrazine, chlorpyrifos, etc.). HPLC-grade acetonitrile. Deactivated silica and silica capillaries of various internal diameters (I.D.).
- Interface Setup: Three different VMC setups were tested using combinations of standard silica and deactivated silica capillaries. The LEI interface was operated with a vaporization temperature of 350°C and a helium gas flow of 1.2 mL/min. The liquid flow was maintained at 500 nL/min [36].
- Analysis: Both flow injection analysis (FIA) with a triple quadrupole MS and LC-MS with a Q-TOF mass spectrometer were used. Instrumental detectability was assessed by determining the limit of detection (LOD) for each setup in triplicate [36].
The Scientist's Toolkit: Essential Research Reagents and Materials
Table 2: Key Reagents and Materials for Ionization Technique Evaluation
| Item Category | Specific Examples | Function in Experimental Protocol |
|---|---|---|
| Analytical Standards | Levonorgestrel, Canrenone (IS) [98]; PAHs & Pesticides [36]; Sterols (e.g., Cholesterol, Lanosterol) [100] | Model analytes to benchmark and compare ionization efficiency, sensitivity, and linearity across different techniques. |
| Chromatography | C18 Reversed-Phase Columns [98]; Methanol, Acetonitrile (HPLC grade) [98] [36]; Formic Acid, Ammonium Formate [98] [100] | Separate analytes from the matrix and each other; mobile phase additives influence ionization efficiency and adduct formation. |
| Sample Prep Sorbents | Primary-Secondary Amine (PSA), Enhanced Matrix Removal-Lipid (EMR) [27] | Clean up complex samples (e.g., food, plasma) via QuEChERS to reduce matrix interferences prior to LC-MS analysis. |
| Specialized Capillaries | Deactivated Silica Capillary [36]; Fused Silica Capillaries (various I.D.) [36] [99] | Critical for constructing and optimizing interfaces like LEI; material and I.D. influence analyte vaporization, transport, and LOD. |
| Discharge Gases | Helium, Argon, Argon-Propane mixture [27] | Used in APCI and plasma-based sources (e.g., FμTP); the gas type can influence ionization mechanisms and sensitivity. |
The comparative analysis of ESI, APCI, and LEI reveals that there is no single "best" ionization technique for all scenarios. The optimal choice is dictated by the specific analytical goals and the physicochemical properties of the target analytes. ESI remains the dominant technique for polar and ionic compounds, particularly large biomolecules, despite its known vulnerability to matrix effects. APCI provides a robust alternative for less polar, thermally stable small molecules, offering wider linear dynamic ranges and reduced matrix interferences. LEI emerges as a powerful tool for applications requiring definitive compound identification, as it generates reproducible, library-searchable spectra, though often at the cost of sensitivity for the molecular ion.
The future of ionization in LC-MS points toward the development of more universal sources, such as plasma-based techniques (e.g., FμTP), which aim to expand the covered chemical space while minimizing matrix effects. For researchers, a structured, experimental approach to technique selection—assessing sensitivity, matrix effects, and the required level of spectral information for their specific application—is paramount for developing robust and reliable LC-MS methods in drug development and biomedical research.
Liquid Chromatography-Mass Spectrometry (LC-MS) has become an indispensable analytical technique across scientific domains from pharmaceutical development to environmental monitoring. Despite its sophisticated capabilities, a fundamental challenge persists: the accurate quantification of analytes without reference standards. This challenge stems from the core principle of electrospray ionization (ESI), where ionization efficiency (IE)—the effectiveness of producing gas-phase ions from solution-phase analytes—can vary by up to six orders of magnitude between different compounds. Consequently, equal concentrations of different analytes can yield dramatically different signals, making absolute quantification impossible without compound-specific calibration [101] [21].
The pursuit of standard-free quantification represents a paradigm shift in analytical science. Traditional LC-MS quantification relies on authentic analytical standards to establish response factors for each target analyte, creating a bottleneck in non-targeted analysis where thousands of unknown compounds may be detected. Machine learning (ML) approaches now offer a transformative solution by predicting ionization efficiency from molecular characteristics, thereby enabling quantification without physical standards. This technical guide explores the theoretical foundations, methodological frameworks, and practical implementation of ML-based IE prediction within the broader context of factors affecting ionization efficiency in LC-MS research.
Fundamental Principles of Ionization Efficiency in ESI
Physicochemical Determinants of Ionization Efficiency
In electrospray ionization, multiple factors converge to determine the efficiency with which an analyte transitions from solution to gas-phase ions. The process begins as the LC mobile phase enters the sample capillary, where positive and negative ions separate based on applied polarity. Charged analytes accumulate at the capillary tip, forming a Taylor cone that disintegrates into charged droplets under electrostatic repulsion. These droplets undergo progressive desolvation through solvent evaporation, ultimately emitting gas-phase ions when repulsive forces overcome surface tension [19].
Several analyte-specific properties govern this process:
- Polarity and Charge Localization: Compounds with nonpolar moieties typically demonstrate higher ionization efficiency as they effectively compete for limited surface charge of electrospray droplets. Stronger bases generally exhibit higher IE in positive ESI mode due to favorable protonation [101].
- Molecular Structure and Functional Groups: Acidic/basic functional groups influence protonation/deprotonation efficiency, while aromatic systems and hydrocarbon chains affect surface activity and droplet partitioning [102].
- Thermal Lability: Heat-labile compounds may degrade in the ESI source at elevated desolvation temperatures, significantly impacting signal stability [19].
Chromatographic and Mobile Phase Considerations
The LC environment profoundly influences ionization efficiency through multiple mechanisms:
- Organic Modifier Content: Higher organic modifier percentage (e.g., acetonitrile, methanol) improves ionization efficiency by promoting faster droplet evaporation and Coulomb explosion [21].
- Mobile Phase pH and Buffer Composition: The pH affects analyte protonation state, with unexpected "wrong-way round" ionization sometimes occurring where cations show highest response in basic mobile phase [101]. Buffer type and concentration also significantly impact IE [21].
- Flow Rate Effects: At slower flow rates, smaller droplets form that desolvate more easily, allowing the capillary tip to be positioned closer to the sampling orifice. This increases ion plume density and improves ionization efficiency [19].
Table 1: Factors Affecting Ionization Efficiency in ESI-MS
| Factor Category | Specific Parameter | Impact on Ionization Efficiency |
|---|---|---|
| Analyte Properties | Polarity | Nonpolar moieties enhance surface activity and IE |
| Basicity/Acidity | Stronger bases have higher IE in ESI+; stronger acids in ESI- | |
| Molecular Size & Structure | Larger molecules may have lower IE due to inefficient desolvation | |
| Thermal Stability | Labile compounds may degrade at high source temperatures | |
| Mobile Phase | Organic Modifier % | Higher percentage improves desolvation and IE |
| pH | Affects protonation state and charge availability | |
| Buffer Composition | Different buffers alter ionization pathways and efficiency | |
| Additives (e.g., ammonium salts) | Can enhance or suppress ionization depending on analyte | |
| Instrument Parameters | Flow Rate | Lower flow rates generally improve IE |
| Nebulizing Gas Flow | Optimizes droplet formation and size distribution | |
| Desolvation Temperature | Higher temperatures improve desolvation but may degrade labile compounds | |
| Capillary Voltage | Affects electrospray stability and initial droplet formation |
Machine Learning Approaches for IE Prediction
Molecular Descriptor-Based Models
Early successful approaches to IE prediction leveraged quantitative structure-property relationship (QSPR) methodologies using molecular descriptors derived from chemical structures. The PaDEL software emerged as a valuable tool, generating 1,217 descriptors encompassing log P values, polarity indices, aromaticity, ring counts, atom and bond types, electrotopological states, and hydrogen bonding capacity [21]. After removing descriptors with near-zero variance and high inter-correlation, the remaining feature set trains random forest or extreme gradient boosting (xgBoost) algorithms to predict log IE values.
These models establish complex, nonlinear relationships between molecular characteristics and ionization behavior. For instance, Liigand et al. developed a random forest model using 237 PaDEL descriptors that demonstrated significant correlation between predicted and experimental IE values (Spearman's rho = 0.669) [21]. The prediction accuracy enables concentration estimation within approximately one order of magnitude for unknown compounds, sufficient for prioritization in non-targeted screening.
Alternative Descriptor Paradigms
While structural descriptors provide valuable predictive power, they require tentative compound identification, which introduces uncertainty in non-targeted analysis. Alternative approaches have emerged to address this limitation:
- Fragmentation Spectrum Descriptors: Models using cumulative neutral losses from MS² spectra demonstrate promising predictive capability (RMSE = 0.79 logIE units) without requiring structural identification [92]. This approach applies to analytes with completely unknown structures.
- COSMO-RS Combined with ML: Integrating the Conductor-like Screening Model for Real Solvents (COSMO-RS) with artificial neural networks accounts for solvation effects in different mobile phase compositions, improving prediction accuracy (R²pred = 0.880) while addressing matrix effects often overlooked in previous models [102].
ML Workflow for IE Prediction
Active Learning for Enhanced Model Performance
A significant challenge in IE prediction model development lies in the limited availability of experimental training data across diverse chemical spaces. Active learning (AL) frameworks address this limitation by iteratively selecting the most informative compounds for experimental measurement, thereby maximizing model improvement while minimizing analytical effort [103].
Uncertainty-based AL identifies compounds where the model exhibits highest prediction uncertainty, typically those structurally distinct from the training set. Clustering-based approaches ensure diverse chemical space coverage by selecting representatives from distinct molecular clusters. Research demonstrates that strategic AL implementation reduces root mean square error (RMSE) by up to 0.3 log units after a single iteration and improves quantification accuracy from a fold error of 4.13× to 2.94× for natural product analysis [103].
Active Learning Cycle
Experimental Protocols for IE Model Development
Data Acquisition and Calibration
Robust IE prediction models require carefully acquired experimental data spanning diverse chemical classes. The following protocol outlines standard practices for generating training data:
Instrumentation and Chromatography:
- Utilize UHPLC systems coupled to high-resolution mass spectrometers (e.g., Q-Exactive Orbitrap)
- Employ reversed-phase C18 columns (e.g., 150 × 2.1 mm, 1.7-2.6 μm particles)
- Implement gradient elution from 5% to 100% organic modifier over 15-20 minutes
- Maintain column temperature at 40°C and autosampler at 15°C [101]
Mobile Phase Preparation:
- Acidic conditions: 0.1% formic acid in water (pH ~2.7)
- Neutral/basic conditions: 5mM ammonium bicarbonate (pH ~8.0) or 0.1% ammonium solution (pH ~10.0)
- Organic phase: LC-MS grade acetonitrile or methanol [101]
Calibration Standards:
- Prepare stock solutions in appropriate solvents (typically acetonitrile or acetonitrile/water mixtures)
- Generate 5-8 point calibration curves covering 2-3 orders of magnitude
- Include triplicate measurements at each concentration level
- Verify linear range for each compound (R² > 0.98 typically) [21]
MS Instrument Parameters:
- ESI capillary voltage: 3.0-4.0 kV (positive), 2.5-3.5 kV (negative)
- Source temperature: 300-350°C
- Sheath gas: 35-50 arbitrary units
- Auxiliary gas: 5-15 arbitrary units
- Sweep gas: 0-5 arbitrary units
- S-lens RF level: 50-70% [101]
Response Factor Calculation
The fundamental quantitative measure for IE modeling is the response factor (RF), calculated as the slope of the calibration curve of instrument response versus molar concentration:
[ \text{RF} = \frac{\text{Signal Intensity}}{\text{Concentration}} ]
In practice, log-transformed response factors (log RF) provide better linear behavior across the wide dynamic range of ESI response. The response factor incorporates both ionization efficiency and transmission efficiency through the mass spectrometer.
Table 2: Performance Comparison of IE Prediction Approaches
| Prediction Method | Data Input Requirements | Prediction Error (RMSE) | Quantification Fold Error | Applicable Scenarios |
|---|---|---|---|---|
| Equal Response Assumption | None | N/A | 29× | Worst-case baseline |
| Closest Eluting Standard | Retention time of unknown and standards | N/A | 1300× | Traditional semiquantification |
| Molecular Descriptor ML | Chemical structure | 0.72 logIE units | 5-10× | Tentatively identified compounds |
| Neutral Loss Pattern ML | MS/MS spectrum | 0.79 logIE units | 6-12× | Unknown structures with MS² data |
| Active Learning-Optimized | Chemical structure + targeted experiments | 0.60-0.70 logIE units | 2.9-4.1× | High-precision quantification |
| SFC-Specific Model | Chemical structure + SFC conditions | N/A | 2.20× | SFC/ESI/HRMS applications |
Practical Implementation and Research Applications
Implementation Workflow for Standard-Free Quantification
Successful application of IE prediction models follows a systematic workflow:
- Compound Detection and Feature Alignment: Process raw LC-HRMS data to detect chromatographic peaks and align features across samples
- Tentative Identification: Assign possible structures using exact mass, isotopic patterns, and fragmentation spectra when available
- Descriptor Calculation: Generate molecular descriptors (PaDEL for known structures) or neutral loss patterns (for unknown structures)
- IE Prediction: Apply trained ML model to predict log IE values using appropriate mobile phase descriptors
- Concentration Estimation: Convert measured peak areas to concentration estimates using predicted IE values
- Uncertainty Assessment: Apply error estimates based on model validation performance
Domain-Specific Applications
The standard-free quantification approach has demonstrated utility across multiple scientific domains:
Environmental Monitoring: Identification and quantification of emerging contaminants and transformation products in water samples, with successful application to pesticides, pharmaceuticals, and personal care products [101] [103].
Natural Products Research: Quantification of bioactive compounds in plant extracts without purified standards, enabling rapid phytochemical profiling [103].
Metabolomics and Exposomics: Semiquantitative analysis of endogenous metabolites and environmental exposures in biological samples, facilitating large-scale cohort studies [104].
Food Safety and Authenticity: Screening for contaminants, adulterants, and quality markers in complex food matrices [102].
The Scientist's Toolkit: Essential Research Reagents and Materials
Table 3: Essential Materials for IE Prediction Research
| Category | Specific Items | Function and Application |
|---|---|---|
| Chromatography | C18 reversed-phase columns (e.g., Kinetex, Acquity) | Compound separation by hydrophobicity |
| HILIC columns (e.g., Eurosphere II) | Separation of polar compounds | |
| LC-MS grade water, acetonitrile, methanol | Mobile phase preparation | |
| Ammonium acetate, formic acid, ammonium hydroxide | Mobile phase additives for pH control | |
| Mass Spectrometry | High-resolution mass spectrometer (Orbitrap, Q-TOF) | Accurate mass measurement and sensitivity |
| ESI source with heated probe | Ionization of liquid-phase analytes | |
| Syringe pumps for direct infusion | Source parameter optimization | |
| Software and Computational | PaDEL-Descriptor software | Molecular descriptor calculation |
| R or Python with scikit-learn/xgBoost | Machine learning implementation | |
| Compound Discoverer, Xcalibur, MZmine | LC-HRMS data processing | |
| Chemical Standards | Diverse compound libraries | Model training and validation |
| Isotopically labeled internal standards | Method quality control | |
| Proficiency test materials | Model performance assessment |
Future Perspectives and Concluding Remarks
Machine learning-based ionization efficiency prediction represents a transformative advancement in analytical science, progressively eliminating the dependency on analytical standards for quantitative LC-MS analysis. As model architectures become more sophisticated and training datasets expand through active learning approaches, prediction accuracy continues to improve toward the goal of truly standard-free quantification.
The integration of IE prediction with retention time models and collision cross-section estimation creates a comprehensive in silico framework for compound identification and quantification. Future developments will likely focus on multi-modal prediction systems that combine various LC-MS descriptors with structural information, further bridging the gap between targeted and non-targeted analysis.
For researchers and drug development professionals, these methodologies offer powerful tools to accelerate discovery and screening workflows. By understanding both the capabilities and current limitations of IE prediction models, scientists can implement appropriate quality assurance measures while benefiting from the expanded quantitative information available through machine learning approaches. As validation studies continue to demonstrate reliability across diverse application domains, standard-free quantification promises to become an increasingly integral component of the analytical chemistry toolkit.
Liquid Chromatography-Mass Spectrometry (LC-MS) has become the cornerstone technique for quantitative bioanalysis in drug development, pharmacokinetics, and biomarker research. However, the accuracy and precision of LC-MS-based quantification are profoundly influenced by ionization efficiency—the phenomenon where co-eluting matrix components compete with target analytes for charge during the ionization process, leading to suppressed or enhanced signals [38]. This matrix effect represents a significant challenge for robust quantification, particularly in complex biological samples where countless components co-elute with analytes of interest [38].
The fundamental role of ionization efficiency in LC-MS quantification cannot be overstated. In electrospray ionization (ESI), the predominant ionization technique in LC-MS, the presence of non-volatile salts, phospholipids, metabolites, or other endogenous compounds can significantly alter the droplet formation and desolvation processes, ultimately affecting the number of gas-phase ions reaching the detector [38]. These ion suppression effects manifest as inconsistent response, reduced sensitivity, and compromised analytical accuracy, with potential signal reduction exceeding 50% in severe cases [38]. To address these challenges, the field has developed sophisticated quantification strategies, with Chemical Isotope Labeling (CIL) and Non-Targeted Analysis (NTA) emerging as powerful approaches that either compensate for or comprehensively characterize these ionization-related artifacts.
This technical guide examines these innovative quantification strategies within the context of ionization efficiency, providing researchers with detailed methodologies, comparative frameworks, and practical implementation guidelines to enhance data quality in LC-MS research.
Chemical Isotope Labeling: A Solution to Ionization Variability
Theoretical Foundations and Principle
Chemical Isotope Labeling (CIL) represents a refined approach to isotope dilution methodology that specifically addresses challenges related to ionization efficiency in LC-MS. The fundamental principle involves spiking samples with stable isotope-labeled analogues (e.g., ^2H, ^13C, ^15N) of target analytes at the earliest possible stage of sample preparation [105] [106]. These internal standards possess nearly identical chemical properties to their native counterparts, resulting in virtually identical chromatographic behavior and ionization efficiency [105]. However, their distinct mass-to-charge (m/z) ratios enable independent MS detection and quantification.
The relationship between ionization suppression and quantification accuracy is elegantly mitigated through CIL. Since the native analyte and its isotope-labeled analogue co-elute chromatographically, they experience identical matrix effects and ionization conditions [105]. Any suppression or enhancement affects both forms equally, preserving the response ratio used for quantification. This principle forms the basis of isotope dilution mass spectrometry (IDMS), recognized as a reference method for achieving high accuracy and precision in bioanalysis [105] [106].
Implementation Strategies and Experimental Design
Three primary CIL strategies have been developed for absolute protein quantification, each with distinct advantages for addressing ionization efficiency challenges:
AQUA (Absolute QUantitation AQUA) Strategy: Incorporposes stable isotope-labeled proteotypic peptides as internal standards for bottom-up proteomics. These synthetic peptides are spiked into samples after protein digestion, providing compensation for ionization variability during LC-MS/MS analysis of the resulting peptides [105].
PSAQ (Protein Standard Absolute Quantification) Strategy: Utilizes full-length, stable isotope-labeled protein analogues. These are added to samples prior to any processing steps, accounting for variability in both sample preparation efficiency and ionization efficiency, thereby providing more comprehensive quantification accuracy [105].
QconCAT Strategy: Employs artificial concatenated proteins containing multiple proteotypic peptides as internal standards. These are expressed as isotope-labeled proteins, added to samples before digestion, and subsequently quantified, enabling simultaneous quantification of multiple target proteins while controlling for digestion efficiency and ionization variability [105].
The experimental workflow for implementing CIL strategies typically follows these critical stages:
Figure 1: Experimental workflow for Chemical Isotope Labeling approaches, highlighting critical points where ionization efficiency variability is compensated.
Advanced Applications and Protocol Details
The application of CIL-LC-MS/MS for pharmaceutical compounds exemplifies its utility in addressing ionization challenges. The following detailed protocol outlines a robust methodology:
Sample Preparation Protocol:
- Internal Standard Addition: Spike 50 µL of biological sample (plasma, urine, tissue homogenate) with 10 µL of stable isotope-labeled internal standard solution at a predetermined concentration [105] [106].
- Protein Precipitation: Add 200 µL of ice-cold acetonitrile containing 0.1% formic acid to precipitate proteins. Vortex vigorously for 30 seconds and centrifuge at 14,000 × g for 10 minutes at 4°C [38].
- Solid-Phase Extraction (SPE): Transfer supernatant to SPE cartridges (e.g., Oasis HLB). Condition with 1 mL methanol followed by 1 mL water. Load samples, wash with 1 mL 5% methanol, and elute with 1 mL methanol containing 1% formic acid [47].
- Concentration and Reconstitution: Evaporate eluent under gentle nitrogen stream at 40°C and reconstitute in 100 µL initial mobile phase for LC-MS analysis [38].
LC-MS/MS Analysis Conditions:
- Chromatography: Reversed-phase C18 column (2.1 × 100 mm, 1.7 µm); mobile phase A: 0.1% formic acid in water, B: 0.1% formic acid in acetonitrile; gradient: 5-95% B over 10 min; flow rate: 0.3 mL/min; column temperature: 40°C [38].
- Mass Spectrometry: Electrospray ionization in positive mode; source temperature: 150°C; desolvation temperature: 500°C; cone gas flow: 50 L/h; desolvation gas flow: 800 L/h [38].
- Data Acquisition: Multiple Reaction Monitoring (MRM) mode with optimized transitions and collision energies for both native and isotope-labeled analogues [38].
Quantification Calculations: Quantification is performed by measuring the peak area ratio of the native analyte to its isotope-labeled internal standard. Calibration curves are constructed using authentic standards covering the expected concentration range (typically 1-1000 ng/mL), with each calibration point containing a fixed amount of internal standard [105]. The ratio remains constant despite fluctuations in ionization efficiency, enabling highly accurate quantification.
Non-Targeted Analysis: Comprehensive Profiling Beyond Ionization Artifacts
Theoretical Framework and Principles
Non-Targeted Analysis (NTA) represents a paradigm shift in analytical chemistry, moving from hypothesis-driven quantification to discovery-oriented profiling. Unlike traditional targeted methods that focus on predefined analytes, NTA employs comprehensive screening approaches to detect a broad spectrum of compounds without prior knowledge of their identity [107]. This approach is particularly valuable for identifying unknown analytes, characterizing complex mixtures, and detecting unexpected compounds that may influence ionization efficiency.
The fundamental principle of NTA relies on high-resolution mass spectrometry (HRMS) to achieve accurate mass measurements (typically < 5 ppm mass error), enabling the determination of elemental compositions for detected ions [107]. When coupled with advanced separation techniques like UHPLC, NTA provides a powerful platform for characterizing complex samples while monitoring ionization-related phenomena across the entire chromatographic landscape.
NTA is particularly relevant in the context of ionization efficiency as it can identify previously unrecognized matrix components that contribute to ion suppression or enhancement effects. This comprehensive profiling enables researchers to understand the complete chemical environment affecting their analyses, rather than focusing solely on predefined targets [107].
Implementation Workflow and Strategic Considerations
The typical workflow for NTA involves multiple stages of data acquisition and processing, each contributing to a comprehensive understanding of the sample composition and its impact on ionization:
Figure 2: Comprehensive workflow for Non-Targeted Analysis, highlighting critical stages where ionization efficiency can be monitored and assessed.
Advanced Methodologies and Detailed Protocols
Sample Preparation for Comprehensive NTA: Effective NTA requires sample preparation that preserves chemical diversity while removing potential interferents:
- Migration/Extraction: For solid materials (e.g., food contact materials), use appropriate food simulants (95% ethanol for fatty foods, 10% ethanol for aqueous foods) under worst-case conditions (60°C for 10 days) to extract migrating substances [107].
- Sample Cleanup: Employ mixed-mode solid-phase extraction (Oasis MCX/MAX) for selective removal of proteins and phospholipids while retaining broad chemical diversity [107].
- Concentration: Carefully evaporate extracts under nitrogen and reconstitute in initial mobile phase compatible with both positive and negative ionization modes [107].
Instrumental Analysis for NTA:
- Liquid Chromatography: Employ UHPLC with reversed-phase C18 column (2.1 × 100 mm, 1.7 µm); mobile phase: water (A) and acetonitrile (B), both with 0.1% formic acid; gradient: 5-100% B over 20 min; flow rate: 0.4 mL/min; column temperature: 45°C [107].
- Mass Spectrometry: Q-TOF or Orbitrap mass analyzer with electrospray ionization in both positive and negative switching modes; mass range: 50-1200 m/z; resolution: >30,000; data acquisition: data-dependent (DDA) or data-independent (DIA) acquisition [107].
Data Processing and Compound Identification:
- Feature Detection: Use software platforms (MS-DIAL, XCMS, Compound Discoverer) for peak picking, alignment, and componentization [108] [107].
- Database Searching: Interrogate spectral libraries (NIST, mzCloud, MassBank) and chemical databases (PubChem, ChemSpider) for structural annotations [108] [107].
- Ionization Efficiency Assessment: Monitor baseline characteristics, signal intensity distributions, and retention time regions with pronounced suppression to identify chemical classes most affecting ionization [38] [107].
Comparative Analysis: Strategic Implementation for Ionization Challenges
Technical Comparison and Application Scenarios
The selection between CIL and NTA depends on research objectives, sample complexity, and the specific ionization challenges encountered. The following table provides a comparative analysis of these approaches:
Table 1: Comparative Analysis of Chemical Isotope Labeling versus Non-Targeted Analysis
| Parameter | Chemical Isotope Labeling (CIL) | Non-Targeted Analysis (NTA) |
|---|---|---|
| Primary Application | Absolute quantification of predefined targets | Comprehensive screening and discovery of unknowns |
| Ionization Efficiency Compensation | Excellent (through co-eluting internal standards) | Limited (requires post-acquisition normalization) |
| Throughput | High for targeted analytes | Moderate due to complex data processing |
| Data Complexity | Low to moderate | High, requiring specialized bioinformatics |
| Quantification Accuracy | High (accuracy 85-115%) | Semi-quantitative (accuracy 50-200%) |
| Sensitivity | Excellent (sub-ng/mL) | Variable (ng-µg/mL) |
| Standard Requirements | Requires isotope-labeled standards | Does not require authentic standards |
| Best Suited For | Regulated bioanalysis, biomarker validation, pharmacokinetic studies | Safety assessment, impurity profiling, exposomics |
Complementary Implementation for Comprehensive Analysis
While CIL and NTA represent distinct approaches, they can be powerfully integrated within a comprehensive analytical strategy:
- Hybrid Workflows: Initial NTA can identify potential matrix components causing ionization suppression, informing the development of optimized CIL methods for target analytes [38] [107].
- Ionization Monitoring: NTA can map ionization suppression zones across the chromatographic landscape, guiding the selection of optimal retention times and internal standards for CIL methods [38].
- Comprehensive Quality Assessment: Combining targeted quantification (via CIL) with non-targeted screening provides a complete picture of both known and unknown factors affecting analytical accuracy [107] [109].
Essential Research Tools and Reagent Solutions
Successful implementation of CIL and NTA strategies requires specialized reagents, software tools, and instrumentation. The following table summarizes key resources for establishing these methodologies:
Table 2: Essential Research Tools for Advanced Quantification Strategies
| Resource Category | Specific Tools/Reagents | Application and Function |
|---|---|---|
| Quantification Software | MaxQuant [110], Skyline [111], Proteome Discoverer [111] | Processing and statistical analysis of proteomics data |
| Database Search Algorithms | Andromeda [108] [110], MSFragger [108], Byonic [108] | Peptide identification from tandem mass spectra |
| Stable Isotope Labels | ^13C/^15N-labeled amino acids, AQUA peptides, PSAQ proteins [105] [106] | Internal standards for precise quantification |
| Chromatography Columns | UPLC BEH C18 (1.7 µm), Zorbax XDB-C18 (3.5 µm) [36] | High-resolution separation of complex mixtures |
| Sample Preparation | Oasis HLB SPE cartridges [47], protein precipitation plates | Efficient extraction and cleanup of analytes |
| Mass Spectrometry Platforms | Q-TOF, Orbitrap, Triple Quadrupole (QQQ) [38] [109] | High-resolution and sensitive detection |
| Spectral Libraries | NIST Tandem Library, mzCloud, MassBank [108] [107] | Compound identification in NTA |
Innovative quantification strategies based on Chemical Isotope Labeling and Non-Targeted Analysis represent powerful approaches to address the critical challenge of ionization efficiency in LC-MS. CIL provides a robust framework for accurate quantification of predefined targets by effectively compensating for matrix effects through isotope dilution principles [105] [106]. Meanwhile, NTA offers a comprehensive discovery-oriented approach that characterizes the complete chemical landscape, identifying previously unknown components that may influence ionization behavior [107].
The strategic implementation of these approaches—either independently or in an integrated manner—enables researchers to overcome fundamental limitations in quantitative LC-MS analysis. By acknowledging and systematically addressing ionization efficiency challenges, the scientific community can advance more reliable quantification in complex matrices, ultimately enhancing decision-making in pharmaceutical development, clinical research, and environmental monitoring.
As LC-MS technology continues to evolve with improvements in ion transmission, detector sensitivity, and computational power [38] [109], these quantification strategies will undoubtedly refine further, offering increasingly sophisticated solutions to the persistent challenge of ionization variability in mass spectrometry.
Conclusion
Mastering ionization efficiency is not a single task but a holistic process integral to the success of any LC-MS application. It requires a deep understanding of the intricate interplay between fundamental chemical principles, meticulous method development, proactive troubleshooting, and rigorous validation. The foundational knowledge of how analyte properties and eluent conditions affect ionization provides the necessary groundwork. Applying this through strategic sample cleanup and chromatographic separation is key to mitigating matrix effects, while systematic optimization of instrument parameters ensures peak sensitivity. Adherence to validation guidelines guarantees the reliability of the resulting data. Looking forward, the field is being transformed by emerging technologies. Machine learning models that predict ionization efficiency based on molecular structure or fragmentation spectra promise to revolutionize non-targeted analysis by enabling semi-quantification without authentic standards. Furthermore, novel ionization interfaces and sophisticated multiplexing strategies are continuously expanding the capabilities of LC-MS. For researchers in drug development and biomedical science, embracing these integrated and innovative approaches is paramount for achieving robust, precise, and impactful analytical outcomes in an increasingly complex analytical landscape.
References
- 1. Top 6 Ion Sources in Mass Spectrometry: EI, CI, ESI, APCI, ... [https://www.metwarebio.com/top-6-ion-sources-mass-spectrometry/]
- 2. Interfaces for LC-MS [https://www.shimadzu.com/an/service-support/technical-support/analysis-basics/basics_of_lcms/interfaces_for_lcms.html]
- 3. Atmospheric-pressure chemical ionization [https://en.wikipedia.org/wiki/Atmospheric-pressure_chemical_ionization]
- 4. Efficiency of ESI and APCI ionization sources in LC-MS ... [https://www.sciencedirect.com/science/article/pii/S0308814619310295]
- 5. Efficiency of ESI and APCI ionization sources in LC-MS ... [https://pubmed.ncbi.nlm.nih.gov/31253300/]
- 6. Performance Comparison of Electrospray Ionization and ... [https://pubmed.ncbi.nlm.nih.gov/27935129/]
- 7. Towards Unbiased Evaluation of Ionization Performance in ... [https://pmc.ncbi.nlm.nih.gov/articles/PMC9144264/]
- 8. Development of a fast-switching dual (ESI/APCI) ionization ... [https://pubmed.ncbi.nlm.nih.gov/32468622/]
- 9. 30 Years of research on ESI/MS response [https://www.sciencedirect.com/science/article/pii/S000326702031179X]
- 10. Atmospheric pressure chemical ionisation mass ... [https://pmc.ncbi.nlm.nih.gov/articles/PMC8054169/]
- 11. pKa, Ionizable Drugs, And Pharmaceutical Discovery [https://www.millennialscientific.com/post/pka-ionizable-drugs-and-pharmaceutical-discovery?srsltid=AfmBOoovdZAtLmxbz0g2-0UleSIkgnzPn5ucFrw0YDFfkbuFpaUQDyTf]
- 12. How pKa Affects HPLC Method Development [https://www.linkedin.com/posts/ramzan-shaikh15_what-is-the-role-of-pka-in-hplc-method-activity-7395469626098204672-dnVz]
- 13. Development of Methods for the Determination of pKa Values [https://pmc.ncbi.nlm.nih.gov/articles/PMC3747999/]
- 14. Key Properties in Drug Design | Predicting Lipophilicity, ... [https://chemaxon.com/blog/presentation/key-properties-in-drug-design-predicting-lipophilicity-pka-and-solubility-0]
- 15. Systematic Assessment of Matrix Effect, Recovery, and ... [https://pmc.ncbi.nlm.nih.gov/articles/PMC12613129/]
- 16. Principles and Applications of Liquid Chromatography ... [https://pmc.ncbi.nlm.nih.gov/articles/PMC2643089/]
- 17. Basic Principles of LC, HPLC, MS, & MS [https://chemyx.com/resources/knowledge-base/general-syringe-pump-info/basic-principles-hplc-ms-lc-ms/?srsltid=AfmBOorG-JaJtmgpX-Q7zZ68Q1pScSqFQdp2PDrofjEtB0gNJlfs4krn]
- 18. Understanding mobile phase buffer composition and ... [https://www.sciencedirect.com/science/article/abs/pii/S0021967323001929]
- 19. LC–MS Sensitivity: Practical Strategies to Boost Your ... [https://www.chromatographyonline.com/view/lc-ms-sensitivity-practical-strategies-boost-your-signal-and-lower-your-noise]
- 20. The effect of organic modifiers on electrospray ionization ... [https://pubmed.ncbi.nlm.nih.gov/23325666/]
- 21. Electrospray Ionization Efficiency Predictions and ... [https://pmc.ncbi.nlm.nih.gov/articles/PMC10326909/]
- 22. Volatile Buffer pH Ranges for LCMS & ELSD Detectors [https://www.nestgrp.com/protocols/trng/buffer.shtml]
- 23. Innovations in Liquid Chromatography: 2025 HPLC ... [https://www.chromatographyonline.com/view/innovations-in-liquid-chromatography-2025-hplc-column-and-accessories-review]
- 24. Ion Suppression: A Major Concern in Mass Spectrometry [https://www.chromatographyonline.com/view/ion-suppression-major-concern-mass-spectrometry]
- 25. Ion suppression; A critical review on causes, evaluation ... [https://www.sciencedirect.com/science/article/abs/pii/S0039914013001975]
- 26. Strategies for the Detection and Elimination of Matrix ... [https://www.chromatographyonline.com/view/strategies-detection-and-elimination-matrix-effects-quantitative-lc-ms-analysis]
- 27. Efficient and Wide Chemical-Space Ionization of Organic ... [https://pmc.ncbi.nlm.nih.gov/articles/PMC12489893/]
- 28. What are Matrix Effect in Liquid Chromatography Mass ... [https://www.nebiolab.com/what-are-matrix-effect-in-liquid-chromatography-mass-spectrometry/]
- 29. Electrospray ionization mass spectrometry ion suppression ... [https://pmc.ncbi.nlm.nih.gov/articles/PMC8244038/]
- 30. Matrix effects break the LC behavior rule for analytes in LC ... [https://pmc.ncbi.nlm.nih.gov/articles/PMC4935370/]
- 31. Ion suppression correction and normalization for non- ... [https://www.nature.com/articles/s41467-025-56646-8]
- 32. Comprehensive analytical approaches: The use of LC-MS ... [https://www.sciencedirect.com/science/article/abs/pii/S0026265X25021289]
- 33. 2025 ASMS: New Mass Spectrometry Technologies to ... [https://www.labx.com/resources/2025-asms-new-mass-spectrometry-technologies-to-confront-the-next-wave-of-complex-challen/5428]
- 34. On the Ionization and Ion Transmission Efficiencies of ... [https://pmc.ncbi.nlm.nih.gov/articles/PMC4276539/]
- 35. Impact of instrumental settings in electrospray ionization ... [https://pmc.ncbi.nlm.nih.gov/articles/PMC9174117/]
- 36. Optimizing Liquid Electron Ionization Interface to Boost LC ... [https://www.mdpi.com/2297-8739/12/5/105]
- 37. Impact of instrumental settings in electrospray ionization ... [https://link.springer.com/article/10.1007/s00216-021-03767-w]
- 38. Optimizing LC‑MS/MS Sensitivity: Strategies to Overcome ... [https://biotech-spain.com/en/articles/optimizing-lc-ms-ms-sensitivity-strategies-to-overcome-ion-suppression-and-boost-robustness-in-bioanalysis/]
- 39. Overview, consequences, and strategies for overcoming ... [https://pubmed.ncbi.nlm.nih.gov/34546235/]
- 40. Liquid chromatography–mass spectrometry [https://en.wikipedia.org/wiki/Liquid_chromatography%E2%80%93mass_spectrometry]
- 41. Optimizing LC–MS and LC–MS-MS Methods [https://www.chromatographyonline.com/view/optimizing-lc-ms-and-lc-ms-ms-methods-1]
- 42. solid phase extraction and application | PPTX [https://www.slideshare.net/slideshow/solid-phase-extraction-and-application-9008839/9008839]
- 43. High-Throughput Solid Phase Extraction for Targeted and ... [https://pmc.ncbi.nlm.nih.gov/articles/PMC11948174/]
- 44. Essential Guide to LCMS Sample Preparation Techniques [https://www.hplcvials.com/faq/essential-guide-to-lcms-sample-preparation-techniques.html]
- 45. Cross-Signal Contribution as a Challenge in LC-MS ... [https://pmc.ncbi.nlm.nih.gov/articles/PMC12268833/]
- 46. Overcoming Matrix Interference in LC-MS/MS [https://www.sepscience.com/overcoming-matrix-interference-in-lc-ms-ms-12015]
- 47. SPE-LC-MS/MS optimisation using response surface ... [https://www.sciencedirect.com/science/article/pii/S0021967325004005]
- 48. Optimization of chromatographic conditions via Box ... [https://pmc.ncbi.nlm.nih.gov/articles/PMC10522955/]
- 49. Mobile Phase Buffers in Liquid Chromatography: A Review ... [https://www.chromatographyonline.com/view/mobile-phase-buffers-in-liquid-chromatography-a-review-of-essential-ideas]
- 50. Comparing volatile and non-volatile buffer systems in UPLC [https://www.sciencedirect.com/science/article/abs/pii/S0021967325002997]
- 51. Mobile phase & negative mode LC-MS analysis [http://www.chromforum.org/viewtopic.php?t=39631]
- 52. Optimization of Mobile Phase Modifiers for Fast LC-MS ... [https://www.mdpi.com/1422-0067/24/3/1987]
- 53. Development of an Efficient HPLC-MS/MS Method for the ... [https://www.mdpi.com/2297-8739/12/10/257]
- 54. LC-MS Sample Preparation [https://www.thermofisher.com/us/en/home/industrial/mass-spectrometry/mass-spectrometry-learning-center/liquid-chromatography-mass-spectrometry-lc-ms-information/lc-ms-sample-preparation.html]
- 55. How to Prepare Mobile Phase for LC-MS/MS [https://www.linkedin.com/posts/rajeswaran-v-aa554a139_bioanalytical-lcmsms-mobilephase-activity-7342890435733831680-weoU]
- 56. Matrix Effects on Quantitation in Liquid Chromatography [https://www.chromatographyonline.com/view/matrix-effects-on-quantitation-in-liquid-chromatography-sources-and-solutions]
- 57. Standard addition with internal standardisation as an ... [https://www.sciencedirect.com/science/article/abs/pii/S002196731830459X]
- 58. the internal standard normalized matrix effect [https://pubmed.ncbi.nlm.nih.gov/28737421/]
- 59. Internal Standards in LC−MS Bioanalysis [https://dmpkservice.wuxiapptec.com/articles/404-internal-standards-in-lc-ms-bioanalysis-which-when-and-how/]
- 60. Quantification for non-targeted LC/MS screening without ... [https://www.nature.com/articles/s41598-020-62573-z]
- 61. Species-specific optimization of oxylipin ionization in LC–MS [https://pmc.ncbi.nlm.nih.gov/articles/PMC11913994/]
- 62. Optimize LC‑MS/MS Sensitivity: Ion Suppression in ... [https://amsbiopharma.com/lc-ms-ms-sensitivity/]
- 63. Development and validation of an LC-MS/MS method ... [https://pmc.ncbi.nlm.nih.gov/articles/PMC3659617/]
- 64. Liquid Chromatography/ Mass Spectrometry Fundamentals [https://www.agilent.com/en/product/liquid-chromatography-mass-spectrometry-lc-ms/lcms-fundamentals?srsltid=AfmBOopyhdkWs7u5qj877jp0-egLtqVdGMO4kjm9HAnCamR5Mhrhv2tu]
- 65. Ion suppression in liquid chromatography–mass ... [https://en.wikipedia.org/wiki/Ion_suppression_in_liquid_chromatography%E2%80%93mass_spectrometry]
- 66. LC-MS/MS in the Clinical Laboratory – Where to From Here? [https://pmc.ncbi.nlm.nih.gov/articles/PMC3052391/]
- 67. Liquid chromatography–tandem mass spectrometry for ... [https://www.nature.com/articles/s43586-022-00175-x]
- 68. The ion suppression phenomenon in liquid ... [https://www.sciencedirect.com/science/article/abs/pii/S0003267004011158]
- 69. Ion suppression correction and normalization for non-targeted ... [https://pmc.ncbi.nlm.nih.gov/articles/PMC11794426/]
- 70. Evaluation of ion source parameters and liquid ... [https://www.sciencedirect.com/science/article/abs/pii/S1570023225001163]
- 71. The LCGC Blog: 10 Great Tips for Electrospray Ionization – LC MS [https://www.chromatographyonline.com/view/the-lcgc-blog-10-great-tips-for-electrospray-ionization-lc-ms]
- 72. 10 Tips for Electrospray Ionisation - LC MS [https://www.elementlabsolutions.com/uk/chromatography-blog/post/10-tips-for-electrospray-ionisation-lc-ms]
- 73. A rational strategy based on experimental designs to optimize... [https://pubmed.ncbi.nlm.nih.gov/31450446/]
- 74. Tips for Optimizing Key Parameters in LC–MS [https://www.chromatographyonline.com/view/tips-optimizing-key-parameters-lc-ms]
- 75. Characterizing Electrospray Ionization Using Atmospheric ... [https://pmc.ncbi.nlm.nih.gov/articles/PMC3633478/]
- 76. A Systematic Approach to Development of Analytical Scale ... [https://pmc.ncbi.nlm.nih.gov/articles/PMC8035295/]
- 77. Microflow LC-MS Technology [https://sciex.com/technology/microflow-technology]
- 78. Advances in analytical technologies for emerging drug ... [https://www.sciencedirect.com/science/article/abs/pii/S0021967324006009]
- 79. And Y-Ions for Multiple Reaction Monitoring Mass Spectrometry [https://pubmed.ncbi.nlm.nih.gov/20968307/]
- 80. Rapid Optimization of MRM-MS Instrument Parameters by ... [https://pmc.ncbi.nlm.nih.gov/articles/PMC2811718/]
- 81. 4 Steps to Successful Compound Optimization on LC-MS/MS [https://www.technologynetworks.com/analysis/how-to-guides/4-steps-to-successful-compound-optimization-on-lc-msms-311382]
- 82. Automated Multiple Reaction Monitoring (MRM) Method ... [https://www.waters.com/nextgen/us/en/library/application-notes/2025/automated-multiple-reaction-monitoring-mrm-method-development-for-peptide-drugs-using-waters_connect-for-quantitation-software.html?srsltid=AfmBOopH-UCEUz4hjsOlBaj1tDQOxFPP8GiaEwGaElRuyODut3PJcNK0]
- 83. Preventive Maintenance for Waters LC-MS Systems [https://www.waters-equipment.com/article/preventive-maintenance-waters-lcms]
- 84. Proactive Maintenance vs Predictive Maintenance [https://www.ruggedmonitoring.com/types-of-condition-monitoring-proactive-maintenance-vs-predictive-maintenance/]
- 85. How Proactive Measures Enhance Predictive Maintenance ... [https://weeverapps.com/operational-excellence/how-proactive-measures-enhance-predictive-maintenance/]
- 86. Liquid chromatography–tandem mass spectrometry for ... [https://pmc.ncbi.nlm.nih.gov/articles/PMC9735147/]
- 87. Why Your HPLC Baseline Drifts—And How to Stop It [https://www.sepscience.com/why-your-hplc-baseline-drifts-and-how-to-stop-it-11018]
- 88. ICH M10 on bioanalytical method validation - Scientific guideline [https://www.ema.europa.eu/en/ich-m10-bioanalytical-method-validation-scientific-guideline]
- 89. M10 Bioanalytical Method Validation and Study Sample ... [https://www.fda.gov/regulatory-information/search-fda-guidance-documents/m10-bioanalytical-method-validation-and-study-sample-analysis]
- 90. ICH M10 Guideline on Bioanalytical Method Validation and ... [https://www.gmp-compliance.org/gmp-news/ich-m10-guideline-on-bioanalytical-method-validation-and-study-sample-analysis]
- 91. Implementing ICH M10: Finally, a Harmonized ... [https://www.frontagelab.com/blog/implementing-ich-m10-finally-a-harmonized-bioanalytical-method-validation-guidance/]
- 92. Ionization Efficiency Prediction of Electrospray ... [https://chemrxiv.org/engage/chemrxiv/article-details/684981141a8f9bdab58bf64c]
- 93. Quantification for non-targeted LC/MS screening without ... [https://pmc.ncbi.nlm.nih.gov/articles/PMC7118164/]
- 94. Validation of an LC-MS/MS-based dilute-and-shoot ... [https://pmc.ncbi.nlm.nih.gov/articles/PMC7136310/]
- 95. C62 | Liquid Chromatography-Mass Spectrometry Methods [https://clsi.org/shop/standards/c62/]
- 96. Mass Spectrometry Controls and Standards [https://www.thermofisher.com/ar/en/home/life-science/protein-biology/protein-mass-spectrometry-analysis/calibration-solutions-standards-solvents-mass-spectrometry/mass-spectrometry-controls-standards.html]
- 97. Mass Spectrometry Ionization Methods - Chemistry at Emory [https://chemistry.emory.edu/msc/tutorial/mass-spectrometry-ionization.html]
- 98. Comparison of ESI– and APCI–LC–MS/MS methods [https://pmc.ncbi.nlm.nih.gov/articles/PMC5762935/]
- 99. Drug screening in pharmaceutical and forensic ... [https://www.nature.com/articles/s41598-025-14772-9]
- 100. Sterol analysis in cancer cells using atmospheric pressure ... [https://pmc.ncbi.nlm.nih.gov/articles/PMC12596357/]
- 101. Machine Learning for Absolute Quantification of ... [https://pmc.ncbi.nlm.nih.gov/articles/PMC8840743/]
- 102. Prediction of mass spectrometry ionization efficiency based ... [https://pubs.rsc.org/en/content/articlelanding/2024/an/d4an00301b]
- 103. Active Learning Improves Ionization Efficiency Predictions and ... [https://pmc.ncbi.nlm.nih.gov/articles/PMC12224155/]
- 104. Recent Advances in Liquid Chromatography-Mass ... [https://pubmed.ncbi.nlm.nih.gov/40584301/]
- 105. strategies for absolute quantitative Isotope dilution proteomics [https://pubmed.ncbi.nlm.nih.gov/19341828/]
- 106. Application of isotope ICP–MS dilution to quantitative... techniques [https://link.springer.com/article/10.1007/s00216-010-3861-y]
- 107. Recent Trends and Challenges on the Non-Targeted ... [https://pmc.ncbi.nlm.nih.gov/articles/PMC12299502/]
- 108. List of mass spectrometry software [https://en.wikipedia.org/wiki/List_of_mass_spectrometry_software]
- 109. Recent Advances in Liquid Chromatography–Mass ... [https://pmc.ncbi.nlm.nih.gov/articles/PMC12204688/]
- 110. MaxQuant [https://maxquant.org/]
- 111. Proteomic Software for Mass Spec Data Analysis [https://www.thermofisher.com/us/en/home/industrial/mass-spectrometry/proteomics-mass-spectrometry/proteomic-software-mass-spec-data-analysis.html]