Mastering Stability-Indicating HPLC Methods: A Comprehensive Guide for Drug Development Scientists
This comprehensive guide details the development, optimization, validation, and application of stability-indicating HPLC methods essential for modern drug development.
Mastering Stability-Indicating HPLC Methods: A Comprehensive Guide for Drug Development Scientists
Abstract
This comprehensive guide details the development, optimization, validation, and application of stability-indicating HPLC methods essential for modern drug development. Aimed at researchers, scientists, and pharmaceutical professionals, it covers foundational principles, advanced method development strategies, systematic troubleshooting for robust performance, and thorough validation as per ICH guidelines. By integrating current best practices and regulatory expectations, the article provides a complete workflow to ensure accurate quantification of active pharmaceutical ingredients and their degradation products throughout a drug's lifecycle.
The Pillars of Stability-Indicating HPLC: Core Principles and Regulatory Imperatives
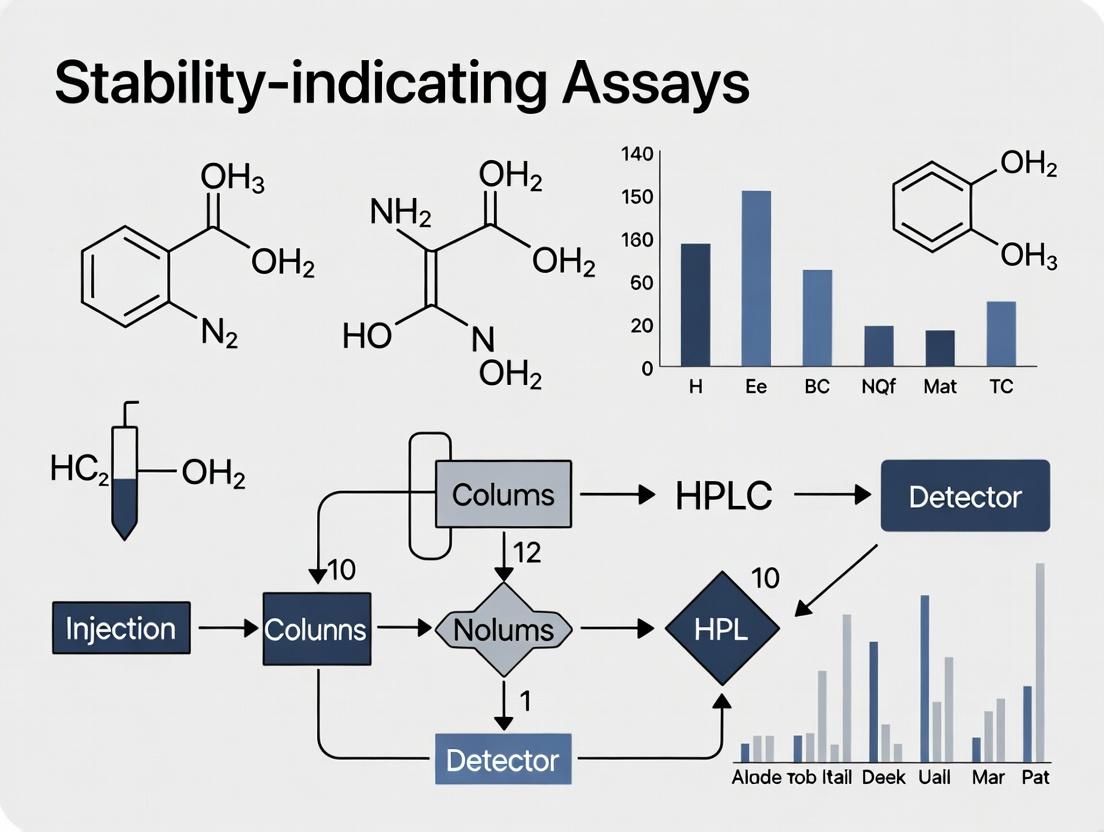
Within the broader thesis on HPLC method development for stability-indicating assays, the primary goal is to establish a method that can accurately and specifically quantify the active pharmaceutical ingredient (API) while simultaneously resolving and quantifying its degradation products. A method is deemed "stability-indicating" only if it provides unequivocal evidence that the API's assay result is unaffected by the presence of degradation products, excipients, or other potential interferents. This Application Note details the core principles and validation protocols required to achieve this designation.
Key Principles of a Stability-Indicating Method
The fundamental attribute is specificity/selectivity. The method must demonstrate that the analyte peak is pure (peak purity) and is baseline-resolved from all other peaks generated from stressed samples. The required resolution (Rs) is typically ≥ 2.0 between the API and the closest eluting degradation peak.
Forced Degradation Studies: The Core Experiment
Forced degradation (stress testing) is the cornerstone experiment to prove a method is stability-indicating. It involves intentionally degrading the drug substance or product under harsher conditions than accelerated stability protocols to generate relevant degradation products.
Experimental Protocol: Forced Degradation of Drug Substance
Objective: To generate degradation products for method specificity evaluation. Materials: API, 0.1 N HCl, 0.1 N NaOH, 3% w/v H₂O₂, solid-state heat chamber, photostability chamber. Procedure:
- Acidic Hydrolysis: Prepare a solution of API in 0.1 N HCl. Heat at 60°C for 1-8 hours (or until ~5-20% degradation). Neutralize at designated time points.
- Basic Hydrolysis: Prepare a solution of API in 0.1 N NaOH. Heat at 60°C for 1-8 hours. Neutralize.
- Oxidative Degradation: Prepare a solution of API in 3% H₂O₂. Keep at room temperature for 1-24 hours.
- Thermal Degradation: Expose solid API to dry heat (e.g., 70°C) in an oven for 1-14 days.
- Photolytic Degradation: Expose solid API and/or solution to controlled light (e.g., ICH Q1B conditions: 1.2 million lux hours of visible and 200 watt-hours/m² of UV).
- Neutral Hydrolysis/ Thermal in Solution: Heat API in water or buffer (pH 7) at elevated temperatures (e.g., 70-80°C).
- Analyze all stressed samples alongside unstressed controls using the candidate HPLC method. Target degradation of 5-20% to avoid secondary degradation.
Validation Parameters: Quantitative Data
A stability-indicating assay method must be validated per ICH Q2(R1) guidelines. Key parameters and typical acceptance criteria are summarized below:
Table 1: Key Validation Parameters & Acceptance Criteria for a Stability-Indicating Assay
| Parameter | Objective | Typical Acceptance Criteria |
|---|---|---|
| Specificity | Resolution from nearest peak | Rs ≥ 2.0 |
| Peak Purity (by PDA) | Purity angle < purity threshold | |
| Accuracy (% Recovery) | Agreement with true value | 98.0–102.0% (API) |
| Precision | Repeatability (RSD) | RSD ≤ 1.0% for API assay |
| Intermediate Precision (RSD) | RSD ≤ 2.0% for API assay | |
| Linearity | Linear response over range | Correlation coefficient (r) ≥ 0.999 |
| Range | From LOQ to 120% of test conc. | Meets accuracy & precision criteria |
| Robustness | Resilience to small changes | System suitability passes |
Table 2: Example Forced Degradation Results for "Compound X"
| Stress Condition | Time/Temp | % Degradation | API Peak Purity (PDA) | Resolution from Closest Degradant (Rs) |
|---|---|---|---|---|
| 0.1 N HCl, 60°C | 4 hours | 12.5% | Pass | 2.8 |
| 0.1 N NaOH, 60°C | 2 hours | 18.2% | Pass | 2.1 |
| 3% H₂O₂, RT | 24 hours | 8.7% | Pass | 3.5 |
| Dry Heat, 70°C | 7 days | 5.1% | Pass | N/A (no new peaks) |
| Photolysis | ICH Cond. | <2% | Pass | N/A |
Visualization of Concepts and Workflow
Title: Workflow to Achieve a Stability-Indicating HPLC Method
Title: Specificity: Separating Signal from Interference
The Scientist's Toolkit: Essential Research Reagent Solutions
Table 3: Key Reagents & Materials for Forced Degradation & Method Validation
| Item | Function / Purpose |
|---|---|
| High-Purity Reference Standards (API & known impurities) | Primary calibrant for quantification and peak identification. |
| LC-MS Grade Solvents (Acetonitrile, Methanol, Water) | Minimize baseline noise and ghost peaks for sensitive detection. |
| Buffer Salts & Ion-Pair Reagents (e.g., K₂HPO₄, TFA) | Control mobile phase pH and modulate selectivity for ionizable analytes. |
| Forced Degradation Reagents (HCl, NaOH, H₂O₂) | To induce hydrolytic and oxidative degradation for specificity studies. |
| Photo-stability Chamber (ICH Q1B compliant) | Provides controlled light exposure for photostability testing. |
| Thermal Stability Oven | Provides controlled dry-heat conditions for thermal stress testing. |
| PDA/DAD Detector | Essential for assessing peak purity and spectral homogeneity. |
| C18 or other Selective HPLC Column | The core stationary phase for achieving critical separations. |
| Mass Spectrometer (LC-MS) | For identifying unknown degradation products formed during stress studies. |
Application Notes for HPLC Stability-Indicating Method Development
Within the context of a thesis on HPLC methods for stability-indicating assays, the interplay of ICH guidelines provides the mandatory regulatory and scientific framework. These guidelines collectively ensure that analytical methods are validated, stability studies are properly designed, and analytical procedures are developed using enhanced approaches.
ICH Q1A(R2) Stability Testing of New Drug Substances and Products: This guideline mandates the core stability study design for registration. For an HPLC stability-indicating assay, it defines the stress conditions under which the method must demonstrate specificity. Key requirements include:
- Forced Degradation Studies: The method must be able to resolve the active pharmaceutical ingredient (API) from its degradation products generated under stress conditions (acid, base, oxidation, thermal, and photolytic).
- Stability Study Conditions: Defines long-term (25°C ± 2°C/60% RH ± 5%), intermediate (30°C ± 2°C/65% RH ± 5%), and accelerated (40°C ± 2°C/75% RH ± 5%) storage conditions and timepoints.
- Evaluation of Data: Sets criteria for assessing significant change and establishing retest periods/shelf lives.
ICH Q2(R2) Validation of Analytical Procedures: This revised guideline (effective 2025) provides the criteria for validating the HPLC method's performance characteristics. It explicitly links to Q14, promoting a holistic approach to method development and validation.
ICH Q14 Analytical Procedure Development: This new guideline (effective 2025) encourages the adoption of enhanced, science- and risk-based approaches for analytical procedure development. It promotes the concept of the Analytical Target Profile (ATP) and design space, facilitating more flexible regulatory post-approval change management.
The quantitative requirements for method validation as per ICH Q2(R2) are summarized below:
Table 1: Summary of Key Validation Parameters per ICH Q2(R2) for an HPLC Stability-Indicating Assay
| Validation Parameter | Objective & Acceptance Criteria (Example for Assay) |
|---|---|
| Specificity | No interference from blank, placebo, or degradation products. Resolution (Rs) ≥ 2.0 between critical pair. Peak purity tool confirmation. |
| Accuracy | Recovery of API from sample matrix: 98.0–102.0%. |
| Precision (Repeatability) | Relative Standard Deviation (RSD) of six replicate preparations: ≤ 2.0%. |
| Intermediate Precision | RSD combining variations (day, analyst, instrument): ≤ 3.0%. |
| Linearity | Correlation coefficient (r) ≥ 0.998. Visual inspection of residual plot. |
| Range | Typically 80–120% of target concentration for assay. |
| Detection Limit (LOD) | Signal-to-Noise (S/N) ratio of ≈ 3:1. |
| Quantitation Limit (LOQ) | Signal-to-Noise (S/N) ratio of ≈ 10:1. Accuracy & Precision at LOQ: RSD ≤ 5.0%, Recovery 80–120%. |
| Robustness | Method withstands deliberate variations (e.g., flow rate ±0.1 mL/min, column temp ±2°C, mobile phase pH ±0.1). All system suitability criteria met. |
Experimental Protocols
Protocol 1: Forced Degradation Studies for Specificity Demonstration
Objective: To validate that the HPLC method is stability-indicating by separating the API from all major degradation products. Materials: API, drug product placebo, proposed HPLC method reagents. Procedure:
- Acid Hydrolysis: Expose API and drug product solution to 0.1M HCl at 60°C for 1 hour. Neutralize.
- Base Hydrolysis: Expose API and drug product solution to 0.1M NaOH at 60°C for 1 hour. Neutralize.
- Oxidative Degradation: Expose API and drug product solution to 3% H₂O₂ at room temperature for 1 hour.
- Thermal Degradation: Solid API and drug product stored at 105°C for 24 hours. Prepare samples.
- Photolytic Degradation: Expose solid API and drug product to 1.2 million lux hours of visible and 200-watt hours/m² of UV light per ICH Q1B.
- Analyze all stressed samples, unstressed controls, and blanks using the proposed HPLC method.
- Assessment: Evaluate chromatograms for peak purity (using DAD) of the main peak, resolution from nearest degradation peak (Rs ≥ 2.0), and mass balance (should be 95-105%).
Protocol 2: Analytical Method Validation per ICH Q2(R2)
Objective: To comprehensively validate the performance of the HPLC assay method. Materials: Certified reference standard of API, drug product batches, validation samples at appropriate concentrations. Procedure (Abbreviated Outline):
- Specificity: Execute Protocol 1.
- Linearity & Range: Prepare standard solutions at minimum 5 concentration levels (e.g., 50%, 75%, 100%, 125%, 150% of target). Inject in triplicate. Plot mean peak area vs. concentration.
- Accuracy (Recovery): Prepare drug product samples in triplicate at 80%, 100%, and 120% of label claim by spiking known amounts of API into placebo. Compare measured vs. added amount.
- Precision:
- Repeatability: Inject six independent preparations of 100% drug product sample.
- Intermediate Precision: Repeat repeatability study on a different day, with a different analyst and HPLC system.
- LOQ/LOD Determination: Serial dilute a standard solution until S/N ≈10 (LOQ) and ≈3 (LOD). Confirm LOQ by 6 injections for precision (RSD ≤ 5%).
- Robustness: Using an experimental design (e.g., 2^3 factorial), vary critical method parameters (flow rate, column temperature, mobile phase pH) within a small, realistic range. Assess impact on resolution, tailing factor, and retention time of the API.
Signaling Pathways & Workflows
Title: ICH Guideline Integration in HPLC Method Lifecycle
Title: Forced Degradation Analysis Workflow
The Scientist's Toolkit: Research Reagent Solutions
Table 2: Essential Materials for HPLC Stability-Indicating Method Development & Validation
| Item | Function & Rationale |
|---|---|
| Certified Reference Standard | High-purity, well-characterized API used for accurate quantification, calibration, and as a benchmark in forced degradation studies. |
| Inert HPLC Columns (C18, etc.) | Columns with high peak efficiency and low metal activity to ensure optimal separation, peak shape, and reproducibility for APIs and degradants. |
| HPLC-Grade Solvents & Buffers | High-purity mobile phase components are critical for low baseline noise, consistent retention times, and avoiding spurious peaks. |
| Photodiode Array (PAD/DAD) Detector | Essential for assessing peak purity and homogeneity by comparing spectra across a peak, confirming specificity in stability samples. |
| Forced Degradation Reagents | Standardized reagents (HCl, NaOH, H₂O₂) for generating degradants under controlled stress conditions per ICH Q1A(R2). |
| Mass Spectrometry (LC-MS) | Used as an orthogonal technique to identify unknown degradation products formed during forced degradation, supporting method specificity. |
| Stability Chambers | Precision-controlled chambers that maintain specific temperature and humidity conditions for long-term and accelerated stability studies. |
| Method Validation Software | Software that facilitates design of experiments (DoE) for robustness and automates calculation of validation parameters (linearity, precision). |
Within the broader thesis on developing validated, stability-indicating HPLC methods for new chemical entities, Forced Degradation (Stress Testing) is established as the non-negotiable foundational step. It proactively challenges the analytical method by subjecting the drug substance to exaggerated stress conditions, generating degradation products that the method must subsequently resolve and quantify. This application note details the protocols and strategic approach to these studies, ensuring the developed HPLC method is specific, selective, and stability-indicating per ICH Q1A(R2) and Q2(R1) guidelines.
Core Stress Conditions and Protocols
The following table summarizes the standard stress conditions, targets, and key considerations.
Table 1: Standard Forced Degradation Conditions and Targets
| Stress Condition | Typical Parameters | Target Degradation (%) | Primary Chemical Reactions Induced | Sample Preparation & Quenching Protocol |
|---|---|---|---|---|
| Acidic Hydrolysis | 0.1-1M HCl, 40-70°C, 1-24 hours | 5-20% | Hydrolysis (e.g., amide, ester), rearrangement. | Neutralize with equivalent molarity of NaOH or dilute with mobile phase to pH ~7. |
| Basic Hydrolysis | 0.1-1M NaOH, 40-70°C, 1-24 hours | 5-20% | Hydrolysis, dehalogenation, racemization. | Neutralize with equivalent molarity of HCl or dilute with mobile phase to pH ~7. |
| Oxidative Stress | 0.1-3% H₂O₂, room temp, 1-24 hours | 5-20% | N-oxidation, S-oxidation, hydroxylation. | Dilute significantly with mobile phase. For low concentration, may use catalase. |
| Thermal Stress (Solid) | 70-105°C (dry oven), 1-7 days | 5-15% | Dehydration, pyrolysis, solid-state reactions. | Cool to room temp, dilute with appropriate solvent. |
| Thermal & Humidity (Solution) | 40-80°C, 75% RH (solution), 1-7 days | 5-15% | Hydrolysis when combined with moisture. | Analyze directly or dilute. |
| Photolytic Stress | ICH Q1B Option 2 (1.2 million lux hours, 200 W·h/m² UV) | ≤10% | Ring rearrangement, dimerization, oxidation. | Protect from light post-stress, dilute if needed. |
Detailed Experimental Protocol: Forced Degradation for Method Specificity Verification
Objective: To generate degraded samples and verify the HPLC method’s ability to separate the active pharmaceutical ingredient (API) from all major degradation products.
Materials & Equipment:
- API (Drug Substance)
- Stress reagents: HCl, NaOH, H₂O₂ (30%)
- Thermostatically controlled water bath and dry heat oven
- Photostability chamber (ICH compliant)
- pH meter
- HPLC system with PDA or DAD detector
- Analytical balance
Procedure:
- Stock Solution: Prepare a 1 mg/mL solution of the API in a suitable solvent (e.g., methanol, water, or mixture).
- Stress Application (per condition):
- Acid/Base: Aliquot 10 mL of stock solution. Add 1 mL of 1M HCl (for acid) or 1M NaOH (for base). Mix and place in a water bath at 60°C. Withdraw aliquots at 1, 3, 6, and 24 hours for analysis.
- Oxidation: Aliquot 10 mL of stock solution. Add 100 µL of 30% H₂O₂ to achieve ~0.3% final concentration. Keep at room temperature. Withdraw aliquots at 1, 3, 6, and 24 hours.
- Thermal (Solution): Place 10 mL of stock solution in a sealed vial in an oven at 70°C for 24-72 hours.
- Photolysis: Expose solid API and a solution in a transparent quartz cell to controlled light in a photostability chamber per ICH Q1B.
- Quenching: Immediately after each time point, neutralize (acid/base) or dilute (oxidation) the aliquot as per Table 1 to stop the degradation reaction.
- HPLC Analysis: Inject the stressed samples and appropriate controls (unstressed API, blank stressor) onto the candidate HPLC method.
- Data Analysis: Compare chromatograms. The method is deemed specific if:
- The API peak is pure (PDA peak purity index > 990).
- All significant degradation peaks (typically > 0.1% area) are baseline resolved from the API peak (Resolution > 2.0).
- Mass Balance is between 98.0% and 102.0% (calculated as %API + %Total Degradation Products).
The Scientist's Toolkit: Key Research Reagent Solutions
| Item | Function in Forced Degradation |
|---|---|
| High-Purity API/Placebo | Core material for stress testing; purity is critical for accurate baseline. |
| ICH-Compliant Photostability Chamber | Provides controlled, quantifiable light exposure per global guidelines. |
| PDA/DAD HPLC Detector | Enables peak purity assessment by comparing spectra across a peak. |
| LC-MS System | Identifies unknown degradation products by providing molecular mass and fragmentation patterns. |
| Controlled Humidity Oven | Precisely applies combined thermal and moisture stress. |
| Buffers & pH Adjustment Solutions | For preparing and quenching hydrolysis stress samples at specific pH. |
Workflow and Data Interpretation Logic
Forced Degradation Method Validation Logic
Key Metrics from Forced Degradation Data
Within the development of a robust, stability-indicating HPLC method for pharmaceutical analysis, a comprehensive understanding of forced degradation pathways is paramount. This application note details protocols for inducing and analyzing hydrolysis, oxidation, photolysis, and thermal stress, framing them as essential components of method validation for a broader thesis on analytical quality by design (AQbD) in stability-indicating assays.
Degradation Pathways: Mechanisms and Conditions
The following table summarizes standard, yet adjustable, stress conditions used to induce approximately 5-20% degradation of the active pharmaceutical ingredient (API), a critical range for method validation.
Table 1: Standardized Forced Degradation Conditions for Small Molecule APIs
| Pathway | Stressor Type | Typical Conditions | Target Degradation | Key Functional Groups Affected |
|---|---|---|---|---|
| Hydrolysis | Acid | 0.1 - 1.0 M HCl, 40-70°C, 1-24 hours | 10-20% | Esters, amides, lactams, lactones, epoxides |
| Base | 0.1 - 0.5 M NaOH, 40-70°C, 1-24 hours | 10-20% | Esters, amides, sulfonamides | |
| Neutral | Water, 70-80°C, 1-7 days | 5-15% | Esters, amides (pH-dependent) | |
| Oxidation | Chemical (H₂O₂) | 0.1 - 3.0% H₂O₂, 25-40°C, 1-24 hours | 5-15% | Sulfides, thiols, amines, phenols, unsaturated carbons |
| Chemical (AIBN/AAPH) | 1-10 mM radical initiator (AIBN/AAPH), 37-50°C, 1-48 hours | 5-15% | Alkanes, aldehydes, various via radical chain reaction | |
| Photolysis | UV Light (ICH Q1B) | ≥ 200 W·h/m² UVA (320-400 nm) and 1.2 million lux·h visible light, 25°C, controlled humidity | ≤ 10% | Chromophores (e.g., carbonyls, aromatics, nitro groups) |
| Cool White Fluorescent | As per ICH Option 2 | ≤ 10% | ||
| Thermal Stress | Solid-State | 70-105°C (10°C above accelerated), 25-75% RH, 1-4 weeks | 5-15% | Variety, including cyclization, polymerization, loss of hydrate |
| Solution-State | 40-70°C (pH-controlled buffer), 1-14 days | 5-15% | Hydrolysis-prone groups, oxidation (if O₂ present) |
Experimental Protocols
Protocol: Hydrolytic Stress (Acid/Base)
Objective: To induce and sample hydrolytic degradation products for HPLC method challenge.
Materials: API, 1.0 M HCl, 0.5 M NaOH, pH meter, thermostated water bath, HPLC vials, neutralization agents (e.g., 1.0 M NaOH/ HCl).
Procedure:
- Prepare separate 1 mg/mL solutions of the API in 0.1 M HCl and 0.05 M NaOH.
- Transfer aliquots into sealed vials.
- Place vials in a thermostated water bath at 60°C (±2°C).
- Withdraw samples at T=0, 1, 2, 4, 8, and 24 hours.
- Immediately neutralize each sample (e.g., acid-stressed sample with equivalent base, and vice versa) to pH 6-8.
- Dilute with mobile phase to stop degradation.
- Analyze by HPLC using the candidate stability-indicating method.
Protocol: Oxidative Stress with Hydrogen Peroxide
Objective: To generate oxidative degradation products.
Materials: API, 3% w/v H₂O₂ stock, phosphate buffer (pH 3.0, 7.0, 9.0), thermostated shaker, HPLC vials, catalase or sodium metabisulfite.
Procedure:
- Prepare a 1 mg/mL solution of API in three different buffers (pH 3, 7, and 9).
- Add 3% H₂O₂ to each solution for a final concentration of 0.3%.
- Incubate at 25°C (±2°C) on a shaker protected from light.
- Withdraw samples at T=0, 1, 3, 6, and 24 hours.
- Quench the reaction by adding a 10-fold molar excess of sodium metabisulfite relative to H₂O₂.
- Analyze immediately by HPLC.
Protocol: Photolytic Stress per ICH Q1B
Objective: To assess API photostability.
Materials: Solid API in transparent/opened containers, solution API in quartz/UV-transparent vials, photostability chamber (ICH-compliant), lux and UV radiometer, HPLC vials.
Procedure:
- Sample Preparation: Expose a thin layer (≤3mm) of solid API and a 1 mg/mL solution (in inert solvent) in suitable containers.
- Calibration: Confirm chamber delivers ICH-specified light energy (Option 1: 1.2 million lux·h visible and 200 W·h/m² UVA).
- Exposure: Place samples and dark controls (wrapped in aluminum foil) in the chamber. Expose until the required total illumination is achieved.
- Sampling: Periodically remove samples for analysis (e.g., at 25%, 50%, 100% total energy).
- Analysis: Reconstitute/dilute samples and analyze by HPLC. Compare exposed samples to dark controls.
Protocol: Thermal Stress in Solid State
Objective: To evaluate intrinsic thermal stability.
Materials: Solid API, controlled humidity oven (with RH control), desiccators, glass vials, HPLC vials.
Procedure:
- Weigh 20-50 mg of API into multiple open glass vials to create a thin layer.
- Place vials in a controlled humidity oven at 75% RH and 80°C (±2°C). Include controls at 25°C/60% RH.
- Withdraw sample vials in triplicate at predefined time points (e.g., 1, 2, 4 weeks).
- Immediately analyze samples by a suitable HPLC method (e.g., for related substances). Monitor for appearance of new peaks, loss of assay, and physical changes.
Diagrams of Degradation Pathways and Workflows
The Scientist's Toolkit
Table 2: Essential Reagents and Materials for Forced Degradation Studies
| Item/Category | Specific Examples & Specifications | Primary Function in Forced Degradation |
|---|---|---|
| Chemical Stressors | Hydrochloric Acid (HCl, 1.0 M), Sodium Hydroxide (NaOH, 0.5 M), Hydrogen Peroxide (H₂O₂, 3-30%), Azobisisobutyronitrile (AIBN) | To induce specific degradation pathways under controlled conditions. |
| Buffers & Solvents | Phosphate Buffers (pH 3.0, 7.4, 9.0), Acetonitrile (HPLC Grade), Water (HPLC Grade) | To maintain pH during stress and to prepare samples for analysis without interference. |
| Quenching Agents | Sodium Hydroxide (1M), Hydrochloric Acid (1M), Sodium Metabisulfite, Catalase | To instantly halt the degradation reaction at the precise sampling time point. |
| HPLC Columns | C18 Reverse-Phase (e.g., 150 x 4.6 mm, 2.7 µm), C8, Phenyl-Hexyl | To separate and resolve the API from its myriad of degradation products. |
| Detection Systems | Photodiode Array (PDA/DAD), Mass Spectrometer (LC-MS, Q-TOF) | For peak purity analysis (PDA) and structural elucidation of degradants (MS). |
| Controlled Environment | Thermostated Bath/Shaker (±0.5°C), Humidity Oven, ICH-Q1B Photostability Chamber | To apply precise and reproducible stress conditions (T, RH, Light). |
| Sample Handling | Amber HPLC Vials, UV-Transparent Quartz Cells, Headspace-Free Vials | To prevent unintended photodegradation or evaporation during storage/analysis. |
Within the broader thesis on HPLC method development for stability-indicating assays, establishing robust Critical Quality Attributes (CQAs) is paramount. This research focuses on three interdependent CQAs: Resolution (Rs), Peak Purity, and Specificity. These attributes collectively ensure the method can accurately detect, separate, and quantify the active pharmaceutical ingredient (API) from its degradation products and process impurities, fulfilling regulatory requirements for stability studies.
Table 1: Regulatory and Performance Thresholds for HPLC CQAs in Stability-Indicating Assays
| Critical Quality Attribute | Typical Acceptance Criteria | Regulatory Guidance Source (e.g., ICH) | Impact on Method Validation Parameter |
|---|---|---|---|
| Resolution (Rs) | Rs ≥ 2.0 between API and closest eluting impurity | ICH Q2(R1), ICH Q3B(R2) | Specificity, System Suitability |
| Peak Purity | Purity Angle < Purity Threshold (or match factor ≥ 990) | ICH Q2(R1) | Specificity, Forced Degradation Studies |
| Specificity | No interference at retention time of analyte; Confirmed via forced degradation | ICH Q2(R1), ICH Q1A(R2) | Foundation for Accuracy, Precision, Linearity |
| Signal-to-Noise (for Detection) | S/N ≥ 10 (for quantitation limit of impurities) | ICH Q2(R1) | Sensitivity, Detection Limit |
Table 2: Example Forced Degradation Study Results Demonstrating CQAs
| Stress Condition | API Degradation (%) | Resolution (Rs) vs. Closest Degradant | Peak Purity (DAD) Pass/Fail | Specificity Confirmed? |
|---|---|---|---|---|
| Acid Hydrolysis (0.1M HCl, 70°C, 1h) | 15% | 2.5 | Pass | Yes |
| Base Hydrolysis (0.1M NaOH, 70°C, 1h) | 20% | 2.1 | Pass | Yes |
| Oxidative (3% H₂O₂, 25°C, 24h) | 12% | 3.0 | Pass | Yes |
| Thermal (105°C, 24h) | 5% | 4.0 | Pass | Yes |
| Photolytic (ICH Option 1) | <2% | N/A (no new peaks) | Pass | Yes |
Detailed Experimental Protocols
Protocol 1: Determination of Resolution (Rs) and System Suitability
Objective: To empirically measure resolution between critical pair peaks and establish system suitability. Materials: See "Scientist's Toolkit" (Table 3). Procedure:
- Prepare a separation mixture containing the API and all known impurities/degradants at specification levels (e.g., 0.5% each).
- Inject the mixture onto the HPLC system using the developed stability-indicating method.
- Record the chromatogram. Measure retention times (tR) and baseline peak widths (W) for the API and the closest eluting critical peak.
- Calculate Resolution: Rs = 2(tR2 - tR1) / (W1 + W2)
- Acceptance: Rs must be ≥ 2.0 for the critical pair. This test is performed in quintuplicate during method validation to demonstrate precision.
Protocol 2: Assessment of Peak Purity using Photodiode Array (PAD/DAD) Detection
Objective: To confirm analyte peak homogeneity and detect co-eluting impurities. Procedure:
- Perform forced degradation studies on the API (see Protocol 3).
- Inject degraded samples. Acquire spectral data across the entire peak (up-slope, apex, down-slope) at appropriate sampling rates.
- Using the HPLC software purity algorithm, compare spectra across the peak.
- Interpretation: A purity angle less than the purity threshold indicates spectral homogeneity and passes purity. A failure suggests a co-eluting impurity, mandating method re-optimization.
Protocol 3: Forced Degradation Studies for Specificity Demonstration
Objective: To deliberately degrade the API and demonstrate method specificity. Procedure:
- Sample Preparation: Subject the API (in drug substance and product form) to:
- Acid/Base: Treat with 0.1-1M HCl/NaOH at 40-80°C for 1-24 hours. Neutralize.
- Oxidation: Treat with 1-30% H₂O₂ at RT-80°C for up to 24 hours.
- Thermal: Expose solid to 105°C for up to 1 week.
- Photolytic: Expose to ICH Q1B Option 1 (1.2 million lux hours, 200 W h/m²).
- Humidity: Expose to 75-90% relative humidity at 25°C.
- Analysis: Inject stressed samples using the candidate HPLC method.
- Specificity Assessment: Check for: a) Interference from blank/excipients. b) Baseline separation of all degradants (Rs ≥ 2.0). c) Mass balance (Assay + Sum of Impurities ~100%), confirming no hidden peaks.
- The method is deemed stability-indicating if it separates all degradation products and demonstrates selectivity for the analyte in the presence of matrix components.
Visualizations: Workflows and Relationships
Diagram 1: CQA-Driven HPLC Method Development Workflow
Diagram 2: Interdependence of HPLC CQAs
The Scientist's Toolkit: Research Reagent Solutions
Table 3: Essential Materials for HPLC CQA Evaluation
| Item/Category | Function in CQA Assessment | Example/Notes |
|---|---|---|
| HPLC System with DAD/PDA | Enables peak purity analysis via spectral comparison across the peak. | Agilent 1260 Infinity II DAD, Waters ACQUITY PDA. |
| Chromatography Data Software (CDS) | Calculates Rs, runs peak purity algorithms, and manages data. | Empower, Chromeleon, OpenLab. |
| Stable, High-Efficiency Column | Provides the selectivity and efficiency needed for baseline resolution. | C18 (e.g., Waters XSelect, Agilent ZORBAX), 2.1-4.6 mm ID, sub-3µm particles. |
| Ultra-Pure Mobile Phase Reagents | Minimizes baseline noise for accurate S/N and purity calculations. | LC-MS Grade water, acetonitrile, methanol. |
| Certified Reference Standards | API and impurity/degradant standards for accurate identification and Rs calculation. | USP/EP reference standards, characterized in-house materials. |
| Forced Degradation Reagents | To induce degradation for specificity studies. | HCl, NaOH, H₂O₂ (ACS grade or better). |
| Controlled Stress Chambers | For precise application of thermal, photolytic, and humidity stress. | Stability ovens, photostability chambers, humidity-controlled desiccators. |
Within the research for developing a robust, stability-indicating HPLC method, the selection of an appropriate detection system is paramount. This choice directly impacts the ability to identify, characterize, and quantify low-level degradants and impurities in pharmaceutical formulations. Ultraviolet-Diode Array Detection (UV-DAD), Mass Spectrometry (MS), and Charged Aerosol Detection (CAD) represent three pivotal technologies with complementary strengths and limitations for degradant analysis.
Detection Principles and Comparative Performance
The core operational principles of each detector dictate its applicability in stability studies.
UV-DAD measures the absorption of ultraviolet light by chromophores. It provides spectral data for peak purity assessment and tentative identification but requires the analyte to possess a suitable chromophore.
MS ionizes analyte molecules and separates them based on their mass-to-charge ratio (m/z). It offers superior selectivity, provides molecular weight and structural information, and is essential for definitive degradant identification.
CAD measures the charge on aerosolized analyte particles after nebulization and evaporation of the mobile phase. It offers near-universal, mass-dependent response independent of chemical structure, ideal for compounds with weak or no chromophores.
Table 1: Quantitative Comparison of Key Detector Characteristics
| Characteristic | UV-DAD | MS (Single Quad) | CAD |
|---|---|---|---|
| Typical Sensitivity | Low ng (∼1-10 ng) | Sub-ng to pg (∼0.1-1 ng) | Low ng (∼1-10 ng) |
| Dynamic Range | ~10³ - 10⁴ | ~10³ - 10⁴ | ~10² - 10⁴ |
| Response Uniformity | Varies greatly (ε) | Varies with ionization | Highly uniform |
| Chromophore Required | Yes | No | No |
| Peak Identification | Spectral match only | Molecular weight/fragmentation | None (quantitative only) |
| Compatibility with Gradient Elution | Excellent | Excellent | Excellent (requires baseline equilibration) |
| Approximate Cost | Low | High | Medium |
Detailed Experimental Protocols
Protocol 1: Forced Degradation Study with UV-DAD and MS Detection for Degradant Profiling
Objective: To generate and tentatively identify major degradants of an active pharmaceutical ingredient (API) under stress conditions.
Materials: API standard, stressed samples (acid, base, oxidative, thermal, photolytic), HPLC-grade solvents, 0.1% Formic Acid in water (Mobile Phase A), 0.1% Formic Acid in acetonitrile (Mobile Phase B).
Instrumentation: HPLC system coupled to a UV-DAD and a single quadrupole MS with an electrospray ionization (ESI) source.
Procedure:
- Chromatographic Separation:
- Column: C18, 150 x 4.6 mm, 3.5 µm.
- Flow Rate: 1.0 mL/min (with post-column split to MS).
- Gradient: 5% B to 95% B over 30 minutes.
- Column Temperature: 30°C.
- Injection Volume: 10 µL.
- UV-DAD: Monitor 210-400 nm; quantitate at λmax (e.g., 230 nm).
MS Detection Parameters:
- Ionization Mode: ESI positive/negative polarity switching.
- Capillary Voltage: 3.0 kV.
- Desolvation Temperature: 350°C.
- Scan Range: m/z 50-1000.
- Cone Voltage: Low (20V for molecular ion) and high (40-60V for in-source fragmentation) alternating scans.
Analysis:
- Inject blank, unstressed API, and each stressed sample.
- Compare chromatograms to identify new degradant peaks.
- Use UV-DAD spectra to assess peak purity.
- Extract ion chromatograms (EICs) from MS total ion chromatogram (TIC) for specific degradants.
- Correlate retention time, UV spectrum, and molecular ion ([M+H]+/[M-H]-) data to propose degradant structures.
Protocol 2: Quantification of Non-Chromophoric Degradants using Charged Aerosol Detection (CAD)
Objective: To accurately quantify a non-UV absorbing degradant (e.g., a sugar or aliphatic impurity) in a stability sample.
Materials: API standard, degradant reference standard (if available), placebo formulation, HPLC-grade solvents, water (Mobile Phase A), Acetonitrile (Mobile Phase B), Trifluoroacetic Acid (TFA, 0.1% v/v).
Instrumentation: HPLC system with isocratic pump, autosampler, and Corona Veo or equivalent CAD detector.
Procedure:
- Chromatographic Separation:
- Column: HILIC or reversed-phase C18 (as appropriate), 150 x 4.6 mm, 5 µm.
- Flow Rate: 1.0 mL/min.
- Mobile Phase: Isocratic or shallow gradient optimized for separating the target degradant from the API and other excipients (e.g., 85% A / 15% B for HILIC).
- Column Temperature: 30°C.
- Injection Volume: 20 µL.
CAD Parameters:
- Evaporator Temperature: 35-50°C (optimize for mobile phase).
- Data Collection Rate: 10 Hz.
- Filter Constant: Medium (e.g., 3.6 sec).
- Nebulizer: Ensure it is clean and gas supply is stable.
Calibration and Quantification:
- Prepare a series of standard solutions of the degradant across the expected range (e.g., 0.05% to 2.0% w/w relative to API).
- Inject each standard in triplicate.
- Plot peak area (or height) versus concentration. Note: CAD response is non-linear over wide ranges. Apply a power function fit (y = ax^b) or use a dual-logarithmic plot for linearization.
- Inject placebo and stability samples. Quantify the degradant peak using the established calibration curve.
Visualizing Detector Selection Logic
Diagram Title: HPLC Detector Selection Logic for Degradants
The Scientist's Toolkit: Essential Research Reagent Solutions
Table 2: Key Reagents and Materials for Degradant Analysis
| Item | Function in Analysis |
|---|---|
| Pharmaceutical Grade API & Placebo | Serves as the reference material and control for forced degradation and method development. |
| HPLC-MS Grade Solvents (ACN, MeOH, Water) | Minimizes background noise and ion suppression in UV, MS, and CAD, ensuring reproducible baselines. |
| Volatile Buffers/Additives (Ammonium Formate/Acetate, Formic Acid) | Essential for MS compatibility; they facilitate ionization and evaporate readily in the MS source and CAD nebulizer. |
| Stability-Indicating Reference Standards | Certified degradant standards are crucial for method validation, establishing relative response factors (especially for UV), and confirming identity. |
| Derivatization Reagents (e.g., DNPH, FMOC-Cl) | Can be used to introduce a chromophore or fluorophore into non-UV active degradants for enhanced detection with UV or FLD, though adding complexity. |
| Inert HPLC Vials/Inserts | Prevent leachables and adsorptive losses, critical when working with low-level degradants. |
| Post-column Splitters/Tees | Allow simultaneous connection of multiple detectors (e.g., UV to MS or CAD) for complementary data collection from a single injection. |
From Theory to Practice: A Step-by-Step Guide to Method Development and Real-World Application
1. Introduction & Thesis Context Within the broader thesis on "Advanced HPLC Method Development for Robust Stability-Indicating Assays," strategic primary screening is the critical first step. This phase systematically evaluates the fundamental variables—mobile phase pH/buffer, stationary phase chemistry, and organic gradient slope—to establish a method capable of resolving the Active Pharmaceutical Ingredient (API) from all potential degradation products generated under stress conditions (hydrolysis, oxidation, photolysis, thermal). The goal is not final optimization but the efficient identification of a promising chromatographic "starting point" with high selectivity and peak capacity.
2. Application Notes: Core Screening Strategies
2.1. Screening of Stationary Phase Chemistry Modern chromatographic column screening leverages diverse surface chemistries to exploit varied interactions with analytes. A typical screening set includes:
- Reversed-Phase C18: Standard hydrophobic interactions.
- Polar-Embedded/Phenyl: Aromatic π-π interactions and mixed-mode character.
- PFP (Pentafluorophenyl): Strong dipole-dipole and π-π interactions, excellent for isomers.
- HILIC (Hydrophilic Interaction): For very polar compounds that do not retain in standard RP.
- Chiral: For enantiomeric separations, crucial if degradation leads to chiral inversion.
Table 1: Selectivity Comparison of Different Column Chemistries for a Model API and its Degradants
| Column Chemistry | Theoretical Plates (API) | Peak Asymmetry (API) | Critical Resolution (Lowest Pair) | Remarks |
|---|---|---|---|---|
| C18 (Base Deactivated) | 12,500 | 1.05 | 2.5 | Good main peak shape, co-elution of two acidic degradants. |
| Polar-Embedded C18 | 11,800 | 1.02 | 3.1 | Improved resolution of acidic pair, retained polar degradants better. |
| Phenyl-Hexyl | 10,900 | 1.10 | 4.0 | Best separation of all five degradants; longer run time. |
| PFP | 9,500 | 1.15 | 1.8 | Poor resolution of structurally similar hydrolytic products. |
2.2. Screening of Mobile Phase pH Mobile phase pH is a dominant factor for ionizable compounds, drastically altering selectivity by modulating the ionization state of analytes and residual silanols on the stationary phase. A screening range of pH 2.5 to 8.0 is common, using volatile buffers compatible with MS-detection.
Table 2: Impact of Mobile Phase pH on Retention (k) and Resolution (Rs) of Ionizable API
| Analyte (pKa) | k at pH 2.5 | k at pH 4.5 | k at pH 7.0 | Optimal pH for Max Rs |
|---|---|---|---|---|
| API (pKa 4.2) | 5.2 (Unionized) | 3.1 (Partially Ionized) | 1.5 (Ionized) | 3.0 |
| Degradant A (Acidic, pKa 3.8) | 4.8 | 2.0 | 0.9 | 4.5 |
| Degradant B (Basic, pKa 6.0) | 2.1 | 2.5 | 3.8 | 7.5 |
| Overall Critical Resolution (Rs) | 1.2 | 2.8 | 1.5 | 3.5 (at pH 3.8) |
2.3. Gradient Slope Optimization The gradient slope (%B/min) controls the elution bandwidth and peak capacity. A shallower gradient increases resolution at the cost of time. Screening involves running gradients of different slopes (e.g., 2, 4, 6 %B/min) from a low to a high organic percentage.
Table 3: Effect of Gradient Slope on Separation Metrics (15-minute method window)
| Gradient Slope (%B/min) | Run Time (min) | Average Peak Width (min) | Minimum Peak Capacity | Peak Capacity per Minute |
|---|---|---|---|---|
| 2.0 | 20.0 | 0.18 | 111 | 5.6 |
| 4.0 | 12.5 | 0.22 | 57 | 4.6 |
| 6.0 | 9.0 | 0.28 | 32 | 3.6 |
3. Experimental Protocols
Protocol 1: High-Throughput Column & pH Screening
- Objective: Rapidly identify the best column/pH combination for separating an API mixture from its forced degradation sample.
- Materials: See "The Scientist's Toolkit" below.
- Procedure:
- Prepare stock solutions of API and stressed samples (e.g., 0.1 mg/mL in diluent).
- Prepare mobile phase buffers at pH 2.5 (e.g., Formic Acid/Ammonium Formate), pH 4.5 (Ammonium Acetate), and pH 7.0 (Ammonium Bicarbonate). Filter through 0.22 µm nylon membrane.
- Set up instrument with a column oven at 30°C and DAD detection (scanning 210-400 nm).
- Install the first column (e.g., C18). Equilibrate with 5% acetonitrile in pH 2.5 buffer.
- Program a fast, wide linear gradient: 5-95% acetonitrile in buffer over 10 minutes.
- Inject 5 µL of the stressed sample. Record chromatogram.
- Switch mobile phase to next pH buffer, re-equilibrate column for 5 min, and repeat injection.
- After all pHs are tested, switch to the next column. Re-equilibrate the new column with the first pH buffer and repeat steps 5-7.
- Analyze data for peak count, valley separation between critical pairs, and peak shape.
Protocol 2: Fine-Tuning Gradient Slope for Peak Capacity
- Objective: Optimize the gradient time to maximize resolution within a defined analysis window.
- Materials: The best column/pH combination identified in Protocol 1.
- Procedure:
- Set the final mobile phase composition to 95% organic based on the initial screening.
- Determine the approximate %B at which the first peak elutes (%Bstart) and the last peak elutes (%Bend).
- Program three initial gradient methods where the gradient span (Δ%B = %Bend - %Bstart) is delivered over 5, 10, and 15 minutes.
- Gradient Time 5min:
%Bstartto%Bendin 5 min. - Gradient Time 10min:
%Bstartto%Bendin 10 min. - Gradient Time 15min:
%Bstartto%Bendin 15 min.
- Gradient Time 5min:
- Include 5-minute initial isocratic hold at %Bstart and a 3-minute wash/re-equilibration.
- Inject the sample in triplicate using each gradient.
- Measure the peak width at half height for all peaks in each run.
- Calculate Peak Capacity (Pn) for each gradient: Pn = 1 + (tG / w), where tG is gradient time and w is the average peak width.
- Select the gradient slope offering the best compromise between Pn and total run time.
4. The Scientist's Toolkit: Key Research Reagent Solutions
| Item | Function / Rationale |
|---|---|
| Core Column Screening Kit | A set of 50 x 3.0 mm, 2.7 µm superficially porous particle columns with different chemistries (C18, phenyl, PFP, etc.) for fast, high-resolution screening with low solvent consumption. |
| MS-Compatible Buffer Kit | Pre-mixed, certified buffers (e.g., ammonium formate, acetate, bicarbonate) at various pH values, ensuring reproducibility and direct LC-MS compatibility. |
| Forced Degradation Sample | A mixture of the API subjected to ICH-prescribed stress conditions (acid, base, peroxide, heat, light) to generate a representative set of degradation products for separation challenge. |
| Diode Array Detector (DAD) | Essential for peak purity assessment by comparing UV spectra across a peak, confirming co-elution is not present in the chosen screening conditions. |
| Automated Method Scouting Software | Software that controls the LC system to automatically execute a predefined sequence of column and mobile phase changes, drastically increasing screening efficiency. |
5. Visualization of Strategic Screening Workflow
Title: HPLC Strategic Screening Decision Workflow
Title: Key Variable Interactions in HPLC Method Screening
Within the broader thesis of HPLC method development for stability-indicating assays, achieving critical resolution of complex degradation profiles is paramount. A stability-indicating assay must accurately quantify the active pharmaceutical ingredient (API) while resolving and quantifying all potential degradation products, impurities, and excipient interferences. Modern drug molecules, including biologics, stereoisomers, and complex natural products, generate intricate degradation profiles under stress conditions (thermal, photolytic, hydrolytic, oxidative). This application note details advanced chromatographic strategies to deconvolute these profiles, ensuring method specificity, robustness, and regulatory compliance (ICH Q1A(R2), Q3B(R2)).
Table 1: Summary of Core Separation Strategies and Their Applications
| Strategy | Key Principle | Optimal Use Case | Typical Gain in Resolution (Rs)* | Critical Parameters |
|---|---|---|---|---|
| Mixed-Mode Chromatography | Combines two or more primary interactions (e.g., ion-exchange + reversed-phase). | Charged analytes with similar hydrophobicity; polar degradants. | 1.5 - 3.0 | Stationary phase chemistry, pH, ionic strength, organic modifier. |
| Ultra-High Pressure (UPLC) | Uses sub-2µm particles at high pressure (>15,000 psi). | General complex mixture with narrow peaks; high-throughput stability studies. | 30-50% increase in peak capacity vs. HPLC | Column backpressure, system dispersion, detector sampling rate. |
| Superficially Porous Particles (SPP) | Uses particles with solid core and porous shell (~2.7µm). | High efficiency with lower backpressure than sub-2µm particles. | Comparable to UPLC at lower pressure | Core size, shell thickness, particle size distribution. |
| Advanced Gradient Optimization | Multi-segment, non-linear gradients guided by software modeling. | Profiles with clusters of peaks eluting in a narrow window. | 0.5 - 2.0 (for critical pairs) | Initial/final %B, gradient time, shape (linear, concave, convex). |
| Two-Dimensional LC (2D-LC) | Orthogonal separations coupled via valve interface. | Extremely complex samples (e.g., biologics, herbal extracts). | Peak Capacity: 1D: ~100; 2D: ~1000 | Orthogonality, modulation time, compatibility of mobile phases. |
| Temperature Gradient | Programmed column temperature changes during the run. | Separations where selectivity changes markedly with temperature. | 0.5 - 1.5 | Temperature range, rate of change, combined with solvent gradient. |
*Rs values are indicative and depend on the specific critical pair being separated.
Detailed Experimental Protocols
Protocol 3.1: Method Development using Mixed-Mode Chromatography for Ionic Degradants
Objective: To separate an API from its basic and acidic degradation products formed under hydrolytic stress.
Materials:
- Column: Mixed-mode reversed-phase/strong cation exchange (RP/SCX), 150 x 4.6 mm, 3.5 µm.
- Mobile Phase A: 20 mM Ammonium formate buffer, pH 3.0.
- Mobile Phase B: Acetonitrile.
- Sample: API stressed in 0.1M HCl and 0.1M NaOH at 60°C for 24 hours, neutralized.
Procedure:
- Prepare the sample at ~1 mg/mL in a mixture of mobile phases A and B (50:50).
- Set column temperature to 35°C.
- Employ a gradient: 10% B to 60% B over 25 minutes.
- Adjust pH of Mobile Phase A in increments of 0.5 units between 2.5 and 4.5 to maximize separation of ionic species.
- Modify ionic strength by testing buffer concentrations from 10 mM to 50 mM.
- After optimal pH/ionic strength is found, fine-tune gradient slope (e.g., 15% B to 55% B over 30 min) for critical pairs.
- Validate method specificity by injecting individual stress samples (acid, base, oxidative, thermal).
Protocol 3.2: Implementing a Multi-Segment Gradient via Modeling Software
Objective: To optimize separation of a cluster of five co-eluting degradants using predictive modeling.
Materials:
- Column: C18, 100 x 3.0 mm, 1.7 µm.
- Software: HPLC modeling software (e.g., DryLab, ACD/LC Simulator).
- Samples: API degraded under photolytic stress.
Procedure:
- Run two initial linear gradient scouting runs: a) 5-50% B in 20 min, b) 5-50% B in 60 min. Hold all other factors (T, pH) constant.
- Input retention times of key peaks from the two runs into the modeling software.
- Generate a resolution map (Rs vs. gradient time and start/end %B) to identify the region of maximum separation.
- The software may suggest a multi-segment gradient (e.g., 15% B to 22% B in 10 min, hold at 22% B for 5 min, then 22% B to 45% B in 15 min).
- Program the suggested gradient into the HPLC system.
- Execute the run and compare experimental results with the model prediction. Iterate if necessary.
Protocol 3.3: Comprehensive 2D-LC Setup for Biologic Degradation Analysis
Objective: To characterize high-molecular-weight aggregates and fragments of a monoclonal antibody (mAb) under thermal stress.
Materials:
- 1D Column: Size-exclusion chromatography (SEC) column, 300 x 7.8 mm, 5 µm.
- 2D Column: Reversed-phase (C4 or diphenyl), 50 x 4.6 mm, 1.8 µm.
- Instrumentation: 2D-LC system with a dual-loop interface (e.g., 2x 100 µL).
- Mobile Phase 1D: 100 mM Sodium phosphate, 150 mM NaCl, pH 7.0.
- Mobile Phase 2D A: 0.1% TFA in Water.
- Mobile Phase 2D B: 0.1% TFA in Acetonitrile.
Procedure:
- 1D Separation (SEC): Isocratic run at 0.5 mL/min. The SEC separates mAb monomers, aggregates, and fragments based on size.
- Heart-Cutting: Configure the switching valve to transfer the eluent containing the monomer peak (or aggregate peak) from the 1D to the storage loops over a defined time window (e.g., 1 minute).
- 2D Separation (RP): After transfer, switch the valve to place the loops in-line with the 2D mobile phase flow. Apply a fast gradient from 20% B to 80% B in 5 minutes at 1.5 mL/min. This separates variants (e.g., deamidated, oxidized) within the monomer population.
- Data Analysis: Use 2D-specific software to generate contour plots (1D retention time vs. 2D retention time vs. signal intensity).
The Scientist's Toolkit: Key Research Reagent Solutions
Table 2: Essential Materials for Separating Complex Degradation Profiles
| Item | Function & Rationale |
|---|---|
| Mixed-Mode HPLC Columns | Provide orthogonal retention mechanisms (e.g., RP/IEX, HILIC/IEX) in a single column to resolve analytes differing in both hydrophobicity and charge. |
| Superficially Porous Particle (SPP) Columns | Offer high efficiency similar to sub-2µm UPLC particles but with lower backpressure, compatible with conventional HPLC systems. |
| High-Purity, MS-Compatible Buffers | Ammonium formate, ammonium acetate, and volatile acids/bases enable seamless coupling to MS for degradant identification without signal suppression or source contamination. |
| Stationary Phase Selectivity Kits | Sets of columns with different chemistries (C18, phenyl, polar-embedded, cyano, HILIC) for systematic selectivity screening during method development. |
| QbD/Method Development Software | Predictive modeling software (e.g., DryLab, Fusion, Chromeleon) uses minimal initial experimental data to model and optimize gradient, temperature, and pH parameters. |
| Automated Forced Degradation Systems | Instruments that apply precise, controlled stress conditions (temperature, light, humidity) to multiple samples in parallel, improving study reproducibility and throughput. |
| Diode Array Detector (DAD) with 3D Spectral Data | Provides UV spectra for every point on the chromatogram, enabling peak purity assessment and preliminary identification of degradants via spectral comparison. |
Visualization of Key Workflows
Title: Degradation Profile Separation Strategy Workflow
Title: Comprehensive 2D-LC Heart-Cutting Setup
Within the broader thesis research on developing robust, stability-indicating HPLC methods for pharmaceutical analysis, peak purity assessment is a critical validation step. A stability-indicating assay must unequivocally demonstrate that the method can accurately quantify the active pharmaceutical ingredient (API) in the presence of its degradation products and impurities. Reliable peak purity assessment, leveraging orthogonal detection tools like PDA and Mass Spectrometry (MS), is foundational to proving method specificity and ensuring drug safety and efficacy throughout its shelf life.
Application Notes: Principles and Data Interpretation
Photodiode Array (PDA) Detector for Peak Purity
PDA detectors assess purity by collecting full UV-Vis spectra across a chromatographic peak. The fundamental principle is that a spectrally homogeneous (pure) peak will have identical normalized spectra at its upslope, apex, and downslope.
Key Purity Algorithms:
- Spectral Contrast/Similarity: Compares spectra using algorithms like the Pearson correlation coefficient or the angle between spectral vectors. A match factor > 995 (on a 0-1000 scale) often indicates purity.
- Threshold Absorbance Ratio: Monitors the ratio of absorbances at two selected wavelengths across the peak. A constant ratio suggests a single component.
Limitations: PDA cannot detect co-eluting impurities with identical or highly similar UV spectra to the API. It is also less sensitive to low-level impurities.
Mass Spectrometry (MS) Detector for Peak Purity
MS provides orthogonal purity assessment based on mass-to-charge ratio (m/z). It is highly specific and sensitive, capable of detecting co-eluting species with different molecular masses, even in the absence of a chromophore.
Key Approaches:
- Extracted Ion Chromatograms (XICs): Monitoring ions specific to the API and potential impurities.
- Mass Spectral Deconvolution: Algorithms (e.g., AMDIS) can deconvolve overlapping spectra to reveal individual components.
- Tandem MS (MS/MS): Provides fragmentation fingerprints for definitive identification of impurities.
Table 1: Comparative Analysis of PDA and MS for Peak Purity Assessment
| Parameter | Photodiode Array (PDA) | Mass Spectrometry (MS) |
|---|---|---|
| Basis of Discrimination | UV-Vis Spectral Profile | Mass-to-Charge Ratio (m/z) & Fragmentation Pattern |
| Sensitivity | Moderate (µg/mL range) | High (ng-pg/mL range) |
| Specificity | Low for spectrally similar impurities | Very High |
| Quantification Capability | Excellent, directly proportional to concentration | Requires careful calibration; response varies by compound |
| Compatibility with Mobile Phase | Compatible with non-volatile buffers (phosphate, etc.) | Requires volatile buffers (ammonium formate/acetate, TFA) |
| Primary Use Case | First-line purity check, method development, routine analysis | Confirmatory analysis, identification of unknown impurities |
| Approximate Cost | Low to Moderate | High |
| Critical Output Metric | Purity Angle / Purity Threshold (or Spectral Match Factor) | Ion Ratios, Deconvoluted Spectra, Clean XICs |
Table 2: Representative Purity Assessment Data from a Forced Degradation Study of Drug X
| Sample | Retention Time (min) | PDA Spectral Match (vs Std) | PDA Purity Flag | MS Detected m/z (API = 325.2) | MS Purity Assessment |
|---|---|---|---|---|---|
| Standard | 10.22 | 1000 | Pure | 325.2 [M+H]+ | Pure |
| Acid Degradation | 10.20 | 987 | Impure | 325.2, 281.1, 307.1 | Co-elution of API (m/z 325.2) and Degradant A (m/z 281.1) |
| Oxidative Stress | 9.85, 10.25 | 999 (Peak 2) | Pure (Peak 2) | 325.2 (Peak 2), 341.2 (Peak 1) | Peak 2 is pure API; Peak 1 is oxidant (m/z 341.2) |
| Thermal Stress | 10.21 | 998 | Pure | 325.2 | Pure |
Experimental Protocols
Protocol 1: Peak Purity Assessment Using HPLC-PDA
Objective: To determine the spectral homogeneity of the main API peak in a stability sample.
Materials: HPLC system with PDA detector, chromatographic data system (CDS) with purity analysis software (e.g., Empower, Chromeleon), reference standard, stressed sample.
Procedure:
- Chromatographic Separation: Inject the sample using the developed stability-indicating method. Ensure adequate peak separation (resolution > 2.0 between the API and closest eluting peak).
- Spectral Acquisition: Set the PDA to acquire spectra from 210 nm to 400 nm (or a relevant range) at a rate of ≥ 10 spectra/second across the peak of interest.
- Peak Selection: In the CDS software, select the API peak.
- Purity Analysis: Initiate the peak purity algorithm.
- The software compares normalized spectra from multiple points (start, apex, end) across the peak.
- It calculates a purity angle (the spectral difference) and a purity threshold (the noise level).
- Interpretation: If the purity angle is less than the purity threshold, the peak is considered spectrally homogeneous (pure). If the purity angle exceeds the threshold, the peak is flagged as impure.
Protocol 2: Confirmatory Peak Purity Assessment Using LC-MS
Objective: To confirm peak purity and identify co-eluting impurities detected or suspected by PDA.
Materials: LC-MS system (Single Quadrupole or Q-TOF), volatile mobile phases (e.g., 0.1% formic acid), syringe pump for direct infusion, CDS and MS data acquisition software.
Procedure:
- Method Transfer: Adapt the HPLC method for MS compatibility. Replace non-volatile salts with volatile alternatives (e.g., ammonium formate instead of phosphate buffer). Adjust flow rate for the MS interface if necessary.
- MS Tuning & Calibration: Calibrate the mass spectrometer according to the manufacturer's protocol using the appropriate tuning mix.
- Data Acquisition: Inject the sample using the LC-MS method. Acquire data in:
- Full Scan Mode (m/z 50-1000): To detect all ionizable components.
- Selected Ion Monitoring (SIM): For targeted monitoring of the API's [M+H]+ ion and expected impurity ions.
- Data Analysis:
- Extracted Ion Chromatogram (XIC): Extract the ion chromatogram for the exact m/z of the API. A symmetric Gaussian peak suggests purity. Asymmetry or shoulders suggest co-elution.
- Spectral Examination: Inspect the averaged mass spectrum at the peak's apex, upslope, and downslope. The presence of significant ions not belonging to the API's isotopic pattern indicates an impurity.
- Deconvolution: Apply spectral deconvolution software to resolve overlapping mass spectra of co-eluting species.
Visualizations
Title: PDA Peak Purity Assessment Workflow
Title: Orthogonal Peak Purity Strategy
The Scientist's Toolkit
Table 3: Essential Research Reagent Solutions & Materials
| Item | Function / Explanation |
|---|---|
| Reference Standard (API) | Highly characterized substance used to establish retention time and spectral/mass identity for purity comparison. |
| Forced Degradation Samples | Samples of API subjected to stress conditions (acid, base, oxidation, heat, light) to generate impurities for method validation and purity assessment. |
| Volatile Buffers | Ammonium formate, ammonium acetate, or formic acid/acetic acid solutions. Essential for MS compatibility to prevent ion source contamination and signal suppression. |
| Mass Calibration Standard | A solution of known compounds (e.g., sodium trifluoroacetate clusters) used to calibrate the m/z axis of the mass spectrometer, ensuring accurate mass measurement. |
| PDA Wavelength Standard | A solution (e.g., holmium oxide or caffeine) used to verify the wavelength accuracy of the photodiode array detector. |
| HPLC-Quality Water & Solvents | Milli-Q water, LC-MS grade acetonitrile, and methanol. Minimizes background noise, ghost peaks, and MS baseline interference. |
| Syringe Pump & Infusion Needle | For direct infusion of standards into the MS ion source for tuning, optimization, and fragmentation studies without the LC column. |
| Spectral/Chromatographic Library | A digital library containing UV spectra and/or mass spectra of known impurities and degradation products for automated matching and identification. |
Developing Robust Methods for Long-Term Stability Studies and QC Release Testing
Within the broader thesis on HPLC method development for stability-indicating assays, this application note addresses the critical need for robust analytical methods that can withstand the rigors of long-term stability studies and quality control (QC) release testing. A stability-indicating method must accurately quantify the active pharmaceutical ingredient (API) and simultaneously resolve it from all potential degradation products formed under various stress conditions. This note provides updated protocols and best practices to ensure method robustness, transferability, and regulatory compliance in a modern pharmaceutical development context.
Key Principles and Regulatory Framework
Current regulatory guidance (ICH Q1A(R2), Q2(R1), and Q14) emphasizes science- and risk-based approaches. A robust method must demonstrate specificity, accuracy, precision, linearity, range, and robustness. Recent industry trends focus on implementing analytical quality by design (AQbD) principles to define the method operable design region (MODR) and ensure performance throughout the method lifecycle.
Application Notes & Protocols
Protocol: Forced Degradation Studies to Establish Method Specificity
Objective: To deliberately degrade the drug substance and demonstrate that the analytical procedure can accurately measure the analyte of interest without interference from degradation products. Materials: API, relevant stress agents (e.g., 0.1N HCl, 0.1N NaOH, 3% H₂O₂, solid-state heat, light per ICH Q1B). Procedure:
- Acid/Base Hydrolysis: Prepare separate solutions of the API (~1 mg/mL). Add equal volumes of 0.1N HCl or 0.1N NaOH. Heat at 60°C for 1-8 hours. Neutralize at appropriate time points.
- Oxidative Degradation: Add 30% v/v of 3% H₂O₂ to the API solution. Allow to stand at room temperature for 24 hours.
- Thermal Degradation (Solid): Expose solid API to 70°C in a controlled oven for up to 2 weeks.
- Photolytic Degradation: Expose solid API and solution to a validated light source providing >1.2 million lux hours of visible and 200 watt-hours/m² of UV energy.
- Analysis: Inject stressed samples onto the HPLC system. Compare chromatograms to unstressed controls. Assess peak purity using a photodiode array (PDA) detector. Success Criteria: Mass balance of 98-102%. Peak purity index >990 for the main peak. Clear separation of all degradation peaks from the main peak.
Protocol: Determination of Method Robustness via a Plackett-Burman Design
Objective: To evaluate the method's resilience to small, deliberate variations in critical method parameters (CMPs). Materials: HPLC system with PDA detector, reference standard, placebo, and samples. Procedure:
- Identify CMPs: Based on risk assessment (e.g., mobile phase pH ±0.2 units, column temperature ±3°C, flow rate ±10%, gradient time ±5%, detection wavelength ±2 nm).
- Design Experiment: Set up a 12-run Plackett-Burman design matrix to screen the effects of up to 11 parameters.
- Execute Runs: Perform HPLC analysis per the experimental matrix.
- Analyze Responses: Record key system suitability parameters: resolution (Rs) to closest eluting peak, tailing factor (T), theoretical plates (N), and % assay.
- Statistical Analysis: Use ANOVA to identify parameters with statistically significant (p < 0.05) effects on critical responses. Success Criteria: All system suitability criteria are met across all experimental runs. No single parameter variation causes the method to fall outside predefined acceptance limits.
Protocol: Long-Term Stability Study Sample Analysis & Trend Assessment
Objective: To provide a standardized procedure for the consistent analysis of stability samples and evaluation of stability trends. Materials: Stability samples stored under ICH conditions (25°C/60%RH, 30°C/65%RH, 5°C ± 3°C), validated HPLC method, bracketing reference standards. Procedure:
- Schedule: Analyze samples at predefined time points (0, 3, 6, 9, 12, 18, 24, 36 months).
- System Suitability: Perform before each analytical session. Criteria must be met.
- Sample Analysis: Analyze samples in a bracketed sequence: standard, placebo, sample-1, sample-2, ..., mid-standard, ... last sample, standard.
- Data Calculation: Calculate % assay and degradation product levels relative to time zero.
- Trend Analysis: Plot data over time. Use statistical tools (e.g., linear regression, 95% confidence intervals) to assess if any significant trends indicate instability. Success Criteria: Consistent system suitability performance. Stability data is precise, accurate, and enables reliable shelf-life estimation.
Data Presentation
Table 1: Summary of Forced Degradation Results for API-X
| Stress Condition | Duration | API Assay Remaining (%) | Total Degradation Products (%) | Mass Balance (%) | Key Observation |
|---|---|---|---|---|---|
| Control (Unstressed) | N/A | 100.0 | 0.15 | 100.2 | Baseline |
| Acid (0.1N HCl, 60°C) | 8 hours | 85.2 | 14.9 | 100.1 | Two major degradants (DP-1, DP-2) formed. |
| Base (0.1N NaOH, 60°C) | 6 hours | 72.5 | 27.8 | 100.3 | Three major degradants (DP-3, DP-4, DP-5). |
| Oxidation (3% H₂O₂) | 24 hours | 90.1 | 9.5 | 99.6 | One major degradant (DP-6). |
| Heat (Solid, 70°C) | 14 days | 98.5 | 1.3 | 99.8 | Minimal degradation. |
| Light (ICH) | As per guideline | 99.8 | 0.4 | 100.2 | Photostable. |
Table 2: Robustness Screening (Plackett-Burman) Key Results for API-X HPLC Method
| Varied Parameter | Low Level (-) | High Level (+) | Effect on Resolution (Rs)* | Effect on Tailing Factor (T)* | Statistically Significant (p<0.05)? |
|---|---|---|---|---|---|
| Mobile Phase pH | 2.8 | 3.2 | +0.5 | -0.05 | No |
| Column Temp (°C) | 27 | 33 | -0.2 | +0.01 | No |
| Flow Rate (mL/min) | 0.9 | 1.1 | -0.8 | +0.10 | Yes (for Rs) |
| Gradient Time (min) | 17.1 | 18.9 | +1.2 | -0.03 | Yes (for Rs) |
| Wavelength (nm) | 228 | 232 | 0.0 | 0.0 | No |
*Reported effect is the change in the response when moving from the low to the high level of the parameter.
Visualizations
Title: Lifecycle of a Robust Stability-Indicating HPLC Method
Title: Stability Study Sample Analysis Workflow
The Scientist's Toolkit: Research Reagent & Material Solutions
Table 3: Essential Materials for Robust Stability-Indicating Method Development
| Item | Function/Benefit |
|---|---|
| High-Purity HPLC Grade Solvents (Acetonitrile, Methanol, Water) | Minimize baseline noise and ghost peaks, ensuring accurate integration of low-level degradants. |
| Buffering Salts & pH Adjusters (e.g., Potassium Phosphate, Trifluoroacetic Acid, Ammonium Formate) | Provide consistent mobile phase pH, critical for reproducibility of retention and separation. |
| Pharmaceutical Reference Standards (API and Known Degradation Products) | Essential for method development, specificity confirmation, and quantitation. |
| Validated Degradation Reagents (e.g., 1N HCl, 1N NaOH, 30% H₂O₂) | For performing controlled forced degradation studies. |
| Stable, Low-Dispersion HPLC System with PDA and/or MS Detectors | PDA ensures peak purity assessment; MS aids in identifying unknown degradants. |
| Columns from Multiple Batches & Suppliers (e.g., C18, phenyl, polar-embedded) | For robustness testing and ensuring method is not sensitive to minor column variations. |
| Quality Placebo Formulation | To confirm the absence of excipient interference in the assay. |
| Controlled Stability Chambers (meeting ICH storage conditions) | For generating real-time and accelerated stability samples under defined conditions. |
| Electronic Laboratory Notebook (ELN) & Chromatography Data System (CDS) | Ensures data integrity, traceability, and compliant archival of all experimental results. |
Within the thesis on HPLC method development for stability-indicating assays, method transfer is the critical process that validates the method's robustness and suitability for its intended use beyond the developmental (R&D) laboratory. A stability-indicating method must not only separate degradants from the active pharmaceutical ingredient (API) but also perform consistently when executed in a Quality Control (QC) laboratory or at a contract research organization (CRO). This document outlines the application notes and standardized protocols to ensure a seamless, documented, and successful analytical method transfer, a prerequisite for regulatory filings and commercial drug product release.
Key Pre-Transfer Prerequisites
A successful transfer begins before any experimental work. The following must be established and agreed upon by both the transferring (Sending Unit, SU) and receiving (Receiving Unit, RU) laboratories in a formal Transfer Plan.
- Analytical Method Validation Report (SU): Complete ICH Q2(R1) validation for specificity, accuracy, precision, linearity, range, detection/quantitation limits, and robustness.
- System Suitability Test (SST) Criteria: Defined, justified acceptance limits for key parameters (e.g., tailing factor, theoretical plates, %RSD of replicate injections, resolution from critical pair).
- Formalized, Detailed Procedure: A single, unambiguous version of the analytical method, including detailed instructions for sample/standard preparation, column specifications, instrument settings, and mobile phase preparation.
- Transfer Plan Document: Defines scope, responsibilities, acceptance criteria, protocol, and timeline. Signed by both parties.
- Instrument/Column Discrepancy Management: Strategy for managing differences in instrument models (e.g., dwell volume differences) or column batches between sites.
Core Transfer Protocols & Experimental Design
The following protocols detail the standard experiments for analytical method transfer.
Protocol 1: System Suitability & Comparative Testing
Objective: To demonstrate that the RU can perform the method meeting all predefined SST criteria and obtain results statistically equivalent to the SU. Detailed Methodology:
- Preparation: SU provides validated reference standard, placebo, and homogeneous batch of drug product/API to RU. Both labs use the same lot of critical reagents.
- System Qualification: RU performs SST on their HPLC system as per the method. Must pass before proceeding.
- Sample Analysis: Both SU and RU analyze a minimum of six sample preparations (e.g., assay of API at 100% label claim) from the same batch, on three different days, using two analysts if applicable.
- Data Analysis: Compare the mean, standard deviation (SD), and relative standard deviation (RSD) of results between laboratories.
Acceptance Criteria: The means of the two laboratories should not show a statistically significant difference (e.g., using a t-test at 95% confidence interval). The intermediate precision (between-lab RSD) should meet or exceed the method validation data.
Protocol 2: Robustness Testing under Modified Conditions
Objective: To confirm the method's reliability in the RU when minor, deliberate variations are introduced (as per ICH Q14 guidelines). Detailed Methodology:
- Define Variations: Based on prior risk assessment, select 3-5 critical method parameters (e.g., mobile phase pH ±0.1 units, column temperature ±2°C, flow rate ±5%, wavelength ±2 nm).
- Design of Experiments (DoE): Use a fractional factorial design to efficiently evaluate the effects of multiple parameters.
- Execution: RU performs analyses using a standard and a sample at the edge of each varied condition, while maintaining other parameters as specified.
- Evaluation: Monitor the impact on critical attributes: resolution of the API from the nearest degradant, tailing factor, and retention time.
Acceptance Criteria: All SST criteria must be met under all modified conditions. Resolution of the API from the critical degradant must remain >2.0.
Data Presentation
Table 1: Summary of Typical Acceptance Criteria for HPLC Method Transfer
| Test Parameter | Protocol | Typical Acceptance Criteria | Statistical Tool |
|---|---|---|---|
| System Suitability | All | As per validated method document (e.g., RSD ≤1.0% for 5 injections) | Descriptive Statistics |
| Comparative Assay | Protocol 1 | No significant difference between SU and RU means (p > 0.05). Between-lab RSD ≤2.0%. | Two-sample t-test, F-test |
| Intermediate Precision | Protocol 1 | Overall RSD ≤2.0% (for assay) across both labs, analysts, and days. | ANOVA |
| Specificity/Resolution | Protocol 2 | Resolution between API and critical degradant >2.0 under all robustness conditions. | Chromatographic Analysis |
Table 2: Example Reagent Solutions for HPLC Method Transfer
| Research Reagent Solution / Material | Function & Criticality |
|---|---|
| Phosphoric Acid / Trifluoroacetic Acid (TFA) | Mobile phase modifier to control pH and ion suppression for optimal peak shape (High). |
| HPLC-Grade Acetonitrile & Methanol | Primary organic modifiers for reverse-phase chromatography; purity is critical for baseline stability (High). |
| USP/EP Reference Standard | Authentic, highly purified material used as the primary standard for quantitation (Critical). |
| Validated HPLC Column (C18, specified lot) | Stationary phase; exact chemistry and lot consistency are vital for reproducibility (Critical). |
| Placebo Mixture | Contains all excipients without API; essential for demonstrating specificity of the stability-indicating method (High). |
| Forced Degradation Samples | Stressed samples (acid, base, oxidative, thermal, photolytic) used to verify method specificity during transfer (High). |
Visualized Workflows & Relationships
Method Transfer High-Level Process Flow
Comparative Testing Detailed Workflow
This application note supports a thesis on advancing HPLC method development for stability-indicating assays. The core thesis posits that a systematic, risk-based chromatographic screening strategy, tailored to molecular complexity, is critical for achieving robust methods that resolve degradation products from the active ingredient. The following case studies demonstrate this principle across three critical drug substance modalities.
Case Study 1: Small Molecule API – Forced Degradation and Method Screening
Objective: To develop a stability-indicating RP-HPLC method for a small molecule kinase inhibitor (MW ~450 Da) by identifying optimal chromatographic conditions through a structured screening protocol.
Protocol: Forced Degradation Sample Preparation
- Acidic Hydrolysis: Prepare a 1 mg/mL solution of the API in 0.1 N HCl. Heat at 60°C for 8 hours. Neutralize with 0.1 N NaOH.
- Basic Hydrolysis: Prepare a 1 mg/mL solution in 0.1 N NaOH. Heat at 60°C for 8 hours. Neutralize with 0.1 N HCl.
- Oxidative Stress: Prepare a 1 mg/mL solution in 3% H₂O₂. Store at room temperature for 24 hours.
- Thermal Stress: Expose solid API to dry heat at 105°C for 168 hours.
- Photolytic Stress: Expose solid API to ~1.2 million lux hours of visible and 200-watt hour/m² of UV light per ICH Q1B.
- Control: Prepare an unstressed solution in diluent (50:50 v/v Acetonitrile:Water).
Protocol: Chromatographic Screening Workflow
- Column Screening: Inject degraded samples onto three different columns: C18 (polar-embedded), Phenyl-Hexyl, and HILIC.
- Mobile Phase Screening: Test two pH conditions (pH 3.0 ammonium formate buffer and pH 10.0 ammonium bicarbonate buffer) with acetonitrile and methanol as organic modifiers.
- Gradient Elution: Use a linear gradient from 5% to 95% organic over 25 minutes at a flow rate of 1.0 mL/min. Detection: UV at 254 nm.
- Analysis: Evaluate chromatograms for peak purity (using PDA), resolution of degradation peaks, and overall peak shape. Select the condition yielding the highest peak count and resolution (Rs > 2.0 between main peak and nearest degradant).
Results Summary: Table 1: Forced Degradation Results for Small Molecule API
| Stress Condition | Main Peak Purity Angle (Threshold) | Number of Degradation Peaks > 0.1% | Principal Degradation Pathway |
|---|---|---|---|
| Acidic Hydrolysis | 0.215 (0.278) | 3 | Ester hydrolysis |
| Basic Hydrolysis | 0.421 (0.278) | 5 | Amide hydrolysis |
| Oxidative Stress | 0.198 (0.278) | 2 | Sulfoxide formation |
| Thermal Solid | 0.110 (0.278) | 1 | Dehydration |
| Photolytic Solid | 0.105 (0.278) | 0 | Stable |
| Control | 0.089 (0.278) | 0 | N/A |
Table 2: Chromatographic Screening Results (Optimal Conditions Identified)
| Screening Parameter | Condition A (C18, pH 3) | Condition B (Phenyl, pH 3) | Condition C (C18, pH 10) |
|---|---|---|---|
| Total Degradants Resolved | 8 | 9 | 11 |
| Critical Pair Resolution (Rs) | 1.5 | 1.8 | 2.3 |
| Tailing Factor (API Peak) | 1.2 | 1.1 | 1.0 |
| Selected for Development | No | No | Yes |
Title: Small Molecule Method Development Screening Workflow
Case Study 2: Biologic – mAb Aggregation and Size Variant Analysis
Objective: To develop a SEC-HPLC method for quantifying high-molecular-weight (HMW) aggregates and low-molecular-weight (LMW) fragments in a monoclonal antibody (mAb) under thermal stress.
Protocol: Sample Stress and SEC-HPLC Analysis
- Stress Induction: Incubate mAb formulation (10 mg/mL) at 40°C for 4 weeks. Withdraw aliquots at 0, 1, 2, and 4 weeks.
- SEC-HPLC Method:
- Column: USP L21 (e.g., 300 mm x 7.8 mm, 1.7-5 µm silica-based SEC column).
- Mobile Phase: 100 mM Sodium Phosphate, 150 mM NaCl, pH 6.8, 0.02% NaN₃.
- Isocratic Elution: Flow rate 0.5 mL/min.
- Detection: UV at 280 nm.
- Injection: 20 µL of sample (diluted to 2 mg/mL in mobile phase).
- Run Time: 30 minutes.
- Data Analysis: Integrate peaks for HMW aggregates (eluting first), main monomer peak, and LMW fragments. Calculate percentage of each species relative to total peak area.
Results Summary: Table 3: SEC-HPLC Analysis of mAb Thermal Stability
| Stability Time Point | Monomer (%) | HMW Aggregates (%) | LMW Fragments (%) |
|---|---|---|---|
| Initial (T0) | 98.7 ± 0.2 | 0.8 ± 0.1 | 0.5 ± 0.05 |
| 1 Week at 40°C | 97.1 ± 0.3 | 2.1 ± 0.2 | 0.8 ± 0.1 |
| 2 Weeks at 40°C | 95.0 ± 0.5 | 3.9 ± 0.3 | 1.1 ± 0.1 |
| 4 Weeks at 40°C | 91.5 ± 0.7 | 6.8 ± 0.5 | 1.7 ± 0.2 |
Case Study 3: Complex Formulation – Liposome-Encapsulated Drug
Objective: To develop an HPLC-based assay to separate and quantify free drug from liposome-encapsulated drug in a complex injectable formulation, enabling stability assessment.
Protocol: Separation of Free vs. Encapsulated Drug
- Sample Preparation: Dilute liposomal formulation 1:10 in Tris-HCl buffer, pH 7.4.
- Ultrafiltration (Physical Separation): Load 500 µL of diluted sample onto a 100 kDa molecular weight cut-off (MWCO) centrifugal ultrafiltration device. Centrifuge at 14,000 x g for 30 minutes at 4°C. The filtrate contains the free drug. The retentate contains liposome-encapsulated drug.
- Methanol Disruption: Dilute the retentate 1:1 with pure methanol to disrupt liposomes and release encapsulated drug. Vortex vigorously for 2 minutes.
- RP-HPLC Analysis:
- Column: C8, 150 mm x 4.6 mm, 3.5 µm.
- Mobile Phase A: 10 mM Ammonium Acetate, pH 5.0.
- Mobile Phase B: Acetonitrile.
- Gradient: 30% B to 90% B over 15 minutes.
- Detection: UV-Vis or CAD.
- Quantification: Use external standard curves for free drug to calculate concentration in filtrate (free) and disrupted retentate (total encapsulated).
Results Summary: Table 4: Stability of Liposomal Formulation at 5°C Over 6 Months
| Stability Time Point | Total Drug (mg/mL) | Free Drug (%) | Encapsulated Drug (%) | Encapsulation Efficiency (%) |
|---|---|---|---|---|
| Initial Release | 10.0 ± 0.1 | 0.9 ± 0.1 | 99.1 ± 0.1 | 99.1 |
| 3 Months | 9.9 ± 0.1 | 1.5 ± 0.2 | 98.4 ± 0.2 | 98.4 |
| 6 Months | 9.8 ± 0.2 | 2.3 ± 0.3 | 97.6 ± 0.3 | 97.6 |
Title: Assay Workflow for Liposomal Formulation Analysis
The Scientist's Toolkit: Key Research Reagent Solutions
Table 5: Essential Materials for Stability-Indicating HPLC Method Development
| Item / Reagent Solution | Function & Rationale |
|---|---|
| Pharmaceutical Stress Kit (e.g., 0.1-1N HCl/NaOH, 3-30% H₂O₂) | Standardized reagents for forced degradation studies to generate relevant degradants. |
| HPLC Column Screening Kit (C18, C8, Phenyl, HILIC, SEC) | Pre-packaged columns of identical dimensions to systematically evaluate selectivity. |
| Buffered Mobile Phase Additives (Ammonium formate, phosphate, acetate at various pH) | Provides consistent ionic strength and pH control, critical for reproducibility and peak shape. |
| Ultrafiltration Devices (e.g., 10kDa, 100kDa MWCO centrifugal units) | For physical separation of free and bound/encapsulated drug in complex formulations. |
| PDA (Photodiode Array) Detector | Enables peak purity assessment by collecting full UV spectra across a peak, critical for confirming specificity in stability assays. |
| Chemically Stable Vials/Inserts (e.g., glass with polymer-coated silica inserts) | Prevents adsorption of analyte and ensures sample integrity during autosampler storage. |
Solving Common HPLC Challenges: Troubleshooting and Optimization for Enhanced Method Robustness
In the development of stability-indicating HPLC methods for drug substances and products, achieving optimal peak shape is a critical quality attribute. Poor peak morphology—manifesting as tailing, fronting, or shoulder peaks—directly compromises method robustness, resolution, and the accurate quantification of degradants. This application note, framed within a thesis on advanced HPLC method development for stability studies, provides a systematic diagnostic guide and experimental protocols for identifying and rectifying these issues to ensure reliable and validated assays.
Table 1: Primary Causes and Corrections for Poor Peak Shape
| Peak Anomaly | Common Causes (Quantitative Indicators) | Suggested Corrective Actions |
|---|---|---|
| Tailing (Asymmetry > 1.2) | - Secondary interactions with active silanols (pH < 7, basic analytes)- Column void/degradation (retention time shift > 5%)- Excessive sample load (≥ 10% column overload)- Incompatible/inactive guard column | - Increase mobile phase pH (3 units below analyte pKa)- Use end-capped or specialty columns (e.g., C18-AQ)- Reduce injection volume (e.g., ≤ 2% of peak volume)- Add ionic modifier (e.g., 25 mM triethylamine) |
| Fronting (Asymmetry < 0.8) | - Column overloading (load > 5% of column capacity)- Sample solvent stronger than mobile phase | - Dilute sample or reduce injection volume- Use weaker sample solvent (match mobile phase) |
| Shoulder Peaks | - Co-elution of impurity (resolution Rs < 1.5)- Inadequate mobile phase pH control (∆pH > 0.2)- Column temperature too low (e.g., < 20°C) | - Optimize gradient or isocratic conditions- Adjust pH precisely (±0.1 unit from pKa)- Increase column temperature (e.g., 30-40°C) |
Experimental Protocols
Protocol 1: Systematic Diagnosis of Peak Tailing
Objective: To isolate the cause of peak tailing in a method for assay of an active pharmaceutical ingredient (API) and its degradants.
Materials: See "The Scientist's Toolkit" below.
Procedure:
- Initial Assessment: Inject standard (6 replicates). Calculate asymmetry factor (As) at 10% peak height. If As > 1.2, proceed.
- Test for Active Silanols: a. Prepare mobile phase at pH 2.5, 4.5, and 7.0 (buffered). Keep ionic strength constant (e.g., 25 mM phosphate). b. Inject analyte under each condition. c. Plot As vs. pH. A decrease in tailing at higher pH suggests silanol interaction.
- Test for Column Overload: a. Prepare a series of sample concentrations (e.g., 0.1, 0.5, 1.0, 2.0 mg/mL). b. Inject constant volume. Plot As vs. concentration. A linear increase in tailing indicates overload.
- Test for Column Degradation: a. Compare asymmetry with a new, certified column of identical lot. b. Inject a test mix containing basic and neutral markers. A >15% increase in tailing factor for basic marker only indicates stationary phase loss.
Protocol 2: Resolution of Shoulder Peaks via Gradient Optimization
Objective: To separate a main API peak from a closely eluting degradant (shoulder peak) for stability-indicating assays.
Procedure:
- Initial Isocratic Run: Use the starting method. Note retention time (tR) and resolution (Rs) of the shoulder.
- Scouting Gradient: Run a wide gradient (e.g., 5-95% organic in 60 min). Determine the approximate elution %B.
- Fine-Tuning: Narrow the gradient window to ±10% around the elution %B. Adjust gradient time (e.g., 20, 30, 40 min). Calculate Rs for each run.
- Temperature Optimization: Conduct the optimal gradient at 25, 35, and 45°C. Plot Rs vs. Temperature.
- Final Method Adjustment: Select conditions yielding Rs > 2.0. Adjust initial and final hold times for a total cycle time ≤ 15 min.
Visualization of Diagnostic Workflow
Title: HPLC Peak Shape Diagnostic and Correction Workflow
The Scientist's Toolkit: Key Research Reagent Solutions
Table 2: Essential Materials for Peak Shape Investigation
| Item | Function & Rationale |
|---|---|
| High-Purity Silica-Based C18 Column | Standard workhorse column for reversed-phase method development. Provides a benchmark for performance. |
| Specialty Column (e.g., Polar-Embedded, Charged Surface Hybrid) | Minimizes secondary silanol interactions, especially for basic compounds, reducing tailing. |
| pH-Adjusted Buffers (Ammonium Formate/Acetate, Phosphate) | Provide precise, stable mobile phase pH control (±0.05 units) critical for analyte ionization and shape. |
| Ionic Modifiers (e.g., Triethylamine, Hexylamine) | Competitively block active silanol sites on silica, dramatically improving peak symmetry for amines. |
| In-line Degasser & Pulse Damper | Eliminates bubble formation and pump pulsation, which can cause baseline noise and peak fronting. |
| Certified Reference Standards (API & Key Degradants) | Essential for spiking studies to identify shoulders and confirm resolution of impurities. |
| Pre-column Filter (0.2 µm) & Guard Column | Protects analytical column from particulates and strongly retained contaminants, preserving lifetime and efficiency. |
Managing Baseline Drift, Noise, and Ghost Peaks in Gradient Elution
Within the critical framework of developing and validating stability-indicating HPLC methods for pharmaceutical analysis, the integrity of the chromatographic baseline is paramount. Baseline anomalies—drift, noise, and ghost peaks—directly compromise the accuracy, precision, and sensitivity required for quantifying drug substances and their degradation products. Gradient elution, while essential for separating complex mixtures from forced degradation studies, inherently exacerbates these challenges. This application note provides a systematic, experimental approach to diagnosing, mitigating, and resolving these artifacts, ensuring robust method performance for stability-indicating assays.
Diagnosis and Root Cause Analysis
A structured diagnostic workflow is essential for efficient troubleshooting.
Title: Diagnostic Workflow for Baseline Anomalies
Table 1: Common Root Causes and Diagnostic Signatures
| Anomaly Type | Primary Root Causes | Diagnostic Experiment |
|---|---|---|
| Upward Baseline Drift | Mobile phase mismatch (UV absorbance), column bleed, temperature instability. | Run a blank gradient. Compare baseline profile at different wavelengths (e.g., 220 vs. 254 nm). |
| Cyclic Noise/Baseline Ripple | Inadequate degassing, poor low-pressure mixing, pump piston seal issues. | Install a back-pressure regulator post-detector. Switch to helium sparging. |
| Random High-Frequency Noise | Old detector lamp, dirty flow cell, electrical grounding issues. | Measure baseline noise with flow stopped. Replace lamp if noise persists. |
| Ghost Peaks | Contaminated water/buffers, leaching injector parts, previous sample carryover. | Inject strong solvent (e.g., 100% organic) and multiple blank injections. |
Experimental Protocols for Mitigation
Protocol 3.1: Establishing a Clean Blank Gradient Baseline
Purpose: To characterize system-related artifacts independent of sample injection. Materials: See Scientist's Toolkit. Procedure:
- Prepare fresh, high-purity mobile phase components (A: aqueous buffer, B: organic). Filter through 0.22 µm membranes and degass via continuous helium sparging or ultrasonication under vacuum for 15 minutes.
- Prime all lines with the respective solvents. Equilibrate the C18 column (e.g., 150 x 4.6 mm, 3.5 µm) with 5% B for at least 30 minutes at 1.0 mL/min.
- Program the gradient: 5% B to 95% B over 30 minutes, hold at 95% B for 5 min, return to 5% B in 2 min, and re-equilibrate for 15 min. Set column temperature to 30°C ± 0.5°C and detector wavelength to 220 nm (or critical method wavelength).
- Perform a "no-injection" run, initiating the gradient program without an injection event. Record the chromatogram.
- Interpretation: Any significant drift or peaks observed are system-derived. Compare to a subsequent run injecting the sample diluent (e.g., 50:50 water:acetonitrile). Peaks present in both runs are ghost peaks.
Protocol 3.2: Minimizing Noise via Detector and Mobile Phase Optimization
Purpose: To reduce high-frequency and short-term noise to acceptable levels (typically < 0.05 mAU). Procedure:
- Detector Optimization: In the instrument settings, increase the detector time constant (response time) to 2.0 seconds. If available, enable electronic noise filtering. Ensure the flow cell is clean by flushing with 50:50 water:isopropanol.
- Mobile Phase Preparation: For the aqueous phase (A), use only HPLC-MS grade water. Add UV-transparent buffers (e.g., ammonium formate) if needed. Adjust pH with high-purity reagents (e.g., formic acid, ammonium hydroxide). Sparge continuously with helium (100-200 mL/min) during use.
- Pulsation Damping: Install a pulse dampener in the pump system if not present. Ensure pump seals are recently replaced. Use a pre-column (guard cartridge) to protect the analytical column.
- Noise Measurement: After stabilization, record the baseline for 10 minutes. Calculate the peak-to-peak noise as per USP guidelines. Compare before and after adjustments.
Protocol 3.3: Systematic Elimination of Ghost Peaks
Purpose: To identify and eliminate the source of reproducible extraneous peaks. Procedure:
- Source Identification Matrix: a. Run blank gradients with Solvent A only and Solvent B only from separate, clean reservoirs. b. Replace all tubing in the flow path from reservoirs to pump, including the purge line. c. Replace the injection valve rotor seal and wash the needle seat. d. Prepare mobile phases using a different lot of water and organic solvent.
- Perform the blank gradient (Protocol 3.1) after each change. Document the persistence or disappearance of specific ghost peaks.
- Final Verification: Once ghost peaks are minimized, perform six consecutive injections of the sample diluent. The ghost peaks should be reproducible with an RSD of retention time < 2%, confirming they are system peaks and not random contamination.
Data Presentation & Validation
Table 2: Impact of Mitigation Strategies on Baseline Metrics in a Stability-Indicating Method
| Condition | Baseline Drift (mAU/hr) | Peak-to-Peak Noise (mAU) | Number of Ghost Peaks (>0.1 mAU) | Suitability for LOQ (0.1%)* |
|---|---|---|---|---|
| Initial Unoptimized Method | 12.5 | 0.085 | 7 | Fail |
| After Degassing & He Sparging | 5.2 | 0.045 | 6 | Fail |
| After Mobile Phase & Water Source Change | 1.8 | 0.040 | 2 | Pass |
| After Seal & Tubing Replacement | 0.9 | 0.038 | 0 | Pass |
| Acceptance Criteria | < 2.0 | < 0.050 | ≤ 1 | N/A |
*Assumes a 1000 mAU main peak. LOQ = Limit of Quantitation.
The Scientist's Toolkit: Key Research Reagent Solutions
Table 3: Essential Materials for Robust Gradient HPLC
| Item | Function & Rationale |
|---|---|
| HPLC-MS Grade Water | Ultra-pure, low UV-absorbance water minimizes ghost peaks from bacterial/ organic contaminants. |
| Ammonium Formate | A volatile, UV-transparent buffer salt ideal for LC-MS and low-UV detection methods. |
| In-line Degasser (Helium Sparge Kit) | Continuously removes dissolved gases, reducing baseline ripple and pump cavitation. |
| Pre-column Filter (0.5 µm) & Guard Cartridge | Protects the analytical column from particulates and adsorbs contaminants that can leach. |
| Certified HPLC Vials & Pre-slit Caps | Minimizes extraneous leachates from vial/ septa materials during autosampler storage. |
| Replacement Pump Pistons & Seal Wash Kit | Prevents buffer crystallization and reduces pulsation, a source of cyclic noise. |
| UV Cuvette & Flow Cell Cleaning Solution | Specific solutions (e.g., 20% nitric acid, followed by copious water) to remove deposited contaminants. |
| High-Purity Phosphoric Acid or Trifluoroacetic Acid (TFA) | For ion-pairing applications; use high-purity grades to reduce UV-absorbing impurities. |
For stability-indicating assay development, a predictable and clean chromatographic baseline is non-negotiable. By implementing the diagnostic workflows and systematic protocols outlined here, researchers can isolate and eliminate the technical sources of baseline drift, noise, and ghost peaks. This rigorous approach ensures that the final HPLC method is capable of accurately quantifying trace-level degradation products, fulfilling the stringent requirements of ICH Q1 and Q2(R2) guidelines for drug stability testing.
Addressing Retention Time Shifts and Resolution Loss Over Time
Application Notes: A Thesis Context on Stability-Indicating HPLC Method Development
Within the broader thesis research on developing robust HPLC methods for stability-indicating assays, retention time (RT) shifts and resolution loss are critical failure modes. These phenomena directly compromise the method's ability to accurately identify and quantify degradants and impurities over the method's lifecycle, threatening the validity of stability studies. This document details the root causes, systematic investigative protocols, and mitigation strategies essential for ensuring method reliability in regulated drug development.
Table 1: Quantitative Impact of Common Factors on Retention Time and Resolution
| Factor | Typical RT Shift Range | Primary Impact on Resolution | Severity (1-5) |
|---|---|---|---|
| Mobile Phase pH Drift (±0.1 unit) | 2% - 8% | High for ionizable analytes | 4 |
| Column Temperature Fluctuation (±1°C) | 1% - 2% | Moderate | 3 |
| Stationary Phase Dealkylation/Loss | Progressive 0.5-3% per 1000 inj. | High (Peak Tailing) | 5 |
| Mobile Phase Organic % Variation (±0.5%) | 1% - 4% | High | 4 |
| Inlet Filter/Guard Column Blockage | Variable, increasing | High (Broadening) | 4 |
| Aqueous Mobile Phase Microbial Growth | Unpredictable drift | Moderate to High | 3 |
Experimental Protocol 1: Systematic Diagnosis of RT Shift Source
Objective: To isolate the root cause of observed retention time shifts in a stability-indicating assay.
Materials & Equipment:
- HPLC system with column thermostat and auto-sampler.
- Reference standard of API and key degradants.
- Freshly prepared mobile phases (from new buffer salts and HPLC-grade solvents).
- New guard column and/or inlet frit (matching column stationary phase).
- System suitability test (SST) mixture.
Procedure:
- Initial System Check: Inject the SST mixture under original method conditions. Record RT, peak asymmetry, and plate number.
- Mobile Phase Replacement Test: Replace all mobile phases with freshly prepared lots. Re-run the SST. A return to baseline RT indicates degradation or evaporation of original solvents.
- Temperature Verification: Calibrate the column oven temperature using an independent probe. Correct any deviation.
- Column Hardware Test: Replace the guard column or inlet frit. If no improvement, proceed to step 5.
- Column Performance Test: Install a new, identical analytical column. Re-run SST. Restoration of original RT/performance confirms stationary phase degradation of the old column.
- Pump & Mixing Verification: Perform a step-gradient test (e.g., 5% to 95% B in 1 min) with a UV-absorbing tracer (e.g., acetone) at low flow rate. Analyze the chromatographic trace for step profile anomalies indicating mixer malfunction or check valve issues.
Experimental Protocol 2: Proactive Column Cleaning and Re-equilibration Protocol
Objective: To restore column performance and resolution lost due to strong analyte adsorption or buffer salt accumulation.
Materials: Water (HPLC grade), Acetonitrile (HPLC grade), Isopropanol (HPLC grade), 1% (v/v) Phosphoric Acid, 1% (v/v) Ammonium Hydroxide.
Procedure:
- IMPORTANT: Flush system with water/organic solvent (e.g., 50:50) before and after any extreme pH wash to avoid salt precipitation.
- For Reversed-Phase C18 Columns:
- Flush with 20 column volumes (CV) of water.
- Flush with 20 CV of 1% phosphoric acid in water (for basic compound adsorption).
- Flush with 20 CV of water.
- Flush with 20 CV of 1% ammonium hydroxide in water (for acidic compound adsorption).
- Flush with 20 CV of water.
- Flush with 20 CV of isopropanol (to remove hydrophobic contaminants).
- Flush with 20 CV of the priming organic solvent (e.g., acetonitrile).
- Re-equilibrate with the starting mobile phase for at least 30 CV before use.
- Note: Consult column manufacturer's documentation for pH and solvent limits.
Experimental Protocol 3: Robustness Testing for Method Parameter Ranges
Objective: To establish allowable tolerances for critical method parameters to preempt resolution loss.
Procedure: Using Design of Experiments (DoE) or one-factor-at-a-time (OFAT) approach, deliberately vary key parameters around the setpoint and measure system suitability outcomes.
- Parameters: pH (±0.2), Temperature (±2°C), %Organic (±1%), Flow Rate (±10%).
- Responses: Record RT of critical pair, resolution (Rs), tailing factor, and plate count.
- Analysis: Establish a design space where all SST criteria are met. Implement these tolerances in the method SOP to guide troubleshooting.
The Scientist's Toolkit: Research Reagent Solutions
| Item | Function & Relevance to Addressing RT Shifts/Resolution Loss |
|---|---|
| HPLC Column Oven | Precise temperature control (±0.5°C) minimizes RT variability and is critical for method transfer. |
| pH Buffers with Stabilizers | Mobile phase additives (e.g., 0.1% sodium azide) inhibit microbial growth in aqueous buffers, preventing drift. |
| In-Line Degasser | Removes dissolved air, ensuring consistent pump delivery and mobile phase composition. |
| Guard Column | Identical stationary phase to analytical column. Protects the main column from irreversible adsorption, extending life. |
| Check Valve & Seal Kit | Maintenance parts to address baseline noise, pressure fluctuations, and composition errors causing RT shifts. |
| Column Performance Test Mix | Standard mixture (e.g., USP L7) to track column efficiency, asymmetry, and hydrophobicity over time. |
| Digital pH Meter with Calibration Buffers | Essential for reproducible mobile phase preparation; critical for methods sensitive to pH changes. |
Visualizations
Diagram 1: Systematic Troubleshooting Workflow for RT Shift
Diagram 2: Primary Degradation Pathways of C18 Stationary Phase
Within the development of stability-indicating HPLC methods, the chromatographic column is the cornerstone of separation performance. Proper column selection, coupled with rigorous care protocols, is paramount for achieving reliable data on drug substance degradation, ensuring method robustness, and maintaining productivity in pharmaceutical research.
Column Selection for Stability-Indicating Assays
Selecting the appropriate column is the first critical step in developing a method capable of resolving the active pharmaceutical ingredient (API) from its degradation products.
Key Selection Criteria:
- Stationary Phase Chemistry: The choice dictates selectivity.
- Particle Size and Morphology: Influences efficiency, backpressure, and speed.
- Column Dimensions: Length and internal diameter affect resolution, sensitivity, and solvent consumption.
Table 1: Stationary Phase Selection Guide for Stability-Indicating Methods
| Degradation Type | Recommended Phase Chemistry | Key Property | Typical Use Case |
|---|---|---|---|
| Acid/Base Hydrolysis | C18, C8, Phenyl | Hydrophobicity, pH stability | Separation of parent drug from hydrolyzed fragments. |
| Oxidation | Polar-Embedded (e.g., Amide C18) | Stability against oxidative damage, alternative selectivity | Resolving API from oxidative degradants. |
| Photodegradation | Biphenyl, PFP (Pentafluorophenyl) | π-π interactions, orthogonal selectivity | Separating isomers and complex photoproducts. |
| Deamidation/Ionic | HILIC (Hydrophilic Interaction) | Hydrophilicity, retention of polar molecules | Retaining highly polar degradants (e.g., des-amide species). |
| General Screening | C18 (AQ or Classic) | Broad applicability | Initial method scouting and forced degradation studies. |
Table 2: Column Dimension Impact on Method Parameters
| Dimension (mm) | Particle Size (µm) | Theoretical Plates (N) | Flow Rate (mL/min) | Solvent Consumption per Run | Primary Advantage |
|---|---|---|---|---|---|
| 150 x 4.6 | 5 | ~12,000 | 1.0 | ~10 mL | High resolution (standard) |
| 100 x 4.6 | 3 | ~13,000 | 1.2 | ~8 mL | Faster analysis, good efficiency |
| 50 x 2.1 | 1.7 | ~15,000 | 0.5 | ~1 mL | Ultra-high efficiency, MS-compatible, low solvent use |
| 100 x 3.0 | 2.6 | ~18,000 | 0.6 | ~3 mL | Core-shell technology for fast, high-res analysis |
Experimental Protocols for Column Evaluation and Care
Protocol 1: Initial Column Performance Qualification
Purpose: To establish a baseline of column performance (efficiency, asymmetry, retention) upon receipt or for new method validation. Materials: HPLC system, test column, reference standards (e.g., uracil for t0, alkylphenone homolog series), mobile phase as specified. Procedure:
- Equilibrate the column with at least 10 column volumes of the mobile phase.
- Inject a needle wash or blank to identify system peaks.
- Inject the test mixture. A typical mixture contains uracil (unretained marker) and three alkylphenones (e.g., acetophenone, propiophenone, butyrophenone).
- Record chromatogram. Calculate for a mid-eluting peak (e.g., propiophenone):
- Theoretical Plates (N): N = 16 (tR/w)2, where tR is retention time, w is peak width at base.
- Tailing Factor (Tf): Tf = w0.05 / 2f, where w0.05 is width at 5% height and f is the front half-width.
- Retention Factor (k): k = (tR - t0) / t0.
- Compare values against manufacturer's certificate or internal specifications (e.g., N > 15,000 plates/m, Tf < 2.0).
Protocol 2: Systematic Cleaning and Regeneration for Extended Lifetime
Purpose: To remove strongly retained contaminants and restore column performance. Materials: HPLC system with column heater, column, solvents (water, acetonitrile, methanol, isopropanol), buffers (non-corrosive, e.g., ammonium formate, ammonium acetate). Procedure:
- Backflush the Column: Disconnect and reverse the column direction. Note: Check manufacturer guidelines; not all columns are suitable for backflushing.
- Remove Buffers/Salts: Flush with 20 column volumes of water or 5-10% organic solvent in water.
- Wash with Strong Solvent: Flush with 20-30 column volumes of a strong solvent (e.g., 95% acetonitrile or methanol).
- For Organic Contaminants: Flush with 10-20 column volumes of a stronger, less polar solvent (e.g., isopropanol or tetrahydrofuran if compatible).
- For Ionic/Strongly Retained Contaminants: Flush with 20 column volumes of a mobile phase containing a competing agent (e.g., 0.1% trifluoroacetic acid or 1% acetic acid), followed by a step to pure organic solvent.
- Re-equilibrate: Return column to normal flow direction. Flush with 20 column volumes of the starting mobile phase before returning to analytical conditions. Safety: Always follow a solvent miscibility chart to prevent precipitation.
Protocol 3: Periodic Performance Monitoring for a Stability Method
Purpose: To track column degradation over time and determine re-qualification or replacement intervals. Materials: HPLC system, column in use, system suitability test (SST) mixture specific to the stability-indicating method. Procedure:
- At the start of each analytical batch (e.g., weekly), run the SST injection as defined in the method.
- Record key parameters: Resolution (Rs) between the API and closest eluting degradant, tailing factor (Tf) of the API, and retention time (tR) of a reference peak.
- Plot these values on a control chart (e.g., Levey-Jennings chart).
- Action Limits: Establish criteria for column failure (e.g., Rs < 1.5, 20% increase in Tf, or 10% shift in tR). If limits are breached, initiate Protocol 2 (Cleaning). If cleaning fails to restore performance, replace the column.
Diagram Title: HPLC Column Performance Monitoring and Maintenance Decision Workflow
The Scientist's Toolkit: Research Reagent Solutions
Table 3: Essential Materials for Column Care and Method Development
| Item | Function & Rationale |
|---|---|
| Guard Columns (Cartridges) | Small pre-column containing the same phase as the analytical column. Traps particulate matter and irreversibly retained compounds, protecting the more expensive analytical column. Essential for dirty samples (e.g., stability study samples, biological matrices). |
| In-Line Filters (0.5 µm or 2 µm) | Placed between the injector and guard column. Removes particulates from mobile phases or sample residues that could clog frits. |
| Column Ovens | Provides precise, consistent temperature control. Critical for retention time reproducibility in stability-indicating assays and can enhance efficiency and resolution. |
| LC-MS Grade Solvents & Buffers | High-purity solvents and volatile buffers (e.g., ammonium formate/acetate) minimize column contamination and are compatible with mass spectrometric detection often used in degradant identification. |
| pH-Stable Phases (e.g., Hybrid Silica) | Columns stable at extreme pH (pH 1-12). Allow use of mobile phase pH as a robust selectivity parameter without damaging the silica backbone, crucial for separating ionizable degradants. |
| Test Mixture Standards | Certified reference mixtures for column qualification (e.g., USP L series). Provide standardized metrics to compare column performance over time and between vendors. |
| Storage Caps & Vials | Proper end-fitting caps prevent the column from drying out during storage, which can irreversibly damage the stationary phase. Store in recommended solvent (e.g., 80% organic). |
Diagram Title: Optimal HPLC Flow Path with Protective Components
In stability-indicating assay development, the column is a critical but consumable resource. A strategic approach combining informed initial selection based on chemical rationale, diligent routine maintenance, and systematic performance monitoring is non-negotiable for ensuring method validity over its entire lifecycle. This discipline maximizes column lifetime, guarantees the integrity of stability data, and ultimately supports robust drug shelf-life determinations.
Optimizing Method Parameters for Speed, Sensitivity, and Reproducibility
Within the broader thesis on HPLC method development for stability-indicating assays, the systematic optimization of method parameters is paramount. A stability-indicating assay method (SIAM) must not only separate the active pharmaceutical ingredient (API) from its degradation products but also do so in a manner that is fast, sensitive, and reproducible for high-throughput quality control and regulatory filing. This protocol details the targeted optimization of critical HPLC parameters—flow rate, column temperature, gradient slope, and injection volume—to achieve this balance.
Critical Parameter Optimization: Protocols and Data
Protocol 1: Systematic Optimization of Flow Rate and Column Temperature for Speed and Resolution
Objective: To determine the optimal combination of flow rate and column temperature that minimizes run time while maintaining baseline resolution (Rs > 2.0) between the API and its nearest eluting degradation product.
Materials & Reagents:
- HPLC system with PDA or DAD detector.
- C18 column (e.g., 150 x 4.6 mm, 2.7 µm superficially porous particle).
- Mobile Phase A: 0.1% Formic acid in water.
- Mobile Phase B: 0.1% Formic acid in acetonitrile.
- Sample: API spiked with 0.5% each of known forced degradation products (acid, base, oxidative hydrolyzed).
Procedure:
- Prepare a gradient method: 5-95% B over 20 minutes as a starting point.
- Set the injection volume to 5 µL and detection wavelength as per API UV maxima.
- Design a two-factor experimental matrix:
- Flow Rate: 0.8 mL/min, 1.0 mL/min, 1.2 mL/min.
- Column Temperature: 25°C, 35°C, 45°C.
- Run the sample mixture at all nine combinations (randomized order).
- Record the retention time of the API, the retention time of the critical pair (API and closest degradant), and calculate the resolution (Rs) between them.
- Record the backpressure at each condition.
Table 1: Effect of Flow Rate and Temperature on Analysis Time and Resolution
| Flow Rate (mL/min) | Temperature (°C) | API RT (min) | Resolution (Critical Pair) | System Pressure (psi) |
|---|---|---|---|---|
| 0.8 | 25 | 12.5 | 3.5 | 2200 |
| 0.8 | 35 | 11.8 | 3.1 | 1900 |
| 0.8 | 45 | 11.0 | 2.8 | 1600 |
| 1.0 | 25 | 10.2 | 3.0 | 2800 |
| 1.0 | 35 | 9.6 | 2.7 | 2400 |
| 1.0 | 45 | 9.0 | 2.5 | 2100 |
| 1.2 | 25 | 8.6 | 2.4 | 3500 |
| 1.2 | 35 | 8.1 | 2.0 | 3000 |
| 1.2 | 45 | 7.6 | 1.7 | 2600 |
Conclusion: A flow rate of 1.0 mL/min and a temperature of 45°C provides the best compromise, reducing the API RT to 9.0 minutes while maintaining acceptable resolution (Rs=2.5) and moderate system pressure.
Protocol 2: Optimizing Gradient Slope for Speed and Peak Capacity
Objective: To refine the gradient slope to maximize the separation of multiple degradation products in minimal time.
Procedure:
- Using the optimal flow and temperature from Protocol 1 (1.0 mL/min, 45°C).
- Test three different gradient times over the same range (5-95% B): 10, 15, and 20 minutes.
- Inject the stressed sample and record the chromatogram.
- Calculate the Peak Capacity (nc) using the formula: nc = 1 + (tG / wavg), where tG is the gradient time and wavg is the average peak width at baseline.
Table 2: Impact of Gradient Time on Separation Metrics
| Gradient Time (min) | Total Run Time (min) | Peak Capacity (nc) | Minimum Resolution Observed |
|---|---|---|---|
| 10 | 12 | 45 | 1.6 |
| 15 | 17 | 65 | 2.2 |
| 20 | 22 | 80 | 2.8 |
Conclusion: A 15-minute gradient offers a significant increase in peak capacity and acceptable resolution over the 10-minute gradient, with a 5-minute saving compared to the 20-minute gradient. This is optimal for a stability-indicating assay requiring separation of numerous degradants.
Protocol 3: Maximizing Sensitivity via Injection Volume Optimization
Objective: To determine the maximum injection volume that does not cause significant peak broadening (>10% width increase) for optimal sensitivity (S/N >10 for 0.05% degradant).
Procedure:
- Using the optimized method from Protocol 1 & 2.
- Prepare a sample with 0.05% w/w of a key degradation product relative to API.
- Inject volumes of 1, 5, 10, 15, and 20 µL (in triplicate).
- Measure the signal-to-noise ratio (S/N) for the degradant peak and the peak width at half height for the API.
Table 3: Injection Volume vs. Sensitivity and Peak Shape
| Injection Volume (µL) | S/N (0.05% Degradant) | % Increase in API Peak Width | Observed Peak Tailing |
|---|---|---|---|
| 1 | 8 | Baseline | 1.05 |
| 5 | 42 | 2% | 1.07 |
| 10 | 85 | 6% | 1.10 |
| 15 | 125 | 15% | 1.18 |
| 20 | 165 | 25% | 1.30 |
Conclusion: An injection volume of 10 µL provides a substantial S/N (>10) for low-level degradant detection while keeping peak broadening and tailing within acceptable limits (<10% increase, tailing factor <1.2).
Workflow for HPLC Method Optimization
HPLC Method Development and Optimization Workflow
The Scientist's Toolkit: Key Research Reagent Solutions
| Item | Function in SIAM Development |
|---|---|
| Superficially Porous Particle (SPP) C18 Column (e.g., 150 x 4.6 mm, 2.7 µm) | Provides high efficiency separation with lower backpressure than fully porous particles, enabling faster flow rates for rapid analysis. |
| LC-MS Grade Solvents & Volatile Buffers (e.g., 0.1% Formic Acid) | Ensures low UV background noise for high sensitivity and MS compatibility for degradant identification. |
| Forced Degradation Sample Mixture | Contains API spiked with known degradation products (from stress studies) used as a system suitability test to verify resolution. |
| pH & Buffer Concentration Standards | Critical for reproducibility; small changes can drastically alter selectivity for ionizable compounds. |
| Autosampler Vials with Polymer Screw Caps | Minimizes sample evaporation and leaching, crucial for reproducibility of injection volume and sample integrity. |
| Column Heater/ Oven | Precisely controls column temperature, a key variable for retention time reproducibility and kinetic efficiency. |
Preventative Maintenance Schedules to Ensure Uninterrupted Analysis.
Application Notes and Protocols Within the framework of developing and validating robust HPLC methods for stability-indicating assays, the reliability of analytical data is paramount. A single instrument failure can compromise weeks of forced degradation studies or long-term stability testing, directly impacting drug development timelines. This document outlines preventative maintenance (PM) protocols to ensure HPLC system integrity, focusing on the binary pump, autosampler, and detector as critical modules for method robustness.
1. Quantitative PM Schedule Summary The following table consolidates recommended maintenance tasks and their frequencies based on manufacturer guidelines and operational best practices.
| Module | Task | Frequency | Critical Performance Parameter |
|---|---|---|---|
| Solvent Delivery (Pump) | Replace inlet line frits & purge valve filter | Every 3-6 months | Pressure fluctuation (<2% RSD) |
| Seal & piston inspection/replacement | Every 6 months or 2000 hrs | Pressure drift, leak detection | |
| Check valve cleaning/replacement | As needed (flow/percussive test) | Flow accuracy (±2%) | |
| Autosampler | Replace needle seat & seal | Every 6 months or 10k injections | Peak area precision (RSD <1%) |
| Flush wash station & replace solvent | Weekly | Carryover (<0.05%) | |
| Lubricate syringe guide (if applicable) | Every 6 months | Injection volume accuracy | |
| Detector (DAD/UV-Vis) | Replace deuterium lamp | At 2000 hrs or intensity threshold | Baseline noise increase, S/N drop |
| Clean flow cell windows | Quarterly or after dirty samples | Increase in stray light/background | |
| Perform wavelength accuracy test | Quarterly using holmium oxide filter | Wavelength accuracy (±1 nm) | |
| System-Wide | Purge and replace degasser cartridges | Annually | Reduced outgassing, stable baseline |
| Replace column oven pre-column filter | With each new column | Unusual backpressure rise |
2. Experimental Protocols for Key Maintenance Verification
Protocol 2.1: Pump Seal Integrity and Check Valve Test Objective: To verify pump seal performance and check valve function, ensuring accurate mobile phase delivery. Materials: HPLC pump, isopropanol, water, 10 mL graduated cylinder, stopwatch. Procedure:
- Set pump flow rate to 2.0 mL/min with mobile phase (e.g., 50:50 Water:MeOH).
- Place pump outlet line into a 10 mL graduated cylinder.
- Start pump and timer simultaneously.
- Measure the exact volume delivered over 5 minutes. Calculate actual flow rate (Volume/Time).
- Acceptance Criterion: Measured flow rate is within ±2% of set point (1.96 - 2.04 mL/min).
- For check valves, observe pressure trace at 1.0 mL/min. A >5% ripple or percussive noise indicates potential check valve failure.
Protocol 2.2: Autosampler Carryover Assessment Objective: Quantify carryover to confirm injector and needle wash efficiency. Materials: Autosampler, placebo sample, high-concentration standard (e.g., 100% of target concentration), blank solvent. Procedure:
- Inject six replicates of the high-concentration standard.
- Immediately follow with three consecutive injections of the blank solvent.
- Chromatographically analyze all injections.
- Calculate average peak area from the high standard (Ahigh) and average peak area from the first blank injection (Ablank).
- Calculate % Carryover = (Ablank / Ahigh) * 100%.
- Acceptance Criterion: Carryover ≤ 0.05%.
Protocol 2.3: Detector Wavelength Accuracy Verification Objective: Validate the accuracy of the detector's wavelength axis. Materials: HPLC with DAD/UV-Vis, certified holmium oxide filter (or solution in perchloric acid), software for spectral acquisition. Procedure:
- Place the holmium oxide filter in the detector's sample beam path (or fill a sealed quartz cell for solution).
- Acquire an absorbance spectrum from 240 nm to 650 nm.
- Identify the characteristic peak maxima (e.g., 241.1 nm, 287.1 nm, 361.5 nm, 536.4 nm).
- Record the measured wavelength for each peak from the system software.
- Calculate the deviation from the certified values.
- Acceptance Criterion: All measured maxima are within ±1 nm of certified values.
3. Logical Workflow Diagram
Title: HPLC Preventative Maintenance and Verification Workflow
4. The Scientist's Toolkit: Essential Research Reagent Solutions
| Item | Function in HPLC PM & Method |
|---|---|
| Seal Wash Solution (10% Isopropanol) | Lubricates pump seals, prevents buffer crystallization, extends seal life. |
| Needle Wash Solvent (e.g., 50:50 ACN:Water) | Minimizes autosampler carryover by effectively solubilizing sample residues. |
| Holmium Oxide Wavelength Standard | Certified reference material for verifying detector wavelength accuracy. |
| In-line Degasser Cartridges | Removes dissolved gases from mobile phase to reduce baseline noise and spikes. |
| Piston Seal Kit (Module-specific) | Replaces worn seals and pistons to restore pump fluidic integrity and pressure stability. |
| Certified Flow-Cell Cleaning Solution | Removes adsorbed contaminants from detector flow cell without damaging optical windows. |
| Pre-column Filter (0.5 µm frit) | Protects analytical column from particulate matter originating in pump or samples. |
Ensuring Reliability: Method Validation, Comparative Analysis, and Regulatory Submission
Within the broader thesis on developing robust, stability-indicating HPLC methods for novel pharmaceutical compounds, comprehensive analytical validation is a critical pillar. The ICH Q2(R2) guideline, "Validation of Analytical Procedures," provides the definitive framework. This application note details the protocols and acceptance criteria for four fundamental validation parameters—Specificity, Linearity, Accuracy, and Precision—in the context of a stability-indicating assay for "Compound X."
Specificity: Protocol & Data
Objective: To demonstrate that the method can unequivocally assess the analyte in the presence of expected impurities, degradation products, and matrix components.
Experimental Protocol:
- Solutions: Prepare individual solutions of:
- Compound X (API) at target concentration (e.g., 1 mg/mL).
- Known synthetic intermediates (Imp-A, Imp-B).
- Stressed samples of Compound X (acid, base, oxidative, thermal, and photolytic degradation per ICH Q1B).
- Placebo formulation (all excipients, no API).
- Spiked sample: API + known impurities + placebo.
- Chromatography: Inject each solution in triplicate using the proposed HPLC-UV method (e.g., C18 column, gradient elution).
- Analysis: Assess chromatograms for baseline separation. Resolution (Rs) between the API peak and the closest eluting potential interferent must be > 2.0. Peak purity for the API peak in stressed samples should be confirmed via a photodiode array (PDA) detector (purity angle < purity threshold).
Data Summary: Table 1: Specificity Results for Compound X HPLC Method
| Solution Injected | Retention Time (min) | Resolution from API Peak | Peak Purity (PDA) |
|---|---|---|---|
| Compound X (API) | 12.5 | N/A | Pass |
| Impurity A | 10.8 | 3.5 | N/A |
| Impurity B | 13.2 | 2.8 | N/A |
| Acid Degradant | 11.9 | 2.2 | Pass |
| Oxidative Degradant | 12.9 | 1.8* | Pass |
| Placebo | No interfering peaks | N/A | N/A |
| Spiked Sample | All peaks resolved | >1.8 for all | API Peak: Pass |
Note: Resolution of 1.8 is acceptable if peak purity confirms no co-elution.
Title: Specificity Assessment Workflow
Linearity & Range: Protocol & Data
Objective: To demonstrate a proportional relationship between analyte concentration and detector response across the specified range.
Experimental Protocol:
- Solutions: Prepare a minimum of 5 concentration levels of Compound X, typically spanning 50% to 150% of the target assay concentration (e.g., 0.5, 0.75, 1.0, 1.25, 1.5 mg/mL). Prepare from independent stock solutions.
- Chromatography: Inject each level in triplicate, in randomized order.
- Analysis: Plot mean peak area vs. concentration. Perform linear regression analysis. Calculate correlation coefficient (r), slope, y-intercept, and residual sum of squares.
Data Summary: Table 2: Linearity Data for Compound X (Range: 0.5-1.5 mg/mL)
| Concentration (mg/mL) | Mean Peak Area (mAU*min) | % Deviation from Line |
|---|---|---|
| 0.50 | 5025 | +0.25% |
| 0.75 | 7488 | -0.10% |
| 1.00 | 10010 | +0.10% |
| 1.25 | 12485 | -0.12% |
| 1.50 | 14950 | +0.05% |
| Regression Results | Value | Acceptance Criteria |
| Correlation Coefficient (r) | 0.9999 | > 0.999 |
| Slope | 9980 | N/A |
| Y-Intercept | 15.5 | Not statistically significant* |
| Residual Sum of Squares | < 100 | Low value indicates good fit |
Title: Linearity Verification Logic
Accuracy: Protocol & Data
Objective: To determine the closeness of agreement between the measured value and an accepted reference value (true value).
Experimental Protocol (Recovery Study):
- Design: Prepare placebo blend equivalent to one dosage unit. Spike with known quantities of Compound X at three levels: 80%, 100%, and 120% of the target concentration (n=3 per level).
- Sample Prep: Process samples as per the analytical method (extraction, dilution, etc.).
- Chromatography: Inject and compare the measured concentration to the theoretically spiked concentration.
- Calculation: Calculate % Recovery = (Measured Concentration / Theoretical Concentration) * 100.
Data Summary: Table 3: Accuracy (Recovery) Results for Compound X Assay
| Spike Level (%) | Theoretical Amount (mg) | Mean Recovered Amount (mg) | Mean % Recovery | RSD (%) |
|---|---|---|---|---|
| 80 | 8.00 | 8.05 | 100.6 | 0.5 |
| 100 | 10.00 | 9.97 | 99.7 | 0.3 |
| 120 | 12.00 | 12.07 | 100.6 | 0.4 |
| Overall Mean Recovery | 100.3% |
Precision: Protocol & Data
Objective: To determine the closeness of agreement among a series of measurements.
Experimental Protocols:
- Repeatability (Intra-assay): Assess six independent sample preparations at 100% of the test concentration, analyzed under identical conditions on the same day.
- Intermediate Precision: Assess variability on different days, with different analysts, using different instruments. Perform the repeatability protocol on two additional occasions.
- Calculation: For both, calculate the % Relative Standard Deviation (%RSD) of the assay results.
Data Summary: Table 4: Precision Results for Compound X HPLC Assay
| Precision Type | Condition | Mean Assay (% of label) | %RSD | Acceptance Criteria |
|---|---|---|---|---|
| Repeatability | Same day, analyst, instrument | 99.8 | 0.4% | NMT 1.0% |
| Intermediate Precision | Different days & analysts | 100.1 | 0.7% | NMT 2.0% |
| Combined Data | Pooled from all precision studies | 99.9 | 0.6% | N/A |
Title: Precision Hierarchy & Conditions
The Scientist's Toolkit: Key Reagent Solutions
Table 5: Essential Materials for HPLC Method Validation
| Item / Reagent Solution | Function / Purpose |
|---|---|
| High-Purity Reference Standard (Compound X) | Provides the definitive benchmark for identity, potency, and calibration. Critical for Accuracy & Linearity. |
| Well-Characterized Impurities & Degradants | Used to challenge method Specificity and establish stability-indicating capability. |
| HPLC-Grade Solvents & Buffers | Ensure reproducible chromatography, low baseline noise, and prevent system contamination. |
| Placebo Formulation Blend | Contains all excipients without API. Essential for Specificity and Accuracy (recovery) testing. |
| Stressed Samples (Forced Degradation) | Generated under controlled stress conditions (acid/base/oxidation/etc.) to create relevant degradants for specificity. |
| Standardized Mobile Phase Solutions | Precisely prepared and pH-adjusted to ensure method robustness and transferability during validation. |
Within the thesis "Advanced HPLC Method Development for Stability-Indicating Assays in Monoclonal Antibody Therapeutics," establishing method robustness is a critical pillar. Robustness testing confirms that an analytical procedure remains unaffected by small, deliberate variations in method parameters, ensuring reliability during transfer to quality control (QC) laboratories and throughout the product lifecycle. This application note details the systematic approach using Design of Experiments (DoE) to quantify the impact of variations and define a robust operational region for a stability-indicating reversed-phase HPLC (RP-HPLC) method for monoclonal antibody (mAb) fragments.
Theoretical Framework: From OFAT to DoE
Traditional one-factor-at-a-time (OFAT) approaches are inefficient and fail to detect interactions between parameters. DoE is a statistically driven, multifactorial approach that efficiently explores the experimental space. For HPLC robustness testing, it models the relationship between Critical Method Parameters (CMPs) and Critical Quality Attributes (CQAs) of the chromatographic output.
Diagram 1: DoE Workflow for HPLC Robustness
Application Note: DoE for RP-HPLC Robustness Testing
Objective: To statistically evaluate the robustness of an RP-HPLC method for separating mAb fragments (main peak, clip 1, clip 2, and aggregates) by deliberately varying key chromatographic parameters.
Critical Method Parameters (CMPs) & Ranges: Based on prior risk assessment (e.g., Ishikawa diagram) and screening DoE, four CMPs were selected for full robustness testing. Variations represent typical fluctuations in a QC environment.
Table 1: Selected CMPs and Their Deliberate Variation Ranges
| CMP | Low Level (-1) | Nominal Level (0) | High Level (+1) | Unit |
|---|---|---|---|---|
| A: Column Temperature | 33 | 35 | 37 | °C |
| B: Flow Rate | 0.95 | 1.00 | 1.05 | mL/min |
| C: pH of Mobile Phase A | 2.18 | 2.20 | 2.22 | - |
| D: % Acetonitrile in Gradient Endpoint | 40.8 | 41.0 | 41.2 | % (v/v) |
Critical Quality Attributes (CQAs): The following CQAs were monitored as responses:
- Rs (Peak 1/2): Resolution between clip 1 and main peak.
- Tailing Factor (Main Peak): USP tailing factor for the main peak.
- Retention Time (Main Peak): Runtime consistency.
- Peak Area (Main Peak): Reproducibility of quantification.
Experimental Design: A 2⁴ full factorial design with 3 center points (19 total experimental runs) was employed to estimate all main effects and two-factor interactions.
Table 2: DoE Design Matrix (Partial View) & Key Results
| Run | A: Temp | B: Flow | C: pH | D: %ACN | Rs (Peak 1/2) | Tailing Factor |
|---|---|---|---|---|---|---|
| 1 | -1 | -1 | -1 | -1 | 4.2 | 1.12 |
| 2 | +1 | -1 | -1 | -1 | 4.1 | 1.08 |
| 3 | -1 | +1 | -1 | -1 | 4.0 | 1.15 |
| ... | ... | ... | ... | ... | ... | ... |
| 17 | 0 | 0 | 0 | 0 | 4.3 | 1.05 |
| 18 | 0 | 0 | 0 | 0 | 4.25 | 1.06 |
| 19 | 0 | 0 | 0 | 0 | 4.28 | 1.04 |
| Model p-value | - | - | - | - | <0.0001 | 0.0023 |
| Lack of Fit p-value | - | - | - | - | 0.124 | 0.421 |
Statistical Analysis & Interpretation: Analysis of Variance (ANOVA) showed the model for Resolution was highly significant (p<0.0001) with no significant lack of fit (p=0.124). Perturbation and interaction plots were generated.
Diagram 2: Key Interaction Effect on Resolution
Findings: The most significant interaction was between Column Temperature (A) and Mobile Phase pH (C). At high temperature, the resolution becomes much more sensitive to changes in pH. The model confirmed that all CMPs within the studied ranges maintained Rs > 3.5 (system suitability criterion).
Conclusion of Robustness Study: The method is robust for all tested CMPs within the defined ranges. The Proven Acceptable Ranges (PARs) are wider than the deliberate variations applied, providing a safe operational region for the QC method.
Detailed Experimental Protocols
Protocol 1: Preparation of Mobile Phase with Deliberate pH Variation
- Materials: HPLC-grade water, trifluoroacetic acid (TFA), acetonitrile (ACN), calibrated pH meter.
- Prepare 1 L of 0.1% (v/v) aqueous TFA (Mobile Phase A nominal).
- Using a calibrated, high-precision pH meter, measure the pH (expected ~2.20).
- For the Low pH level (-1): Carefully add additional TFA in increments of 0.001% (v/v), mix, and measure until pH = 2.18 ± 0.005.
- For the High pH level (+1): Dilute the nominal Mobile Phase A with HPLC-grade water in a controlled manner to achieve pH = 2.22 ± 0.005.
- Filter all variants through a 0.22 µm nylon membrane under vacuum.
- Prepare Mobile Phase B (ACN) with deliberate % variation: 90.8%, 91.0%, and 91.2% ACN in water (v/v) to achieve the required gradient endpoint variation after mixing.
Protocol 2: Executing the DoE Chromatographic Run Sequence
- System: Agilent 1290 HPLC with diode array detector, thermostatted column compartment, and autosampler.
- Column: Agilent Poroshell 300SB-C8, 2.1 x 75 mm, 5 µm.
- Sample: mAb digest sample (0.5 mg/mL) from a single preparation vial, stored at 4°C.
- Procedure: a. Generate the randomized run order from the DoE software (e.g., JMP, Design-Expert). b. For each run, program the method with the specific CMP levels (Temperature, Flow Rate, Gradient Table). c. Equilibrate the system with the new mobile phase pH variant for at least 15 column volumes. d. Set the column compartment to the specified temperature and allow 10 min for stabilization. e. Perform a single injection of the sample (10 µL). f. Record all chromatographic data. Ensure system suitability standards (from center point runs) are met throughout the sequence.
Protocol 3: Statistical Analysis Workflow
- Data Compilation: Export CQAs (Resolution, Tailing, RT, Area) for all 19 runs to a statistical software package.
- Model Fitting: Fit a linear model with interaction terms for each CQA:
Response = β₀ + β₁A + β₂B + β₃C + β₄D + β₁₂AB + β₁₃AC + β₁₄AD + β₂₃BC + β₂₄BD + β₃₄CD - ANOVA: Perform ANOVA. Evaluate model significance (p < 0.05) and lack-of-fit.
- Diagnostics: Check residual plots (vs. predicted, normal probability) for randomness.
- Response Surface: Generate contour or perturbation plots to visualize effects and interactions.
- Define PAR: Use Monte Carlo simulation or direct prediction from the model to identify the parameter space where all CQAs meet system suitability criteria.
The Scientist's Toolkit: Key Research Reagent Solutions
Table 3: Essential Materials for HPLC Robustness & DoE Studies
| Item / Reagent Solution | Function & Importance in Robustness/DoE |
|---|---|
| High-Purity, LC-MS Grade Solvents (Water, Acetonitrile) | Minimizes baseline noise and variability; essential for detecting subtle CMP effects. |
| Trifluoroacetic Acid (TFA), HPLC Grade | Common ion-pairing agent for protein separations; pH variation source. Must be high purity for reproducibility. |
| Stable, Well-Characterized Reference Standard | Provides a consistent analytical response to attribute variation to method parameters, not sample degradation. |
| Certified pH Standard Buffers (pH 2.00, 4.01, 7.00) | For precise calibration of the pH meter used to adjust mobile phase pH, a critical CMP. |
| Thermostatted Column Compartment | Precisely controls and varies column temperature (±0.5°C), a key CMP. |
| Pre-column Filter (0.22 µm) & Guard Column | Protects the analytical column from particulates across multiple runs with varying conditions. |
| Statistical Software with DoE Module (e.g., JMP, Design-Expert, Minitab) | Enables design generation, run randomization, and sophisticated statistical analysis of results. |
| Automated Method Scouting HPLC System (Optional but recommended) | Allows automated, unattended execution of complex DoE run sequences, improving precision and efficiency. |
Setting Meaningful System Suitability Test (SST) Criteria
Within the thesis "Development and Validation of a Stability-Indicating HPLC Method for Novel Antihypertensive Compound ARB-567," establishing scientifically justified SST criteria is paramount. SST ensures the analytical system's performance is adequate for its intended purpose at the time of analysis, providing ongoing assurance of method reliability throughout stability studies. This protocol details the approach for deriving SST parameters from method validation data and routine performance monitoring.
Core SST Parameters: Derivation and Justification
SST criteria must be derived from validation data, not arbitrary standards. The following table summarizes the primary SST parameters, their rationale, and calculation basis.
Table 1: Core SST Parameters for Stability-Indicating HPLC Assays
| SST Parameter | Objective | Recommended Criteria (Example for ARB-567) | Derivation from Validation Data |
|---|---|---|---|
| Theoretical Plates (N) | Measure column efficiency | > 2000 | Typically 2x the value observed during validation (e.g., Validation N = 4500, SST = >2000) |
| Tailing Factor (Tf) | Assess peak symmetry | ≤ 2.0 | Based on worst-case observed during robustness testing (e.g., Tf = 1.5 ± 0.3) |
| Relative Standard Deviation (RSD) of Retention Time | Check system reproducibility | ≤ 1.0% | 2-3x the RSD observed for repeatability of standard injections |
| RSD of Peak Area/Height | Check detector/injection precision | ≤ 2.0% | Based on repeatability precision data from method precision study |
| Resolution (Rs) | Ensure critical pair separation | > 2.0 between ARB-567 and closest eluting degradant | Directly from specificity/forced degradation data; set to exceed minimum baseline separation (1.5) |
| Signal-to-Noise Ratio (S/N) | Verify detector sensitivity for impurities | > 10 for specified reporting threshold | Calculated from limit of detection (LOD) data; S/N at LOD is ~3, SST uses a safety factor |
Protocol 1: Establishing SST Criteria from Validation Data
Objective: To translate method validation outcomes into operational SST limits. Materials: Validation report data (precision, specificity, robustness), statistical software. Procedure:
- Compile Baseline Performance: Extract mean values and variability for efficiency (N), tailing (Tf), retention time (tR), and area precision from the method precision (repeatability) experiment.
- Define Specificity Requirements: From the forced degradation study, identify the critical resolution pair (API and nearest degradant). Set the resolution (Rs) criterion to be ≥ 0.5 units above the minimum value observed under all robustness conditions.
- Apply Safety Factors: For precision-based criteria (RSD of tR and area), multiply the observed validation RSD by a factor of 2-3 to set a realistic, but controlled, operational limit.
- Set Sensitivity Thresholds: Calculate the S/N for the analyte at the reporting threshold (e.g., 0.1%). The SST criterion should ensure S/N is comfortably above the limit of quantitation (typically S/N ≥ 10).
- Document Rationale: For each SST parameter, document the specific validation data source and the safety factor applied, ensuring traceability.
Protocol 2: Ongoing SST Monitoring and Control Charting
Objective: To monitor analytical system performance over time and refine SST limits if necessary. Materials: HPLC system, control standard, data acquisition software, statistical process control (SPC) chart. Procedure:
- Create Control Charts: For key continuous parameters (e.g., tR, area, N), plot values from each day's SST injection on individual Shewhart control charts (e.g., X-bar and R charts).
- Establish Control Limits: Calculate initial control limits (upper and lower control limits, UCL/LCL) from the first 20-30 SST results obtained during routine analysis.
- Implement Rules: Apply Westgard rules (e.g., 1:3s, 2:2s) to identify trends, shifts, or increased variation indicating potential system drift.
- Review and Revise: Annually, or after significant system maintenance, re-evaluate SST limits against the accumulated control chart data. Limits may be tightened if performance improves or re-justified if consistent, acceptable drift is observed.
Visualization: SST Lifecycle within Method Validation & Application
Title: Lifecycle of SST Criteria from Validation to Routine Use
The Scientist's Toolkit: Key Reagents & Materials
Table 2: Essential Research Reagent Solutions for SST Protocol
| Item | Function in SST Context |
|---|---|
| Qualified HPLC Column | The primary stationary phase; column-to-column consistency is vital for reproducible retention time and resolution. |
| SST Reference Standard | A well-characterized, high-purity sample of the analyte used exclusively for SST injections to monitor system performance. |
| Mobile Phase Components | HPLC-grade solvents and buffers prepared to strict SOPs; variability here directly impacts retention and selectivity. |
| System Suitability Test Solution | A single solution containing analyte and critical separations (e.g., key degradant or impurity) to verify resolution in one injection. |
| Control Chart Software | Enables statistical process control (SPC) of SST data over time, facilitating objective assessment of system drift. |
| Forced Degradation Samples | Stressed samples (acid, base, oxidation, heat, light) used during validation to identify critical peak pairs for resolution criteria. |
This application note, framed within a broader thesis on HPLC method development for stability-indicating assays, provides a comparative analysis of High-Performance Liquid Chromatography (HPLC) and Ultra-High-Performance Liquid Chromatography (UHPLC). The objective is to guide researchers in selecting and optimizing the appropriate chromatographic platform for method validation, forced degradation studies, and routine stability testing of pharmaceutical compounds.
Quantitative Comparison: HPLC vs. UHPLC
Table 1: Core System Parameter Comparison
| Parameter | Traditional HPLC | UHPLC |
|---|---|---|
| Typical Operating Pressure | Up to 400 bar (6000 psi) | 600-1200+ bar (15,000-18,000 psi) |
| Particle Size | 3-5 µm | 1.7-2.1 µm |
| Column Internal Diameter | 3.0-4.6 mm | 1.0-2.1 mm |
| Typical Flow Rate | 0.5-2.0 mL/min (4.6 mm ID) | 0.2-0.8 mL/min (2.1 mm ID) |
| Injection Volume | 5-50 µL | 1-10 µL |
| System Dispersion (Extra-Column Volume) | High (10-50 µL) | Very Low (<10 µL) |
Table 2: Performance Metrics in Stability-Indicating Assays
| Performance Metric | HPLC | UHPLC | Implication for Stability Studies |
|---|---|---|---|
| Analysis Time | 10-30+ minutes | 3-10 minutes | UHPLC enables higher throughput for multiple degradation time points. |
| Peak Capacity / Resolution | Lower | Higher (by ~70%) | UHPLC improves separation of critical pairs (API from close-eluting degradants). |
| Signal-to-Noise Ratio | Standard | Increased | UHPLC enhances sensitivity for low-level degradant detection. |
| Mobile Phase Consumption | High (~10 mL/run) | Low (~3 mL/run) | UHPLC reduces solvent cost and waste in long-term stability programs. |
| Method Transfer Complexity | Straightforward | Requires scaling calculations | Direct transfer from HPLC to UHPLC is not possible; method re-optimization is needed. |
Detailed Experimental Protocols
Protocol 1: Initial Method Scoping and Forced Degradation Study Setup
- Objective: To generate degradants and assess the separating capability of HPLC vs. UHPLC platforms.
- Materials: See "Scientist's Toolkit" below.
- Procedure:
- Sample Preparation: Subject the API (1 mg/mL) to stress conditions: Acid (0.1M HCl, 40°C, 24h), Base (0.1M NaOH, 40°C, 24h), Oxidative (3% H₂O₂, RT, 24h), Thermal (solid, 60°C, 72h), and Photolytic (1.2 million lux hours).
- Neutralization: Quench acid/base samples to pH ~7. Dilute all samples appropriately with the starting mobile phase.
- Parallel Instrument Setup:
- HPLC: Equip with a C18 column (150 x 4.6 mm, 5 µm). Set flow rate to 1.0 mL/min. Use a linear gradient from 5% to 95% organic phase over 25 minutes.
- UHPLC: Equip with a C18 column (75 x 2.1 mm, 1.7 µm). Set flow rate to 0.4 mL/min. Scale the gradient time proportionally using the Linear Velocity Equation: tUHPLC = tHPLC * (LUHPLC / LHPLC) * (dp,HPLC / dp,UHPLC) * (IDHPLC² / IDUHPLC²). This yields an approximate 5-minute gradient.
- Analysis: Inject each stressed sample (HPLC: 10 µL, UHPLC: 2 µL) in triplicate. Monitor at the API's λmax and use a photodiode array (PDA) detector from 200-400 nm.
- Data Review: Compare chromatograms for peak purity index (>999), resolution of degradant peaks, and total runtime.
Protocol 2: Method Validation for a Stability-Indicating Assay
- Objective: To validate the selected method per ICH Q2(R1) guidelines for specificity, accuracy, and precision in quantifying the API and major degradants.
- Procedure for Specificity/Forced Degradation:
- Inject blank (mobile phase), placebo, unstressed API, and all stressed samples.
- Confirm baseline separation (Resolution > 2.0) between all degradant peaks and the main API peak.
- Use PDA to confirm peak homogeneity (purity angle < purity threshold).
- Procedure for Accuracy/Precision (Spiked Recovery):
- Prepare sample solutions spiked with known concentrations (e.g., 50%, 100%, 150% of target) of synthesized/degradant-enriched mixtures into placebo.
- Analyze six independent preparations at the 100% level for repeatability.
- Calculate % recovery (98-102% target) and relative standard deviation (RSD < 2.0%).
Visualization of Method Selection Workflow
Title: Stability Indicating Assay Method Selection Workflow (94 chars)
The Scientist's Toolkit: Essential Research Reagents & Materials
Table 3: Key Reagent Solutions for Forced Degradation & Analysis
| Item | Function in Stability-Indicating Assays |
|---|---|
| Reference Standard (API) | Primary benchmark for identity, potency, and quantification during method validation and system suitability tests. |
| Forced Degradation Reagents (0.1-1M HCl/NaOH, 3-30% H₂O₂) | To intentionally degrade the API under hydrolytic and oxidative conditions, generating potential degradants for method challenge. |
| HPLC/UHPLC-Grade Solvents (Acetonitrile, Methanol) | Low UV-cutoff, high-purity mobile phase components essential for baseline stability and sensitive detection. |
| Buffer Salts (e.g., Potassium Phosphate, Ammonium Acetate/Formate) | For preparing pH-stable aqueous mobile phases, critical for reproducible retention times and peak shape. |
| Phosphate Buffered Saline (PBS) | Used for sample preparation and as a neutralization/quenching agent for stressed samples. |
| Validated Chromatographic Column (C18, 5µm or sub-2µm) | The stationary phase; column chemistry and particle size are the primary determinants of selectivity and efficiency. |
| Photodiode Array (PDA) Detector | Provides UV spectra for each peak, enabling assessment of peak purity and identification of potential co-elution. |
Application Note AN-SA-2024-01, framed within the thesis: "Advancements in HPLC Method Development for Stability-Indicating Assays in Pharmaceutical Analysis."
Within the paradigm of developing robust stability-indicating assay methods (SIAMs) for pharmaceuticals, High-Performance Liquid Chromatography (HPLC) is the established cornerstone. However, certain analytical challenges necessitate the evaluation of orthogonal or complementary separation techniques. This note provides a structured framework for selecting between Capillary Electrophoresis (CE), Liquid Chromatography-Mass Spectrometry (LC-MS), or Gas Chromatography (GC) when HPLC alone is insufficient, ensuring comprehensive characterization and quantification of degradation products.
Technique Selection Framework: Critical Parameters
Selection is driven by the physicochemical properties of the analyte, the nature of expected degradants, and the required information (quantitative, structural).
Table 1: Decision Matrix for Technique Selection
| Parameter | CE | LC-MS | GC | Primary HPLC Consideration |
|---|---|---|---|---|
| Analyte Polarity | High (charged) | Broad (esp. polar/non-volatile) | Low/Non-polar (volatile) | HPLC may struggle with highly polar, non-UV active compounds. |
| Molecular Weight | Small ions to large proteins | Virtually unlimited (with MS) | Typically < 1000 Da | LC-MS superior for unknown degradant identification. |
| Thermal Stability | Not required (ambient) | Not required | Required (volatilization) | GC for volatile, thermally stable degradants not resolved by HPLC. |
| Sample Complexity | Excellent for ionic mixtures | Excellent with high-res MS | Good for volatile mixtures | CE offers orthogonal selectivity for ionic impurities. |
| Primary Application in SIAM | Chiral separations, inorganic ion analysis, charge variant analysis | Structural elucidation of degradants, trace-level quantification | Residual solvent analysis, volatile impurity profiling | Complementary role to HPLC for specific impurity classes. |
| Approx. Sensitivity (Typical) | µM-nM (UV detection) | pM-fM (MS detection) | low ppm-ppb (FID/MS) | LC-MS provides orders of magnitude better sensitivity for trace degradants. |
| Analysis Speed | Fast (1-10 min) | Moderate (5-30 min) | Moderate (5-30 min) | CE can be significantly faster for ionic species. |
Detailed Experimental Protocols
Protocol 3.1: CE for Chiral Degradant Profiling (Orthogonal to RP-HPLC)
Aim: To separate and quantify enantiomeric degradation products of an active pharmaceutical ingredient (API) where HPLC methods show co-elution. Reagents & Materials: See "Scientist's Toolkit" (Section 5). Procedure:
- Background Electrolyte (BGE) Preparation: Dissolve 50 mM Tris-phosphate buffer (pH 2.5) and 10 mg/mL sulfated β-cyclodextrin in deionized water. Sonicate for 10 min and filter through a 0.45 µm nylon membrane.
- Capillary Conditioning: Rinse a new or used bare fused-silica capillary (50 µm ID, 40 cm effective length) sequentially with 1.0 M NaOH (10 min), deionized water (5 min), and BGE (10 min) at 50 psi.
- Sample Preparation: Dilute stressed stability sample (e.g., heat/acid-treated API) with deionized water to a final concentration of 0.5 mg/mL. Centrifuge at 14,000 rpm for 5 min.
- Injection & Separation: Hydrodynamically inject sample at 0.5 psi for 5 sec. Apply separation voltage of +15 kV (normal polarity, anode at inlet). Maintain cartridge temperature at 20°C.
- Detection: Use on-column UV detection at 200 nm.
- Data Analysis: Compare migration times and peak areas with enantiomer standards. Use internal standard (e.g, benzoic acid) for quantification.
Protocol 3.2: LC-MS for Structural Identification of Unknown Degradants
Aim: To elucidate the structure of major degradation products observed in a forced degradation study using an HPLC-UV method. Reagents & Materials: See "Scientist's Toolkit" (Section 5). Procedure:
- HPLC Method Transfer: Adapt the existing stability-indicating HPLC method to be MS-compatible. Replace non-volatile buffers (e.g., phosphate) with volatile alternatives (e.g., 0.1% formic acid or 10 mM ammonium formate). Adjust gradient as needed.
- MS Calibration & Tuning: Calibrate the Q-TOF mass spectrometer using manufacturer's calibration solution in the positive and negative electrospray ionization (ESI) mode.
- LC-MS Data Acquisition: Inject 10 µL of the degraded sample. Run the adapted gradient. Acquire data in both full-scan (m/z 100-1000) and data-dependent MS/MS modes. Use a collision energy ramp (e.g., 20-40 eV).
- Data Processing: Use software to generate a list of potential degradants by comparing sample chromatograms to control. Extract exact masses. Propose molecular formulas (mass error < 5 ppm). Interpret MS/MS fragments to propose structures.
- Confirmation: Synthesize or purchase proposed degradant standard and confirm by matching retention time and MS/MS spectrum.
Protocol 3.3: GC-MS for Volatile Degradation Product Analysis
Aim: To profile volatile and semi-volatile degradation products (e.g., from oxidative stress) not captured by standard RP-HPLC. Reagents & Materials: See "Scientist's Toolkit" (Section 5). Procedure:
- Sample Derivatization (if needed): For non-volatile degradants like acids, dry 100 µL of sample under nitrogen. Add 50 µL of BSTFA + 1% TMCS. Heat at 70°C for 20 min.
- GC Method: Use a 30 m DB-5MS column (0.25 mm ID, 0.25 µm film). Set carrier gas (He) flow to 1.2 mL/min. Oven program: 40°C hold 2 min, ramp 10°C/min to 280°C, hold 5 min.
- Injection: Use split mode (10:1 ratio) at 250°C. Inject 1 µL.
- MS Detection: Use electron ionization (EI) at 70 eV. Acquire in full-scan mode (m/z 35-500). Source temperature: 230°C.
- Identification: Compare acquired spectra to NIST mass spectral library. Use external standards for quantitative confirmation.
Visualized Workflows & Relationships
Title: Decision Workflow for Complementary Techniques to HPLC
Title: LC-MS Degradant Identification Workflow
The Scientist's Toolkit: Key Research Reagent Solutions
Table 2: Essential Materials for Featured Protocols
| Item | Function & Relevance | Example Protocol |
|---|---|---|
| Sulfated Cyclodextrins | Chiral selectors for CE, enabling separation of enantiomeric degradants. | 3.1 (CE) |
| Volatile Buffers (Ammonium Formate, Formic Acid) | MS-compatible mobile phase additives, replacing phosphates for direct LC-MS transfer. | 3.2 (LC-MS) |
| Derivatization Reagents (e.g., BSTFA) | Silanizing agents for GC; convert polar, non-volatile analytes (acids, alcohols) into volatile derivatives. | 3.3 (GC-MS) |
| Q-TOF Mass Spectrometer | High-resolution accurate mass instrument for definitive molecular formula assignment and structural elucidation. | 3.2 (LC-MS) |
| NIST Mass Spectral Library | Reference database for tentative identification of unknown peaks in GC-MS by spectrum matching. | 3.3 (GC-MS) |
| Bare Fused-Silica Capillary | Standard separation channel for CE; surface chemistry critical for EOF control and reproducibility. | 3.1 (CE) |
Application Notes on HPLC Stability-Indicating Assay Lifecycle
Within a thesis on HPLC method development for stability-indicating assays, robust documentation and lifecycle management are critical for regulatory compliance. This framework ensures that methods are scientifically sound, fit-for-purpose, and consistently validated from development through post-approval changes.
Key Regulatory Requirements for HPLC Method Lifecycle
The following table summarizes core regulatory expectations based on current ICH, FDA, and EMA guidelines.
Table 1: Regulatory Documentation Requirements for HPLC Stability Methods
| Lifecycle Phase | Key Document(s) | Regulatory Guideline Reference | Critical Data Elements |
|---|---|---|---|
| Method Development | Method Development Report | ICH Q8(R2), ICH Q14 | Forced degradation results, specificity data, preliminary robustness parameters. |
| Method Qualification/Validation | Method Validation Protocol & Report | ICH Q2(R2) | Specificity, Linearity, Accuracy, Precision (Repeatability, Intermediate Precision), Range, Detection/Quantitation Limits. |
| Method Transfer | Transfer Protocol & Report | FDA Guidance: Analytical Procedures & Methods Validation for Drugs & Biologics | Comparative testing results (e.g., equivalence testing, CQA comparison) between sending and receiving units. |
| Routine Use (Stability Testing) | Standard Test Method (STM), Analytical Test Records, Change Control | ICH Q1A(R2), ICH Q7 | System suitability records, sample chromatograms, integration parameters, out-of-specification (OOS) investigation reports. |
| Method Change/Update | Change Control Request, Re-validation Report | ICH Q12 | Impact assessment, comparability protocol, bridging data. |
| Periodic Review | Method Performance Review Report | FDA CFR 211.160(e) | Trending of system suitability, control sample data, and method-related deviations over time. |
Protocol: Comprehensive Method Validation for Stability-Indicating HPLC Assay
Objective: To establish documented evidence that the HPLC analytical procedure is suitable for its intended purpose of quantifying the active pharmaceutical ingredient (API) and detecting its degradants in stability samples.
Materials & Reagents:
- HPLC System: UHPLC or HPLC with DAD or PDA detector.
- Columns: As per method (e.g., C18, 100 x 2.1 mm, 1.7 µm).
- Reference Standard: Certified API reference standard.
- Forced Degradation Samples: API subjected to acid/base, oxidative, thermal, and photolytic stress.
- Mobile Phase Components: HPLC-grade solvents and buffers.
Procedure:
1. Specificity/Forced Degradation:
- Prepare stressed samples: Expose API to 0.1N HCl/NaOH (4-8 hrs, ambient), 3-15% H2O2 (24 hrs, ambient), heat (e.g., 70°C, 48 hrs), and light (per ICH Q1B).
- Inject stressed samples, unstressed API, and placebo (excipient blend).
- Acceptance Criteria: The analyte peak is resolved from all degradation products (Resolution > 2.0). Peak purity tool (PDA) indicates a pure analyte peak.
2. Linearity and Range:
- Prepare a minimum of 5 concentrations from 50% to 150% of the target assay concentration.
- Inject each level in triplicate. Plot mean peak area vs. concentration.
- Acceptance Criteria: Correlation coefficient (r) ≥ 0.999. Residuals randomly scattered.
3. Accuracy (Recovery):
- Prepare placebo blends spiked with API at 80%, 100%, and 120% levels (n=3 per level).
- Compare measured concentration to nominal spiked concentration.
- Acceptance Criteria: Mean recovery between 98.0-102.0%.
4. Precision:
- Repeatability: Analyze 6 independent preparations at 100% concentration.
- Intermediate Precision: Repeat the procedure on a different day, with a different analyst and instrument.
- Acceptance Criteria: %RSD for assay ≤ 2.0% for both repeatability and intermediate precision.
5. Quantitation Limit (LOQ) for Degradants:
- Perform serial dilution of a known degradant or the API. Signal-to-noise ratio (S/N) of 10:1 is acceptable.
- Document the injection precision at the LOQ level (%RSD ≤ 5.0%).
Documentation: All raw data, chromatograms, calculations, and deviations must be recorded in bound notebooks or electronic records (ER/ES) and summarized in a formal Validation Report.
The Scientist's Toolkit: Research Reagent Solutions
Table 2: Essential Materials for HPLC Method Development & Validation
| Item | Function in HPLC Stability Method Context |
|---|---|
| Certified Reference Standard | Provides the definitive benchmark for identity, purity, and potency of the API; critical for accurate quantification. |
| HPLC-Grade Solvents & Buffers | Minimize baseline noise and ghost peaks, ensuring reproducibility and accurate integration of low-level degradants. |
| Validated/Qualified Column Oven | Ensures consistent retention times and separation, critical for method robustness during long-term stability studies. |
| Photodiode Array (PDA) Detector | Enables peak purity assessment by collecting spectral data across peaks, proving specificity in stability-indicating assays. |
| System Suitability Solution | A mixture of API and key degradants used to verify chromatographic system performance before each analytical run. |
| Stability-Indicating Forced Degradation Samples | Provide a documented scientific basis for method specificity by demonstrating separation of API from all potential degradants. |
| Electronic Lab Notebook (ELN) & CDS | Ensures data integrity (ALCOA+ principles), enables audit trails, and streamlines report generation for audits. |
| Change Control Management Software | Formalizes the assessment and approval of any changes to the validated method throughout its lifecycle. |
Workflow and Relationship Diagrams
Diagram Title: HPLC Method Lifecycle from Development to Review
Diagram Title: Pre-Audit Preparation and Inspection Hosting Workflow
Conclusion
Developing and validating a robust stability-indicating HPLC method is a multidisciplinary endeavor critical to ensuring drug safety, efficacy, and shelf-life. This guide has synthesized the journey from foundational regulatory principles and forced degradation studies, through meticulous method development and troubleshooting, to full ICH-compliant validation. The integration of modern tools like DoE for robustness and advanced detection for peak purity is now standard for defending method specificity. Future directions point toward increased adoption of Quality by Design (QbD) principles, seamless method lifecycle management, and the growing role of hyphenated techniques like LC-MS for structural elucidation of unknown degradants. By mastering this comprehensive workflow, scientists can generate reliable, defensible data that accelerates drug development, supports regulatory submissions, and ultimately safeguards patient health.