Optimized Liquid-Liquid Extraction Protocol for UFLC-DAD Analysis: A Comprehensive Guide from Method Development to Validation
This article provides a complete framework for developing and optimizing liquid-liquid extraction (LLE) protocols specifically for Ultra-Fast Liquid Chromatography with Diode Array Detection (UFLC-DAD) analysis.
Optimized Liquid-Liquid Extraction Protocol for UFLC-DAD Analysis: A Comprehensive Guide from Method Development to Validation
Abstract
This article provides a complete framework for developing and optimizing liquid-liquid extraction (LLE) protocols specifically for Ultra-Fast Liquid Chromatography with Diode Array Detection (UFLC-DAD) analysis. Tailored for researchers and drug development professionals, it covers fundamental principles of LLE and UFLC-DAD, detailed methodological workflows for various sample matrices, systematic troubleshooting for common issues like emulsion formation and poor recovery, and rigorous method validation according to regulatory standards. By integrating traditional LLE with modern techniques like dispersive liquid-liquid microextraction (DLLME), this guide serves as an essential resource for achieving high-quality, reproducible analytical results in biomedical and pharmaceutical applications.
Understanding LLE and UFLC-DAD: Core Principles for Effective Analysis
The Role of Liquid-Liquid Extraction in Modern Chromatographic Analysis
Liquid-liquid extraction (LLE) remains a cornerstone sample preparation technique in modern analytical laboratories, particularly as a front-end to powerful chromatographic systems like Ultra-Fast Liquid Chromatography (UFLC). This technique leverages the differential solubility of analytes in two immiscible liquids, typically an aqueous phase and a water-immiscible organic solvent, to achieve a clean and effective separation of target compounds from complex matrices [1]. The critical role of LLE is to purify and concentrate analytes, thereby protecting the chromatographic system from matrix effects and enhancing detection sensitivity [2]. In the context of UFLC coupled with photodiode array detection (DAD), effective sample preparation via LLE is indispensable for obtaining reliable, reproducible, and high-quality data, especially in demanding fields such as pharmaceutical analysis, food chemistry, and environmental monitoring [3] [4]. This article details advanced LLE strategies and provides actionable protocols designed to be seamlessly integrated into workflows involving UFLC-DAD analysis.
Fundamental Principles and Modern LLE Strategies
The fundamental mechanism of LLE relies on the partitioning of an analyte between two immiscible liquid phases, a process governed by its partition coefficient (KD) [1]. In practice, the effectiveness of this extraction is measured by the distribution ratio (D), which accounts for the total concentration of all chemical forms of the analyte in each phase. A high distribution ratio indicates a favorable transfer of the analyte into the extracting solvent [1].
The success of an LLE protocol is highly dependent on several key variables. Two of the most important variables influencing analyte recovery from a biological sample matrix are the sample pH and the choice of organic solvent [2]. Adjusting the sample pH can suppress the ionization of acidic or basic analytes, rendering them more lipophilic and enhancing their partitioning into the organic phase. The solvent must be chosen based on its ability to solubilize the target analytes effectively while maintaining immiscibility with the aqueous sample [2].
Modern adaptations of LLE have been developed to address various analytical challenges, as summarized in the table below.
Table 1: Advanced Liquid-Liquid Extraction Techniques and Their Applications
| Technique | Core Principle | Key Advantages | Typical Applications |
|---|---|---|---|
| Salting-Out LLE (SALLE) | Addition of high concentrations of salts (e.g., MgSO₄, NaCl) to a mixture of water and a water-miscible solvent (e.g., acetonitrile) induces phase separation [5]. | - Excellent for highly polar, water-soluble compounds.- Uses MS-friendly solvents.- High recovery rates for a broad range of analytes [5]. | Extraction of polar drugs from plasma; multiresidue pesticide analysis in food samples [5]. |
| Dispersive Liquid-Liquid Microextraction (DLLME) | A water-immiscible extraction solvent is dispersed in the aqueous sample via a disperser solvent, forming a cloudy suspension of microdroplets to maximize extraction surface area [6]. | - Minimal solvent consumption (µL volumes).- Rapid extraction kinetics.- High enrichment factors [6]. | Pre-concentration of organic pollutants, pesticides, and pharmaceuticals from water samples [6]. |
| Low-Temperature Partitioning (LTP) | A water-miscible solvent is used for extraction, and phase separation is induced by freezing the aqueous phase at low temperatures [7]. | - Simplicity and effectiveness.- Serves as a purification step by freezing out matrix components.- Avoids emulsion formation [7]. | Analysis of pesticides in fruits, vegetables, and analysis of drugs in biological fluids [7]. |
Detailed Experimental Protocols
Protocol 1: Conventional LLE for Bioanalytical UFLC-DAD
This protocol is adapted from the sample preparation for the simultaneous quantification of antiepileptic drugs in human plasma, demonstrating a robust approach for complex biological matrices [2].
1. Reagent and Solution Preparation:
- Aqueous Phase: Adjust the pH of the plasma or buffer solution using acids (e.g., ortho-phosphoric acid) or bases to a value that ensures the analytes are in their neutral form. This is a critical optimization step [2].
- Organic Solvent: Select a suitable water-immiscible solvent such as ethyl acetate or dichloromethane.
- Internal Standard Solution: Prepare a solution of a suitable internal standard (e.g., entacapone) in the organic solvent or a miscible solvent like methanol [2].
2. Extraction Procedure: a. Pipette 200 µL of plasma sample into a microcentrifuge tube. b. Add 50 µL of internal standard solution and vortex mix for 30 seconds. c. Add 500 µL of the selected organic solvent. d. Vortex mix vigorously for 3 minutes to ensure complete partitioning. e. Centrifuge the mixture at 10,000 × g for 5 minutes to achieve clean phase separation. f. Carefully transfer the upper (organic) layer to a new clean tube. g. Evaporate the organic extract to dryness under a gentle stream of nitrogen gas in a water bath at 40°C. h. Reconstitute the dry residue with 100 µL of the UFLC mobile phase initial conditions, vortex for 1 minute, and transfer to an autosampler vial for analysis [2].
3. UFLC-DAD Analysis:
- Column: Reversed-phase C18 column (e.g., 150 mm × 4.6 mm, 5 µm).
- Temperature: 40°C.
- Mobile Phase: Gradient elution with 0.1% ortho-phosphoric acid (pH 2.79) and acetonitrile.
- Flow Rate: 1.0 mL/min.
- Detection: Monitor analytes at their specific λmax (e.g., 320 nm for perampanel, 306 nm for lamotrigine) [2].
Protocol 2: SALLE for Pharmaceutical Analysis
This protocol, suitable for high-throughput analysis in 96-well plates, outlines the extraction of drugs from plasma using acetonitrile and a salting-out agent [5].
1. Reagent Preparation:
- Salting-Out Agent: Prepare a 2 M solution of magnesium sulfate (MgSO₄) or use saturated sodium chloride (NaCl).
- Extraction Solvent: HPLC-grade acetonitrile.
- Calibration Standards: Prepare in blank (drug-free) plasma.
2. Extraction Procedure: a. Transfer 100 µL of plasma (calibrator, quality control, or unknown) to a well of a 96-well plate. b. Add 200 µL of acetonitrile to the well to precipitate proteins. c. Add 50 µL of the 2 M MgSO₄ solution to induce phase separation. d. Seal the plate and mix thoroughly by shaking for 5 minutes. e. Centrifuge the plate at 3,000 × g for 10 minutes to complete phase separation. The acetonitrile layer will form the upper phase. f. Directly inject an aliquot of the upper organic layer into the UFLC-DAD system [5].
Protocol 3: LLE for Carbonyl Compounds in Food Matrices
This method details the extraction of toxic carbonyl compounds (CCs) from heated soybean oil, requiring a derivatization step for analysis [3] [8].
1. Derivatization and Extraction:
- Derivatization Reagent: 2,4-dinitrophenylhydrazine (2,4-DNPH). This reagent reacts with aldehydes and ketones to form stable hydrazones which are easily detectable by UV-Vis and MS [3].
- Extraction Solvent: Acetonitrile was found to be optimal [3].
2. Procedure: a. Weigh approximately 1 g of oil sample into a glass vial. b. Add 1.5 mL of acetonitrile and 0.5 mL of the 2,4-DNPH solution. c. Manually stir the mixture for 3 minutes to ensure thorough contact. d. Sonicate the mixture for 30 minutes to complete the reaction and extraction. e. Centrifuge the mixture, and filter the supernatant through a 0.20 µm membrane before UFLC injection [3].
3. UFLC-DAD-ESI-MS Analysis:
- The hydrazone derivatives are separated using a C18 column with a gradient of water and acetonitrile.
- DAD detection is typically performed at 300-400 nm.
- MS detection is used for confirmation and identification of unknown CCs [3].
The Scientist's Toolkit: Essential Research Reagent Solutions
Table 2: Key Reagents and Materials for LLE Protocols in UFLC-DAD Analysis
| Reagent/Material | Function/Purpose | Application Example |
|---|---|---|
| Acetonitrile | Polar aprotic solvent; used for protein precipitation, as an extraction solvent in SALLE, and for extracting polar compounds [3] [5]. | SALLE of drugs from plasma [5]; Extraction of carbonyls from oil [3]. |
| Ethyl Acetate | Medium-polarity organic solvent; effective for extracting a wide range of medium-polarity organic compounds. | LLE of pharmaceuticals from biological fluids [2]. |
| Magnesium Sulfate (MgSO₄) | Salting-out agent; dissolves in water, reducing the solubility of organic molecules and water-miscible solvents, thereby inducing phase separation [5]. | QuEChERS and SALLE methods for pesticides and drugs [5]. |
| 2,4-Dinitrophenylhydrazine (2,4-DNPH) | Derivatizing agent; reacts with carbonyl functional groups (aldehydes, ketones) to form colored hydrazone derivatives with strong UV absorption [3]. | Analysis of aldehydes (e.g., acrolein, 4-HNE) in oxidized oils [3] [8]. |
| Ortho-Phosphoric Acid | Mobile phase additive; provides low pH to suppress silanol activity in reversed-phase chromatography and to control ionization of acidic/basic analytes [2]. | Mobile phase for separation of antiepileptic drugs [2]. |
| C18 Reversed-Phase Column | Stationary phase; separates analytes based on hydrophobicity, the most common mode for UFLC analysis of organic molecules. | Separation of flavonoids, pharmaceuticals, and carbonyl derivative [2] [9]. |
Workflow Visualization and Data Analysis
The following diagram illustrates the logical decision-making process for selecting and applying the appropriate LLE technique based on the nature of the sample and analytes.
Quantitative Method Performance and Validation
The performance of LLE methods coupled with UFLC-DAD is rigorously validated by key parameters. The following table compiles representative quantitative data from published applications, demonstrating the effectiveness of these techniques.
Table 3: Quantitative Performance of LLE-UFLC-DAD Methods from Literature
| Analytes / Application | LLE Technique | Linear Range (µg/mL) | Recovery (%) | Limit of Detection (LOD) | Reference |
|---|---|---|---|---|---|
| Perampanel & Lamotrigine (Human Plasma) | Conventional LLE | Perampanel: 0.03-4.5Lamotrigine: 0.25-30 | > 89% | Not Specified | [2] |
| Carbonyl Compounds (Soybean Oil) | LLE with Derivatization | 0.2 - 10.0 | 70.7 - 85.0 (at LLOQ) | 0.03 - 0.1 µg/mL | [3] [8] |
| Metoprolol Tartrate (Tablets) | Not Specified (Direct UFLC analysis) | 2 - 14 µg/mL | 98.0 - 102.0% | 0.27 µg/mL | [4] |
The validation of these methods ensures they are fit for purpose. For instance, the method for carbonyl compounds was shown to be precise and accurate, with detection limits low enough to monitor the formation of toxic compounds like acrolein and 4-hydroxy-2-nonenal in thermally stressed oils [3] [8]. Similarly, the LLE method for antiepileptic drugs demonstrated high recovery and a wide linear range, making it suitable for therapeutic drug monitoring [2].
Ultra-Fast Liquid Chromatography with Diode Array Detection (UFLC-DAD) represents a significant advancement in analytical instrumentation that addresses the growing demand for high-throughput analysis without compromising resolution or data integrity. This technology has become indispensable in modern pharmaceutical analysis, particularly in complex research applications such as the analysis of botanical extracts and their metabolites. The core strength of UFLC-DAD lies in its ability to perform rapid separations while simultaneously acquiring comprehensive spectral data for each analyte, enabling both quantification and confirmation in a single analytical run.
The fundamental advantage of UFLC-DAD systems over conventional HPLC stems from their ability to operate at significantly higher pressures (typically up to 6000 psi or greater) while utilizing stationary phases with smaller particle sizes (sub-2μm). This combination facilitates superior chromatographic efficiency and dramatically reduced analysis times. When coupled with the rich three-dimensional data (time-absorption-wavelength) provided by the DAD detector, researchers obtain a powerful analytical tool for method development and validation in complex matrices. The application of this technology is particularly valuable in pharmaceutical research, where it has been successfully employed to identify and quantify numerous compounds in biological samples, as demonstrated in studies analyzing Scutellaria baicalensis (Chinese skullcap) extracts in rat models, where researchers identified 36 different flavonoid compounds and 13 novel metabolites across bile, plasma, and urine matrices [10].
Core Technological Principles
Ultra-Fast Separation Mechanisms
The remarkable speed of UFLC systems originates from fundamental improvements in chromatographic hardware and chemistry. The velocity of separations is primarily achieved through the use of columns packed with smaller porous particles (typically 1.8-2.2μm), which dramatically reduce diffusion paths and resistance to mass transfer. According to the Van Deemter equation, which describes the relationship between linear velocity and plate height, these smaller particles maintain efficiency even at elevated flow rates, allowing for faster separations without significant loss of resolution. The reduced particle size, however, necessitates higher operating pressures to maintain optimal flow rates, requiring specialized pumps and fluidics capable of sustaining pressures up to 6000-10000 psi.
The hydraulic systems in UFLC instruments are engineered for minimal delay volume and rapid mixing, enabling the use of steeper gradient slopes and faster column re-equilibration. Modern UFLC systems typically exhibit delay volumes of 100-200μL, compared to 500-1000μL in conventional HPLC systems. This reduction in delay volume, combined with improved gradient formation technology, allows for gradient cycle times that are 3-5 times faster than conventional systems while maintaining reproducibility. The kinetic performance gains are most evident in the analysis of complex samples, such as in the characterization of Huanglian Jiedu Decoction, where 17 major chemical components were successfully separated and identified using UFLC-DAD-ESI-MS/MS methodologies [10].
Enhanced Resolution Characteristics
Chromatographic resolution (Rs) in UFLC systems demonstrates significant improvement over conventional HPLC due to increased efficiency (theoretical plates, N) and enhanced selectivity (α). The relationship is defined by the resolution equation: Rs = (√N/4) × (α-1) × (k/(1+k)), where k is the retention factor. The sub-2μm particles used in UFLC typically generate 50-70% more theoretical plates per unit time compared to 3-5μm particles used in conventional HPLC. This enhanced efficiency manifests as sharper peaks with reduced peak broadening, leading to improved sensitivity and better separation of closely eluting compounds.
The diode array detector contributes significantly to effective resolution through its spectral discrimination capabilities. Even when chromatographic peaks are not fully separated, the DAD can mathematically resolve co-eluting compounds by identifying wavelength ratios or through spectral deconvolution algorithms. This orthogonal approach to resolution is particularly valuable in complex natural product analyses, such as the metabolic study of naringin following human intestinal bacteria incubation, where multiple metabolites including naringenin, phloretin, and phloroglucinol were identified despite their structural similarities [10]. The DAD achieves this spectral resolution through simultaneous monitoring of multiple wavelengths (typically 190-800nm) with high wavelength accuracy (<1nm) and photometric linearity across a wide concentration range.
Spectral Confirmation Capabilities
The diode array detector provides critical compound identification power through its ability to capture full UV-Vis spectra for each chromatographic peak. This capability transforms the detector from a simple quantification device into a powerful confirmation tool. Unlike single-wavelength or variable wavelength detectors that capture data at only one or a few wavelengths, the DAD simultaneously monitors the entire spectral range throughout the chromatographic run, creating a three-dimensional data array (time-absorbance-wavelength) that contains rich chemical information.
Spectral confirmation occurs through several mechanisms, including spectral matching, peak purity assessment, and spectral contrast techniques. Library matching algorithms compare the spectrum of an unknown peak against a database of reference spectra, generating match factors that help confirm identity. Peak purity algorithms evaluate whether a chromatographic peak represents a single compound or contains co-eluting impurities by comparing spectra across different regions of the peak. In pharmaceutical impurity profiling, these capabilities are particularly valuable for detecting and identifying low-level impurities and degradation products, which is essential for comprehensive impurity assessment as outlined in recent reviews of chemical drug impurity control [11]. The application of these spectral confirmation techniques was demonstrated in the analysis of naringin metabolites, where the DAD helped confirm the identity of specific acetylated derivatives through their characteristic spectral signatures [10].
Integration with Liquid-Liquid Extraction
LLE Protocol for Complex Matrices
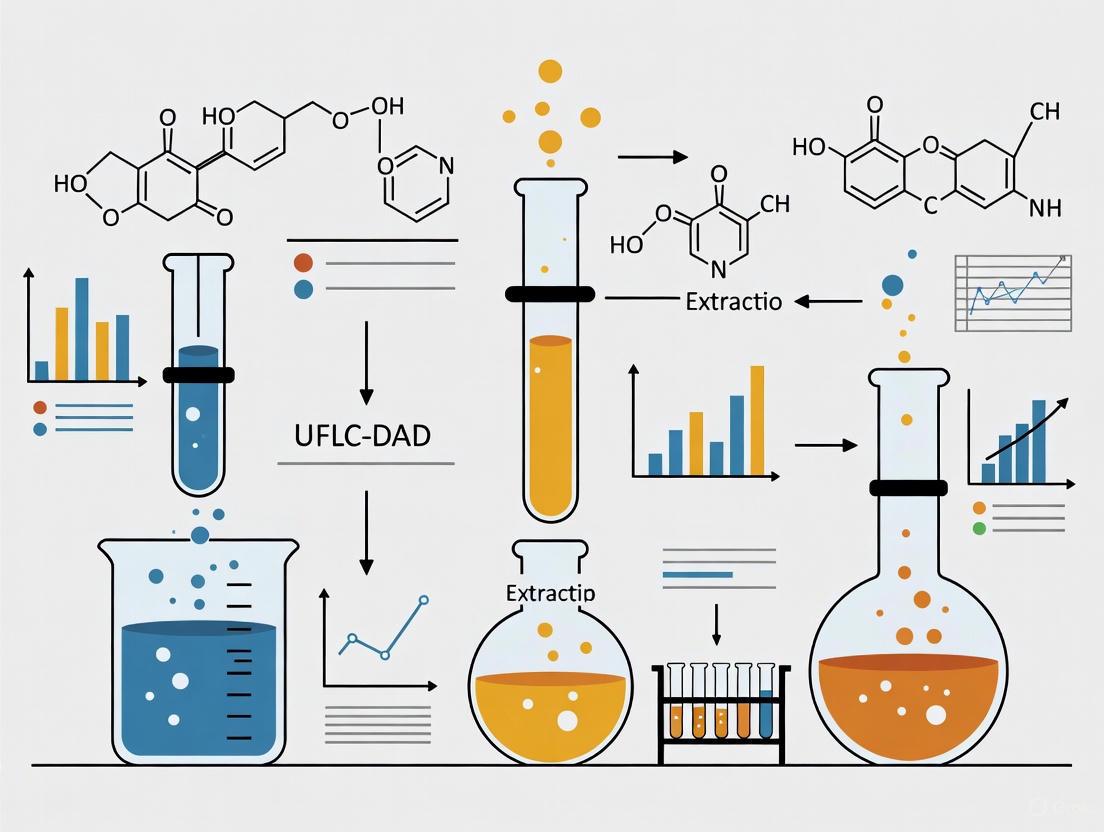
Liquid-liquid extraction (LLE) serves as a crucial sample preparation technique for UFLC-DAD analysis, particularly when dealing with complex biological matrices that contain numerous interfering compounds. The following optimized protocol has been specifically developed for the extraction of flavonoid compounds from biological samples prior to UFLC-DAD analysis, based on methodologies successfully applied in pharmaceutical research [10]:
Sample Preparation: Transfer 1.0 mL of biological sample (plasma, urine, or bile) to a 15 mL glass centrifuge tube. For tissue homogenates, use 500 mg tissue homogenized in 2 mL phosphate buffer (pH 7.4).
Protein Precipitation: Add 3 volumes (3 mL) of ice-cold acetonitrile to the sample. Vortex vigorously for 60 seconds, then centrifuge at 4,500 × g for 10 minutes at 4°C. Carefully transfer the supernatant to a new glass tube.
Extraction Procedure: Add 5 mL of ethyl acetate-diethyl ether mixture (4:1, v/v) to the supernatant. Vortex for 2 minutes, then shake mechanically for 15 minutes. Centrifuge at 3,000 × g for 10 minutes to achieve complete phase separation.
Back-Extraction (Optional): For improved selectivity, perform back-extraction of the organic layer with 2 mL of 0.1 M sodium phosphate buffer (pH 6.0) to remove acidic interferents.
Concentration and Reconstitution: Transfer the organic layer to a clean evaporation tube and evaporate to dryness under a gentle nitrogen stream at 40°C. Reconstitute the residue in 200 μL of initial mobile phase (typically 10% methanol in water). Vortex for 60 seconds and centrifuge at 14,000 × g for 5 minutes before transferring to UFLC vials.
This LLE protocol effectively removes proteins and phospholipids while maintaining high recovery (>85%) for most flavonoid compounds. The sample preparation workflow is visualized in the following diagram:
Figure 1: LLE Workflow for UFLC-DAD Sample Preparation
Method Validation and Quality Control
To ensure reliable integration with UFLC-DAD analysis, the LLE methodology requires comprehensive validation following established pharmaceutical guidelines. Critical validation parameters include:
Extraction Efficiency: Assessed by comparing peak areas of extracted samples against unextracted standards at three concentration levels (low, medium, high). Acceptable recovery should be 85-115% with RSD < 15% for most compounds.
Matrix Effects: Evaluated using the post-extraction spiking technique, calculating the matrix factor (MF) as the peak area ratio of an analyte in matrix versus neat solution. Signal suppression/enhancement should be less than 20%.
Processed Sample Stability: Determined by re-analyzing extracted samples after storage in the autosampler (typically 4°C for 24-48 hours). The deviation from initial analysis should be within ±15%.
Quality control samples prepared at low, medium, and high concentrations should be included in each analytical batch to monitor ongoing performance. For the analysis of complex botanical extracts like Scutellaria baicalensis, additional validation should include metabolite stability assessment under extraction conditions, as some flavonoid metabolites may be susceptible to degradation during sample preparation [10].
Quantitative Performance Data
System Performance Specifications
UFLC-DAD systems demonstrate distinct advantages across multiple performance parameters compared to conventional HPLC, particularly when applied to pharmaceutical analysis. The quantitative performance characteristics are summarized in Table 1, with data compiled from applications in pharmaceutical research including metabolite identification and impurity profiling [10] [11].
Table 1: Comparative Performance Metrics of UFLC-DAD vs. Conventional HPLC
| Performance Parameter | UFLC-DAD System | Conventional HPLC-DAD | Measurement Conditions |
|---|---|---|---|
| Analysis Speed | 3-5x faster | Baseline | Gradient separation of 10 compounds |
| Theoretical Plates | >20,000 per column | 10,000-15,000 per column | 150mm column length, isocratic conditions |
| Peak Capacity | 1.8-2.2x higher | Baseline | 10-minute gradient, 150mm column |
| Pressure Capability | Up to 6,000 psi (415 bar) | 2,900-4,000 psi (200-275 bar) | Maximum system pressure |
| Detection Sensitivity | 2-3x improvement | Baseline | Signal-to-noise ratio for low-abundance compounds |
| Spectral Acquisition Rate | Up to 100 Hz | 10-20 Hz | Full spectrum acquisition |
| Wavelength Accuracy | ±1 nm | ±1-2 nm | Across 190-800 nm range |
| Carryover | <0.05% | 0.1-0.2% | Between consecutive injections |
| Mobile Phase Consumption | 40-60% reduction | Baseline | Per analysis |
The sensitivity improvements are particularly valuable in pharmaceutical applications such as the detection of low-abundance metabolites in biological samples. In the study of Scutellaria baicalensis metabolism, the UFLC-DAD system enabled detection of 15 flavonoid compounds in plasma samples, demonstrating the technique's capability for comprehensive metabolite profiling [10].
Analytical Figures of Merit
The quantitative performance of UFLC-DAD methods for pharmaceutical analysis has been rigorously characterized through validation studies. Table 2 summarizes key figures of merit for representative applications, demonstrating the capability to meet stringent pharmaceutical method requirements.
Table 2: Quantitative Performance for Pharmaceutical Compounds
| Analyte Class | Linear Range (μg/mL) | Correlation Coefficient (R²) | LOD (ng/mL) | LOQ (ng/mL) | Precision (RSD%) | Application Reference |
|---|---|---|---|---|---|---|
| Flavonoid Glycosides | 0.05-50 | 0.9994-0.9999 | 0.1-0.5 | 0.5-1.5 | 1.26-4.77 | Scutellaria analysis [10] |
| Terpene Lactones | 0.01-20 | >0.9990 | 0.05-0.2 | 0.2-0.5 | <5.0 | Botanical extracts |
| Alkaloids | 0.02-100 | >0.9995 | 0.2-1.0 | 0.5-3.0 | 1.5-6.0 | Pharmaceutical formulations |
| Phenolic Acids | 0.1-200 | >0.998 | 0.5-2.0 | 1.5-5.0 | 2.0-8.0 | Herbal medicine profiling |
| Pharmaceutical Impurities | 0.001-1.0 | >0.995 | 0.01-0.05 | 0.03-0.15 | <10.0 | Impurity profiling [11] |
The exceptional linearity and sensitivity demonstrated in these applications highlight why UFLC-DAD has become the technique of choice for quantitative analysis of complex pharmaceutical samples. The method validation for Huanglian Jiedu Decoction analysis demonstrated excellent linearity (R² values of 0.9994-0.9999) across the calibrated range, with precision RSD values of 1.66%-3.67% for repeatability and 1.26%-4.77% for stability [10].
Application Protocols
Method Development Protocol
Developing a robust UFLC-DAD method for pharmaceutical analysis requires systematic optimization of multiple parameters. The following protocol outlines a comprehensive approach for method development:
Sample Preparation Optimization
- LLE Solvent Selection: Test different solvent combinations (ethyl acetate, methyl tert-butyl ether, dichloromethane) with varying polarities to maximize recovery of target analytes.
- pH Adjustment: Adjust sample pH to 2.0, 7.0, and 9.0 using appropriate buffers to evaluate recovery dependence on ionization state.
- Extraction Efficiency: Perform triplicate extractions at low, medium, and high concentrations to determine optimal extraction conditions.
Chromatographic Screening
- Column Selection: Evaluate 3-5 different stationary phases (C18, phenyl-hexyl, polar-embedded C18) with identical dimensions (100mm × 2.1mm, 1.8-2.2μm).
- Mobile Phase Optimization: Test acetonitrile and methanol with different modifiers (formic acid, ammonium formate, ammonium acetate) at concentrations of 0.05-0.2%.
- Gradient Screening: Perform rapid scouting gradients from 5-95% organic phase in 10 minutes to determine optimal starting conditions.
DAD Parameter Configuration
- Spectral Acquisition: Set acquisition range from 200-400nm for most pharmaceutical compounds, extending to 600nm for colored compounds.
- Resolution and Sampling Rate: Configure spectral acquisition rate of 20-40 Hz with 1-2nm spectral resolution for optimal peak characterization.
- Monitoring Wavelengths: Select primary quantification wavelength based on maximum absorbance, with secondary wavelengths for peak purity assessment.
Method Fine-Tuning and Validation
- Gradient Optimization: Adjust gradient slope, shape, and initial/final conditions to achieve critical separation of co-eluting peaks.
- Temperature Optimization: Evaluate separation at 30, 40, and 50°C to assess temperature effects on resolution and backpressure.
- Comprehensive Validation: Validate final method according to ICH guidelines for specificity, linearity, accuracy, precision, and robustness.
This systematic approach to method development was employed in the optimization of analytical methods for complex matrices such as Huanglian Jiedu Decoction, where 17 major chemical components were successfully separated and quantified [10].
System Suitability Testing Protocol
To ensure consistent performance of the UFLC-DAD system for pharmaceutical applications, implement the following system suitability testing protocol before each analytical batch:
Preparation of System Suitability Solution
- Prepare a reference standard containing at least 3 representative analytes covering the polarity range of samples.
- Include one early-eluting, one mid-eluting, and one late-eluting compound to assess overall chromatographic performance.
- Prepare at a concentration that gives 50-75% of the detector's full-scale response at the primary wavelength.
Chromatographic Performance Assessment
- Theoretical Plates (N): Inject system suitability solution and calculate plates for mid-eluting peak: N > 15,000 for 100mm column.
- Tailing Factor (T): Measure for all peaks in suitability solution: T ≤ 1.5 for symmetrical peaks.
- Retention Time Stability: Three consecutive injections should have RSD of retention time ≤ 0.5%.
- Resolution (Rs): Between two closely eluting peaks in suitability solution: Rs ≥ 2.0.
DAD Performance Verification
- Wavelength Accuracy: Verify using holmium oxide or caffeine reference standards: ±1 nm across UV range.
- Photometric Linearity: Five-point calibration from 5-95% of detector saturation: R² ≥ 0.999.
- Spectral Reproducibility: Compare spectra for reference standard across multiple injections: match factor ≥ 995.
Carryover Assessment
- Inject blank solvent following the highest calibration standard: response in blank ≤ 0.2% of highest standard.
This comprehensive suitability testing ensures the UFLC-DAD system performs within specified parameters, which is particularly critical for pharmaceutical applications requiring high data integrity, such as impurity profiling studies that form the foundation of chemical drug safety assessment [11].
Essential Research Reagent Solutions
The successful implementation of UFLC-DAD methods relies on carefully selected reagents and materials that ensure optimal performance and reproducibility. The following table details essential research reagent solutions for pharmaceutical applications integrated with liquid-liquid extraction.
Table 3: Essential Research Reagents for UFLC-DAD Analysis
| Reagent/Material | Specification | Function in Analysis | Application Notes |
|---|---|---|---|
| Acetonitrile (HPLC Grade) | ≥99.9% purity, UV transparent | Primary organic mobile phase component | Low UV cutoff (190-195nm), suitable for low-wavelength detection |
| Methanol (HPLC Grade) | ≥99.9% purity, low carbonyl content | Alternative organic modifier | Higher elution strength for polar compounds, higher UV cutoff (205nm) |
| Water (HPLC Grade) | 18.2 MΩ·cm resistivity, TOC < 5 ppb | Aqueous mobile phase component | Prevents baseline noise and ghost peaks in gradient elution |
| Formic Acid (LC-MS Grade) | ≥99.5% purity, low non-volatile residue | Mobile phase additive for acidic compounds | Enhances ionization in MS-compatible methods, typically 0.05-0.1% |
| Ammonium Acetate (HPLC Grade) | ≥99.0% purity, low UV absorbance | Buffer for pH control in mobile phase | Volatile salt compatible with MS detection, typically 2-10 mM |
| Ethyl Acetate (HPLC Grade) | ≥99.8% purity, low acidic content | Extraction solvent for LLE | Medium polarity solvent for medium-polarity analytes |
| Diethyl Ether (Anhydrous) | ≥99.8% purity, stabilized with BHT | Co-solvent in LLE mixtures | Enhances extraction efficiency for non-polar compounds |
| Phosphate Buffer Salts | ACS reagent grade, low heavy metal content | Biological sample preservation | Maintains pH during extraction, prevents analyte degradation |
The selection of appropriate reagents is critical for maintaining robust system performance, particularly when analyzing complex samples such as herbal medicine extracts where multiple compound classes with varying polarities must be addressed simultaneously [10]. The purity specifications directly impact baseline noise, detection limits, and method reproducibility.
Advanced Applications and Workflows
Impurity Profiling in Pharmaceutical Development
UFLC-DAD has become an indispensable tool for comprehensive impurity profiling in pharmaceutical development, addressing the increasingly stringent requirements for chemical drug quality control. The technology enables simultaneous detection, identification, and quantification of process-related impurities and degradation products at levels as low as 0.03-0.05% of the active pharmaceutical ingredient. The workflow for impurity profiling integrates forced degradation studies with systematic method development to ensure adequate separation of all potential impurities.
The critical role of impurity profiling in pharmaceutical quality control has been extensively documented, with recent reviews highlighting the formation of a mature control procedure for impurity profiles in drugs in China after nearly ten years of continuous development [11]. The impurity assessment process follows a logical decision pathway, as illustrated below:
Figure 2: Impurity Assessment Decision Pathway
Metabolite Identification in Biological Samples
The combination of UFLC separation efficiency with DAD spectral confirmation provides a powerful platform for metabolite identification in complex biological matrices. This application is particularly valuable in pharmaceutical development for understanding drug metabolism and identifying active metabolites. The workflow typically involves:
Sample Collection and Preparation: Biological samples (plasma, urine, bile) are collected at multiple time points following drug administration and processed using optimized LLE protocols.
Chromatographic Separation: UFLC conditions are optimized to separate parent compound and potential metabolites, typically using gradient elution with 0.1% formic acid in water and acetonitrile.
Spectral Analysis: DAD captures full UV-Vis spectra for each chromatographic peak, enabling preliminary identification based on spectral characteristics and shifts compared to parent compound.
Data Interpretation: Metabolites are identified based on retention time shifts, spectral profile changes, and comparison with synthetic standards when available.
This approach was successfully applied in the study of Scutellaria baicalensis metabolism in rats, where 36 different flavonoid compounds were identified, including 13 novel metabolites, with the UFLC-DAD system enabling characterization of metabolic pathways including glucuronidation, sulfation, and methylation [10]. The comprehensive metabolite identification workflow demonstrates how UFLC-DAD serves as an essential tool in modern pharmaceutical research, particularly when studying the complex metabolism of natural products and their potential therapeutic applications.
Liquid-liquid extraction (LLE) serves as a critical sample preparation step prior to Ultra-Fast Liquid Chromatography with Diode Array Detection (UFLC-DAD) analysis. The efficiency of this extraction directly impacts the sensitivity, accuracy, and reliability of the subsequent chromatographic results. Selecting an appropriate extraction solvent requires careful consideration of a triad of interconnected properties: polarity, density, and compatibility with the analytical system. For ionogenic analytes, this selection process becomes more complex, as the pH of the aqueous phase must be controlled to ensure the analyte exists in its neutral form for optimal partitioning into the organic phase [12] [13]. The fundamental goal is to maximize the recovery of target analytes while minimizing the co-extraction of matrix interferences, thereby ensuring the quality of the UFLC-DAD data.
This application note provides a structured framework for selecting and optimizing extraction solvents, with a specific focus on protocols compatible with UFLC-DAD analysis. We summarize key solvent properties in tabular format, detail validated experimental methodologies, and visualize the decision-making workflow to support researchers in developing robust and efficient sample preparation procedures.
Fundamental Principles and Solvent Properties
The Role of Polarity, Density, and System Compatibility
The success of an LLE protocol hinges on understanding the physicochemical properties of both the target analytes and the potential extraction solvents.
- Parity and LogP/D: The partition coefficient (LogP/D) is a crucial predictor of an analyte's distribution between two immiscible phases. A highly positive LogP value indicates a strong preference for the organic phase, while a negative value suggests the analyte will remain in the aqueous phase. The polarity of the extraction solvent should be matched to the polarity of the analyte for maximum recovery. For more polar analytes (lower LogP), a more polar organic solvent is required [12].
- Density: The density of the extraction solvent relative to water determines the physical handling of the LLE procedure. Solvents denser than water (e.g., chloroform, dichloromethane) will form the lower layer, while those lighter than water (e.g., hexane, ethyl acetate, methyl tert-butyl ether [MTBE]) will form the upper layer. This dictates how the phases are separated after extraction [14] [13].
- Compatibility with UFLC-DAD: The chosen solvent must be volatile for easy concentration prior to injection and should not introduce interfering compounds that could generate background noise in the DAD. Strongly UV-absorbing solvents are typically unsuitable. Furthermore, the solvent must be miscible with the initial mobile phase of the chromatographic method to avoid peak distortion [13].
Solvent Property Comparison Table
The following table summarizes the key characteristics of common solvents used in LLE protocols.
Table 1: Properties of Common Liquid-Liquid Extraction Solvents [14] [12] [13]
| Solvent | Polarity Index (P') | Density (g/mL) | Water Solubility | UV Cutoff (nm) | Key Considerations |
|---|---|---|---|---|---|
| n-Hexane | 0.1 | ~0.66 (Lighter) | Very Low | 210 | Excellent for non-polar lipids; highly non-specific. |
| Toluene | 2.4 | ~0.87 (Lighter) | Very Low | 285 | Suitable for aromatics; higher UV cutoff. |
| Methyl tert-butyl ether (MTBE) | 2.5 | ~0.74 (Lighter) | Moderate (~4%) | 210 | Good for medium-polarity analytes; alternative to chloroform. |
| Ethyl Acetate | 4.4 | ~0.90 (Lighter) | ~8% | 260 | Good for a wide polarity range; higher water solubility. |
| Chloroform | 4.1 | ~1.49 (Heavier) | Slightly Soluble | 245 | Traditional for lipids; toxic, forms emulsions. |
| Dichloromethane (DCM) | 3.1 | ~1.33 (Heavier) | Slightly Soluble | 245 | Versatile; denser than water; common health hazard. |
The Scientist's Toolkit: Essential Reagents for LLE Optimization
Table 2: Key Research Reagent Solutions for LLE Protocol Development
| Reagent / Solution | Function in LLE Protocol |
|---|---|
| Ammonium Metavanadate | Derivatization agent for analyzing oxidizing compounds like hydrogen peroxide via UFLC-DAD by forming a detectable complex [15]. |
| 2,4-Dinitrophenylhydrazine (2,4-DNPH) | Derivatization reagent for carbonyl compounds (aldehydes, ketones); forms stable hydrazones for sensitive DAD or MS detection [3]. |
| Acetic Acid / Formic Acid | Acid modifiers used to adjust the pH of the mobile phase or aqueous sample to suppress ionization of acidic/basic analytes, improving peak shape and extraction efficiency [16]. |
| Sodium Sulfate | Inert salt used for "salting out"—increasing the ionic strength of the aqueous phase to decrease analyte solubility and drive partitioning into the organic phase [12]. |
| Ion-Pairing Reagents | Added to the extraction solvent or mobile phase to form neutral complexes with ionic analytes, enabling their extraction into organic solvents [13]. |
Experimental Protocols
Protocol 1: Standard Liquid-Liquid Extraction for UFLC-DAD
This protocol is adapted from methods used for the extraction of drugs and lipids from aqueous matrices [14] [13].
Materials:
- Aqueous sample (e.g., biofluid, extract)
- Organic extraction solvent (e.g., MTBE, Ethyl Acetate, DCM)
- Equipment: Centrifuge tubes, micropipettes, vortex mixer, centrifuge, evaporator (e.g., nitrogen blow-down system)
Procedure:
- Sample Preparation: Transfer a measured volume of the aqueous sample (e.g., 1 mL) into a suitable centrifuge tube.
- pH Adjustment: For ionizable analytes, adjust the pH of the aqueous sample. For basic analytes, set the pH to at least 2 units above the pKa. For acidic analytes, set the pH to at least 2 units below the pKa [12]. Use appropriate buffers for control.
- Solvent Addition: Add a volume of organic extraction solvent. A generic optimum organic-to-aqueous phase ratio to begin optimization is 7:1 [12].
- Extraction: Securely cap the tube and mix vigorously for 1-5 minutes using a vortex mixer to ensure complete contact between the two phases.
- Phase Separation: Centrifuge the mixture at a relative centrifugal force (RCF) of 2000-3000 x g for 5-10 minutes to achieve clean phase separation.
- Solvent Recovery: Carefully collect the organic phase. If the solvent is lighter than water, collect from the top. If denser, collect from the bottom using a micropipette or by draining.
- Concentration (if needed): Gently evaporate the organic extract to dryness under a stream of nitrogen or in a vacuum concentrator.
- Reconstitution: Reconstitute the dry residue in a solvent that is compatible with the initial UFLC-DAD mobile phase (e.g., methanol, acetonitrile, or a mixture with aqueous buffer).
- Analysis: Inject the reconstituted sample into the UFLC-DAD system.
Protocol 2: Dispersive Liquid-Liquid Microextraction (DLLME)
DLLME is a miniaturized, efficient technique ideal for sample-limited situations or for achieving high pre-concentration factors, as demonstrated in pesticide and carbonyl compound analysis [3] [17].
Materials:
- Aqueous sample
- Extraction solvent (high-density, water-immiscible, e.g., chlorobenzene, carbon tetrachloride)
- Disperser solvent (water-miscible, e.g., acetone, acetonitrile, methanol)
- Equipment: Conical-bottom centrifuge tubes, syringes, centrifuge
Procedure:
- Solution Preparation: In a syringe, rapidly draw a mixture containing the disperser solvent (e.g., 1 mL of acetone) and the extraction solvent (e.g., 50 µL of chlorobenzene).
- Injection: Quickly inject this mixture into a centrifuge tube containing the aqueous sample (e.g., 5 mL). A cloudy solution will form, consisting of fine droplets of the extraction solvent dispersed throughout the aqueous phase, providing a large surface area for rapid extraction.
- Centrifugation: Centrifuge the tube for a short period (e.g., 2-5 minutes at high speed) to sediment the dense extraction solvent droplets at the bottom of the conical tube.
- Analysis: The sedimented phase can be directly injected or diluted with a compatible solvent for UFLC-DAD analysis.
Workflow and Decision Pathways
The following diagram illustrates the logical decision process for selecting an appropriate extraction solvent and technique.
Diagram 1: Solvent Selection and LLE Workflow
Advanced Optimization and Troubleshooting
Employing Experimental Design (DoE) for Method Optimization
For robust method development, a one-factor-at-a-time (OFAT) approach can be inefficient. Utilizing a Design of Experiments (DoE) approach allows for the simultaneous evaluation of multiple factors and their interactions, making the optimization process faster and more systematic [16]. Critical factors to investigate in a factorial design for LLE include:
- Extraction solvent type and volume
- pH of the aqueous phase
- Ionic strength (concentration of salting-out agent)
- Extraction time (mixing duration)
Troubleshooting Common LLE Challenges
- Low Recovery: Confirm the pH is correctly set for ionizable analytes. Increase the extraction time or vigor. Consider a solvent with more matched polarity, or use a mixed solvent system. Implement multiple extractions with fresh solvent.
- Emulsion Formation: This is a common issue with complex matrices. Remedies include centrifugation at higher speed, adding a small amount of salt, gently swirling the container, or using a different, less emulsion-prone solvent like MTBE [13].
- High Background Noise in UFLC-DAD Chromatogram: Ensure the extraction solvent is of high purity (HPLC grade) and is sufficiently volatile to be completely removed during the concentration step. A "back-extraction" or a clean-up step using solid-phase extraction (SPE) may be necessary to remove co-extracted interferences [13].
Selecting the optimal extraction solvent is a critical, multi-parameter decision that balances polarity, density, and system compatibility to ensure successful UFLC-DAD analysis. By leveraging the fundamental principles, standardized protocols, and structured workflow outlined in this application note, researchers can systematically develop and optimize LLE methods. This approach enhances extraction efficiency, improves data quality, and accelerates progress in drug development and other analytical research fields.
The Synergy Between LLE Clean-up and UFLC-DAD Detection
In modern analytical chemistry, the combination of sample preparation and detection techniques is pivotal for the accurate quantification of target analytes in complex matrices. Liquid-Liquid Extraction (LLE) is a robust sample clean-up procedure that effectively isolates and purifies analytes from interfering substances. When coupled with Ultra-Fast Liquid Chromatography Diode Array Detection (UFLC-DAD), it creates a powerful analytical synergy. This protocol details the application of this combined methodology for the detection of organophosphate pesticide (OP) metabolites in human urine, a critical application for human biomonitoring and exposure risk assessment [18].
The principle of this synergy is straightforward: the LLE clean-up reduces matrix effects and concentrates the analytes, which in turn allows the UFLC-DAD system to operate at its maximum potential, providing high-resolution separation, sensitive detection, and reliable quantification [18]. This is especially crucial for biological samples like urine, which contain numerous endogenous compounds that can interfere with analysis.
Experimental Protocols
Key Reagent Solutions
The following table lists the essential reagents and materials required for the LLE and UFLC-DAD analysis of dialkyl phosphate (DAP) metabolites.
Table 1: Essential Research Reagents and Materials
| Reagent/Material | Function/Application |
|---|---|
| Ethyl Acetate | Extraction solvent for LLE [18] |
| Acetonitrile (ACN) | Reconstitution solvent for the dried extract prior to UFLC-DAD analysis [18] |
| DAP Metabolite Standards | Reference standards for calibration (e.g., DEP, DETP, DEDTP, DMP, DMTP, DMDTP) [18] |
| Ultrapure Water | Component of mobile phase for chromatography |
| C18 Chromatography Column | Reversed-phase stationary phase for UFLC separation [19] |
Detailed LLE Clean-up Procedure for Urine Samples
This protocol is optimized for the extraction of six DAP metabolites from human urine [18].
- Sample Aliquot: Transfer a 200 µL volume of the urine sample into a 2 mL Eppendorf tube.
- Internal Standard Addition: Add 100 µL of the internal standard solution to the urine sample. The use of an internal standard corrects for variability in the extraction and analysis process.
- Extraction: Add 800 µL of cold ethyl acetate to the tube.
- Mixing: Vigorously shake the mixture for 1 minute to ensure thorough contact between the organic and aqueous phases.
- Precipitation: Place the mixture on ice for 10 minutes to precipitate interfering proteins and other substances.
- Centrifugation: Centrifuge the sample at 10,000 rpm for 10 minutes. This step separates the organic layer (supernatant) from the aqueous and precipitated pellet.
- Collection: Carefully transfer the resulting supernatant (organic layer) to a new 10 mL tube.
- Evaporation: Dry the supernatant under a gentle stream of nitrogen gas.
- Reconstitution: Reconstitute the dried extract with 500 µL of acetonitrile (ACN) to make it compatible with the UFLC system.
- Analysis: Transfer the reconstituted solution to a vial for injection into the UFLC-DAD system.
The following workflow diagram illustrates the LLE clean-up procedure:
Instrumental Analysis: UFLC-DAD Conditions
The following parameters are recommended for the chromatographic separation and detection of DAP metabolites. These are based on typical UFLC-DAD configurations [20] and the requirements for separating small, polar molecules [18].
- Chromatography System: UFLC system (e.g., Shimadzu Prominence series) [20].
- Detection: Diode Array Detector (DAD). Wavelength selection depends on the absorbance characteristics of the target analytes. For compounds lacking strong chromophores, a low wavelength (e.g., 200-210 nm) may be necessary [21].
- Column: Reversed-phase C18 column [19].
- Mobile Phase: A binary gradient is typically used, consisting of:
- Gradient Program: A typical gradient may start with a high percentage of aqueous phase and ramp to a high percentage of organic phase to elute less polar compounds. The specific profile must be optimized for the target DAP metabolites [21].
- Flow Rate: 0.2 - 0.5 mL/min [21].
- Column Temperature: 25 °C [21].
- Injection Volume: 1 - 10 µL [18].
Results and Data Presentation
Performance Metrics of the LLE-UFLC-DAD Method
The combination of LLE and UFLC-DAD has been rigorously validated for the analysis of DAP metabolites in urine. The table below summarizes key performance data, demonstrating the effectiveness of this synergistic approach [18].
Table 2: Validation Data for LLE-UFLC-DAD Analysis of DAP Metabolites
| Parameter | Value / Range | Notes |
|---|---|---|
| Analytes | DEP, DETP, DEDTP, DMP, DMTP, DMDTP | Six dialkyl phosphate metabolites [18] |
| Recovery Rate | 93% - 102% | Indicates high extraction efficiency of the LLE procedure [18] |
| Repeatability (RSD) | 0.62% - 5.46% | High precision of the method [18] |
| Limit of Detection (LOD) | 0.0201 - 0.0697 ng/mL | High sensitivity for trace-level analysis [18] |
| Limit of Quantification (LOQ) | 0.0609 - 0.2112 ng/mL | [18] |
| Linearity (R²) | > 0.996 | Reliable quantification across the calibration range [18] |
| Sample Volume | 200 µL | Requires less sample than alternative methods [18] |
| Extraction Time | Short | Contributes to high throughput [18] |
Comparative Analysis of Sample Preparation Techniques
LLE was selected after a comprehensive evaluation against other common extraction techniques. The following table compares LLE with QuEChERS and lyophilization for this specific application, highlighting the advantages of LLE in this context [18].
Table 3: Comparison of Sample Preparation Methods for DAP Metabolites
| Method | Recovery | Matrix Effect | Ease of Use | Extraction Time |
|---|---|---|---|---|
| Liquid-Liquid Extraction (LLE) | High [18] | Low [18] | Easy to handle [18] | Short [18] |
| QuEChERS | Lower than LLE [18] | Higher than LLE [18] | Moderate | Moderate |
| Lyophilization | Lower than LLE [18] | Higher than LLE [18] | Requires specialized equipment | Long |
Discussion
The Synergistic Workflow
The synergy between LLE and UFLC-DAD is not merely sequential but integrative. The LLE clean-up protocol directly enhances the performance of the subsequent UFLC-DAD analysis by providing a purified sample, which leads to cleaner chromatograms, reduced baseline noise, and enhanced signal-to-noise ratios for the target analytes. This process is summarized in the following logic diagram.
Application in Human Biomonitoring
The validated LLE-UFLC-DAD method has been successfully applied to analyze 150 urine samples from farmers and non-farmers, proving its utility in real-world biomonitoring studies [18]. The method's high sensitivity allows for the detection of trace-level metabolites, which is essential for assessing exposure to low doses of organophosphate pesticides, associated with various adverse health effects including neurological disorders and endocrine disruption [18]. The robustness of the method, evidenced by its high recoveries and precision, ensures that the data generated is reliable for risk assessment and public health decision-making.
This application note has detailed a robust and efficient protocol combining LLE clean-up with UFLC-DAD detection for analyzing pesticide metabolites in a complex biological matrix. The demonstrated synergy between these techniques results in a method that is sensitive, precise, and practical for high-throughput laboratories. The key advantages include reduced sample and solvent consumption, shorter analysis times, and superior performance characteristics compared to alternative sample preparation methods. This makes the LLE-UFLC-DAD combination a powerful tool for advancing research in environmental exposure assessment, toxicology, and public health.
Step-by-Step LLE Protocol Development for UFLC-DAD
Within the context of developing a robust liquid-liquid extraction (LLE) protocol for Ultra-Fast Liquid Chromatography with Diode-Array Detection (UFLC-DAD) analysis, systematic method development is paramount. This process ensures the reliability, accuracy, and reproducibility of analytical results, which are critical for researchers, scientists, and drug development professionals. A meticulously developed method minimizes analytical variability, providing confidence in data used for critical decisions in pharmaceutical development and quality control. This application note details a step-by-step protocol from initial sample preparation to final chromatographic injection, with a specific focus on LLE as a sample preparation technique.
The Scientist's Toolkit: Essential Research Reagents and Materials
The following table catalogues the essential materials and reagents required for the liquid-liquid extraction and subsequent UFLC-DAD analysis.
Table 1: Key Research Reagent Solutions and Essential Materials
| Item | Function/Brief Explanation |
|---|---|
| Aqueous Sample | The matrix containing the analytes of interest (e.g., plasma, urine, buffer solution). |
| Organic Solvent (e.g., Ethyl Acetate, Diethyl Ether) | Immiscible solvent used to extract analytes from the aqueous phase based on solubility and partition coefficient. |
| Acid/Base Modifiers | Reagents (e.g., acetic acid, ammonium hydroxide) used to adjust sample pH, manipulating analyte polarity to enhance extraction efficiency [2]. |
| Internal Standard Solution | A known compound, not present in the original sample, added to correct for variability during sample processing and instrument analysis. |
| UFLC-DAD System | The analytical instrument for separation (chromatography) and detection; the DAD provides spectral confirmation of analyte identity [16]. |
| Analytical Standards | High-purity compounds used for calibration, identification, and quantification of target analytes. |
Experimental Workflow and Protocol
This section outlines the comprehensive methodology for sample preparation via LLE and analysis via UFLC-DAD.
Detailed Liquid-Liquid Extraction Protocol
- Sample Pre-treatment: Transfer a precise volume (e.g., 1.0 mL) of the aqueous sample (e.g., plasma) into a suitable glass tube.
- Internal Standard Addition: Add a known, precise volume of the internal standard solution to the sample. Vortex mix thoroughly to ensure homogeneity.
- pH Adjustment: Adjust the pH of the sample using an appropriate acid or base modifier. For instance, add 50 µL of acetic acid to achieve a pH of 3.5, which can optimize the extraction of certain ionizable compounds [2].
- Solvent Addition: Add a measured volume of the selected organic solvent (e.g., 5 mL of ethyl acetate) to the sample tube.
- Extraction: Seal the tube and agitate vigorously for a predetermined time (e.g., 10 minutes) using a mechanical shaker or vortex mixer to facilitate the partitioning of analytes into the organic phase.
- Phase Separation: Centrifuge the tubes (e.g., at 4000 rpm for 10 minutes) to achieve clean separation of the organic and aqueous layers.
- Collection: Carefully transfer the upper organic layer to a new, clean tube, avoiding the aqueous phase and any interfacial precipitate.
- Evaporation and Reconstitution: Evaporate the organic extract to dryness under a gentle stream of nitrogen gas in a warm water bath. Reconstitute the dry residue with a precise, small volume of the UFLC mobile phase or a compatible solvent (e.g., 200 µL of methanol-water mixture). Vortex mix thoroughly to dissolve the residue.
- Filtration: Transfer the reconstituted solution to an autosampler vial, potentially using a syringe filter (e.g., 0.22 µm) to remove any particulate matter prior to injection.
UFLC-DAD Method Development and Optimization
The transition from HPLC to UFLC allows for higher efficiency and shorter run times through the use of columns packed with smaller particles and systems that operate at higher pressures [16]. The development of the chromatographic method can be significantly accelerated by employing a Design of Experiments (DoE) approach, such as factorial design, which allows for the simultaneous evaluation of multiple factors to establish optimal conditions more practically and rationally than a traditional one-factor-at-a-time empirical approach [16].
- Factor Selection: Identify critical chromatographic parameters as factors for the DoE. These typically include:
- Mobile Phase Composition: The ratio of organic solvent (e.g., methanol, acetonitrile) to aqueous buffer.
- Mobile Phase pH: The pH of the aqueous buffer, which can significantly impact the ionization and retention of ionizable analytes.
- Column Temperature: The temperature of the analytical column.
- Flow Rate: The rate of the mobile phase.
- Experimental Design: Create a factorial design (e.g., a 2^3 full factorial design) to systematically study the selected factors and their interactions.
- Execution and Analysis: Run the experiments as per the design and analyze the responses, such as peak resolution, tailing factor, and runtime. Use statistical analysis to identify significant factors and determine the optimal chromatographic conditions.
- Final Chromatographic Conditions (Example): Based on the optimization, a final method might be established. For instance:
- Column: A C18 column (e.g., 100 mm x 2.1 mm, 1.7 µm particles).
- Mobile Phase: Methanol and water (e.g., 60:40, v/v), pH adjusted to 3.5 with acetic acid [16].
- Flow Rate: 0.3 mL/min.
- Temperature: 30 °C.
- Detection: DAD with monitoring at the wavelength of maximum absorbance for the analytes (e.g., 290 nm).
- Injection Volume: 5 µL.
Data Presentation: Method Validation Parameters
Upon development, the analytical method must be validated to confirm its suitability for intended use. The following table summarizes typical validation parameters and results, based on data from analogous studies [16].
Table 2: Summary of Validation Parameters for a Representative UFLC-DAD Method
| Validation Parameter | Result for Compound A | Result for Compound B | Result for Compound C |
|---|---|---|---|
| Linearity (R²) | 0.9995 | 0.9999 | 0.9994 |
| Accuracy (% Recovery) | 99.71 - 100.46% | 98.69 - 101.47% | 99.71 - 100.22% |
| Precision (% RSD) | |||
| Intra-day | 1.48% | 2.00% | 1.24% |
| Inter-day | 2.81% | 1.56% | 2.20% |
| Robustness (Variation in Flow Rate) | Area RSD: 2.07% | Area RSD: 2.34% | Area RSD: 2.54% |
| Specificity (Similarity Index) | 979 | 973 | 959 |
Workflow and Optimization Strategy Visualization
Systematic LLE Workflow from Sample to Analysis
DoE for UFLC Method Optimization
Optimizing Solvent Systems for Different Analytic Classes (Acidic, Basic, Neutral)
The efficacy of Ultra-Fast Liquid Chromatography with Diode Array Detection (UFLC-DAD) analysis is fundamentally dependent on the preceding sample preparation, where solvent selection plays a critical role. Liquid-Liquid Extraction (LLE) serves as a powerful technique to isolate, concentrate, and clean up analytes from complex matrices, thereby enhancing chromatographic performance and detector sensitivity. The core principle of LLE is the differential partitioning of analytes between two immiscible liquid phases—typically an aqueous phase and a water-immiscible organic solvent. Successful extraction hinges on maximizing the distribution constant (K_D), which describes the ratio of an analyte's concentration in the organic phase to its concentration in the aqueous phase at equilibrium [22].
Optimization must account for the distinct physicochemical properties of acidic, basic, and neutral compounds. For ionizable analytes (acids and bases), the solution pH is the primary parameter controlling their extraction efficiency, as it determines the fraction of molecules present in the neutral, extractable form. For all analyte classes, the intrinsic hydrophobicity, often quantified by the LogP value, and the polarity of the extraction solvent are equally critical [12]. This document provides a structured framework, complete with actionable protocols and data tables, to guide the systematic optimization of solvent systems for comprehensive drug development research.
Theoretical Foundations
Key Physicochemical Parameters
The design of an efficient LLE protocol is guided by two essential physicochemical properties of the target analytes.
- LogP/D: The partition coefficient, LogP (for neutral compounds) or LogD (for ionizable compounds at a specific pH), is a measure of hydrophobicity. It represents the logarithm of the ratio of an analyte's concentration in a water-immiscible organic solvent (typically n-octanol) to its concentration in the aqueous phase. A highly positive LogP/D value (e.g., >3) indicates a strong preference for the organic phase, facilitating easy extraction. Conversely, a low or negative LogP/D value (e.g., <1) signifies high hydrophilicity, which presents a challenge for extraction and may require a more polar solvent or salting-out strategies [12].
- pKa: The acid dissociation constant is crucial for ionizable analytes. It is the pH at which half of the molecules are in their ionized form and half are neutral. For acidic analytes, the neutral, protonated species (HA) is extractable, while the charged, deprotonated conjugate base (A⁻) is not. For basic analytes, the neutral, deprotonated species (B) is extractable, whereas the charged, protonated conjugate acid (BH⁺) is not. The relationship between pH, pKa, and the fraction of neutral species is given by the Henderson-Hasselbalch equation [12]:
- For acids: (\text{pH} = \text{p}Ka + \log\frac{[\text{A}^-]}{[\text{HA}]})
- For bases: (\text{pH} = \text{p}Ka + \log\frac{[\text{B}]}{[\text{BH}^+]})
Solvent Properties and Selection
The choice of organic solvent is paramount. An ideal extraction solvent should have low solubility in water (<10%), high volatility for easy post-extraction concentration, high purity to avoid interfering peaks, and compatibility with the subsequent UFLC-DAD analysis (e.g., low UV cutoff) [22]. Most importantly, its polarity and hydrogen-bonding properties should match those of the target analytes to maximize K_D. The following table summarizes common solvents used in LLE.
Table 1: Properties of Common Liquid-Liquid Extraction Solvents
| Solvent | Polarity Index (P') | Water Solubility (%) | UV Cutoff (nm) | Density (g/mL) | Common Applications |
|---|---|---|---|---|---|
| n-Hexane | 0.1 | 0.001 | 210 | 0.66 | Extraction of very non-polar compounds (e.g., lipids, hydrocarbons). |
| Toluene | 2.4 | 0.05 | 285 | 0.87 | Extraction of aromatic and moderately non-polar compounds. |
| Diethyl Ether | 2.8 | 6.0 | 220 | 0.71 | Extraction of medium-polarity compounds. Caution: Highly flammable. |
| Dichloromethane | 3.1 | 1.6 | 245 | 1.33 | General-purpose solvent for a wide range of medium-polarity analytes. |
| Ethyl Acetate | 4.4 | 8.7 | 260 | 0.90 | Excellent for polar to medium-polarity compounds; commonly used for drug extraction. |
| Chloroform | 4.1 | 0.8 | 245 | 1.50 | Used for medium-polarity compounds; can form hydrogen bonds. |
| 1-Butanol | 3.9 | 7.7 | 215 | 0.81 | Suitable for more hydrophilic analytes due to higher polarity [12] [22]. |
For polar analytes with low LogP values, selecting an organic solvent with a higher polarity index (such as ethyl acetate or 1-butanol) is necessary to achieve satisfactory recovery [12]. Furthermore, solvent mixtures can be employed to fine-tune selectivity and recovery. An optimum-polarity organic solvent can be selected conveniently by blending two solvents of different polarity (for example, hexane and chloroform), and measuring K_D versus the composition of the organic phase [22].
Optimized Protocols by Analyte Class
Protocol for Acidic Analytics
This protocol is designed for the extraction of organic acids (e.g., carboxylic acids, phenolic compounds). The key is to suppress ionization by adjusting the aqueous phase to a pH where the acid exists predominantly in its neutral form.
Workflow Overview:
Step-by-Step Procedure:
- Sample Preparation: Transfer a measured volume of the aqueous sample (e.g., 1-5 mL) into a suitable glass vial or test tube.
- pH Adjustment: Adjust the pH of the aqueous sample to at least 1.5–2.0 units below the pKa of the target acidic analyte(s). For example, for benzoic acid (pKa ≈ 4.2), adjust the pH to ~2.2. This can be done using a concentrated phosphoric acid or hydrochloric acid solution. Verify the final pH with a calibrated pH meter or micro-pH probe [12] [22].
- Organic Solvent Addition: Add a measured volume of the selected organic solvent. A generic optimum organic-to-aqueous phase ratio is often 7:1 [12]. For a 2 mL sample, this would require ~14 mL of solvent. For high-concentration samples or analytes with very high K_D, this ratio can be reduced.
- Mixing and Phase Separation: Cap the vial and mix vigorously for 2-5 minutes, using a vortex mixer or mechanical shaker, to ensure thorough contact between the phases and establish equilibrium. Allow the phases to separate completely. If an emulsion forms, centrifugation at 3000–5000 rpm for 2-5 minutes can aid in phase separation [22].
- Collection: Transfer the organic phase (the upper layer for low-density solvents like ethyl acetate, the lower layer for high-density solvents like DCM) to a clean vial.
- Analysis: The organic extract can be directly injected into the UFLC-DAD system if the solvent is compatible with the mobile phase. Otherwise, evaporate the solvent under a gentle stream of nitrogen or air and reconstitute the residue in the initial mobile phase.
Protocol for Basic Analytics
This protocol targets organic bases (e.g., amines, alkaloids). The principle is to ensure the basic analyte is in its neutral, deprotonated form to facilitate partitioning into the organic phase.
Workflow Overview:
Step-by-Step Procedure:
- Sample Preparation: Transfer a measured volume of the aqueous sample into a vial.
- pH Adjustment: Adjust the pH of the aqueous sample to at least 1.5–2.0 units above the pKa of the target basic analyte(s). For an amine with a pKa of 9.5, adjust the pH to ~11.5. This is typically achieved using sodium hydroxide or sodium carbonate solution [12] [22].
- Organic Solvent Addition: Add the selected organic solvent at the desired phase ratio (e.g., 7:1 organic-to-aqueous).
- Mixing and Phase Separation: Mix vigorously for 2-5 minutes. Allow phases to separate, using centrifugation if necessary.
- Collection: Transfer the organic phase to a clean vial.
- Analysis: Proceed with direct injection or solvent evaporation/reconstitution as described for acidic analytes.
Protocol for Neutral Analytics
The extraction of neutral compounds is the most straightforward, as their partitioning is not influenced by pH. Recovery depends solely on their LogP value and the polarity of the organic solvent.
Step-by-Step Procedure:
- Sample Preparation: Transfer the aqueous sample to a vial. No pH adjustment is required.
- Organic Solvent Addition: Add an organic solvent selected from Table 1 based on the analyte's polarity. A solvent like dichloromethane or ethyl acetate is often a good starting point for neutral compounds of medium polarity.
- Mixing and Phase Separation: Mix vigorously for 2-5 minutes. Allow phases to separate.
- Collection: Transfer the organic phase to a clean vial.
- Analysis: Proceed with direct injection or solvent evaporation/reconstitution.
Table 2: Summary of Optimization Strategies by Analyte Class
| Analyte Class | Key Parameter | Optimal Condition | Recommended Solvents | Notes |
|---|---|---|---|---|
| Acidic | Aqueous pH | pH ≤ pK_a - 2 | Ethyl Acetate, Dichloromethane | Ensures >99% of acid is in neutral (HA) form. |
| Basic | Aqueous pH | pH ≥ pK_a + 2 | Dichloromethane, Chloroform, Toluene | Ensures >99% of base is in neutral (B) form. |
| Neutral | Solvent Polarity | Match analyte polarity | See Table 1; Ethyl Acetate is a versatile choice. | Extraction efficiency is independent of pH. |
Advanced Optimization and Enhancement Techniques
Salting-Out Effect
The addition of high concentrations of inert, neutral salts (e.g., sodium chloride, sodium sulfate, ammonium sulfate) to the aqueous sample can significantly improve the recovery of hydrophilic analytes. This "salting-out" effect reduces the solubility of the analytes in the aqueous phase by competing for water molecules, thereby driving them into the organic phase [12] [22]. Studies have successfully used sodium chloride to saturate sample solutions, improving the recovery of phenolic compounds into the organic phase [23].
Protocol: After pH adjustment, add a salt such as sodium chloride to the aqueous sample to achieve a concentration of 3–5 M (e.g., ~0.3–0.5 g per mL of sample). Vortex until the salt is fully or nearly saturated, then proceed with the addition of the organic solvent and the rest of the LLE steps.
Back-Extraction for Selectivity
Back-extraction is a powerful technique to enhance the purity of the final extract, which is crucial for analyzing complex matrices. It involves a second extraction step where the target analytes are transferred back into a fresh aqueous phase, leaving many interfering neutral and charged compounds behind [12] [22].
Protocol for a Basic Analyte:
- Perform the initial LLE for basic analytes as described in Section 3.2. The basic analytes will be in the organic phase.
- Transfer the organic phase to a new vial containing a fresh, acidic aqueous buffer (e.g., pH 2–4, adjusted with phosphoric or hydrochloric acid).
- Mix vigorously and allow the phases to separate. The basic analytes will now be protonated (charged) and will partition back into the acidic aqueous phase.
- Collect this new aqueous phase. For UFLC analysis, this aqueous solution can often be injected directly. Alternatively, adjust its pH back to basic conditions and perform a final LLE to concentrate the analytes into a small volume of organic solvent.
Dispersive Liquid-Liquid Microextraction (DLLME)
DLLME is a miniaturized, rapid, and highly efficient version of LLE. It involves the rapid injection of a mixture of an extraction solvent (denser than water) and a disperser solvent (miscible with both) into an aqueous sample. This forms a cloudy solution of fine extraction solvent droplets, providing a vast surface area for instantaneous analyte extraction [24].
Protocol:
- Rapidly inject a mixture consisting of a few tens of microliters of extraction solvent (e.g., chlorobenzene, 1,1,2-trichloroethane) and around 1 mL of disperser solvent (e.g., acetone, methanol) into a 5 mL aqueous sample.
- A cloudy solution forms immediately. Gently mix to allow for extraction.
- Centrifuge to sediment the dense extraction solvent droplets at the bottom of the tube.
- Carefully collect a portion of the sedimented phase with a micro-syringe for analysis [22] [25].
The Scientist's Toolkit: Essential Research Reagent Solutions
Table 3: Key Reagents and Materials for LLE Protocol Development
| Reagent/Material | Function/Application | Example Usage & Notes |
|---|---|---|
| LogP/D & pK_a Databases | Provides essential physicochemical data for initial method design. | ChemSpider, Chemicalize; used to predict extraction behavior and set initial pH [12]. |
| Buffering Agents | To precisely control the pH of the aqueous phase. | Phosphate, acetate, and carbonate buffers; crucial for ionizable analytes. |
| Salting-Out Agents | To decrease analyte solubility in the aqueous phase and improve recovery. | Sodium Chloride (NaCl), Sodium Sulfate (Na₂SO₄); used at near-saturation concentrations [12] [23]. |
| Ionic Liquids | Green alternative extraction solvents for microextraction techniques. | e.g., [C₆MIM][PF₆]; used in DLLME for sensitive analysis of pesticides and other contaminants [24]. |
| Derivatization Agents | To convert polar, hard-to-extract analytes into less polar, extractable derivatives. | Butyl Chloroformate; used to derivative primary amines for GC or HPLC analysis, improving extraction and chromatographic behavior [25]. |
The systematic optimization of solvent systems for LLE, grounded in the fundamental principles of analyte chemistry, is a prerequisite for robust and sensitive UFLC-DAD analysis. By strategically manipulating pH for ionizable compounds, carefully selecting solvents based on polarity, and employing advanced techniques such as salting-out and back-extraction, researchers can achieve high recovery and exceptional sample clean-up. The protocols and data tables provided herein serve as a comprehensive guide for developing and refining LLE methods tailored to acidic, basic, and neutral analyte classes within a drug development research context, ultimately ensuring the generation of high-quality chromatographic data.
In the development of robust liquid-liquid extraction (LLE) protocols for UFLC-DAD analysis, two parameters frequently emerge as critical determinants of success: pH adjustment and ionic strength. These factors exert profound influence over the partitioning behavior of analytes between immiscible liquid phases, directly impacting extraction efficiency, selectivity, and overall method performance. Proper manipulation of the aqueous phase environment enables analytical chemists to optimize the recovery of target compounds while minimizing co-extraction of interfering matrix components. This application note provides a structured framework for systematically investigating and optimizing these crucial parameters within the context of sample preparation for UFLC-DAD analysis, with specific applications drawn from recent scientific literature.
Theoretical Foundations
The efficiency of liquid-liquid extraction fundamentally depends on the differential solubility of analytes between two immiscible phases. pH adjustment directly modulates the ionization state of ionizable analytes, thereby altering their partition coefficients. For acidic compounds, low pH environments suppress ionization, increasing their affinity for organic solvents, while basic compounds exhibit enhanced extraction at elevated pH levels. This principle enables selective extraction of specific compound classes through precise pH control [26].
Ionic strength modification influences extraction efficiency through two primary mechanisms: the salting-out effect and solution dielectric constant alteration. The addition of neutral salts such as sodium chloride decreases the solubility of organic compounds in the aqueous phase, effectively driving them into the organic extractant. Simultaneously, increased ionic strength can modify the physical properties of the aqueous phase, potentially affecting mass transfer kinetics and phase separation behavior [27] [28].
Experimental Protocols
Systematic Optimization of pH and Ionic Strength
Materials and Reagents:
- Aqueous sample solution containing target analytes
- Hydrochloric acid (HCl) solution (0.1-1.0 M)
- Sodium hydroxide (NaOH) solution (0.1-1.0 M)
- Sodium chloride (NaCl) or other suitable salts
- Organic extraction solvent (ethyl acetate, dichloromethane, or similar)
- pH meter with calibrated electrode
- Centrifuge tubes with tight-sealing caps
- Centrifuge
- Vortex mixer
Procedure:
- Sample Preparation: Aliquot identical volumes of sample solution into a series of centrifuge tubes.
- pH Adjustment: Systematically adjust the pH of each tube across a relevant range (e.g., pH 2-10) using HCl or NaOH solutions. Monitor pH carefully with a calibrated pH meter.
- Ionic Strength Modification: To subsets of pH-adjusted samples, add varying amounts of NaCl (0-30% w/v) to create a matrix of pH and ionic strength conditions.
- Extraction: Add precisely measured volumes of organic extraction solvent to each tube (typical phase ratios 1:1 to 1:5 aqueous:organic).
- Equilibration: Securely cap tubes and mix thoroughly using a vortex mixer for 1-5 minutes.
- Phase Separation: Centrifuge tubes at 3000-5000 rpm for 5-10 minutes to achieve complete phase separation.
- Analysis: Carefully recover the organic phase and analyze via UFLC-DAD.
Experimental Design Considerations: A full factorial design investigating 5 pH levels and 4 ionic strength values generates 20 experimental conditions, enabling comprehensive response surface modeling. Include triplicate determinations at each condition to assess precision [28].
Application Examples from Literature
Protocol 3.2.1: Phenolic Compound Extraction from Wastewater This method employs a vortex-assisted liquid-liquid microextraction (VA-LLME) approach following matrix cleanup [28].
Table 1: Optimization Parameters for Phenolic Compound Extraction
| Parameter | Optimized Condition | Effect |
|---|---|---|
| Sample pH | Alkaline (with Na₂CO₃) | Promotes formation of acetate derivatives through reaction with acetic anhydride |
| Derivatization | Acetic anhydride in presence of Na₂CO₃ | Improves extraction efficiency and chromatographic behavior |
| Extraction Solvent | 1,1,2-Trichloroethane | Effective for phenolic compound derivatives |
| Mixing | Vortex assistance | Enhances mass transfer and extraction kinetics |
Procedure:
- Perform matrix cleanup using magnetic core-shell metal-organic framework adsorbent.
- Adjust sample to alkaline conditions using sodium carbonate.
- Add acetic anhydride as derivatizing agent.
- Execute VA-LLME with 1,1,2-trichloroethane.
- Analyze derivatives via GC with flame ionization detection [28].
Protocol 3.2.2: PALME of Psychoactive Substances from Oral Fluid This protocol demonstrates the application of parallel artificial liquid membrane extraction (PALME) for basic compounds [27].
Table 2: PALME Conditions for Basic Psychoactive Compounds
| Parameter | Optimized Condition | Rationale |
|---|---|---|
| Sample pH | pH 12 (carbonate buffer) | Suppresses ionization of basic compounds, enhancing diffusion across membrane |
| Ionic Strength | 0.4 g NaCl added to 2 mL sample | Modifies solubility and mass transfer characteristics |
| Extraction Time | 120 minutes | Allows sufficient time for equilibrium establishment |
| Acceptor Solution | Formic acid 0.1% in H₂O:MeOH (80:20) | Provides acidic environment to protonate and trap basic compounds |
Procedure:
- Mix 200 μL oral fluid with 1800 μL carbonate buffer (pH 12).
- Add 0.4 g sodium chloride to adjust ionic strength.
- Assemble PALME system with dodecylacetate-supported liquid membrane.
- Extract for 120 minutes with orbital shaking.
- Analyze via LC-MS/MS [27].
Data Presentation and Analysis
Quantitative Optimization Data
Table 3: Comparative Extraction Efficiency Under Different pH and Ionic Strength Conditions
| Analyte Class | Matrix | Optimal pH | Optimal Ionic Strength | Extraction Efficiency | Reference Technique |
|---|---|---|---|---|---|
| Phenolic compounds | Wastewater | Alkaline (with derivatization) | Not specified | 62-83% recovery | VA-LLME-GC-FID [28] |
| Psychoactive substances (basic) | Oral fluid | 12.0 | 0.4 g NaCl in 2 mL sample | LOD: 0.01-1.5 ng/mL | PALME-LC-MS/MS [27] |
| Phenolic compounds | Bee products | 2.0 and 7.0 (depending on solvent system) | Not specified | Improved yield and diversity | LLE-HPLC-DAD [26] |
| Anthraquinones | Folium Sennae | 4.0 | Not specified | Recovery: 92.1-99.8% | IL-DLLME-HPLC [29] |
| Chlorpromazine | Biological fluids | Optimized (specific value not provided) | Optimized | LOD: 0.08 ng/mL (pharmaceutical) | MSPE-HPLC-UV [30] |
Impact Assessment
The systematic optimization of pH and ionic strength consistently demonstrates significant impacts on analytical figures of merit:
Detection Limits: Proper pH adjustment enables achievement of remarkably low detection limits, exemplified by the 0.08 ng/mL LOD for chlorpromazine in pharmaceutical formulations [30].
Selectivity: pH-controlled extraction provides effective matrix cleanup, as demonstrated in the determination of phenolic compounds in complex wastewater samples, where selective derivatization and extraction minimized interferences [28].
Recovery Efficiency: The 92.1-99.8% recovery rates achieved for anthraquinones in Folium Sennae highlight how optimized extraction conditions maximize analyte recovery while maintaining method accuracy [29].
Visualization of Workflows
pH and Ionic Strength Optimization Pathway
Mechanism of pH-Controlled Extraction
The Scientist's Toolkit
Table 4: Essential Research Reagents for pH and Ionic Strength Optimization
| Reagent/Material | Function | Application Example |
|---|---|---|
| Buffer Solutions | Maintain precise pH control during extraction | Carbonate buffer (pH 12) for PALME of basic drugs [27] |
| Sodium Chloride (NaCl) | Modify ionic strength; induce salting-out effect | Added to oral fluid samples to enhance recovery of psychoactives [27] |
| Derivatizing Agents | Chemically modify analytes to improve extraction | Acetic anhydride for phenolic compounds in wastewater [28] |
| pH Adjustment Solutions (HCl, NaOH) | Fundamental pH control | Adjustment of sample pH to optimal extraction range [26] |
| Ionic Liquids | Alternative extraction solvents with tunable properties | [BeMim][Tf2N] for anthraquinone extraction [29] |
The strategic implementation of pH adjustment and ionic strength control represents a powerful approach for optimizing liquid-liquid extraction protocols in UFLC-DAD analysis. Through systematic investigation of these parameters, researchers can significantly enhance method sensitivity, selectivity, and robustness. The protocols and data presented herein provide a structured framework for developing and refining extraction methods across diverse analytical applications, ultimately contributing to improved analytical performance in pharmaceutical and bioanalytical research.
Dispersive Liquid-Liquid Microextraction (DLLME) is a modern sample preparation technique that has gained widespread adoption due to its simplicity, affordability, low solvent consumption, and high efficiency [31]. Developed nearly two decades ago as a miniaturized alternative to traditional liquid-liquid extraction (LLE), DLLME operates on a fundamental principle: a mixture of an extraction solvent and a dispersive solvent is rapidly injected into an aqueous sample, creating a turbid solution filled with fine droplets of the extraction solvent [32] [31]. This cloudiness is crucial, as it dramatically increases the surface area between the extraction solvent and the sample, allowing for the rapid transfer of analytes and enabling chemical equilibrium to be reached in a very short time [6]. The process concludes with centrifugation to separate and unify the solvent droplets, which are then collected by a micro-syringe for subsequent analysis, typically by chromatographic methods such as UFLC-DAD [31] [33].
The technique's core advantage lies in its use of very small volumes of solvent (typically from 30 µL to 300 µL), which enhances operator safety and reduces environmental impact [6]. However, despite its advantages, classical DLLME faces challenges related to the use of hazardous chlorinated extraction solvents, the need for a dispersive solvent, the centrifugation step, and difficulties in collecting the extractant after phase separation, which can complicate automation and conflict with some principles of green sample preparation (GSP) [32] [31]. This has driven continuous innovation, leading to advanced strategies that aim to overcome these limitations while expanding the technique's applicability in complex matrices such as biological fluids, pharmaceuticals, and environmental samples [32].
Advanced DLLME Strategies and Modes
To address the challenges of classical DLLME and align it with green analytical principles, several advanced strategies and modes have been developed. These innovations often focus on modifying the dispersion mechanism, eliminating the need for toxic solvents, or combining DLLME with other extraction techniques to enhance efficiency and practicality.
The following workflow diagram illustrates the decision-making path for selecting an appropriate DLLME mode based on analytical requirements and sample matrix.
Recent research has focused on solventless or solvent-minimized approaches. Vortex-Assisted (VA-DLLME) and Ultrasound-Assisted (UA-DLLME) techniques use mechanical energy for dispersion instead of a dispersive solvent. Vortex mixing provides intense agitation, while ultrasound generates cavitation bubbles that facilitate the formation of a fine emulsion, improving extraction efficiency and reducing equilibrium time [32] [6]. Another significant advancement is the development of Magnetic Nanoparticle-Assisted DLLME, where functionalized magnetic nanoparticles are dispersed in the sample to adsorb analytes. After extraction, the particles are easily retrieved using an external magnet, eliminating the need for centrifugation and simplifying the collection phase [31].
For complex matrices, combining DLLME with other extraction techniques has proven highly effective. The QuEChERS-DLLME combination is particularly valuable for demanding samples like food and biological materials. QuEChERS (Quick, Easy, Cheap, Effective, Rugged, and Safe) provides an initial clean-up step, removing matrix interferences before DLLME pre-concentrates the analytes, resulting in a cleaner extract and improved analytical accuracy [6]. Similarly, Solid-Phase Extraction combined with DLLME (SPE-DLLME) offers a high enrichment factor by first trapping analytes on a solid sorbent and then eluting them into a small volume for the dispersive microextraction, making it suitable for trace analysis in environmental waters [6].
Detailed Application Notes and Protocols
This section provides a detailed application note for the determination of pharmaceutical compounds, followed by a comprehensive protocol that can be adapted for various analytes in a UFLC-DAD research context.
Application Note: Determination of Glucocorticoids in Aqueous Matrices
- Objective: To pre-concentrate and determine trace levels of glucocorticoids in water samples using SPE-DLLME coupled with UFLC-DAD.
- Background: The analysis of emerging pharmaceutical contaminants in environmental waters requires highly sensitive methods due to their low concentrations (often at ppb or ppt levels) and complex matrices [34] [6]. This protocol combines the clean-up and pre-concentration capabilities of SPE with the high enrichment factor of DLLME.
- Materials:
- Samples: Surface water, groundwater, or wastewater.
- Analytes: Target glucocorticoids (e.g., cortisone, prednisone).
- SPE Sorbent: C18 or hydrophilic-lipophilic balanced (HLB) cartridges.
- DLLME Solvents: Extraction solvent: 100 µL of chlorobenzene (density > water); Disperser solvent: 1.0 mL of acetone.
- Centrifuge Tubes: Conical bottom glass tubes (10-15 mL).
- Procedure:
- Sample Preparation: Adjust the pH of 100 mL water sample to 7.0. Filter through a 0.45 µm membrane.
- SPE Pre-concentration: Condition the SPE cartridge with 5 mL methanol and 5 mL water. Load the sample at a flow rate of 5-10 mL/min. Dry the cartridge for 10-15 minutes. Elute analytes with 2 mL of methanol.
- DLLME: Transfer the methanolic eluent into a centrifuge tube containing 5 mL of ultrapure water. Rapidly inject a mixture of 1.0 mL acetone (disperser) and 100 µL chlorobenzene (extraction solvent) using a syringe. A cloudy solution will form instantly.
- Centrifugation: Centrifuge at 5000 rpm for 5 minutes to sediment the organic droplets.
- Collection: Carefully remove the aqueous layer. Collect the sedimented organic phase (~80 µL) using a micro-syringe.
- Analysis: Inject a defined volume (e.g., 20 µL) into the UFLC-DAD system for separation and quantification.
- Key Advantages: This method provides a very high enrichment factor and excellent sample clean-up, effectively reducing matrix effects in complex water samples [6] [35].
Comprehensive Protocol for DLLME in UFLC-DAD Analysis
This general protocol outlines the critical steps for performing a DLLME procedure, summarizing the parameters that require optimization.
Step-by-Step Experimental Methodology
Sample Preparation:
- For liquid samples (urine, plasma, water), dilute if necessary and adjust to the optimal pH. Protein precipitation may be required for biological fluids.
- For solid samples (food, tissues), perform a prior extraction using techniques like QuEChERS [6] or UAE [6]. The resulting extract, often in a polar solvent, serves as the sample solution for DLLME.
Selection and Injection of Solvents:
- Prepare a mixture of the disperser and extraction solvents in the optimized ratio (a typical V/V ratio is approximately 5:1 [6]).
- Using a glass syringe, rapidly inject this mixture into the sample solution held in a conical glass tube. Observe the immediate formation of a cloudy suspension.
Dispersion and Extraction:
Phase Separation:
Collection of the Extractant:
- After centrifugation, the extraction solvent will form a stable droplet at the bottom of the tube. Carefully remove the upper aqueous layer. Precisely collect the sedimented phase using a micro-syringe with a flat needle [31].
Analysis:
- Transfer the collected extract into a vial or inject it directly into the UFLC-DAD system. The use of a low-volume insert in the vial is recommended.
Critical Optimization Parameters
The following table summarizes the key parameters that must be optimized for any DLLME application to achieve high recovery and enrichment.
Table 1: Critical Parameters for DLLME Optimization
| Parameter | Description | Common Choices & Optimization Guidance |
|---|---|---|
| Extraction Solvent | High-density solvent immiscible with water; selects based on analyte affinity. | Chloroform, carbon tetrachloride, chlorobenzene [33] [6]. Newer, greener solvents are being explored [32]. |
| Disperser Solvent | Water-miscible solvent that carries extraction solvent; facilitates cloud formation. | Acetone, methanol, acetonitrile, tetrahydrofuran (THF) [33]. Must be miscible with both sample and extraction solvent. |
| Solvent Volumes | Ratio and absolute volumes of extraction and disperser solvents. | Typical disperser-to-extraction solvent ratio is ~5:1 [6]. Volume affects droplet size, cloudiness, and enrichment factor. |
| Sample pH | Adjusts the ionic form of ionizable analytes to favor partitioning into organic phase. | Optimized for specific analytes (e.g., acidic/basic compounds) [33]. |
| Salt Addition | Adds ionic strength to sample solution; can decrease solubility of analytes in water. | Concentration of salts like NaCl is tested (salting-out effect) [33] [6]. |
| Extraction Time | Time between cloud formation and centrifugation; typically very short in DLLME. | Due to large surface area, equilibrium is often reached in seconds [6]. |
| Centrifugation | Speed and time to achieve complete phase separation. | Typically 3000-5000 rpm for 3-5 minutes [31] [33]. |
The Scientist's Toolkit: Essential Reagents and Materials
Successful implementation of DLLME requires careful selection of reagents and materials. The following table details the essential components of a DLLME protocol.
Table 2: Key Research Reagent Solutions for DLLME Protocols
| Reagent/Material | Function/Purpose | Typical Examples & Notes |
|---|---|---|
| Extraction Solvent | To extract, pre-concentrate, and isolate target analytes from the sample solution. | Chloroform, carbon tetrachloride, chlorobenzene. Green goal: Low-toxicity, low-viscosity solvents [32] [31]. |
| Disperser Solvent | To disperse the extraction solvent as fine droplets throughout the sample, creating a large surface area for extraction. | Acetone, methanol, acetonitrile. Must be miscible with both the sample and extraction solvent [33] [6]. |
| Derivatization Agent | To chemically modify analytes for improved detection (e.g., higher UV absorbance) or better extraction efficiency. | Specific to analyte functional groups. Used to refine qualitative and quantitative analysis [6]. |
| Salt Solutions | To implement the "salting-out" effect, which reduces the solubility of organic analytes in the aqueous phase and enhances partitioning into the extraction solvent. | Saturated solution of sodium chloride (NaCl) or other salts [33] [6]. |
| pH Buffer Solutions | To adjust and control the ionization state of ionizable analytes, ensuring they are in a neutral form that favors transfer into the organic extraction solvent. | Buffers like phosphate (e.g., sodium dihydrogen phosphate) to maintain specific pH [33]. |
| Magnetic Nanoparticles | To act as a solventless extraction phase in advanced DLLME modes. They are collected with a magnet, eliminating the need for centrifugation [31]. | Surface-functionalized (e.g., with C18) iron oxide nanoparticles (Fe₃O₄). |
Quantitative Data and Analytical Performance
The effectiveness of a DLLME method is quantitatively evaluated using key performance metrics such as enrichment factor, recovery, and precision. The following table compiles representative data from various applications to illustrate the technique's capabilities.
Table 3: Analytical Performance of DLLME in Various Applications
| Application / Analytes | Matrix | DLLME Mode | Enrichment Factor (EF) | Recovery (%) | Reference Technique |
|---|---|---|---|---|---|
| Antioxidants (Irganox 1076, 1010) | Aqueous Sample | Traditional DLLME | ~200 | ~100 | HPLC-DAD [33] |
| Pharmaceutical Analysis | Various | Various DLLME Modes | Reported as a key strength | High | Crit. Rev. Anal. Chem. [34] |
| PAHs, Pesticides | Water, Food | Combined Techniques (e.g., QuEChERS-DLLME) | High (amplified factor) | Improved Precision | Separations [6] |
| Cadmium (Cd) | Water | SPE-DLLME | High | Effective | Separations [36] |
Dispersive Liquid-Liquid Microextraction has firmly established itself as a powerful and versatile sample preparation technique. Its evolution from a simple, efficient method to a sophisticated and adaptable platform is evident in the advanced strategies developed to overcome initial challenges related to green chemistry and automation [32] [31]. The integration with other techniques like QuEChERS and SPE, along with solventless dispersion methods, has significantly expanded its utility for analyzing complex matrices, including those relevant to pharmaceutical and bioanalytical research [34] [6]. When coupled with UFLC-DAD, DLLME provides a robust solution for the sensitive and reliable determination of trace analytes. The ongoing development of sustainable solvents and automated procedures promises to further solidify the role of DLLME in modern analytical laboratories, driving meaningful advancements in the field of analytical chemistry [32] [31].
The integration of robust sample preparation techniques with high-performance analytical instrumentation is fundamental to modern chemical analysis. This application note provides a detailed protocol for coupling Liquid-Liquid Extraction (LLE) and its modern miniaturized counterparts with Ultra-Fast Liquid Chromatography with Diode Array Detection (UFLC-DAD). The focus is on achieving reliable method transfer and robust gradient optimization for pharmaceutical and bioanalytical applications, framed within a broader thesis on analytical method development.
The critical challenge in analytical sciences lies in maintaining data integrity and performance when methods are transferred between laboratories or instrument platforms. This document outlines systematic approaches to overcome these hurdles, leveraging Design of Experiments (DoE) and understanding instrumental parameters like dwell volume to create resilient methods with longer life cycles [37].
Theoretical Background and Key Concepts
Advanced Liquid-Liquid Extraction Techniques
Traditional Liquid-Liquid Extraction (LLE) has evolved significantly to address the need for greener, more efficient pre-concentration techniques, especially for complex matrices.
Dispersive Liquid-Liquid Microextraction (DLLME): This technique utilizes a ternary solvent system where an extraction solvent is dispersed rapidly into an aqueous sample via a disperser solvent. It offers high enrichment factors, rapid equilibrium, and minimal solvent consumption [38]. A recently optimized DLLME method for multiclass pesticides used 5 mL water samples with tetrachloroethylene (extraction solvent) and acetonitrile (disperser), achieving excellent recoveries of 87%–108% with high precision (RSD < 4.68%) [38].
Salt-Assisted Liquid-Liquid Extraction (SALLE): This modification uses a high-concentration salt solution to induce phase separation of a water-miscible organic solvent (like acetonitrile) from an aqueous sample. It effectively combines protein precipitation and extraction in one step, offering a simple protocol, high extraction efficiency for a wide polarity range of analytes, and elimination of evaporation/reconstitution steps [39] [40]. For the analysis of andrographolide and DDAG in rat serum, SALLE with MgSO₄ yielded extraction efficiencies exceeding 90% for both analytes [39].
UFLC-DAD and Gradient Elution Fundamentals
UFLC-DAD combines rapid separations using small-particle columns (<2 µm) with full spectral detection. In gradient elution, the retention factor (k*) depends on the solute's chemical nature, gradient time (tG), flow rate (F), column dimensions (VM), and the gradient range (ΔΦ), as shown in the equation [37]:
k∗ = 0.87 * tG * F / (VM * ΔΦ * S)
A primary obstacle in transferring gradient methods between different (U)HPLC systems is the dwell volume—the volume between the point where solvents are mixed and the column inlet. Differences in dwell volume between instruments can cause significant retention time shifts, leading to failed method transfers [37]. A robust method development strategy incorporates expected dwell volume variations from the outset.
Experimental Protocols
Protocol 1: Dispersive Liquid-Liquid Microextraction (DLLME) for Water Analysis
This protocol is optimized for the extraction of multiclass pesticides (e.g., metalaxyl, benalaxyl, chlorpyrifos) from environmental waters prior to UFLC-DAD analysis [38].
Workflow Overview:
Materials & Reagents:
- Water samples: Filtered through 0.45 µm nylon membrane [38].
- Pesticide standards: Pestanal grade (>98.5% purity) [38].
- Extraction solvent: Tetrachloroethylene [38].
- Disperser solvent: Acetonitrile (HPLC grade) [38].
- Salt: Sodium chloride (NaCl, analytical grade) [38].
- Equipment: Vortex mixer, centrifuge, 15-mL conical-bottom centrifuge tubes [38].
Step-by-Step Procedure:
- Sample Preparation: Collect water samples in amber glass bottles. Filter through filter paper and a 0.45 µm nylon filter. Store at 4°C until analysis [38].
- Extraction:
- Pipette 5 mL of the filtered water sample into a 15-mL conical centrifuge tube.
- Adjust the sample pH to 7 using dilute HCl or NaOH.
- Add 0.15 g of NaCl (3% w/v).
- Rapidly inject a mixture of 1.0 mL of acetonitrile (disperser) and 150 µL of tetrachloroethylene (extraction solvent) into the sample solution.
- Immediately vortex the mixture at 1200 rpm for 80 seconds. A cloudy solution, indicating fine dispersion of the extraction solvent, will form.
- Phase Separation: Centrifuge the tube at 3500 rpm for 5 minutes to sediment the dense organic phase at the bottom of the tube.
- Sample Collection: Carefully remove the aqueous upper layer with a pipette. The sedimented organic phase (approx. 150 µL) is now ready for injection into the UFLC-DAD system.
Protocol 2: Salt-Assisted LLE (SALLE) for Serum/Plasma Analysis
This protocol is designed for extracting analytes like andrographolide (AG) and 14-deoxy-11,12-didehydroandrographolide (DDAG) from biological matrices such as rat serum [39] [40].
Workflow Overview:
Materials & Reagents:
- Biological Matrix: Rat serum or plasma [40].
- Analytes: Andrographolide (AG) and 14-deoxy-11,12-didehydroandrographolide (DDAG) reference standards [40].
- Organic Solvent: Acetonitrile (ACN, HPLC grade) [40].
- Salt: Magnesium sulfate (MgSO₄), sodium chloride (NaCl), or sodium sulfate (Na₂SO₄). MgSO₄ has been shown to yield the highest efficiency for certain applications [40].
- Equipment: Vortex mixer, centrifuge, micro-pipettes [40].
Step-by-Step Procedure:
- Sample Preparation: Thaw frozen serum samples on ice or at room temperature. Vortex briefly to ensure homogeneity.
- Extraction:
- Transfer 500 µL of serum into a microcentrifuge tube.
- Add a specific volume of ACN (e.g., 1 mL) and a concentrated salt solution (e.g., MgSO₄). The optimal ratio of sample to ACN to salt must be determined experimentally [40].
- Mix the contents gently by vortexing or inversion. Vigorous shaking is not required. The salt causes the initially miscible ACN to separate into a distinct organic layer.
- Phase Separation: Centrifuge the mixture at high speed (e.g., 10,000 rpm) for 5-10 minutes to achieve complete phase separation.
- Sample Collection: Collect the upper organic layer (ACN phase), which contains the target analytes. This layer can often be directly injected or diluted with water for UFLC-DAD analysis, eliminating the need for solvent evaporation and reconstitution [40].
Method Transfer and Gradient Optimization in UFLC-DAD
Systematic Method Transfer Strategy
Successfully transferring a gradient HPLC method requires a proactive approach that considers instrumental differences from the beginning of method development [37].
Key Steps for Robust Method Transfer:
- Define Acceptable Ranges: Before transfer, determine the acceptable ranges for critical method attributes like resolution (Rs) of the critical pair. A resolution of ≥1.5-2.0 is often targeted for quantitative methods [41].
- Incorporate Dwell Volume Early: During method development, identify the (U)HPLC instruments planned for use in quality control. Use a Design of Experiments (DoE) approach to find optimal chromatographic conditions that work across the different dwell volumes of these target instruments [37].
- Adjust Column Dimensions and Flow Rate: When transferring a method to a column with different dimensions, adjust the flow rate to maintain identical linear velocity and gradient volume, thus preserving the separation. The relationship is [41]:
F₂ = F₁ × (d_c₂)² / (d_c₁)²For example, transferring from a 4.6 mm i.d. column at 1.2 mL/min to a 3.0 mm i.d. column requires a new flow rate of1.2 × (3.0)² / (4.6)² ≈ 0.51 mL/min, resulting in nearly 60% solvent savings [41]. - Change Particle Size and Column Length: To reduce analysis time and maintain resolution, use shorter columns packed with smaller particles at a proportionally higher flow rate. The required pressure (∆p) scales as follows [41]:
∆p₂ = ∆p₁ × (L₂ / L₁) × (d_p₁ / d_p₂)² × (F₂ / F₁)This strategy leverages available instrument pressure for faster, more efficient separations.
Gradient Optimization using Design of Experiments
A chemometric approach is the most reliable way to develop a robust, transferable gradient method [37].
Procedure:
- Select Factors and Responses: Identify critical factors (e.g., gradient time, initial and final %B, temperature, pH) and responses (e.g., resolution of critical pair, analysis time).
- Apply Experimental Designs:
- Model and Establish Design Space: Build mathematical models to predict method performance. Use these models to establish a "method operable design region" (MODR), a multidimensional space where method performance criteria are met despite small, intentional variations in factors [37].
- Verify and Validate: Confirm the final optimal conditions by experiment. Perform a full method validation on the primary instrument. When transferring, a system suitability test (SST) is often sufficient if the transfer is well-documented and the method was developed to be robust [41].
Data Presentation and Performance
Quantitative Performance of Microextraction Techniques
The following tables summarize the analytical performance achievable with the described techniques.
Table 1: Performance Data for Optimized DLLME-HPLC-DAD of Pesticides [38]
| Pesticide | Linear Range (µg/L) | Correlation Coefficient (r²) | LOD (µg/L) | Recovery (%) | Precision RSD (%) |
|---|---|---|---|---|---|
| Metalaxyl | 5-1000 | >0.9977 | 0.3-1.3 | 87-108 | 2.8-8.6 |
| Benalaxyl | 5-1000 | >0.9977 | 0.3-1.3 | 87-108 | 2.8-8.6 |
| Chlorpyrifos | 5-1000 | >0.9977 | 0.3-1.3 | 87-108 | 2.8-8.6 |
| Endrin | 5-1000 | >0.9977 | 0.3-1.3 | 87-108 | 2.8-8.6 |
| 4,4'-DDT | 5-1000 | >0.9977 | 0.3-1.3 | 87-108 | 2.8-8.6 |
| Bifenthrin | 5-1000 | >0.9977 | 0.3-1.3 | 87-108 | 2.8-8.6 |
Table 2: Performance Data for SALLE-HPLC-DAD of Diterpene Lactones in Serum [39] [40]
| Analyte | Linear Range (ng/mL) | Correlation Coefficient (r²) | LOD (ng/mL) | LOQ (ng/mL) | Extraction Efficiency (%) |
|---|---|---|---|---|---|
| Andrographolide (AG) | 125-2000 | >0.99 | 60 | 70 | >90 |
| 14-Deoxy-11,12-Didehydroandrographolide (DDAG) | 125-2000 | >0.99 | 201 | 234 | >90 |
The Scientist's Toolkit: Essential Research Reagents and Materials
Table 3: Essential Reagents and Materials for LLE-UFLC-DAD workflows
| Item Category | Specific Examples | Function/Purpose |
|---|---|---|
| Extraction Solvents | Tetrachloroethylene, Chloroform, 1,2-Dichloroethane [38] | Immiscible organic solvent to partition and concentrate analytes from the aqueous sample. |
| Disperser Solvents | Acetonitrile, Methanol, Acetone [38] | Water-miscible solvent to disperse the extraction solvent as fine droplets in the aqueous sample (for DLLME). |
| Salting-Out Agents | MgSO₄, NaCl, Na₂SO₄ [39] [40] | Salt added to induce phase separation of a water-miscible organic solvent (e.g., ACN) from the aqueous sample, enhancing analyte transfer to the organic phase (for SALLE). |
| Buffers & pH Adjusters | HCl, NaOH, Ammonium Acetate, Formic Acid [38] [37] | Control the pH of the sample to ensure analytes are in their uncharged form for efficient extraction. |
| HPLC Mobile Phase | Acetonitrile, Methanol, Water with modifiers (e.g., formic acid) [42] [37] | The liquid phase that carries the sample through the chromatographic column, responsible for separating analytes. |
| Chromatographic Columns | C18 columns (e.g., Xterra MS C18, 3.5 µm) [38] | The stationary phase where the actual separation of analytes occurs based on their chemical properties. |
The seamless integration of advanced LLE techniques like DLLME and SALLE with UFLC-DAD provides a powerful, efficient, and environmentally friendly platform for analyzing complex samples. The success of this coupling hinges on a deep understanding of both the extraction chemistry and the chromatographic separation mechanics. By adopting a systematic, forward-thinking approach to method development—one that incorporates potential instrumental variations from the outset—researchers can create robust, transferable, and trouble-free methods. This ensures data reliability across different laboratories and instrument platforms, ultimately accelerating drug development and environmental monitoring.
Solving Common LLE Problems and Maximizing UFLC-DAD Performance
Emulsions, thermodynamically unstable systems comprising two immiscible liquids, present a significant challenge in liquid-liquid extraction (LLE) protocols for Ultra-Fast Liquid Chromatography with Diode Array Detection (UFLC-DAD) analysis [43]. In chemical and pharmaceutical research, the formation of stable emulsions during extraction steps can severely impact analyte recovery, method precision, and overall analytical throughput [44]. Emulsion stabilization mechanisms arise from interfacial tension between dispersed and continuous phases, often exacerbated by surface-active compounds present in complex biological matrices [45] [43].
Understanding and controlling emulsion behavior is particularly crucial for drug development professionals who require robust, reproducible extraction methods for bioanalytical assays [46]. This application note provides detailed protocols and strategic approaches for preventing and breaking emulsions, with special emphasis on salt additives—a versatile and accessible tool for optimizing sample preparation workflows.
Emulsion Formation and Stability Mechanisms
Fundamental Principles
Emulsions in LLE typically form as oil-in-water (O/W) or water-in-oil (W/O) systems, where one liquid becomes dispersed as fine droplets within the other [47] [43]. The stability of these systems is kinetically controlled by factors including interfacial tension, droplet size distribution, and interfacial film rheology [43]. Several mechanisms drive emulsion destabilization:
- Coalescence: The merging of smaller droplets into larger ones, ultimately leading to complete phase separation [43]
- Flocculation: The clustering of droplets without loss of individual identity [43]
- Ostwald Ripening: The growth of larger droplets at the expense of smaller ones due to molecular diffusion driven by Laplace pressure differences [48] [43]
- Creaming/Sedimentation: Gravitational separation of dispersed phase droplets [43]
Key Factors Influencing Emulsion Stability
The stability of emulsion systems in LLE is influenced by multiple interconnected factors:
Table 1: Factors Affecting Emulsion Stability in LLE Protocols
| Factor Category | Specific Parameters | Impact on Emulsion Stability |
|---|---|---|
| Dispersed Phase | Droplet size distribution | Smaller droplets (<1µm) significantly increase stability [43] |
| Chemical composition | Hydrophobic/hydrophilic balance affects interfacial tension [44] | |
| Continuous Phase | Viscosity | Higher viscosity reduces droplet movement and coalescence [43] |
| pH | Affects ionization state of surface-active compounds [44] | |
| Interfacial Properties | Emulsifier presence | Surface-active compounds form stabilizing films [43] |
| Interfacial rheology | Viscoelastic interfaces resist droplet coalescence [43] | |
| Environmental Conditions | Temperature | Affects solubility and diffusion rates [43] |
| Ionic strength | Modulates electrostatic interactions between droplets [48] |
Strategic Approaches to Emulsion Prevention
Sample Preparation and Modification
Proper sample pretreatment represents the first line of defense against problematic emulsion formation:
- pH Adjustment: Manipulate the ionization state of potential emulsifiers. For basic analytes, adjust aqueous phase to pH ≥9; for acidic analytes, use pH ≤4 [44]. This ensures target analytes remain neutral, improving extraction efficiency while reducing surface activity of ionizable compounds.
- Salt Addition: Incorporate electrolytes to increase ionic strength, which enhances phase separation through "salting-out" effects. This approach decreases the solubility of polar compounds in the aqueous phase, favoring partitioning into the organic phase [44].
- Temperature Control: Moderate heating (typically 40-60°C) can reduce viscosity and interfacial tension, though excessive temperatures may promote degradation or volatility issues [43].
Extraction Technique Optimization
Selection of appropriate LLE parameters significantly impacts emulsion tendency:
- Solvent Selection: Choose organic solvents with appropriate polarity index matching the target analytes' hydrophobicity [44]. Less polar solvents (e.g., hexanes, heptanes) generally form less stable emulsions with aqueous matrices.
- Phase Ratio Optimization: Adjust the organic-to-aqueous phase ratio to minimize emulsion formation zones. Typically, ratios between 1:1 and 1:3 (organic:aqueous) work well for most applications [49].
- Mixing Methodology: Avoid excessive shear mixing which creates finer, more stable droplets. Gentle inversion or orbital shaking is preferable to vortex mixing or high-speed homogenization for emulsion-prone samples [47].
Salt Additives for Emulsion Control
Mechanism of Action
Salt additives function through multiple mechanisms to prevent and break emulsions:
- Electrolyte Effect: Electrolytes compress the electrical double layer surrounding charged droplets, reducing electrostatic repulsion and promoting coalescence [48].
- Salting-Out Effect: High salt concentrations decrease the solubility of surface-active compounds and analytes in the aqueous phase, driving them toward the organic phase [50] [44].
- Interfacial Disruption: Ions can compete for hydration shells, destabilizing the interfacial film that maintains emulsion stability [48].
Table 2: Salt Additives for Emulsion Control in LLE
| Salt Type | Typical Concentration | Mechanism | Optimal Application Context |
|---|---|---|---|
| Sodium Chloride (NaCl) | 0.1-0.5 M [48] | Electrolyte effect, reduces Ostwald ripening in W/O emulsions [48] | Water-in-oil emulsions; biological samples |
| Magnesium Sulfate (MgSO₄) | 1-5% w/v [50] | Strong salting-out effect, dehydrates interfacial films | SALLE methods; pesticide extraction from complex matrices [50] |
| Ammonium Sulfate ((NH₄)₂SO₄) | 2-4 M [46] | Creates high ionic strength with moderate viscosity | Protein-rich samples; lipidomic studies [46] |
| Sodium Sulfate (Na₂SO₄) | Saturated solutions [44] | Powerful dehydrating agent | Extraction of hydrophilic analytes; back-extraction procedures [44] |
Protocol: Salt-Assisted Liquid-Liquid Extraction (SALLE)
The following protocol describes a SALLE method optimized for multiclass analytes in complex matrices:
Reagents and Materials:
- Anhydrous magnesium sulfate or sodium chloride (ACS grade)
- Organic solvents (HPLC grade): acetonitrile, ethyl acetate, dichloromethane
- Aqueous sample (1.0 mL adjusted to appropriate pH)
- Centrifuge tubes (15 mL polypropylene with conical bottom)
- Centrifuge capable of 3000 × g
- Vortex mixer
Procedure:
- Transfer 1.0 mL of prepared sample to a 15 mL centrifuge tube.
- Add internal standard if required for quantification.
- Add 2.0 ± 0.1 g of anhydrous MgSO₄ and 0.5 ± 0.05 g of NaCl.
- Immediately add 3.0 mL of extraction solvent (acetonitrile:ethyl acetate, 1:1 v/v).
- Securely cap the tube and vortex vigorously for 60 seconds.
- Centrifuge at 3000 × g for 5 minutes to achieve complete phase separation.
- Carefully transfer the upper organic layer to a clean tube using a Pasteur pipette.
- Evaporate under nitrogen stream and reconstitute in mobile phase-compatible solvent for UFLC-DAD analysis.
Notes:
- The salt-to-sample ratio is critical; 2:1 (w/v) MgSO₄ to sample typically provides optimal results [50].
- For highly emulsion-prone samples, increasing NaCl concentration to 10% w/v may be necessary.
- Temperature during extraction should be maintained at 20-25°C for consistent recovery.
Emulsion Breaking Techniques
Physical Methods
When emulsions persist despite preventive measures, physical intervention may be necessary:
- Centrifugation: The most reliable method; typically 3000-5000 × g for 5-10 minutes enhances phase separation by density difference [46].
- Temperature Cycling: Alternating between 4°C and 40°C can disrupt interfacial films through thermal expansion/contraction differences.
- Filtration: Glass wool or anhydrous sodium sulfate plugs can physically break emulsion films during passage.
- Ultrasonication: Brief, controlled ultrasonication (15-30 seconds) promotes droplet coalescence through cavitation effects.
Chemical Additives
Chemical approaches target the stabilization mechanisms directly:
- Demulsifiers: Food-grade surfactants with opposite HLB values can displace stabilizing films.
- Organic Solvent Addition: Small volumes (50-100 µL) of methanol or isopropanol can reduce interfacial tension.
- pH Adjustment: Altering pH rapidly can change the ionization state of emulsifiers.
Integration with UFLC-DAD Analysis
Method Validation Considerations
When incorporating emulsion control strategies into validated UFLC-DAD methods, several parameters require verification:
- Absolute Recovery: Assess whether salt additives or emulsion-breaking techniques impact analyte recovery [46].
- Matrix Effects: Evaluate signal suppression/enhancement in the presence of residual salts or additives.
- Chromatographic Performance: Monitor peak shape and retention time stability with modified extracts.
Troubleshooting Common Issues
Table 3: Troubleshooting Emulsion-Related UFLC-DAD Problems
| Problem | Potential Cause | Solution |
|---|---|---|
| Retention time drift | Residual salts in final extract | Increase wash step before evaporation; use higher purity salts |
| Poor peak shape | Incomplete emulsion breaking | Implement centrifugal filtration (0.45 µm) after phase separation |
| Reduced recovery | Excessive salt concentration | Optimize salt type and concentration with calibration curve |
| Column pressure increase | Particulate from salt residues | Install in-line guard column; filter all extracts before injection |
Experimental Workflow and Visualization
Comprehensive Emulsion Management Strategy
The following workflow diagram illustrates a systematic approach to preventing and addressing emulsions in LLE procedures for UFLC-DAD analysis:
Decision Pathway for Emulsion Breaking
For situations where emulsions persist despite preventive measures, this decision pathway provides a systematic troubleshooting approach:
The Scientist's Toolkit: Research Reagent Solutions
Table 4: Essential Reagents for Emulsion Management in LLE-UFLC-DAD Workflows
| Reagent | Specification | Primary Function | Application Notes |
|---|---|---|---|
| Sodium Chloride (NaCl) | ACS grade, ≥99% | Reduces Ostwald ripening in W/O emulsions; electrolyte effect [48] | Use at 0.1-0.5 M for prevention; up to 10% w/v for breaking |
| Magnesium Sulfate (MgSO₄) | Anhydrous, ≥99.5% | Strong salting-out agent; dehydrates interfacial films [50] | Key component in SALLE methods; hygroscopic—store sealed |
| Ammonium Acetate | HPLC grade, ≥98% | Buffer salt with LC-MS compatibility; moderate salting-out effect | Ideal for methods requiring evaporation and LC-MS analysis |
| Sodium Sulfate | Anhydrous, granular | Powerful dehydrating agent; filtration aid | Use in columns for breaking emulsions by physical filtration |
| Dichloromethane | HPLC grade, ≥99.9% | Medium-polarity extraction solvent | Low emulsion tendency; good for polar to moderate analytes [44] |
| Ethyl Acetate | HPLC grade, ≥99.8% | Polar solvent for hydrophilic analytes | Moderate emulsion risk; excellent extraction efficiency [44] |
| Formic Acid | LC-MS grade, ≥98% | pH modification for acidic analytes | Use at 0.1-1.0% in aqueous phase to control ionization [51] |
| Ammonium Hydroxide | ACS grade, 28-30% NH₃ | pH modification for basic analytes | Use to adjust sample to pH 9-11 for basic compounds [44] |
Effective emulsion management is essential for developing robust LLE protocols compatible with UFLC-DAD analysis in drug development research. Salt additives, particularly sodium chloride and magnesium sulfate, provide powerful, cost-effective tools for both preventing and breaking emulsions through multiple mechanisms including electrolyte effects, salting-out, and interfacial disruption. The protocols and strategies presented herein offer researchers systematic approaches to address emulsion-related challenges while maintaining analytical integrity. Implementation of these techniques can significantly improve method reliability, recovery efficiency, and overall productivity in pharmaceutical analysis workflows.
Addressing Poor Recovery and Low Extraction Efficiency
Poor recovery and low extraction efficiency present significant challenges in the development of robust liquid-liquid extraction (LLE) protocols for Ultra-Fast Liquid Chromatography with Diode Array Detection (UFLC-DAD) analysis. Inefficient extraction directly compromises data quality, leading to poor detection limits, reduced analytical sensitivity, and unreliable quantification [44]. The fundamental principle of LLE relies on the partitioning of analytes between two immiscible liquids, typically an aqueous phase and a water-immiscible organic solvent [52]. The efficiency of this partitioning is governed by the physicochemical properties of the target analytes and the careful optimization of experimental conditions [44]. This application note provides a detailed, systematic framework for diagnosing and resolving the most common issues that impair recovery and efficiency in LLE methods, with a specific focus on applications preceding UFLC-DAD analysis.
Troubleshooting Guide: Key Parameters and Optimization Strategies
A methodical approach to optimization is crucial. The following parameters most frequently impact extraction performance and should be prioritized during method development.
Analyte Physicochemical Properties
The foundation of an efficient LLE method is a thorough understanding of the target analytes' physicochemical properties [44].
- LogP/LogD: The partition coefficient (LogP) and its pH-dependent counterpart (LogD) are the primary indicators of an analyte's affinity for organic versus aqueous phases. As a rule of thumb, a LogP value of 1 suggests a 10:1 organic-to-aqueous distribution ratio, while a LogP of -1 suggests a 1:10 ratio [44]. Analytes with very low or very high LogP values are inherently challenging to extract.
- pKa: For ionizable compounds, the pKa is arguably the most critical parameter to control. Manipulating the sample pH to ensure the analyte is in its neutral form dramatically increases its partitioning into the organic solvent. The target pH should be at least 2 units above the pKa for bases or 2 units below the pKa for acids to suppress ionization effectively [44].
Table 1: Impact of Analyte Properties on LLE Strategy
| Property | Impact on Extraction | Optimization Strategy |
|---|---|---|
| LogP/LogD | Determines inherent hydrophobicity and solvent affinity. | Select an organic solvent with a polarity index matched to the analyte's LogP. Low LogP requires higher polarity solvents [44]. |
| pKa | Governs ionization state and solubility. | Adjust sample pH to suppress ionization (pH > pKa+2 for bases; pH < pKa-2 for acids) [44]. |
| Hydrogen Bonding | Influences solubility in aqueous matrices. | May require use of ion-pairing salts or highly saturated salt solutions to "salt-out" the analyte [44]. |
Solvent Selection
The choice of extraction solvent is a primary lever for controlling efficiency and selectivity [44].
- Solvent Polarity: The solvent's polarity should be matched to the hydrophobicity of the target analyte. A solvent with a polarity index that is too high will poorly extract non-polar analytes, while a solvent that is too non-polar will be inefficient for more hydrophilic compounds. Common solvents and their polarity indices are listed in Table 2 [44].
- Solvent Miscibility: The solvent must be immiscible with the aqueous sample phase to form a clean separation.
- Green and Modern Solvents: To reduce toxicity and environmental impact, consider modern solvents like ionic liquids (e.g., 1-Hexyl-3-methylimidazolium hexafluorophosphate) [53] or non-halogenated solvents like n-hexane [54]. Tetrachloroethylene has been successfully used as a denser-than-water extraction solvent in dispersive LLE (DLLE) methods [38].
Table 2: Polarity Index of Common Organic Solvents for LLE [44]
| Solvent | Polarity Index |
|---|---|
| Pentane | 0.0 |
| Heptane | 0.1 |
| Toluene | 2.4 |
| Methyl t-butyl ether (MTBE) | 2.5 |
| Dichloromethane (DCM) | 3.1 |
| Chloroform | 4.1 |
| Ethyl Acetate | 4.4 |
| Butan-1-ol | 3.9 |
pH Adjustment
For ionizable analytes, pH is the most powerful tool for maximizing recovery. The following protocol ensures optimal pH conditions.
Experimental Protocol: Sample pH Optimization
- Determine Analyte pKa: Obtain the pKa value(s) of your target analyte from reliable databases such as ChemSpider or Chemicalize [44].
- Prepare Sample Aliquots: Prepare at least six aliquots of your standard-spiked sample matrix.
- Adjust pH: Adjust the pH of each aliquot to a range that brackets the pKa. For a basic analyte (pKa ~8), test pH 6, 7, 8, 9, 10, and 11. For an acidic analyte (pKa ~4), test pH 2.5, 3, 4, 5, 6, and 7.5 [44].
- Extract and Analyze: Perform the LLE procedure on each aliquot using your chosen organic solvent.
- Quantify Recovery: Analyze the extracts via UFLC-DAD and plot the recovery against the pH. The pH yielding the highest recovery is optimal.
Use of Salts and Additives
The recovery of hydrophilic analytes can be significantly improved by modifying the ionic strength of the aqueous phase [44].
- Salting-Out Effect: Adding high concentrations of salts like sodium chloride (e.g., 3% w/v) [38] or sodium sulfate (3-5 M) [44] reduces the solubility of organic analytes in the aqueous phase, driving them into the organic solvent.
- Ion-Pairing: For strongly acidic or basic analytes that are ionized across the practical pH range, an ion-pairing reagent with the opposite charge can be added to form a neutral, extractable complex [44].
Microextraction Techniques
Miniaturized techniques like Dispersive Liquid-Liquid Microextraction (DLLME) and its variants offer high enrichment factors and excellent recovery while using minimal solvent volumes [53] [38] [54].
- Principles: A water-immiscible extraction solvent is dispersed as fine droplets into the aqueous sample using a disperser solvent (e.g., acetonitrile, methanol). This creates a vast surface area for extraction, leading to rapid and efficient partitioning [38].
- Benefits: These methods provide high enrichment factors, require minimal solvent (making them greener), and achieve rapid equilibrium [38]. A study on pesticides achieved recoveries of 87%–108% using a DLLME-HPLC-DAD method [38].
Detailed Experimental Protocols
Protocol 1: Ionic Liquid-Based Dispersive Liquid-Liquid Microextraction (IL-DLLME)
This protocol is adapted from a method developed for the determination of multiclass pesticide residues in water samples, achieving recoveries of 85%–105% [53].
Research Reagent Solutions
| Item | Function |
|---|---|
| 1-Octyl-3-methylimidazolium hexafluorophosphate | Ionic liquid extraction solvent; provides high extraction efficiency for multiclass compounds [53]. |
| Methanol (HPLC Grade) | Disperser solvent; facilitates dispersion of ionic liquid in aqueous sample [53]. |
| Buffer Solutions (e.g., pH 7) | Controls ionization state of analytes to maximize partitioning into organic phase [38]. |
| Sodium Chloride (NaCl) | Used for salting-out effect; improves recovery by reducing analyte solubility in aqueous phase [38]. |
- Sample Preparation: Transfer 5.0 mL of the aqueous sample (e.g., buffer to optimal pH, with 3% w/v NaCl added) into a 15-mL conical centrifuge tube [38].
- Extraction Mixture: Rapidly inject a mixture containing 1.0 mL of methanol (disperser) and 150 µL of [C₈H₁₅N₂][PF₆] (extraction solvent) into the sample solution using a syringe [53].
- Dispersion and Extraction: Vortex the mixture vigorously at 1200 rpm for 80 seconds to form a cloudy solution of fine solvent droplets [38].
- Phase Separation: Centrifuge the tube at 5000 rpm for 5 minutes to sediment the dense ionic liquid phase at the bottom of the tube [53].
- Collection: Carefully remove the upper aqueous layer with a pipette. Using a micro-syringe, collect the sedimented ionic liquid phase.
- Analysis: Dilute the extract with a compatible solvent (e.g., methanol) if necessary, and inject into the UFLC-DAD system for analysis.
Protocol 2: Back-Extraction for Enhanced Selectivity
This technique is invaluable for purifying the target analyte from co-extracted matrix interferents, thereby improving UFLC-DAD chromatographic quality and method specificity [44].
- Initial Extraction: Perform a standard LLE or DLLME under conditions that favor extraction of the target analyte (and many interferents) into the organic phase.
- Back-Extraction: Transfer the collected organic extract to a new tube. Add a fresh aqueous phase whose pH is manipulated to ionize the target analyte. For a basic analyte, use an acidic aqueous solution (e.g., 0.1% formic acid); for an acidic analyte, use a basic solution (e.g., dilute ammonium hydroxide) [44].
- Shake and Separate: Vortex the mixture and allow the phases to separate. The ionized target analyte will partition back into the new aqueous phase, while neutral interferents remain in the organic phase.
- Final Extraction (Optional): The pH of the new aqueous phase can be readjusted to neutralize the target analyte, which can then be extracted into a small volume of clean organic solvent for final concentration and analysis [44].
Workflow and Decision Pathway
The following diagram illustrates the logical workflow for diagnosing and addressing poor recovery in LLE methods.
Achieving high recovery and robust extraction efficiency is a systematic process grounded in the principles of solution chemistry. By meticulously optimizing the key parameters of pH, solvent selection, and ionic strength—guided by the analyte's fundamental physicochemical properties—researchers can develop highly efficient LLE protocols. Incorporating modern techniques like IL-DLLME or back-extraction further enhances the method's performance, selectivity, and sustainability. This structured approach ensures the generation of reliable, high-quality data for UFLC-DAD analysis in drug development and other advanced research applications.
Ultra-Fast Liquid Chromatography (UFLC) coupled with Diode Array Detection (DAD) represents a powerful analytical platform for pharmaceutical analysis, bioanalytical research, and quality control. Despite its advanced capabilities, analysts frequently encounter three persistent challenges that compromise data integrity: baseline noise, peak tailing, and retention time shifts. These issues become particularly problematic when analyzing complex biological samples following extraction protocols such as liquid-liquid extraction (LLE), where matrix effects can significantly impact chromatographic performance.
This application note provides a comprehensive troubleshooting framework specifically contextualized within research involving liquid-liquid extraction methodologies for UFLC-DAD analysis. We present systematically investigated root causes, quantitatively validated solutions, and detailed experimental protocols to enhance method robustness, data quality, and analytical throughput in drug development applications.
Fundamental UFLC-DAD Principles and LLE Workflow Integration
The UFLC-DAD system leverages high-pressure pumping systems, advanced stationary phases, and rapid detection capabilities to achieve fast separations with high resolution. The DAD detector provides spectral information across multiple wavelengths, enabling peak purity assessment and method specificity. When coupled with liquid-liquid extraction sample preparation, which effectively removes proteinaceous material and concentrates analytes from biological matrices, this platform delivers exceptional sensitivity for pharmacokinetic studies and bioanalytical monitoring.
The following diagram illustrates the integrated workflow from sample preparation through data analysis, highlighting potential trouble spots:
Figure 1: Integrated LLE-UFLC-DAD Workflow with Critical Troubleshooting Points
Systematic Troubleshooting of Common UFLC-DAD Issues
Baseline Noise and Drift
Baseline instability manifests as high-frequency noise (short-term fluctuations) or gradual drifting (sustained upward or downward movement), both of which can obscure analyte peaks, compromise detection limits, and impair accurate quantification. These issues are particularly prevalent in methods with steep gradients or when analyzing complex sample matrices following LLE.
Table 1: Baseline Noise and Drift: Causes and Solutions
| Cause Category | Specific Cause | Recommended Solution | Experimental Verification Protocol |
|---|---|---|---|
| Mobile Phase Issues | Degraded solvents/additives (e.g., TFA) [55] | Prepare fresh mobile phase daily; use HPLC-grade solvents in small quantities | Compare baseline with fresh vs. 3-day-old mobile phase; note improvement in noise levels |
| Incomplete degassing | Implement inline degassing or helium sparging for 10-15 minutes | Collect baseline with and without degassing; observe noise reduction >50% | |
| UV-absorbing impurities | Use high-purity water and solvents; employ solvent filtration (0.45 µm) | Run blank gradient; compare absorbance at analytical wavelength before/after filtration | |
| Equipment Issues | Air bubbles in flow cell | Install backpressure restrictor (e.g., 0.007-0.010" ID tubing) at detector outlet [55] | Monitor baseline stability before/after backpressure application during gradient elution |
| Contaminated flow path | Flush system with 50:50 methanol:isopropanol for 30-60 minutes | Run system suitability test; compare peak symmetry and baseline noise pre/post-cleaning | |
| Detector lamp aging | Replace UV lamp after 1000-2000 hours of use | Check lamp energy in system diagnostics; replace if energy >20% from baseline | |
| Environmental Factors | Temperature fluctuations (±2°C) | Use column oven; insulate exposed tubing | Monitor baseline with/without temperature control; note stability improvement |
| Drafts from ventilation | Relocate system away from air conditioning vents | Enclose instrument compartment; observe reduced high-frequency noise |
Experimental Protocol for Baseline Optimization:
- Begin with a blank injection using initial mobile phase conditions
- Execute a full method gradient while monitoring baseline absorbance
- If noise exceeds 0.1 mAU, systematically degas mobile phases for 15 minutes
- Install a backpressure restrictor if noise persists, particularly for low-wavelength methods
- Flush the entire flow path with 50:50 methanol:isopropanol at 1 mL/min for 30 minutes
- Verify improvement by repeating blank injection and quantifying noise reduction
Peak Tailing
Peak tailing represents a common chromatographic challenge characterized by asymmetric peaks with prolonged trailing edges, quantified by the USP Tailing Factor (Tf). Optimal peaks demonstrate Tf values接近 1.0, while values exceeding 1.5-2.0 indicate significant tailing that compromises resolution, integration accuracy, and quantitative precision [56].
Table 2: Peak Tailing: Causes and Solutions
| Cause Category | Specific Cause | Recommended Solution | Impact on Tailing Factor (Typical Improvement) |
|---|---|---|---|
| Column Issues | Silanol interactions (basic compounds) | Use high-purity silica columns; add 0.1% triethylamine to mobile phase [57] | Tf reduction from >2.0 to <1.3 |
| Void formation at column inlet | Replace column; use guard column of same stationary phase | Tf improvement of 30-50%; restored peak symmetry | |
| Chemical degradation | Replace after 1000-2000 injections; flush with strong solvent monthly | Prevents gradual Tf increase over time | |
| Mobile Phase Issues | Incorrect pH for ionizable analytes | Adjust pH to 2-3 units below pKa for bases; 2-3 units above pKa for acids [56] | Tf reduction from 1.8 to 1.1 for basic compounds |
| Inadequate buffer concentration | Increase buffer strength to 10-50 mM to maintain pH control [56] | Tf improvement of 20-40%; enhanced reproducibility | |
| Strong sample solvent | Match sample solvent to initial mobile phase composition | Reduces Tf by 0.2-0.5 units for early eluting peaks | |
| Sample Issues | Column overload | Dilute sample 5-10X; reduce injection volume to ≤5% column volume [56] | Linear Tf response up to optimal loading capacity |
| Matrix effects from LLE | Implement additional cleanup; change extraction solvent | Tf improvement of 15-30% for complex matrices | |
| Instrument Issues | Extra-column volume | Use narrow-bore tubing (0.12-0.17 mm ID); minimize connection length [56] | Particularly improves Tf for early eluting peaks (10-25% reduction) |
Experimental Protocol for Peak Shape Optimization:
- Inject standard solution and calculate Tf for all analytes: Tf = W₀.₀₅/2f, where W₀.₀₅ is peak width at 5% height and f is distance from peak front to apex at 5% height [56]
- If Tf > 1.5 for basic compounds, acidify mobile phase to protonate silanols (pH 2-3)
- For persistent tailing, evaluate column condition using system suitability test mix
- Reduce injection volume by 50% to assess mass overload contribution
- Verify extra-column volume by replacing connecting tubing with narrower ID (0.12 mm)
- Implement appropriate solution and re-evaluate Tf; iterate until Tf < 1.5 achieved
Retention Time Shifts
Retention time (RT) stability is fundamental for reliable peak identification and quantification, particularly in high-throughput analyses. Drifting or shifting RTs can result from various methodological and instrumental factors, with distinct patterns indicating different root causes.
Table 3: Retention Time Shifts: Causes and Solutions
| Shift Pattern | Root Cause | Corrective Action | Prevention Strategy |
|---|---|---|---|
| Gradual increase in all RTs | Evaporation of volatile mobile phase components (e.g., acetonitrile) [58] | Use well-sealed reservoirs; prepare fresh mobile phase daily | Employ instrument with online mixing; use less volatile alternatives |
| Progressive column contamination | Implement guard column; flush with strong solvent weekly | Improve sample cleanup; use SALLE for better matrix removal [40] | |
| Gradual decrease in all RTs | Loss of acidic modifier (e.g., TFA, formic acid) [58] | Increase buffer concentration; use less volatile acids | Use phosphate or acetate buffers for better stability |
| Pump check valve malfunction | Clean or replace check valves; use ceramic valves | Incorporate valve inspection in quarterly maintenance schedule | |
| Variable/unpredictable RT shifts | Inconsistent column temperature | Use column oven with ±0.5°C stability | Pre-equilibrate column for 30-60 minutes before analysis |
| Pump flow rate fluctuations | Verify flow accuracy with volumetric measurement | Perform routine pump calibration and maintenance | |
| Incomplete column equilibration | Extend equilibration time; use 10-20 column volumes | Implement equilibration monitoring with test compounds | |
| Sudden RT change | Mobile phase preparation error | Standardize preparation protocol; verify pH and composition | Use weight-based instead of volume-based preparation |
| Significant leak in system | Check fittings with paper towel test; replace seals [58] | Perform preventive seal replacement every 3-6 months |
Experimental Protocol for Retention Time Stabilization:
- Document RT variations over 10 consecutive injections using system suitability standard
- Calculate relative standard deviation (RSD%) of absolute RTs; acceptable range: <1-2% [59]
- If RSD% exceeds threshold, determine if shift affects all peaks equally (suggesting flow rate issues) or selectively (suggesting chemical changes)
- For flow-related drift: Verify flow accuracy by collecting eluent over 10 minutes in volumetric flask
- For chemical-related drift: Prepare fresh mobile phase from new solvent lots and repeat test
- Implement column temperature control at 25-40°C with ±0.5°C stability
- For persistent issues, incorporate internal standard to calculate relative retention times (RRT) for improved identification reliability [59]
Advanced Integrated Troubleshooting Workflow
The following decision tree provides a systematic approach for diagnosing and resolving interconnected UFLC-DAD issues, particularly relevant for methods incorporating liquid-liquid extraction:
Figure 2: Integrated Troubleshooting Decision Pathway
The Scientist's Toolkit: Essential Research Reagent Solutions
Table 4: Key Reagents and Materials for Optimized UFLC-DAD Analysis
| Item | Specification | Function in LLE-UFLC-DAD Analysis | Application Notes |
|---|---|---|---|
| High-Purity Water | HPLC grade, 18.2 MΩ·cm resistivity, <5 ppb TOC | Mobile phase component; minimizes baseline noise and ghost peaks | Use fresh daily; avoid bacterial growth with 4°C storage |
| Stabilized Acetonitrile | HPLC grade with UV-transparent stabilizers | Organic modifier for reversed-phase chromatography; LLE extraction solvent | Superior UV transparency at low wavelengths (<220 nm) |
| Ammonium Formate | ≥99.0% purity, mass spectrometry grade | Volatile buffer salt for mobile phase; compatible with MS detection | Use 5-20 mM concentration; prepare fresh weekly |
| Formic Acid | ≥98.0% purity, LC-MS grade | Mobile phase acidifier; suppresses silanol interactions for basic compounds | Typically used at 0.05-0.1% v/v; enhances ionization in MS |
| Ceramic Check Valves | HPLC system compatible | Prevents backflow and ensures accurate solvent proportioning | Reduces baseline noise in gradient methods with TFA |
| Guard Column | Same stationary phase as analytical column | Protects analytical column from LLE matrix contaminants | Replace after 50-100 samples; extends column lifetime 3-5X |
| In-line Degasser | 4-channel, vacuum membrane type | Removes dissolved air; reduces baseline noise and pump fluctuations | Essential for low-wavelength detection and gradient methods |
| Ghost Peak Trap Column | High-capacity adsorption media | Removes system-derived contaminants before analytical column | Particularly valuable in trace analysis and stability studies [56] |
Application Case Study: Troubleshooting a Validated LLE-UFLC-DAD Method
Background: A validated method for simultaneous quantification of andrographolide (AG) and 14-deoxy-11,12-didehydroandrographolide (DDAG) in rat plasma employing salt-assisted liquid-liquid extraction (SALLE) exhibited progressive degradation in chromatographic performance during a 120-sample pharmacokinetic study [40].
Observed Issues:
- Baseline rise of >5 mAU during gradient elution (225 nm detection)
- Tailing factor increase from 1.3 to 2.1 for AG peak
- Retention time shift of +0.4 minutes for DDAG over 72 hours
Systematic Investigation:
- Initial assessment focused on sample matrix accumulation despite SALLE cleanup
- Guard column replacement provided temporary improvement (<10 samples)
- Mobile phase freshness was verified with blank gradients
- Systematic troubleshooting identified trifluoroacetic acid (TFA) degradation as primary culprit
- Secondary factor was column degradation from matrix components
Implemented Solutions:
- Switched from TFA to 0.1% formic acid with 10 mM ammonium formate buffer
- Implemented more aggressive column cleaning protocol (acetonitrile:isopropanol:water 45:45:10)
- Added ghost peak trap column between mixer and autosampler
- Reduced time between mobile phase preparation and use from 72 to 24 hours
Results: Method performance restored to validation criteria with baseline noise <0.1 mAU, tailing factors <1.5 for all analytes, and retention time RSD <0.8% across 120-sample batch.
Successful UFLC-DAD analysis following liquid-liquid extraction requires systematic attention to three critical chromatographic parameters: baseline stability, peak symmetry, and retention time reproducibility. Through methodical investigation and resolution of these interconnected issues, analysts can achieve robust methods suitable for regulated bioanalysis and research applications. The protocols and solutions presented herein provide a structured framework for troubleshooting that maintains data quality throughout extended analytical campaigns, ultimately enhancing the reliability of pharmaceutical and bioanalytical research outcomes.
Optimization of Vortex Time, Centrifugation Speed, and Phase Separation
Application Note
This document provides detailed application notes and protocols for optimizing key parameters in vortex-assisted liquid-liquid microextraction (VALLME), a green sample preparation technique within a broader thesis on developing a liquid-liquid extraction protocol for UFLC-DAD analysis. The method focuses on the extraction and preconcentration of analytes, such as rhodamine B (RhB), from complex matrices using deep eutectic solvents (DES) [60].
Optimizing vortex time, centrifugation speed, and the resulting phase separation is critical for achieving high extraction efficiency, recovery, and method robustness. This protocol outlines a systematic approach to parameter optimization, ensuring reliable performance for sensitive analysis in drug development and related research fields [60].
Experimental Protocols
Reagents and Materials
- Deep Eutectic Solvent (DES): Prepared by combining tetrabutylammonium bromide (TBAB) and hexanol in a molar ratio of 1:3. The mixture is heated at 80°C with continuous stirring until a homogeneous, colorless liquid forms [60].
- Analytical Standard: Rhodamine B (RhB) stock solution. Working standard solutions are prepared daily by appropriate dilution.
- Real Samples: Tap water, energy drinks, and cosmetic products (e.g., lipstick).
- Equipment: Vortex mixer, laboratory centrifuge, pH meter, ultrasonic bath, UFLC-DAD system, fluorescence detector.
DES-VALLME Procedure
- Sample Preparation: Adjust the pH of a 10 mL aqueous sample (standard or real sample) to the optimal range of 2.05–3.20 using dilute HCl or NaOH [60].
- Microextraction: Transfer the pH-adjusted sample to a 15 mL conical centrifuge tube. Add 100 µL of the prepared DES extractant [60].
- Vortex Mixing: Securely cap the tube and place it on a vortex mixer. Subject the mixture to vortexing at the optimized parameter.
- Centrifugation: Immediately after vortexing, centrifuge the tube to facilitate phase separation.
- Collection: Following centrifugation, the DES phase will be sedimented at the bottom of the tube. Carefully collect the enriched DES phase using a micro-syringe.
- Analysis: Dilute the collected DES phase with a suitable solvent if necessary, and inject it into the UFLC-DAD system for quantification.
Optimization Experiments
A univariate approach or experimental design should be employed to investigate the impact of vortex time, centrifugation speed, and time on extraction efficiency. The following experimental ranges are recommended as a starting point:
- Vortex Time: Test a range from 30 seconds to 5 minutes.
- Centrifugation Speed: Test a range from 2000 rpm to 5000 rpm.
- Centrifugation Time: Test a range from 1 minute to 5 minutes.
All experiments should be performed in triplicate (n=3). The extraction efficiency should be evaluated based on the fluorescence intensity or chromatographic peak area of the target analyte.
Data Presentation
The table below summarizes the quantitative results from the optimization of vortex time, centrifugation speed, and time for the DES-VALLME protocol.
Table 1: Optimized parameters for the DES-VALLME procedure.
| Parameter | Studied Range | Optimal Value | Impact on Extraction Efficiency |
|---|---|---|---|
| Vortex Time | 30 s - 5 min | 2 min | Efficiency increases with time up to 2 minutes due to enhanced mass transfer and formation of a fine emulsion. Prolonged vortexing (>3 min) shows no significant improvement [60]. |
| Centrifugation Speed | 2000 - 5000 rpm | 4000 rpm | Speeds below 3500 rpm result in incomplete phase separation. Speeds above 4500 rpm do not yield further benefits and may increase operational time [60]. |
| Centrifugation Time | 1 - 5 min | 3 min | A minimum of 3 minutes is required for the complete sedimentation of the DES phase. Shorter times lead to incomplete collection of the extractant [60]. |
| Sample pH | 0.45 - 9.20 | 2.05 - 3.20 | Maximum extraction is achieved in this acidic range, favoring the cationic form of RhB, which is more efficiently extracted by the DES [60]. |
| DES Volume | 50 - 150 µL | 100 µL | 100 µL provides a good compromise between high enrichment factors and practical handling during collection [60]. |
Analytical Performance Data
The table below presents the analytical performance of the optimized DES-VALLME-FLD method.
Table 2: Analytical performance of the optimized DES-VALLME method for RhB determination.
| Performance Characteristic | Value |
|---|---|
| Linear Calibration Range | 0.2 to 10.0 µg L⁻¹ [60] |
| Correlation Coefficient (R²) | 0.9991 [60] |
| Limit of Detection (LOD) | 0.023 µg L⁻¹ [60] |
| Inter-day Precision (RSD) | 2.9% to 4.1% [60] |
| Recovery (in real samples) | 94.6% to 103.7% [60] |
Mandatory Visualization
DES-VALLME Workflow
Parameter Optimization Logic
The Scientist's Toolkit
Table 3: Essential research reagents and materials for DES-VALLME.
| Item | Function / Role in the Protocol |
|---|---|
| Deep Eutectic Solvent (DES) | Acts as a green, efficient extraction solvent. Its properties (e.g., hydrogen bonding capability) enable high extraction efficiency for target analytes like RhB [60]. |
| Tetrabutylammonium Bromide (TBAB) | A common component (hydrogen bond acceptor) used in the synthesis of various DES formulations [60]. |
| n-Hexanol | Serves as the hydrogen bond donor when combined with TBAB to form the specific DES used in this protocol [60]. |
| Rhodamine B (RhB) | The model analyte and a representative illegal dye, the determination of which is important for food safety and environmental protection [60]. |
| Vortex Mixer | Provides mechanical agitation to create a fine emulsion between the aqueous sample and DES, drastically increasing the contact surface area and improving extraction kinetics [60]. |
| Laboratory Centrifuge | Applied after vortexing to rapidly break the emulsion and sediment the denser DES phase, enabling its easy collection [60]. |
| UFLC-DAD System | Provides the analytical separation and detection capabilities for quantifying the target analyte after the microextraction process [60]. |
Managing Solvent Evaporation and Reconstitution for Optimal DAD Response
In Ultra-Fast Liquid Chromatography with Diode Array Detection (UFLC-DAD), the sample preparation steps of solvent evaporation and reconstitution are not merely about pre-concentration; they are critical determinants of the final analytical outcome. Within the context of a liquid-liquid extraction (LLE) protocol, these steps directly influence key chromatographic parameters, including the baseline stability, peak shape, and ultimately, the sensitivity and accuracy of the DAD response. Solvent evaporation, while necessary to concentrate analytes and transfer them into a chromatography-compatible solvent, introduces risks such as partial or complete loss of volatile analytes, thermal degradation, and adsorption to vial walls [61]. The subsequent reconstitution step, if not meticulously optimized, can lead to poor analyte solubility, inaccurate concentration representation, and the introduction of unwanted variability, all of which compromise the quality of the DAD data. This application note provides detailed protocols and data to manage these processes effectively, ensuring optimal detector response and data reliability for researchers and scientists in drug development.
The Impact of Solvent Evaporation on DAD Response
The process of solvent evaporation, particularly when conducted under a stream of nitrogen or by vacuum centrifugation, can significantly alter the chemical composition of the sample. These changes directly manifest in the DAD chromatogram and quantitative results.
Primary Effects and Consequences:
- Analyte Loss and Degradation: Volatile analytes can co-evaporate with the solvent, leading to low recovery. Furthermore, applying heat to accelerate evaporation can degrade thermolabile compounds [61]. This results in a lower than expected detector response and potentially introduces new, unidentified peaks in the chromatogram.
- Incomplete Solvent Removal: Residual, often less volatile, extraction solvents can cause significant chromatographic issues. When injected, these solvent residues can distort the early part of the chromatogram, leading to peak broadening, splitting, or shifting retention times. The DAD spectrum of the analyte can also be masked or altered by the residual solvent's UV absorbance.
- Oxidation and Adsorption: Concentrating the sample increases the risk of oxidative degradation when the sample is dried down and exposed to air. Furthermore, analytes may adsorb onto the surface of the evaporation vial, especially when the sample is taken to complete dryness, reducing the amount available for reconstitution and injection.
Table 1: Common Issues Arising from Solvent Evaporation and Their Impact on DAD Analysis
| Issue | Cause | Observed Effect on DAD Chromatogram | Impact on Quantitative Analysis |
|---|---|---|---|
| Low Analytical Recovery | Co-evaporation of volatile analytes; Adsorption to vial walls | Reduced peak area for target analytes | Underestimation of true concentration; Poor accuracy |
| Peak Tailing or Splitting | Incomplete solvent removal; Poor solubility upon reconstitution | Broadened or distorted peaks; Unstable baseline | Reduced resolution; Impaired precision and integration |
| Appearance of Degradation Peaks | Thermal decomposition during evaporation | New, unexpected peaks in the chromatogram | Incorrect peak assignment; Overestimation if degradation product co-elutes |
| Inconsistent Retention Times | Residual solvent modifying mobile phase composition locally | Shifting retention times between samples | Failed system suitability tests; Misidentification |
Optimized Protocols for Evaporation and Reconstitution
The following protocols are designed to be integrated into a comprehensive LLE workflow for UFLC-DAD analysis, minimizing the risks outlined above.
Protocol 1: Controlled Solvent Evaporation
Objective: To gently and consistently remove extraction solvent without loss or degradation of target analytes. Principle: Using a moderate temperature with a controlled stream of inert gas prevents violent boiling and minimizes oxidative stress.
Materials:
- Nitrogen evaporation system (or dry air)
- Thermostatted heating block
- Conical-bottom glass vials (recommended for better recovery than flat-bottom vials)
- Calibrated micropipettes
Procedure:
- Transfer: Following LLE, carefully transfer the organic (upper or lower, as applicable) layer to a clean, conical-bottom glass vial. Avoid transferring any of the aqueous phase.
- Set Up: Place the vials securely in the heating block, set to a temperature 10-15°C below the boiling point of the solvent being evaporated. Example: For ethyl acetate (BP ~77°C), set block to ~60-65°C.
- Evaporate: Initiate a gentle, steady stream of nitrogen gas directed into the vial, just above the surface of the liquid. The flow rate should cause a slight dimpling on the solvent surface without causing splashing.
- Monitor: Closely monitor the solvent level. The process is complete when the solvent volume is reduced to approximately 50-100 µL. It is critical to avoid taking the sample to complete dryness, as this drastically increases the risk of analyte adsorption and irreversible loss.
- Proceed: Immediately proceed to the reconstitution protocol. Do not let the partially evaporated samples sit for extended periods.
Protocol 2: Systematic Reconstitution for DAD Compatibility
Objective: To completely re-dissolve the concentrated analytes in a solvent that is compatible with the initial UFLC mobile phase, ensuring optimal peak shape and DAD response. Principle: The reconstitution solvent should be slightly weaker than the starting mobile phase to ensure proper focusing at the head of the column.
Materials:
- Reconstitution solvent (e.g., initial mobile phase composition or a slightly more organic solvent)
- Ultrasonic bath
- Vortex mixer
- HPLC vials and caps
Procedure:
- Select Solvent: Prepare the reconstitution solvent. A common and effective choice is a mixture that matches the initial composition of the UFLC gradient. For instance, if the mobile phase starts at 10% acetonitrile/90% water, use this for reconstitution.
- Reconstitute: Using a calibrated micropipette, add the required volume of reconstitution solvent to the vial containing the evaporated extract. A typical volume is 100-200 µL, depending on the desired concentration factor.
- Agitate: Cap the vial and vortex mix for 30-60 seconds to ensure the solvent contacts the entire inner surface of the vial.
- Sonicate: Place the vial in an ultrasonic bath for 2-3 minutes to aid in the dissolution of any crystalline or stubborn residues.
- Confirm Homogeneity: Visually inspect the solution for any undissolved particles. The solution should be clear and particulate-free.
- Transfer and Store: Transfer the final solution to an HPLC vial for analysis. If not analyzed immediately, store at 4°C to enhance stability, as demonstrated in quercetin analysis where samples were more stable at this temperature [61].
Table 2: Troubleshooting Guide for Evaporation and Reconstitution
| Problem | Potential Cause | Corrective Action |
|---|---|---|
| Low and variable recovery | Analyte taken to complete dryness | Stop evaporation when a small volume of solvent remains. |
| Volatile analyte loss | Use a lower evaporation temperature; do not direct gas stream into the liquid. | |
| Poor peak shape (tailing/splitting) | Reconstitution solvent stronger than mobile phase | Use a reconstitution solvent matched to or weaker than the initial mobile phase. |
| Incomplete dissolution | Increase sonication time; consider a slight increase in the organic proportion of the reconstitution solvent. | |
| Inconsistent retention times | Residual extraction solvent | Ensure complete evaporation of the extraction solvent before reconstitution. |
| New/unexpected peaks | Thermal degradation | Lower the evaporation block temperature. |
| Chemical degradation | Consider adding an antioxidant to the reconstitution solvent or working under dimmed light. |
Workflow Visualization
The following diagram illustrates the logical decision-making process for managing the evaporation and reconstitution steps to achieve optimal DAD response.
The Scientist's Toolkit: Essential Research Reagents and Materials
Successful management of solvent evaporation and reconstitution requires the use of specific, high-quality materials. The following table details the key reagents and their functions in the context of this protocol.
Table 3: Key Research Reagent Solutions and Materials
| Item | Function/Description | Critical Consideration |
|---|---|---|
| Nitrogen Gas (99.999%) | Inert gas stream for gentle solvent evaporation without oxidation. | Oil-free and moisture traps should be used to prevent sample contamination. |
| HPLC-Grade Reconstitution Solvent | Solvent for re-dissolving dried extracts; typically matches initial mobile phase. | Must be LC-MS grade for UHPLC to avoid particulate and UV-absorbing impurities [62]. |
| Conical-Bottom Glass Vials | Vessels for evaporation and reconstitution. | Conical shape maximizes recovery by minimizing the surface area for adsorption. |
| Stable Isotope-Labeled Internal Standard (IS) | Compound added to correct for variability in recovery during sample prep. | Added before the LLE step to track efficiency through evaporation and reconstitution [63]. |
| Acid/Base Modifiers | Small additives (e.g., formic acid, ammonium hydroxide) in reconstitution solvent. | Can enhance solubility and ionization; concentration must be optimized and consistent. |
| Ultrasonic Bath | Applies sonic energy to aid in the complete dissolution of analytes during reconstitution. | Regular de-gassing of the bath ensures consistent and efficient sonication. |
The processes of solvent evaporation and reconstitution are pivotal junctures in the journey from a crude extract to a high-quality UFLC-DAD chromatogram. By implementing the controlled evaporation protocol to prevent analyte loss and the systematic reconstitution protocol to ensure optimal chromatographic performance, researchers can significantly enhance the reliability and accuracy of their quantitative data. Adherence to these detailed protocols, coupled with the use of high-quality materials as outlined in the toolkit, provides a robust framework for managing these critical steps, thereby supporting the overarching goals of rigorous and reproducible scientific research in drug development and bioanalysis.
Validating Your LLE-UFLC-DAD Method and Comparing Extraction Techniques
The reliability of any analytical method, particularly in pharmaceutical and food analysis, is paramount. For a thesis investigating a liquid-liquid extraction protocol for Ultra-Fast Liquid Chromatography with Diode Array Detection (UFLC-DAD) analysis, demonstrating the method's validity is a foundational requirement. Method validation provides documented evidence that the analytical procedure is suitable for its intended purpose, ensuring the trustworthiness of the generated data. This document outlines the core validation parameters—Linearity, Limit of Detection (LOD), Limit of Quantification (LOQ), Accuracy, Precision, and Robustness—within the context of developing a liquid-liquid extraction protocol for UFLC-DAD. It provides detailed application notes and experimental protocols aligned with international regulatory guidelines such as those from the International Council for Harmonisation (ICH) [64].
Core Validation Parameters and Protocols
The following parameters are essential for demonstrating that an analytical method is fit for purpose. The protocols are framed around the analysis of phenolic compounds in fruit extracts, a common application for UFLC-DAD, as exemplified by recent research using Salting-out Liquid-Liquid Extraction (SALLE) [23].
Linearity and Range
Definition and Purpose: Linearity is the ability of a method to obtain test results that are directly proportional to the concentration of the analyte in a sample within a specified range [65]. The range is the interval between the upper and lower concentration levels of an analyte for which acceptable levels of linearity, accuracy, and precision have been demonstrated [64] [66].
Experimental Protocol:
- Preparation of Standards: Prepare a minimum of five standard solutions at different concentration levels across the anticipated range. For an assay of a major component, the ICH recommends a range of 80-120% of the target concentration [64] [66].
- Analysis: Analyze each concentration level in triplicate using the developed UFLC-DAD method.
- Data Analysis: Plot the mean peak area (or height) against the corresponding analyte concentration. Perform a linear regression analysis to determine the correlation coefficient (r²), slope, and y-intercept.
- Acceptance Criteria: A correlation coefficient (r²) of ≥ 0.999 is typically required for assay methods [66] [67]. The y-intercept should not be significantly different from zero.
Table 1: Exemplary Linearity Data for Phenolic Compound Analysis via UFLC-DAD [23] [16]
| Analyte | Concentration Range (µg/mL) | Correlation Coefficient (r²) | Calibration Curve Equation |
|---|---|---|---|
| Gallic Acid | 1 - 100 | 0.9995 | y = 42,044.53x + 6.54 |
| Vanillic Acid | 1 - 100 | 0.9999 | y = 74,201.08x + 0.67 |
| Syringic Acid | 1 - 100 | 0.9994 | y = 62,603.85x + 0.44 |
Accuracy
Definition and Purpose: Accuracy expresses the closeness of agreement between a measured value and a value accepted as a true or reference value. It is typically reported as percent recovery [65].
Experimental Protocol (Recovery Study):
- Sample Preparation: Spike a pre-analyzed sample matrix (e.g., a fruit pulp placebo) with known quantities of the target analyte at three concentration levels (e.g., 80%, 100%, and 120% of the target concentration). Prepare a minimum of three replicates at each level.
- Extraction and Analysis: Subject the spiked samples to the complete SALLE and UFLC-DAD analytical procedure.
- Calculation: Calculate the percentage recovery for each spike level using the formula:
- % Recovery = (Measured Concentration / Spiked Concentration) × 100
- Acceptance Criteria: Mean recovery should be within 100 ± 3% for the target concentration [67]. Recoveries of 98-102% with an RSD of less than 2% are commonly achieved in validated methods [23].
Precision
Definition and Purpose: Precision is the closeness of agreement between a series of measurements obtained from multiple sampling of the same homogeneous sample under prescribed conditions. It is subdivided into repeatability (intra-assay) and intermediate precision [65].
Experimental Protocol:
- Repeatability: Analyze six independent preparations of a homogeneous sample at 100% of the test concentration by a single analyst on the same day using the same equipment. Calculate the % Relative Standard Deviation (%RSD) of the results.
- Intermediate Precision: To assess the method's consistency under normal laboratory variations, have a second analyst repeat the repeatability experiment on a different day, using a different HPLC system and freshly prepared reagents and standards. Compare the results from both analysts.
- Acceptance Criteria: For assay methods, the %RSD for repeatability should be ≤ 2.0%. The % difference between the mean values obtained by two analysts for intermediate precision should also be within predefined limits (e.g., ≤ 3.0%) [16] [65].
Table 2: Precision Data for Guanylhydrazone Analysis by HPLC-DAD [16]
| Analyte | Precision Type | Concentration (µg/mL) | Mean Area ± RSD | % RSD |
|---|---|---|---|---|
| LQM10 | Intra-day (n=6) | 10 | 58,046 ± 1.48 | 1.48% |
| LQM10 | Inter-day (n=6) | 10 | 56,976 ± 2.81 | 2.81% |
| LQM14 | Intra-day (n=6) | 10 | 101,134 ± 2.00 | 2.00% |
Limit of Detection (LOD) and Limit of Quantification (LOQ)
Definition and Purpose: The LOD is the lowest concentration of an analyte that can be detected, but not necessarily quantified, under the stated experimental conditions. The LOQ is the lowest concentration that can be quantified with acceptable precision and accuracy [65].
Experimental Protocol:
- Signal-to-Noise Ratio (Recommended): Analyze progressively diluted standard solutions and measure the signal-to-noise (S/N) ratio. The LOD is the concentration at which S/N is approximately 3:1, and the LOQ is the concentration at which S/N is approximately 10:1 [65].
- Standard Deviation of Response: Alternatively, based on the ICH Q2(R1) guideline, LOD and LOQ can be calculated as:
Robustness
Definition and Purpose: Robustness is a measure of a method's capacity to remain unaffected by small, deliberate variations in its procedural parameters. It indicates the method's reliability during normal usage and helps define its system suitability criteria [64] [65].
Experimental Protocol (via One-Factor-at-a-Time - OFAT):
- Parameter Selection: Identify critical method parameters that could vary, such as:
- Mobile phase pH (± 0.1 units)
- Mobile phase composition (± 2-5% of organic modifier)
- Column temperature (± 2°C)
- Flow rate (± 0.1 mL/min)
- Detection wavelength (± 2 nm)
- Experimental Design: Using a standard solution and a sample solution, analyze them while introducing small, deliberate changes to one parameter at a time, keeping all others constant.
- Evaluation: Monitor the impact on critical chromatographic outcomes, such as retention time, resolution, tailing factor, and peak area.
- Acceptance Criteria: The method is considered robust if all system suitability criteria are met despite these variations. For example, a study on guanylhydrazones showed that a ± 0.05 change in mobile phase pH resulted in an RSD of less than 1.8% for peak area, confirming robustness [16].
The Scientist's Toolkit: Research Reagent Solutions
The following materials are essential for developing and validating a liquid-liquid extraction protocol for UFLC-DAD analysis.
Table 3: Essential Reagents and Materials for LLE-UFLC-DAD Analysis
| Item | Function/Description | Example from Literature |
|---|---|---|
| Salting-Out Agent (e.g., NaCl) | Promotes phase separation in liquid-liquid extraction by reducing the solubility of organic solvents in the aqueous phase, enhancing the recovery of analytes. | Used in SALLE for phenolic compounds from fruits [23]. |
| Water-Miscible Organic Solvent (e.g., Acetonitrile, Methanol) | Acts as the extraction solvent in SALLE. Its miscibility with water allows it to penetrate the matrix before being "salted out." | Acetonitrile and methanol are common choices for phenolic compound extraction [23] [64]. |
| Acid/Base Modifiers | Used to adjust the pH of the sample or mobile phase to control the ionization of analytes, thereby improving extraction efficiency and chromatographic peak shape. | o-Phosphoric acid or acetic acid are used to acidify the mobile phase [23] [16]. |
| HPLC/UHPLC Column (C18, RRHT) | The stationary phase for chromatographic separation. Columns with sub-2µm particles (for UHPLC) or Rapid Resolution High Throughput (RRHT) technology enable fast, high-resolution separations. | RRHT columns used for ultra-fast separation of 40 phenolics in <14 min [23]. |
| Buffered Mobile Phases | The liquid phase that carries the sample through the column. Buffers (e.g., phosphate, formate) are used to maintain a constant pH, ensuring reproducible retention times. | NaH₂PO₄ buffer (pH 4.95) used in the analysis of B vitamins [67]. |
| Standard Reference Materials | High-purity compounds used to prepare calibration standards for quantification, accuracy (recovery) studies, and to identify analytes by retention time and spectrum. | External standards of gallic acid, vanillic acid, etc., were used for quantification [23]. |
Visual Experimental Workflows
Method Validation Workflow
The following diagram illustrates the logical sequence and relationships between the key stages of analytical method development and validation.
SALLE-UFLC-DAD Analytical Protocol
This workflow details the specific experimental steps for a Salting-Out Liquid-Liquid Extraction followed by UFLC-DAD analysis, as applied to a fruit matrix.
In the realm of analytical chemistry, particularly within pharmaceutical and environmental research, the reliability of data generated by Ultra-Fast Liquid Chromatography with Diode Array Detection (UFLC-DAD) is fundamentally dependent on the sample preparation stage. Liquid-liquid extraction (LLE) remains a cornerstone technique for the isolation and preconcentration of analytes from complex matrices. However, the accuracy and precision of the subsequent analysis are heavily influenced by two critical parameters: extraction efficiency and matrix effects. Extraction efficiency, quantified through recovery studies, measures the effectiveness of an extraction method in transferring an analyte from the original sample into the analysis-ready extract. Concurrently, matrix effects describe the alteration of analytical signal intensity caused by co-eluting compounds from the sample matrix, which can lead to significant inaccuracies. This protocol provides a detailed framework for systematically assessing these parameters, ensuring the validity of data generated within a broader thesis on LLE protocol development for UFLC-DAD analysis.
Theoretical Foundations
Defining Key Parameters
- Extraction Recovery (ER): This is a measure of the efficiency of the extraction process and is calculated as the ratio of the analyte response from a pre-spiked sample (extracted) to that of a post-extraction spiked sample (representing 100% recovery), expressed as a percentage. A recovery close to 100% indicates that the method efficiently transfers the analyte from the sample to the analytical instrument with minimal loss.
- Matrix Effect (ME): In LC-MS/MS, the matrix effect is observed as the suppression or enhancement of an analyte's ionization efficiency due to co-eluting matrix components. It is calculated by comparing the analyte response in a post-extracted spiked sample to the response of the same analyte in a pure solvent standard. An ME of 100% indicates no matrix effect, while values below or above signify suppression or enhancement, respectively. While most pronounced in MS detection, matrix components can also interfere with DAD detection by contributing to background noise or spectral overlap.
- Process Efficiency (PE): This parameter provides a holistic view of the entire process by accounting for both extraction recovery and matrix effects combined. It is calculated from the response of a pre-spiked sample against a neat solvent standard.
The relationship between these three core parameters can be visualized as follows:
The Impact of Co-extracted Phospholipids
Phospholipids are a major class of matrix components known to cause significant ion suppression in electrospray ionization (ESI) mass spectrometry. Supported liquid extraction (SLE) has been demonstrated to be highly effective in reducing phospholipid content in final extracts compared to simpler techniques like protein precipitation (PPT). A systematic evaluation showed that SLE can achieve recoveries exceeding 75% for a diverse set of pharmaceutical compounds while simultaneously reducing matrix effects through the effective removal of phospholipids. The choice of elution solvent in SLE is critical; for instance, ethyl acetate was found to co-extract more phospholipids and induce a stronger matrix effect compared to other solvents [68].
Experimental Protocols
Protocol for Recovery Studies
This procedure is designed to quantitatively determine the extraction efficiency of your LLE protocol for the target analyte(s).
1. Principle: The recovery is determined by comparing the analytical response of a sample spiked with the analyte before the extraction process to the response of a sample spiked after extraction.
2. Reagents and Solutions:
- Standard solutions of the target analyte(s) at known concentrations.
- Appropriate blank matrix (e.g., biological fluid, environmental water, sediment extract).
- All solvents and chemicals required for the LLE procedure.
3. Procedure: 1. Pre-spiked Sample (Test): Spike a known amount of the analyte standard into the blank matrix (n ≥ 5). Allow it to equilibrate, then subject it to the complete LLE and UFLC-DAD analysis protocol. 2. Post-spiked Sample (Control): Take an aliquot of the blank matrix and subject it to the complete LLE procedure. After extraction and reconstitution, spike the same known amount of analyte standard into the cleaned extract (n ≥ 5). This sample represents 100% recovery. 3. Analysis: Analyze both sets of samples using the developed UFLC-DAD method.
4. Calculation:
Recovery (%) = (Mean Peak Area of Pre-spiked Sample / Mean Peak Area of Post-spiked Sample) × 100
Protocol for Matrix Effect Evaluation
This procedure assesses whether components in the sample matrix are interfering with the detection of the analyte.
1. Principle: The matrix effect is evaluated by comparing the analytical response of an analyte in a post-extracted matrix to its response in a pure solvent.
2. Procedure: 1. Post-Extraction Spiked Sample (Matrix Solution): As prepared in Section 3.1, step 3.2. 2. Neat Solvent Standard (Standard Solution): Prepare a standard at the same concentration as the spiked samples using the reconstitution solvent (no matrix). 3. Analysis: Analyze the post-extraction spiked samples and the neat solvent standards using the UFLC-DAD method.
3. Calculation:
Matrix Effect (ME%) = (Mean Peak Area of Post-extraction Spiked Sample / Mean Peak Area of Neat Solvent Standard) × 100
- ME ~ 100%: No significant matrix effect.
- ME < 100%: Signal suppression.
- ME > 100%: Signal enhancement.
Comprehensive Workflow for a Full Validation
The complete experimental journey, from sample preparation to data interpretation, integrates the protocols for recovery and matrix effect evaluation as summarized in the following workflow:
Data Presentation and Analysis
The quantitative data generated from recovery and matrix effect studies should be systematically summarized for clear interpretation and comparison. The following table provides a template for presenting this data for multiple analytes.
Table 1: Example Data Table for Extraction Recovery and Matrix Effect Evaluation
| Analyte | Spiked Concentration (μg/L) | Extraction Recovery (%) (Mean ± RSD, n=5) | Matrix Effect (%) (Mean ± RSD, n=5) | Process Efficiency (%) |
|---|---|---|---|---|
| Atrazine | 50.0 | 89.5 ± 1.8 | 105.2 ± 3.1 | 94.2 |
| Desethylatrazine | 50.0 | 85.2 ± 2.5 | 98.6 ± 2.8 | 84.0 |
| Diazinon | 200.0 | 92.1 ± 1.3 | 92.5 ± 3.5 | 85.2 |
| Phosalone | 100.0 | 88.7 ± 2.1 | 108.6 ± 2.9 | 96.3 |
Data is for illustrative purposes. RSD: Relative Standard Deviation.
Interpretation of Results:
- Recovery: Acceptable recovery ranges are typically 70-120% for trace analysis, depending on the guidelines followed. The Relative Standard Deviation (RSD) should generally be <5-10% to demonstrate precision [69].
- Matrix Effect: A value of 100% indicates no effect. Significant deviation from 100% necessitates corrective actions, such as further cleanup, chromatographic optimization, or the use of internal standardization.
The Scientist's Toolkit: Research Reagent Solutions
The success of an LLE protocol hinges on the careful selection of reagents and materials. The following table outlines key solutions used in the featured experiments and their critical functions.
Table 2: Essential Reagents and Materials for LLE Protocol Development
| Reagent/Material | Function/Description | Application Example |
|---|---|---|
| 2,4-Dinitrophenylhydrazine (2,4-DNPH) | A derivatization reagent that reacts with carbonyl compounds (aldehydes, ketones) to form stable hydrazones, enabling their UV detection and improving extraction efficiency [3]. | Analysis of toxic carbonyl compounds like acrolein and 4-hydroxy-2-nonenal in thermally degraded soybean oil [3]. |
| Supramolecular Solvents (SUPRAS) | Nano-structured solvents formed by amphiphilic aggregates (e.g., 1-decanol and THF). They offer high extraction efficiency for a range of analytes and are considered environmentally friendly [70]. | Preconcentration of Sudan I dye from environmental water and food samples prior to UV-Vis analysis [70]. |
| Deep Eutectic Solvents (DES) | Green solvents formed from a hydrogen bond acceptor (e.g., imidazolium chloride) and donor (e.g., 1-undecanol). They are low-cost, have low volatility, and can be designed for specific extraction tasks [69]. | Liquid-phase microextraction of pesticides like atrazine and diazinon from environmental water samples for HPLC-UV analysis [69]. |
| Supported Liquid Extraction (SLE) Plates | A solid support that holds the aqueous sample, which is then eluted with a water-immiscible organic solvent. It offers a high-throughput, automatable alternative to traditional LLE with effective phospholipid removal [68]. | Reducing matrix effect and improving extraction recovery for a panel of 10 diverse pharmaceutical compounds in LC-MS/MS bioanalysis [68]. |
| Acetonitrile | A common organic solvent used in liquid-liquid extraction and chromatography. Its polarity and miscibility properties make it suitable for extracting a wide range of compounds [3]. | Used as an extraction solvent for carbonyl compounds derivatized with 2,4-DNPH from soybean oil [3]. |
Troubleshooting and Optimization
Despite a well-designed protocol, challenges may arise. Here are common issues and their potential solutions:
- Low Recovery: This indicates losses during the extraction. Potential remedies include:
- Adjusting the pH of the sample to ensure analytes are in their uncharged form.
- Increasing the volume or changing the type of extraction solvent.
- Adding a salting-out agent (e.g., NaCl, (NH₄)₂SO₄) to improve partitioning into the organic phase [71].
- Increasing extraction time or using auxiliary energy like ultrasonication [70].
- Strong Matrix Effect: This suggests inadequate cleanup.
- Incorporate a more selective LLE solvent (e.g., switch from ethyl acetate to dichloromethane to reduce phospholipid co-extraction) [68].
- Introduce a secondary cleanup step, such as passing the extract through a solid-phase sorbent.
- Optimize the chromatographic method to shift the analyte's retention time away from the region where matrix components elute.
- Use a stable isotope-labeled internal standard (SIL-IS) for mass spectrometry methods, as it compensates for ionization suppression/enhancement.
Within the framework of advanced chromatographic analysis, particularly Ultra-Fast Liquid Chromatography with Diode Array Detection (UFLC-DAD), sample preparation is a critical step that significantly influences method sensitivity, accuracy, and overall analytical throughput. This application note provides a detailed comparative analysis of three prominent liquid-phase extraction techniques—Liquid-Liquid Extraction (LLE), Dispersive Liquid-Liquid Microextraction (DLLME), and Supported Liquid Extraction (SLE)—within the context of developing robust protocols for UFLC-DAD analysis. Each technique is evaluated based on its fundamental principles, applicability in pharmaceutical and food chemistry research, and compatibility with modern analytical workflows. The data and protocols presented herein are designed to assist researchers and drug development professionals in selecting the most appropriate extraction methodology for their specific analytical challenges.
The selection of an extraction technique hinges on understanding its fundamental mechanics and its alignment with analytical goals. The following diagram illustrates the core operational workflows for LLE and SLE, highlighting key procedural differences.
LLE is a classical technique based on the partitioning of analytes between two immiscible liquids, typically an aqueous sample and an organic solvent [72]. While well-understood and effective, it is labor-intensive, prone to emulsion formation, and difficult to automate. In contrast, SLE is a more modern approach that retains the principles of LLE but uses an inert, high-surface-area solid support to hold the aqueous phase, facilitating a more efficient and cleaner partitioning process as the organic solvent passes through it [73] [72]. This method virtually eliminates emulsions, is easier to automate, and generally requires less organic solvent. DLLME, while not detailed in the provided search results, is a miniaturized technique involving the rapid injection of a water-immiscible extraction solvent and a disperser solvent into an aqueous sample, creating a cloudy solution that maximizes the extraction surface area for rapid equilibrium.
Table 1: Comparative Analysis of LLE, SLE, and DLLME Techniques
| Feature | Liquid-Liquid Extraction (LLE) | Supported Liquid Extraction (SLE) | Dispersive Liquid-Liquid Microextraction (DLLME) |
|---|---|---|---|
| Fundamental Principle | Partitioning between two immiscible liquid phases [72] | Partitioning of an organic solvent through a supported aqueous phase [73] [72] | Formation of a cloudy solution via disperser solvent for micro-extraction |
| Typical Sample Volume | 500 µL - 1 L (varies widely) | 200 - 500 µL (for bioanalysis) [74] | Very small (e.g., < 1 mL) |
| Organic Solvent Consumption | High | Moderate to Low [72] | Very Low (micro-volume) |
| Risk of Emulsion Formation | High [72] | Very Low [72] [75] | Moderate |
| Automation Potential | Low | High (96-well plate format) [76] [72] | Moderate |
| Throughput | Low (serial processing) | High (parallel processing) [76] | Moderate to High |
| Relative Cost | Low (glassware) | Moderate (commercial plates) | Low |
Detailed Experimental Protocols
Protocol 1: Classical Liquid-Liquid Extraction (LLE) for Carbonyl Compounds in Oils
This protocol is adapted from a validated method for quantifying toxic carbonyl compounds (CCs) like acrolein and 4-hydroxy-2-nonenal (HNE) in thermally oxidized soybean oil, suitable for UFLC-DAD-MS analysis [3] [8].
3.1.1 Research Reagent Solutions
- Soybean Oil Sample: Subjected to continuous heating at 180°C for varying time intervals to induce thermal oxidation [3].
- Derivatization Reagent: 2,4-Dinitrophenylhydrazine (2,4-DNPH). It reacts with carbonyl functional groups to form stable hydrazones amenable to UV and MS detection [3].
- Extraction Solvent: Acetonitrile. Demonstrated superior extraction capacity for carbonyl compounds from the oil matrix compared to methanol [3] [8].
- Acidified Water: Used for back-extraction and cleanup to remove polar interferences.
3.1.2 Step-by-Step Procedure
- Derivatization: Weigh approximately 1 g of heated soybean oil into a glass vial. Add a known concentration of an internal standard (if used) and a solution of 2,4-DNPH. Vortex the mixture thoroughly to ensure complete reaction.
- Liquid-Liquid Extraction: Add 1.5 mL of acetonitrile to the derivatized oil sample [8].
- Mixing: Manually stir the mixture vigorously for 3 minutes to facilitate the transfer of the derivatized carbonyl compounds into the acetonitrile phase [8].
- Sonication: Place the vial in an ultrasonic bath for 30 minutes to enhance extraction efficiency and phase separation [8].
- Centrifugation: Centrifuge the mixture at high speed (e.g., 4000 rpm for 10 minutes) to achieve complete phase separation.
- Collection: Carefully collect the upper acetonitrile layer (containing the target hydrazones) using a micropipette.
- Analysis: Filter the extract through a 0.20 µm membrane filter and inject an aliquot into the UFLC-DAD-MS system for separation and quantification.
Protocol 2: Supported Liquid Extraction (SLE) for Bioanalytical Applications
This protocol is based on a validated method for the determination of erlotinib in human plasma using SLE coupled with HILIC-MS/MS, showcasing a high-throughput approach compatible with LC systems [76].
3.2.1 Research Reagent Solutions
- ISOLUTE SLE+ Plate: A 96-well plate packed with a refined, porous, highly purified diatomaceous earth sorbent with a 200-µL capacity per well [76] [75].
- Biological Sample: Human plasma, pre-treated with a modifier to adjust pH and suppress analyte ionization.
- Elution Solvent: Methyl-tert-butyl ether (MTBE). A volatile, water-immiscible solvent suitable for eluting a wide range of analytes [76].
- Internal Standard (IS) Solution: Erlotinib-d6 in 1:1 ACN-H₂O for quantitative accuracy [76].
3.2.2 Step-by-Step Procedure
- Sample Pretreatment: Piper 100 µL of human plasma into a deep-well plate. Add 10 µL of the internal standard working solution and 100 µL of 10% ammonium hydroxide. Vortex-mix well to ensure homogeneity [76].
- Sample Loading: Apply the entire 200 µL of pre-treated sample to the SLE+ well. Do not exceed the well's capacity.
- Initiation and Absorption: Apply a gentle positive pressure for a few seconds to initiate flow onto the sorbent. Allow the sample to absorb and disperse as a thin film on the hydrophilic surface for 5-10 minutes. This step is critical for efficient partitioning [76] [75].
- Analyte Elution: Add 0.80 mL of MTBE to the well and allow it to percolate through the supported aqueous phase by gravity. A positive pressure can be applied at the end to ensure complete elution into a clean collection plate [76].
- Direct Injection: A 10-µL aliquot of the organic eluent can be injected directly into the HILIC-MS/MS system without a dry-down step, demonstrating excellent compatibility with LC-MS workflows [76].
Protocol 3: Dispersive Liquid-Liquid Microextraction (DLLME)
As comprehensive search results for a specific UFLC-DAD application of DLLME were not available, a generalized protocol based on standard principles is provided.
3.3.1 Research Reagent Solutions
- Aqueous Sample: The sample solution containing the analytes of interest.
- Extraction Solvent: A high-density, water-immiscible organic solvent (e.g., chlorobenzene, carbon tetrachloride).
- Disperser Solvent: A water-miscible solvent (e.g., acetone, acetonitrile) to facilitate the dispersion of the extraction solvent.
3.3.2 Step-by-Step Procedure
- Solution Preparation: Place the aqueous sample (e.g., 5 mL) into a conical glass test tube.
- Rapid Injection: Rapidly inject a mixture of the disperser solvent (e.g., 1.0 mL) and extraction solvent (e.g., 50 µL) using a syringe.
- Cloudy Solution Formation: A cloudy solution forms immediately, consisting of fine droplets of the extraction solvent dispersed throughout the aqueous phase, providing a vast surface area for extraction.
- Centrifugation: Centrifuge the tube for a short period (e.g., 5 minutes) to separate the phases and sediment the dense extraction solvent at the bottom.
- Sedimented Collection: Carefully remove the aqueous phase and collect the sedimented phase using a micro-syringe.
- Reconstitution/Analysis: The micro-volume of extract can be diluted or directly injected into a UFLC-DAD system for analysis.
Critical Data and Performance Comparison
The quantitative performance of these techniques varies significantly, influencing protocol selection. The following table summarizes key metrics based on the provided application notes.
Table 2: Quantitative Performance Metrics from Application Notes
| Extraction Technique | Application | Reported Recovery | Limit of Quantification (LOQ) | Remarks |
|---|---|---|---|---|
| LLE [8] | Carbonyl compounds in soybean oil (UFLC-DAD-ESI-MS) | 70.7% - 85.0% (at 0.2 µg/mL) | 0.2 µg/mL for all compounds | Robust but manual; requires derivatization [3] |
| SLE [76] | Erlotinib in human plasma (HILIC-MS/MS) | 101.3% | 2 ng/mL | High recovery and sensitivity; easily automated |
| SLE [74] | β-blockers & NSAIDs in plasma (LC-MS/MS) | Higher than LLE for all analytes | Equivalent or better than LLE using 60% less sample volume | Superior recovery and cleaner extracts vs. LLE |
| DLLME | General Principle | Typically High | Very Low (due to pre-concentration) | Known for high enrichment factors |
The choice between LLE, SLE, and DLLME is dictated by the specific demands of the analytical project. LLE remains a viable, low-cost option for standard applications where emulsion formation is not a primary concern and automation is not required. SLE is highly recommended for high-throughput bioanalytical and pharmaceutical applications requiring robust, reproducible, and automatable sample cleanup with high recovery and minimal matrix effects. Its compatibility with direct injection into HILIC-MS/MS systems further enhances its utility in modern labs [76]. DLLME is the technique of choice when sample volume is limited, and the highest possible pre-concentration is needed, though method development for complex matrices can be challenging. For UFLC-DAD analysis of complex food matrices (like oxidized oils), LLE with derivatization is a proven, though laborious, path. For drug development involving biological fluids, SLE offers a clear advantage in efficiency, throughput, and performance.
This document provides detailed application notes and protocols for the determination of pesticides, pharmaceuticals, and colorants, framed within a broader thesis research on liquid-liquid extraction (LLE) protocols for Ultra-Fast Liquid Chromatography with Diode Array Detection (UFLC-DAD) analysis. The determination of such compounds in complex matrices is crucial for ensuring food safety, pharmaceutical efficacy, and environmental health. Sample preparation, particularly LLE, remains a critical step for isolating analytes from interfering components, thereby enhancing detection sensitivity and analytical accuracy. This paper outlines validated methodologies, including specific LLE procedures, applied to real-world samples, providing researchers and drug development professionals with robust protocols for their analytical workflows.
Liquid-Liquid Extraction Protocol for UFLC-DAD Analysis
The core LLE protocol described here has been adapted and optimized from a method developed for analyzing carbonyl compounds in heated soybean oil [3] [8]. The following is a detailed step-by-step procedure suitable for a broad range of analytes in various matrices.
Materials and Reagents
- Analytical Standards: Purified target analytes (e.g., pesticide standards, pharmaceutical compounds, or colorants like Rhodamine B).
- Solvents: Acetonitrile (HPLC grade), Methanol (HPLC grade), Dichloromethane (HPLC grade).
- Derivatization Reagent: 2,4-Dinitrophenylhydrazine (2,4-DNPH) solution for carbonyl compound analysis [3].
- Samples: Target matrices such as edible oils, water, or food samples.
- Equipment: Ultrasonic bath, centrifuge, vortex mixer, micropipettes, glass vials, and UFLC-DAD system.
Step-by-Step Procedure
- Sample Preparation: Weigh 1.0 g of the homogenized sample (e.g., oil, food homogenate) into a glass centrifuge tube.
- Extraction Solvent Addition: Add 1.5 mL of acetonitrile as the extraction solvent to the sample [8]. Acetonitrile has been demonstrated to provide optimal extraction efficiency for various organic compounds, balancing polarity and immiscibility with oily matrices [3].
- Manual Agitation: Manually stir the mixture vigorously for 3 minutes to ensure complete interaction between the solvent and the sample [8].
- Sonication: Place the tube in an ultrasonic bath and sonicate for 30 minutes. This step enhances the extraction efficiency by facilitating the transfer of analytes into the solvent phase [8].
- Centrifugation: Centrifuge the mixture at a high speed (e.g., 10,000 rpm) for 10 minutes to achieve complete phase separation.
- Collection: Carefully collect the upper organic layer (acetonitrile phase) using a micropipette.
- Filtration: Pass the collected extract through a 0.20 μm nylon syringe filter to remove any particulate matter prior to chromatographic analysis [77].
- Analysis: Inject the purified extract into the UFLC-DAD system for separation and quantification.
Protocol Optimization and Validation
The described method was validated for the analysis of carbonyl compounds in oil, showing good selectivity, precision, and accuracy. Key validation parameters are summarized in the table below [8]:
Table 1: Method Validation Parameters for Carbonyl Compound Analysis
| Parameter | Value / Range | Description |
|---|---|---|
| Linear Range | 0.2 - 10.0 μg/mL | Concentration range for calibration. |
| Recovery | 70.7% - 85.0% | At the lowest concentration level (0.2 μg/mL). |
| Limit of Detection (LOD) | 0.03 - 0.1 μg/mL | Varies by specific carbonyl compound. |
| Limit of Quantification (LOQ) | 0.2 μg/mL | For all target compounds. |
Application Case Studies
Case Study 1: Determination of Pesticides in Water Samples
The analysis of pesticides in environmental samples like water is critical for monitoring pollution. A solid-phase extraction (SPE) method coupled with HPLC-DAD has been successfully applied for this purpose [78].
- Sample Preparation: Water samples were processed using SPE on C18 cartridges for preconcentration and cleanup. Analytes were eluted with methanol and dichloromethane [78].
- Chromatographic Analysis: The methanol eluates were analyzed by HPLC-DAD. The method demonstrated a wide linear range of 0.1–50.0 μg/mL for all pesticides, with correlation coefficients (r) between 0.9992 and 1.000. Limits of detection (LOD) for HPLC-DAD ranged from 0.02 to 3.68 μg/mL [78].
Table 2: Analytical Figures of Merit for Pesticide Determination in Water
| Analyte Class | Sample Prep | Analysis Method | Linear Range (μg/mL) | LOD (μg/mL) |
|---|---|---|---|---|
| Multiclass Pesticides | SPE (C18) | HPLC-DAD | 0.1 - 50.0 | 0.02 - 3.68 |
Case Study 2: Determination of Mangiferin inSwertiaSpecies
The quantification of bioactive pharmaceutical compounds in plant materials is essential for quality control. A Reverse Phase-UFLC-DAD method was developed to determine the antidiabetic and anticancer compound mangiferin in 11 different Swertia species [77].
- Extraction: Powdered plant material was extracted with methanol for 24 hours [77].
- Chromatographic Conditions:
- Column: Lichrospher 100, C18e (5 μm, 250 x 4.6 mm).
- Mobile Phase: 0.2% Triethylamine (pH 4 with O-phosphoric acid) and Acetonitrile (85:15).
- Flow Rate: 1 mL/min.
- Detection Wavelength: 257 nm.
- Injection Volume: 20 μL [77].
- Results: The method was highly sensitive, with an LOD of 0.158 μg/mL and LOQ of 0.479 μg/mL. It revealed significant variation in mangiferin content, with S. minor containing the highest amount (63.84 ± 3.19 mg/g), followed by S. chirayita (47.78 ± 2.39 mg/g) [77].
Case Study 3: Determination of Rhodamine B Colorant in Foods
The detection of illegal colorants like Rhodamine B in food is a key public health concern. A green and simple deep eutectic solvent-based liquid-liquid microextraction (DES-LLME) method coupled with Smartphone Digital Image Colorimetry (SDIC) has been recently developed [79].
- Extraction: A DES composed of tetrabutylammonium bromide and octanol (1:2 ratio) was used to extract Rhodamine B from food samples, eliminating the need for additional reagents [79].
- Detection: The extracted dye was quantified using SDIC, which analyzes color intensity in the green channel of a smartphone image.
- Method Performance: The method showed excellent linearity (R² = 0.9996), with an LOD of 0.0054 μg/mL and LOQ of 0.018 μg/mL. Recovery rates from food samples ranged from 95.16% to 103.88%, demonstrating high accuracy [79].
Table 3: Summary of Analytical Methods for Different Compound Classes
| Case Study | Target Analytes | Sample Matrix | Core Sample Prep | Analysis Technique |
|---|---|---|---|---|
| 1 | Multiclass Pesticides | Water | Solid-Phase Extraction (SPE) | HPLC-DAD |
| 2 | Mangiferin (Pharmaceutical) | Swertia Plant Material | Solvent Extraction (Methanol) | RP-UFLC-DAD |
| 3 | Rhodamine B (Colorant) | Food | Deep Eutectic Solvent-LLME | Smartphone DIC |
The Scientist's Toolkit: Research Reagent Solutions
The following table lists key reagents and materials used in the featured experiments, along with their critical functions in the analytical protocols.
Table 4: Essential Research Reagents and Materials
| Reagent/Material | Function in the Protocol | Application Context |
|---|---|---|
| Acetonitrile (HPLC Grade) | Primary extraction solvent for LLE; effective for a wide range of organic compounds. | Carbonyl compounds in oil [3] [8]. |
| 2,4-Dinitrophenylhydrazine (2,4-DNPH) | Derivatizing agent for carbonyl compounds, forming stable hydrazones for UV detection. | Carbonyl compounds in oil [3]. |
| C18 Solid-Phase Extraction Cartridge | Preconcentrates and cleans up samples by retaining non-polar analytes from aqueous matrices. | Pesticides in water [78]. |
| Triethylamine / O-Phosphoric Acid | Mobile phase buffer to control pH, improving peak shape and separation efficiency. | Mangiferin analysis by RP-UFLC [77]. |
| Deep Eutectic Solvent (DES) | Green, tunable solvent for microextraction; reduces environmental impact. | Rhodamine B in food [79]. |
| Methanol (HPLC Grade) | Universal solvent for extraction and dissolution of a wide range of analytes. | Mangiferin extraction [77]. |
Workflow and Relationship Visualizations
The following diagram illustrates the generalized logical workflow for the determination of analytes in complex matrices, as derived from the case studies.
LLE Protocol Specific Workflow
This diagram details the specific steps involved in the core Liquid-Liquid Extraction protocol.
Demonstrating Method Suitability for Regulatory Compliance
In the realm of pharmaceutical analysis and environmental monitoring, demonstrating method suitability is a fundamental regulatory requirement to ensure the accuracy, reliability, and reproducibility of analytical results. Method suitability testing verifies that an analytical procedure is fit for its intended purpose, providing documented evidence that the method consistently produces results that meet predefined acceptance criteria under normal operating conditions. For techniques combining liquid-liquid extraction (LLE) with Ultra-Fast Liquid Chromatography Diode Array Detection (UFLC-DAD), a comprehensive suitability protocol is indispensable for regulatory submissions to bodies like the FDA and for compliance with International Council for Harmonisation (ICH) guidelines.
This framework is particularly crucial for bioanalytical methods where sample preparation significantly impacts results. Proper validation ensures that methods accurately quantify analytes in complex matrices, providing the robustness required for drug development, quality control, and environmental monitoring.
Core Principles and Regulatory Framework
Method suitability establishes that a proposed testing protocol accurately detects or quantifies the target analyte without interference from the sample matrix. Regulatory bodies require this testing as a precursor to antimicrobial effectiveness testing (USP <51>) or sterility testing (USP <71>) in aqueous pharmaceutical products [80].
The core challenge addressed is matrix interference, where the sample's properties inhibit accurate microbial detection or chemical quantification. For instance, mineral oil in a sample can prevent culture media from detecting E. coli, leading to false negatives without proper method adaptation [80]. Similarly, in chemical analysis, matrix effects can suppress or enhance analyte detection, compromising accuracy.
For analytical methods, ICH guidelines Q2(R1) define validation characteristics requiring demonstration, including specificity, accuracy, precision, linearity, range, detection limit, quantification limit, and robustness [81] [82]. These parameters form the foundation of method suitability protocols for chromatographic methods like UFLC-DAD.
Method Suitability Parameters for LLE-UFLC-DAD Analysis
Quantitative Validation Parameters and Acceptance Criteria
For LLE-UFLC-DAD methods, suitability is demonstrated through specific, quantifiable performance characteristics. The following table summarizes key parameters and typical acceptance criteria for a validated method.
Table 1: Key Validation Parameters and Acceptance Criteria for LLE-UFLC-DAD Methods
| Parameter | Experimental Requirement | Acceptance Criteria | Reference Application |
|---|---|---|---|
| Linearity | Analyze ≥5 concentration levels in triplicate [83] | Correlation coefficient (R²) ≥ 0.999 [81] [82] | Mirabegron/Tadalafil combo analysis [81] |
| Precision | Repeat analysis of homogeneous samples (n≥6) | RSD ≤ 2% [81] | Ornidazole gel analysis [82] |
| Accuracy (Recovery) | Spike analyte into blank matrix at multiple levels | Recovery 85-105% [24] [81] | Multiclass pesticides in water [24] |
| LOD/LOQ | Signal-to-noise ratio of 3:1 and 10:1 | LOD: 0.23 µg/mL, LOQ: 0.70 µg/mL (example) [82] | Ricinoleic acid in nanocapsules [83] |
| Specificity | Analyze blank matrix and check for interferences | No interference at analyte retention time [82] | Forced degradation studies [81] [82] |
| Robustness | Deliberate, small variations in method parameters | Method performance remains within specification [82] | Ornidazole method using QbD [82] |
Experimental Protocols for Key Suitability Tests
Protocol for Specificity and Forced Degradation Studies
Purpose: To demonstrate that the method can unequivocally quantify the analyte in the presence of potential interferents, including degradation products [81] [82].
Procedure:
- Sample Preparation: Exclude the sample to obtain a blank matrix. For drug products, this involves testing the formulation placebo [82].
- Forced Degradation: Subject the analyte to stress conditions:
- Acidic Hydrolysis: Treat with 0.1-1.0 N HCl at room temperature (12 h) or 70°C (6 h), then neutralize [82].
- Alkaline Hydrolysis: Treat with 0.1-0.5 N NaOH for 6 h at room temperature, then neutralize [82].
- Oxidative Degradation: Treat with 3-30% H₂O₂ at room temperature for 8 h [82].
- Thermal Degradation: Heat at 60°C for 48 h [82].
- Photolytic Degradation: Expose to white fluorescent light (1.2 million lux hours) and near UV light (200-watt hours/m²) for 10 days [82].
- Analysis: Inject degraded samples and blank matrix using the LLE-UFLC-DAD method.
- Acceptance Criterion: The analyte peak should be pure, with no co-eluting peaks, and show separation from degradation products. The blank matrix should not show any interfering peaks at the analyte's retention time [82].
Protocol for Linearity and Range
Purpose: To demonstrate a proportional relationship between analyte concentration and detector response across the method's working range [83].
Procedure:
- Standard Preparation: Prepare a stock solution of the reference standard at the high end of the expected concentration range. For example, 1000 µg/mL in methanol [81].
- Calibration Set: Dilute the stock solution to at least five different concentration levels covering the specified range (e.g., 80%, 90%, 100%, 110%, 120% of the target concentration) [83].
- Sample Processing: Subject each calibration level to the optimized LLE protocol.
- Analysis: Inject each processed calibration level in triplicate into the UFLC-DAD system.
- Data Analysis: Plot peak area (y-axis) versus concentration (x-axis). Perform linear regression analysis.
- Acceptance Criterion: The correlation coefficient (R²) should be ≥ 0.999. The y-intercept should not be significantly different from zero [81] [82].
Protocol for Accuracy (Recovery) Assessment
Purpose: To determine the closeness of the measured value to the true value, often assessed as percentage recovery [24].
Procedure:
- Spiked Sample Preparation: Spike the target analyte into the blank matrix at three concentration levels (e.g., 80%, 100%, 120% of the target concentration) with a known number of replicates (n=3) at each level [82].
- Sample Processing: Subject the spiked samples to the complete LLE-UFLC-DAD method.
- Analysis: Quantify the recovered amount using the calibration curve.
- Calculation: Calculate the percentage recovery for each level as (Measured Concentration / Spiked Concentration) × 100.
- Acceptance Criterion: Mean recovery should be between 85% and 105%, with an RSD of ≤ 2% [24] [81].
Application in Liquid-Liquid Extraction for UFLC-DAD
Optimizing Liquid-Liquid Extraction for Method Suitability
Liquid-liquid extraction is a critical sample preparation step that must be optimized and controlled to ensure method suitability. Key parameters include:
- Extraction Solvent Selection: The choice of solvent is crucial for efficient extraction. Ionic liquids like 1-Hexyl-3-methylimidazolium hexafluorophosphate have been used as eco-friendly alternatives for extracting multiclass pesticides, offering high enrichment factors and direct HPLC compatibility [24].
- pH Control: The sample pH must be optimized to ensure the analyte is in its uncharged form for efficient transfer to the organic phase. This is a critical parameter in the IL-DLLME method [24].
- Extraction Time and Efficiency: The process aims to maximize the transfer of the analyte from the aqueous phase to the organic phase. The partition coefficient (K) determines the extraction efficiency, and multiple extraction steps may be necessary for quantitative recovery [84].
- Internal Standard Use: To correct for losses during sample preparation and injection variability, a suitable internal standard is added at the beginning of the extraction. A factorial design can optimize the internal standard concentration for accurate quantification, as demonstrated in resolvin analysis [46].
The Scientist's Toolkit: Essential Research Reagents and Materials
Table 2: Key Research Reagent Solutions for LLE-UFLC-DAD Method Suitability
| Reagent/Material | Function in Suitability Testing | Example Applications |
|---|---|---|
| Reference Standards | Provides pure analyte for preparing calibration curves and spiking solutions for accuracy studies. | Mirabegron, Tadalafil, Ornidazole, Ricinoleic Acid [81] [82] [83] |
| Internal Standards (Deuterated) | Corrects for analyte loss during sample prep and variability in injection volume; essential for precision [46]. | Resolvin analysis (e.g., RvD1-d5, RvD2-d5) [46] |
| HPLC-grade Solvents | Ensures low UV background and minimal impurities; used for mobile phases, LLE, and sample reconstitution. | Methanol, Acetonitrile, Water [81] [82] [83] |
| Ionic Liquids | Serve as green, efficient extraction solvents in microextraction techniques for trace analysis [24]. | [C₁₀H₁₉N₂][PF₆] for pesticide extraction [24] |
| Buffers and Additives | Control pH for stability and efficient extraction (e.g., phosphate buffer) or improve chromatography (e.g., TEA, H₃PO₄) [81] [83]. | Mobile phase modification for Ricinoleic Acid [83] |
| Forced Degradation Reagents | Used in specificity studies to generate degradation products and prove method stability-indicating capability [81] [82]. | HCl, NaOH, H₂O₂ [82] |
Workflow and Signaling Pathway for Suitability Testing
The following diagram illustrates the logical workflow and decision-making process for establishing and documenting method suitability, from initial method development through to regulatory submission.
Figure 1: Method Suitability Establishment Workflow. This pathway outlines the sequential testing and decision points required to demonstrate a method is suitable for its intended regulatory purpose.
Demonstrating method suitability for regulatory compliance is a systematic, evidence-based process that leaves no aspect of the analytical procedure to chance. For methods combining liquid-liquid extraction with UFLC-DAD, this involves rigorous testing of specificity, accuracy, precision, linearity, and robustness against predefined acceptance criteria. By adhering to structured experimental protocols, utilizing appropriate reagents and materials, and following a logical validation workflow, researchers can generate the comprehensive data required to prove their method is reliable, reproducible, and fit-for-purpose. This thoroughness not only satisfies regulatory requirements but also builds a foundation of confidence in the data generated throughout the drug development lifecycle or environmental monitoring program.
Conclusion
A robust LLE protocol is fundamental to the success of any UFLC-DAD analysis, directly impacting the sensitivity, accuracy, and reliability of results. This guide synthesizes the journey from foundational knowledge and meticulous method development through to systematic troubleshooting and rigorous validation. The future of sample preparation lies in the continued miniaturization and automation of techniques like DLLME, which offer greener, faster, and more efficient alternatives. By mastering these protocols, researchers can significantly enhance their analytical capabilities, leading to more confident data interpretation and accelerated progress in drug development, clinical research, and environmental monitoring. The integration of optimized LLE with the high-resolution power of UFLC-DAD remains a powerful combination for tackling complex analytical challenges.
References
- 1. Liquid–liquid extraction [https://en.wikipedia.org/wiki/Liquid%E2%80%93liquid_extraction]
- 2. Chapter 9 Liquid-liquid extraction: Strategies for method ... [https://www.sciencedirect.com/science/article/abs/pii/S146434560380011X]
- 3. Development, validation and application of an UFLC-DAD ... [https://www.sciencedirect.com/science/article/abs/pii/S0308814616314200]
- 4. Comparative analysis and validation of analytical ... [https://www.sciencedirect.com/science/article/abs/pii/S0019452224000530]
- 5. Salting-out Liquid-Liquid Extraction (SALLE) [https://www.chromatographyonline.com/view/salting-out-liquid-liquid-extraction-salle]
- 6. Dispersive Liquid–Liquid Micro Extraction: An Analytical ... [https://www.mdpi.com/2297-8739/11/7/203]
- 7. Liquid-liquid and solid-liquid extractions with low- ... [https://www.sciencedirect.com/science/article/abs/pii/S0003267024005968]
- 8. Development, validation and application of an UFLC-DAD ... [https://pubmed.ncbi.nlm.nih.gov/27719944/]
- 9. Identification and Comparison of Constituents of Aurantii ... [https://pmc.ncbi.nlm.nih.gov/articles/PMC6017871/]
- 10. 当期目录 [http://jcps.bjmu.edu.cn/CN/volumn/volumn_1136.shtml]
- 11. 化学药品杂质谱控制的现状与展望 [https://html.rhhz.net/YXXB/html/20191212.htm]
- 12. Strategies for Optimization of Liquid–Liquid Extraction (LLE ... [https://www.chromatographyonline.com/view/strategies-for-optimization-of-liquid-liquid-extraction-lle-protocols]
- 13. Practical Aspects of Solvent Extraction [https://www.chromatographyonline.com/view/practical-aspects-solvent-extraction-0]
- 14. Exploring the Lipidome: Current Lipid Extraction ... [https://pmc.ncbi.nlm.nih.gov/articles/PMC7345237/]
- 15. High-performance liquid chromatography using diode ... [https://pmc.ncbi.nlm.nih.gov/articles/PMC9807716/]
- 16. Development and Validation of HPLC-DAD and UHPLC ... [https://pmc.ncbi.nlm.nih.gov/articles/PMC6151785/]
- 17. Multivariate optimization of dispersive liquid ... [https://www.sciencedirect.com/science/article/abs/pii/S0019452225005898]
- 18. Development and Validation of a New UFLC–MS/MS Method for the Detection of Organophosphate Pesticide Metabolites in Urine - PMC [https://pmc.ncbi.nlm.nih.gov/articles/PMC10421278/]
- 19. Optimization of high-efficient pre-column sample ... [https://www.sciencedirect.com/science/article/abs/pii/S030881462302527X]
- 20. Shimadzu Prominence 20 HPLC UFLC System Including Software [https://innovtrendlab.com/product/shimadzu-prominence-20-hplc-uflc-system-including-software-shimadzu-lc-solutions/]
- 21. Development and Validation of the UPLC-DAD ... [https://pmc.ncbi.nlm.nih.gov/articles/PMC9323694/]
- 22. Practical Aspects of Solvent Extraction | LCGC International [https://www.chromatographyonline.com/view/practical-aspects-solvent-extraction-1]
- 23. Salting-out liquid-liquid extraction (SALLE) of phenolic ... [https://www.sciencedirect.com/science/article/abs/pii/S0889157525010294]
- 24. Microextraction and HPLC-DAD Technique Targets ... [https://www.chromatographyonline.com/view/microextraction-and-hplc-dad-technique-targets-multiclass-pesticides-in-water]
- 25. Vortex-assisted liquid–liquid microextraction for the ... [https://pmc.ncbi.nlm.nih.gov/articles/PMC12126520/]
- 26. Optimization of Phenolic Compound Extraction from Bee ... [https://link.springer.com/article/10.1007/s12161-025-02846-3]
- 27. Optimization of Parallel Artificial Liquid Membrane ... [https://pubmed.ncbi.nlm.nih.gov/40211089/]
- 28. Matrix cleanup assisted extraction of phenolic pollutants ... [https://www.nature.com/articles/s41598-025-24462-1]
- 29. Utilizing ionic liquid-dispersive liquid-liquid microextraction ... [https://www.sciencedirect.com/science/article/abs/pii/S0889157525002364]
- 30. Sensitive determination of chlorpromazine in pharmaceutical ... [https://pubs.rsc.org/en/content/articlehtml/2025/ra/d5ra01298h]
- 31. Dispersive Liquid-Liquid Microextraction: A Review and ... [https://www.chromatographyonline.com/view/dispersive-liquid-liquid-microextraction-review-roundup-green-sample-prep-advancements]
- 32. Advancements in overcoming challenges in dispersive ... [https://www.sciencedirect.com/science/article/pii/S0165993623005162]
- 33. Dispersive liquid–liquid microextraction followed by high- ... [https://www.sciencedirect.com/science/article/abs/pii/S0003267007005879]
- 34. Recent Advances in Dispersive Liquid ... [https://pubmed.ncbi.nlm.nih.gov/38165816/]
- 35. 8 Rules for optimal use of color in data visualization [https://towardsdatascience.com/8-rules-for-optimal-use-of-color-in-data-visualization-b283ae1fc1e2/]
- 36. Viridis Color Palette Generator [https://waldyrious.net/viridis-palette-generator/]
- 37. Generic approach in a gradient elution HPLC method ... [https://www.sciencedirect.com/science/article/abs/pii/S0731708521004787]
- 38. Development and Optimization of a Dispersive Liquid– ... [https://pmc.ncbi.nlm.nih.gov/articles/PMC12548832/]
- 39. Development of Salt-Assisted Liquid-Liquid Extraction for ... [https://www.preprints.org/manuscript/202511.0759]
- 40. Development of Salt-Assisted Liquid–Liquid Extraction for ... [https://www.mdpi.com/2673-4532/6/4/50]
- 41. Method Transfer in HPLC [https://www.chromatographyonline.com/view/method-transfer-hplc-0]
- 42. Development of a validated efficient HPLC-DAD analysis ... [https://www.sciencedirect.com/science/article/pii/S0889157525011469]
- 43. Advances in emulsion stability: A review on mechanisms ... [https://pmc.ncbi.nlm.nih.gov/articles/PMC12311586/]
- 44. Liquid-Liquid Extraction Techniques Principles and ... [https://www.elementlabsolutions.com/uk/chromatography-blog/post/liquid-liquid-extraction-techniques-principles-and-optimisation]
- 45. Stability mechanisms of liquid water-in-oil emulsions [https://www.semanticscholar.org/paper/Stability-mechanisms-of-liquid-water-in-oil-Ushikubo-Cunha/bc1ecff92a5e88081b70b2e4b8cceb60256870dc]
- 46. Validation of a Liquid–Liquid Extraction Method to Study ... [https://pmc.ncbi.nlm.nih.gov/articles/PMC10301472/]
- 47. The Role of Emulsion Stability in Optimizing Tank Mixes [https://www.exactoinc.com/blog/2023/12/11/the-role-of-emulsion-stability-in-optimizing-tank-mixes/]
- 48. Effect of Salt on the Formation and Stability of Water-in-Oil ... [https://pmc.ncbi.nlm.nih.gov/articles/PMC7884014/]
- 49. Extract Preparation for Chemical Characterization Studies [https://cdrh-rst.fda.gov/extract-preparation-chemical-characterization-studies-liquid-liquid-extraction]
- 50. A Highly Selective Analytical Method Based on Salt-Assisted ... [https://pmc.ncbi.nlm.nih.gov/articles/PMC10558272/]
- 51. Development and Validation of an HPLC-DAD Method for ... [https://www.mdpi.com/2297-8739/11/2/43]
- 52. The Liquid-Liquid Extraction Guide [https://www.phenomenex.com/knowledge-center/spe-knowledge-center/overview-of-liquid-liquid-extraction-in-sample-preparation?srsltid=AfmBOoqvUiCKYx-P_rGVgD1eyWl9OKOB7hsZgVHiGLWFcGsh_o8G6EUA]
- 53. Optimization of the ionic liquid-based dispersive ... [https://www.sciencedirect.com/science/article/pii/S2772391725000295]
- 54. Green-Oriented Dispersive Liquid–Liquid Extraction ... [https://link.springer.com/article/10.1007/s12161-025-02913-9]
- 55. Why Your HPLC Baseline Drifts—And How to Stop It [https://www.sepscience.com/why-your-hplc-baseline-drifts-and-how-to-stop-it-11018]
- 56. Tailing Peaks in HPLC: A Practical Guide to Causes ... [https://uhplcs.com/tailing-peaks-in-hplc-a-practical-guide-to-causes-effects-and-solutions/]
- 57. HPLC Troubleshooting Guide [https://www.thermofisher.com/us/en/home/industrial/chromatography/chromatography-learning-center/high-performance-liquid-chromatography-hplc-support/hplc-troubleshooting.html]
- 58. Causes of Retention Time Drift in HPLC [https://www.elementlabsolutions.com/uk/chromatography-blog/post/causes-of-retention-time-drift-in-hplc]
- 59. Retention Time Drift in HPLC: Causes, Corrections, and ... [https://uhplcs.com/retention-time-drift-in-hplc-causes-corrections-and-prevention/]
- 60. An Innovative Vortex-Assisted Liquid-Liquid Microextraction ... [https://pmc.ncbi.nlm.nih.gov/articles/PMC11280433/]
- 61. Validation of an HPLC-DAD Method for Quercetin ... [https://pmc.ncbi.nlm.nih.gov/articles/PMC10748265/]
- 62. 12 Tips for Successful Chromatography in 2021 [https://www.chromatographyonline.com/view/12-tips-for-successful-chromatography-in-2021]
- 63. Chemometrics optimization of an anionic carrier-mediated ... [https://www.sciencedirect.com/science/article/pii/S2772577423000356]
- 64. Analytical Method Development and Validation in ... [https://resolvemass.ca/analytical-method-development-and-validation-in-pharmaceuticals/]
- 65. Analytical Method Validation: Back to Basics, Part II [https://www.chromatographyonline.com/view/analytical-method-validation-back-basics-part-ii]
- 66. Understanding Linearity, Range, LOD, LOQ, and Ruggedness in ... [https://www.linkedin.com/posts/fazal-dad-khan_validation-methodvalidation-qc-activity-7355871178915295232-0iDL]
- 67. Development and Validation of HPLC-DAD/FLD Methods ... [https://www.mdpi.com/1420-3049/30/19/3902]
- 68. Systematic evaluation of supported liquid extraction in ... [https://pubmed.ncbi.nlm.nih.gov/22410088/]
- 69. Development of a liquid-phase microextraction based on the ... [https://pubs.rsc.org/en/content/articlehtml/2018/ra/c8ra00912k]
- 70. Ultrasound assisted supramolecular liquid phase ... [https://pmc.ncbi.nlm.nih.gov/articles/PMC8596535/]
- 71. Ultrasonic-assisted acidified aqueous two-phase extraction ... [https://pubmed.ncbi.nlm.nih.gov/40939278/]
- 72. Supported Liquid Extraction (SLE): The Best Kept Secret in ... [https://www.chromatographyonline.com/view/supported-liquid-extraction-sle-best-kept-secret-sample-preparation]
- 73. Supported Liquid Extraction (SLE) [https://www.agilent.com/en/product/sample-preparation/supported-liquid-extraction-sle?srsltid=AfmBOooHdU4fn3ggMACpBTr3Eoh9m4Yo3yNs_9xwG2xUhqpY8gCaIB_X]
- 74. Comparison of Liquid–Liquid Extraction (LLE) and ... [https://www.chromatographyonline.com/view/comparison-liquid-liquid-extraction-lle-and-supported-liquid-extraction-sle-equivalent-limits-quanti]
- 75. What's the Best Way to do Supported Liquid Extraction? [https://www.biotage.com/blog/whats-the-best-way-to-do-supported-liquid-extraction]
- 76. Automatic Supported Liquid Extraction (SLE) Coupled with ... [https://pmc.ncbi.nlm.nih.gov/articles/PMC3986710/]
- 77. Reverse Phase-ultra Flow Liquid Chromatography-diode ... [https://pmc.ncbi.nlm.nih.gov/articles/PMC4791996/]
- 78. Application of SPE-HPLC-DAD and SPE-TLC-DAD to the ... [https://pubmed.ncbi.nlm.nih.gov/18830964/]
- 79. Green and simple microextraction method based on deep ... [https://pmc.ncbi.nlm.nih.gov/articles/PMC12276117/]
- 80. Method Suitability Testing [https://daanelabs.com/method-suitability-testing/]
- 81. Cutting-edge assays for mirabegron and tadalafil combo ... [https://pmc.ncbi.nlm.nih.gov/articles/PMC12101028/]
- 82. Validation of HPLC-DAD Based Stability Indicating Assay ... [https://www.chromatographyonline.com/view/validation-of-hplc-dad-based-stability-indicating-assay-method-for-ornidazole-in-periodontal-polymeric-hydrogel-robustness-study-using-quality-by-design-qbd-approach]
- 83. A Newly Validated HPLC-DAD Method for the ... [https://pmc.ncbi.nlm.nih.gov/articles/PMC11435140/]
- 84. 7.7: Liquid-Liquid Extractions [https://chem.libretexts.org/Bookshelves/Analytical_Chemistry/Analytical_Chemistry_2.1_(Harvey)/07%3A_Obtaining_and_Preparing_Samples_for_Analysis/7.07%3A_Liquid-Liquid_Extractions]