Optimized Sample Preparation for Metoprolol Tartrate Extraction from Tablets: Methods, Troubleshooting, and Validation
This article provides a comprehensive guide for researchers, scientists, and drug development professionals on the sample preparation for extracting metoprolol tartrate from tablet formulations.
Optimized Sample Preparation for Metoprolol Tartrate Extraction from Tablets: Methods, Troubleshooting, and Validation
Abstract
This article provides a comprehensive guide for researchers, scientists, and drug development professionals on the sample preparation for extracting metoprolol tartrate from tablet formulations. It covers the foundational chemistry and properties of metoprolol tartrate, explores established and advanced extraction methodologies including spectrophotometric and HPLC techniques, addresses common troubleshooting and optimization challenges, and outlines rigorous validation procedures. The scope is designed to support quality control and research by detailing reliable, efficient protocols for accurate drug quantification and analysis.
Understanding Metoprolol Tartrate: Chemical Properties and Pre-Extraction Analysis
Chemical Structure and Key Functional Groups of Metoprolol Tartrate
Chemical Characterization
Metoprolol tartrate is a selective β1-adrenergic receptor blocking agent with the chemical name (±)-1-(Isopropylamino)-3-[p-(2-methoxyethyl)phenoxy]-2-propanol L-(+)-tartrate (2:1) salt [1]. The compound exists as a white, practically odorless, crystalline powder with a molecular weight of 684.82 g/mol [1]. It demonstrates high solubility in water, alcohol, chloroform, and methylene chloride, slight solubility in acetone, and insolubility in ether [1].
Table 1: Key Chemical Properties of Metoprolol Tartrate
| Property | Description |
|---|---|
| Chemical Formula | (C({15})H({25})NO({3}))({2})·C({4})H({6})O(_{6}) |
| Molecular Weight | 684.82 g/mol [1] |
| Appearance | White, practically odorless, crystalline powder [1] |
| Solubility | Very soluble in water; freely soluble in methylene chloride, chloroform, and alcohol; slightly soluble in acetone; insoluble in ether [1] |
Structural Components and Functional Groups
The molecular structure of metoprolol tartrate consists of a metoprolol base molecule combined with a tartrate counterion in a 2:1 ratio. The key functional groups present in the molecule are critical to its biological activity and physicochemical properties.
Table 2: Key Functional Groups of Metoprolol Tartrate and Their Significance
| Functional Group | Structural Location | Role and Significance |
|---|---|---|
| Secondary Amino Group | Isopropylamine chain | Facilitates β1-adrenergic receptor binding through hydrogen bonding and ionic interactions; crucial for pharmacological activity [2]. |
| Ether Linkage | Phenoxy-propanol bridge | Provides structural connectivity and influences molecular flexibility and receptor fit. |
| Aromatic Ring | Para-substituted phenyl | Creates hydrophobic interactions with receptor binding pockets. |
| Methoxyethyl Side Chain | Para-position of aromatic ring | Enhances β1-selectivity (cardioselectivity) and influences drug distribution [2]. |
| Hydroxyl Group | Propanol terminal | Participates in hydrogen bonding with biological targets; contributes to water solubility. |
| Tartrate Counterion | Salt form with basic nitrogen | Improves chemical stability, crystallinity, and aqueous solubility for formulation [1]. |
The relative beta1-selectivity of metoprolol is attributed to its specific molecular structure, particularly the methoxyethyl substituent on the aromatic ring. This selectivity means metoprolol preferentially blocks β1-adrenergic receptors located primarily in the heart while having less effect on β2-receptors in the lungs and vascular smooth muscle [2] [1]. However, this selectivity is dose-dependent and may diminish at higher concentrations [1].
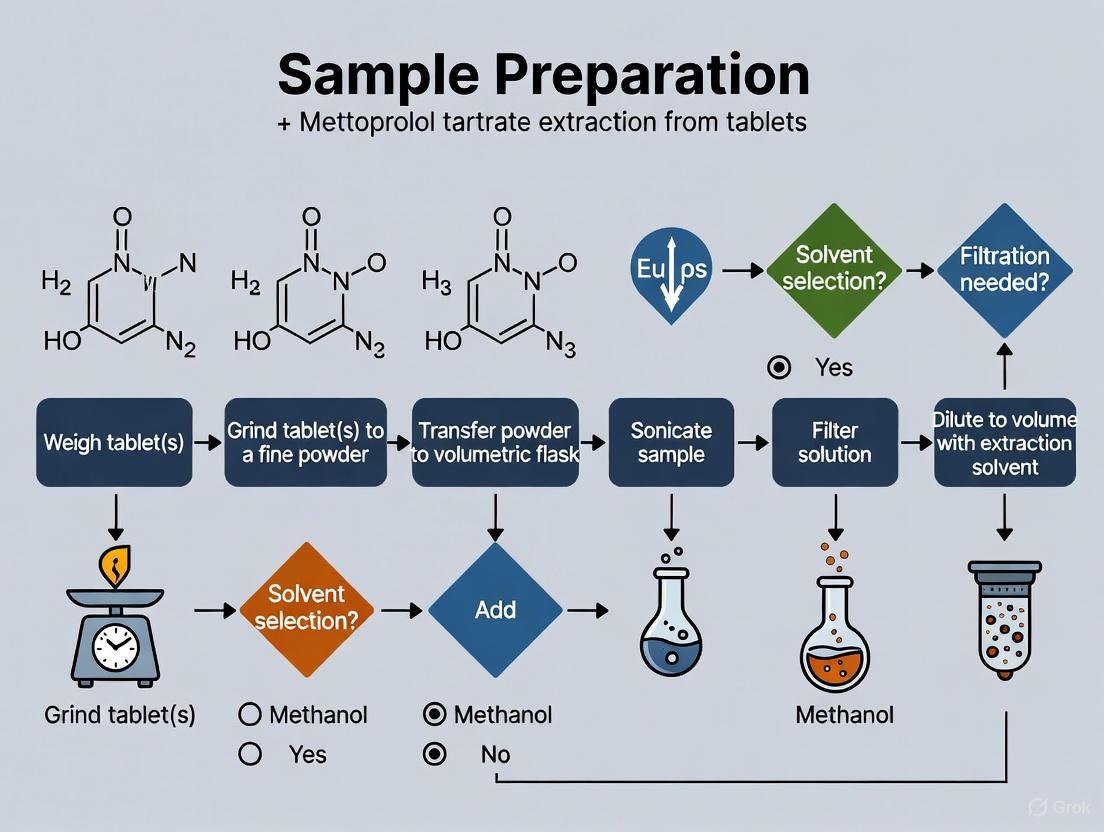
Diagram 1: The relationship between metoprolol's structure and analysis workflow. Its key functional groups influence each stage of the sample preparation and analysis process.
Sample Preparation and Extraction Protocols
Extraction from Pharmaceutical Tablets
Metoprolol tartrate immediate-release tablets typically contain the active pharmaceutical ingredient with excipients such as microcrystalline cellulose, lactose monohydrate, povidone, croscarmellose sodium, colloidal silicon dioxide, magnesium stearate, hypromellose, titanium dioxide, and macrogol [1]. For analytical sample preparation, the following protocol is recommended:
- Tablet Commimution: Weigh and grind representative tablet samples using a mortar and pestle to create a homogeneous powder.
- Solvent Extraction: Transfer an accurately weighed portion of the powder to a volumetric flask. Add a suitable solvent (e.g., methanol, water, or a mixture) and sonicate for 15-30 minutes to facilitate complete dissolution of metoprolol tartrate.
- Clarification: Centrifuge the mixture or filter through a 0.45 μm membrane filter to remove insoluble excipients.
- Dilution: Dilute the supernatant or filtrate to an appropriate concentration with the mobile phase or solvent compatible with the subsequent analytical technique.
Preparation of Biological Samples
The analysis of metoprolol in biological matrices requires specific sample preparation to remove interfering components and concentrate the analyte.
Plasma/Serum Sample Preparation: [3]
- Pipette 0.4 mL of plasma into a microcentrifuge tube.
- Add 0.225 mL of methanol and 0.2 mL of trichloroacetic acid solution (25% w/v) for protein precipitation.
- Vortex mix the sample thoroughly, then sonicate for 2 minutes.
- Centrifuge at 13,000 rpm for 10 minutes.
- Collect the clear supernatant for analysis by LC-MS/MS or HPLC.
Urine Sample Preparation: [3]
- Pipette 0.4 mL of urine into a glass test tube.
- Add 0.425 mL of methanol to precipitate salts and other interfering substances.
- Sonicate the mixture for 2 minutes.
- Centrifuge to separate the precipitate and collect the supernatant for analysis.
Exhaled Breath Condensate (EBC): EBC samples can be analyzed directly without pre-treatment after collection, due to their less complex matrix [3].
Analytical Methodology and Instrumentation
Liquid Chromatography-Mass Spectrometry (LC-MS/MS) Conditions
The following conditions have been established for the reliable quantification of metoprolol in various biological samples [3]:
Chromatography:
- Column: Zorbax RR Eclipse C18 (100 mm × 4.6 mm i.d., 3.5 μm particle size)
- Column Temperature: 30 °C
- Mobile Phase: Methanol and 0.1% formic acid (65:35, v/v)
- Flow Rate: 0.6 mL/min
- Injection Volume: 50 μL
Mass Spectrometry (Triple Quadrupole):
- Ionization Mode: Electrospray Ionization (ESI)
- Detection Mode: Multiple Reaction Monitoring (MRM)
- Precursor Ion (m/z): 268.1
- Product Ion (m/z): 116.2
- Cone Voltage: 35 V
- Collision Energy: 35 eV
- Source Temperature: 110 °C
- Desolvation Temperature: 350 °C
Method Validation Data
The developed LC-MS/MS method demonstrates excellent performance characteristics for the quantification of metoprolol [3].
Table 3: Analytical Method Performance for Metoprolol Quantification
| Parameter | EBC | Plasma | Urine |
|---|---|---|---|
| Linear Range (μg·L⁻¹) | 0.6 – 500 | 0.4 – 500 | 0.7 – 10,000 |
| Coefficient of Determination (R²) | 0.9998 | 0.9941 | 0.9963 |
| Limit of Detection (LOD, μg·L⁻¹) | 0.18 | 0.12 | 0.21 |
| Limit of Quantification (LOQ, μg·L⁻¹) | 0.60 | 0.40 | 0.70 |
| Intra-Day Precision (% RSD) | 5.2 – 6.1 | 5.2 – 6.1 | 5.2 – 6.1 |
| Inter-Day Precision (% RSD) | 3.3 – 4.6 | 3.3 – 4.6 | 3.3 – 4.6 |
The Scientist's Toolkit: Essential Research Reagents and Materials
Table 4: Key Reagents and Materials for Metoprolol Tartrate Research
| Item | Function/Application | Example / Specification |
|---|---|---|
| Metoprolol Tartrate Standard | Analytical reference standard for calibration and quantification | Certified Reference Material (CRM) from accredited suppliers (e.g., Daru Pakhsh) [3] |
| HPLC-Grade Methanol | Mobile phase component; extraction solvent | ≥99.9% purity, low UV absorbance |
| Formic Acid | Mobile phase additive to improve ionization in LC-MS | LC-MS Grade, ~0.1% v/v in mobile phase [3] |
| Trichloroacetic Acid (TCA) | Protein precipitation agent for plasma/serum samples | 25% w/v solution [3] |
| Reverse-Phase HPLC Column | Chromatographic separation of metoprolol from matrix components | C18 column (e.g., Zorbax Eclipse C18, 100x4.6mm, 3.5μm) [3] |
| Solid Phase Extraction (SPE) Cartridges | Sample clean-up and concentration for complex matrices | Mixed-mode or C18 sorbents |
| Mass Spectrometer | Sensitive and selective detection and quantification | Triple Quadrupole LC-MS/MS with ESI source [3] |
Diagram 2: Primary metabolic pathway of metoprolol. The drug is primarily metabolized by the hepatic enzyme CYP2D6, which exhibits genetic polymorphism, leading to significant inter-individual variability in plasma concentrations [1] [3].
Application in Research and Development
The precise understanding of metoprolol tartrate's chemical structure is fundamental for developing robust analytical methods for pharmaceutical quality control and bioequivalence studies. In a recent cross-sectional study, the mean metoprolol levels in biological samples from patients receiving a mean daily dose of 82.7 ± 29.9 mg were found to be 5.35 μg·L⁻¹ in EBC, 70.76 μg·L⁻¹ in plasma, and 1943.1 μg·L⁻¹ in urine, highlighting significant distribution differences [3]. The correlation between daily dose and concentration was significant for plasma and urine but not for EBC, suggesting complex distribution and excretion kinetics influenced by factors such as metabolic phenotype (CYP2D6), age, sex, and drug interactions [3]. These findings are crucial for guiding therapeutic drug monitoring and advancing personalized medicine approaches for metoprolol.
Physicochemical Properties Relevant to Solubility and Extraction
Metoprolol tartrate is a selective β₁-adrenergic receptor blocking agent widely used for treating cardiovascular disorders such as hypertension, angina pectoris, and cardiac arrhythmias [4]. As part of quality control and bioequivalence studies, efficient extraction of the active pharmaceutical ingredient from its dosage form is a critical sample preparation step. This application note details the key physicochemical properties of metoprolol tartrate relevant to its solubility and extraction, particularly from solid oral dosage forms, providing validated protocols for researchers and drug development professionals. The methodologies presented herein are framed within the broader context of sample preparation for metoprolol tartrate research, emphasizing principles that ensure high recovery, selectivity, and analytical accuracy.
Physicochemical Profile of Metoprolol Tartrate
Metoprolol tartrate is a 2:1 salt comprising a racemic mixture of metoprolol enantiomers and dextrotartaric acid [4]. Understanding its fundamental properties is essential for developing efficient extraction protocols.
Table 1: Fundamental Physicochemical Properties of Metoprolol Tartrate
| Property | Description / Value | Reference |
|---|---|---|
| Chemical Name | 2:1 salt of (±)-1-(Isopropylamino)-3-[4-(2-methoxyethyl)phenoxy]propan-2-ol with (2R,3R)-2,3-dihydroxysuccinic acid | [5] [4] |
| Molecular Formula | (C₁₅H₂₅NO₃)₂·C₄H₆O₆ | [5] |
| Molecular Weight | 684.82 g/mol | [5] |
| CAS Number | 56392-17-7 | [5] |
| Melting Point | 120 °C | [5] |
| BCS Classification | Class I (High Solubility, High Permeability) | [5] |
Solubility and Partitioning Characteristics
Solubility is a primary determinant in choosing an appropriate extraction solvent. Metoprolol tartrate is highly soluble in water and various organic solvents, as quantified in the table below.
Table 2: Solubility Profile of Metoprolol Tartrate
| Solvent | Solubility | Experimental Conditions | Reference |
|---|---|---|---|
| Water | >1000 mg/mL | At room temperature | [5] |
| Methanol | >500 mg/mL | At room temperature | [5] |
| Chloroform | 496 mg/mL | At room temperature | [5] |
| Ethanol | 31 mg/mL | At 25°C | [5] |
| Dimethyl Sulfoxide (DMSO) | 100 mg/mL | At 25°C | [5] |
| Key Implications | High aqueous solubility facilitates extraction into polar solvents like water or methanol. Miscibility with organic solvents allows for solvent switching or concentration steps. |
The drug substance exhibits low protein binding (10-12%) and a volume of distribution of 5.6 L/kg, indicating extensive distribution into tissues rather than plasma, which is less relevant for tablet extraction but critical for bioanalytical methods [5].
Core Extraction Principles and Sorbent Selection
Solid-phase extraction (SPE) is a preferred sample preparation technique that removes interfering compounds from a sample and can enrich analytes of interest, thereby improving analytical results in HPLC, GC, and MS analyses [6]. The selection of the SPE sorbent is governed by the analyte's properties, the sample matrix, and the sample volume [7].
The following workflow outlines a systematic approach for selecting the appropriate SPE mechanism for metoprolol tartrate:
SPE Sorbent Selection Guide for Metoprolol Tartrate
| SPE Mechanism | Sorbent Chemistry Examples | Basis for Selection | Applicable Sample Matrix |
|---|---|---|---|
| Reversed-Phase (Non-polar) | C18, C8, C6, Phenyl | Retains the hydrophobic aromatic ring of metoprolol from polar (aqueous) matrices. | Aqueous solutions, diluted biological fluids [6] [7]. |
| Cation Exchange | Strong Cation Exchange (SCX, e.g., sulfonic acid), Weak Cation Exchange (WCX, e.g., carboxylic acid) | Retains the protonated secondary amine group of metoprolol (pKa ~9.7) via ionic interaction. | Aqueous solutions at a pH where the amine is protonated (pH < pKa) [7]. |
| Mixed-Mode | C8/SCX, C18/SCX | Combines hydrophobic (C8/C18) and ionic (SCX) retention mechanisms, offering high selectivity for basic compounds like metoprolol. | Complex matrices (e.g., biological samples) where high purity extracts are required [7]. |
Detailed Experimental Protocols
Protocol 1: Solid-Phase Extraction from Tablet Formulation
This protocol utilizes a mixed-mode cation exchange SPE for selective extraction of metoprolol tartrate from tablet excipients.
Research Reagent Solutions
| Item | Function / Specification |
|---|---|
| Mixed-Mode Cation Exchange SPE Cartridges | e.g., 60 mg, 3 mL capacity. Provides dual retention mechanisms for high selectivity. |
| Methanol (HPLC Grade) | For cartridge conditioning and elution. |
| Deionized Water | For cartridge equilibration and washing. |
| Ammonium Hydroxide Solution | e.g., 2-5% in water. For adjusting elution solvent pH to deprotonate the amine. |
| Ammonium Acetate Buffer (0.1 M, pH 4.0) | For conditioning and washing at a pH that ensures analyte protonation and retention. |
| Centrifuge | For clarifying sample solutions after extraction from tablets. |
| Volumetric Flasks & Pipettes | For accurate solution preparation and transfer. |
Step-by-Step Procedure:
- Sample Pre-treatment:
- Weigh and finely powder not less than 20 tablets.
- Accurately weigh a portion of the powder equivalent to about 50 mg of metoprolol tartrate into a 100 mL volumetric flask.
- Add approximately 70 mL of deionized water, sonicate for 20 minutes, and shake vigorously for another 10 minutes.
- Dilute to volume with deionized water, mix, and filter or centrifuge to remove insoluble tablet excipients.
SPE Cartridge Conditioning:
- Mount the SPE cartridge on a vacuum manifold.
- Pass 2 mL of methanol through the cartridge at a flow rate of ~1 mL/min. Do not let the sorbent bed run dry.
- Equilibrate the cartridge with 2 mL of 0.1 M ammonium acetate buffer (pH 4.0).
Sample Application:
- Load a suitable aliquot (e.g., 1-5 mL) of the clarified sample solution onto the conditioned cartridge.
- Maintain a slow, drop-wise flow rate (~1 mL/min) to maximize analyte retention.
Wash Step:
- Wash the cartridge with 2-3 mL of 0.1 M ammonium acetate buffer (pH 4.0) to remove weakly retained interferences.
- Optionally, wash with 1-2 mL of 20% methanol in water to remove less polar impurities. Dry the cartridge under vacuum for 1-2 minutes.
Elution:
- Elute the retained metoprolol tartrate into a clean collection tube using 2 x 1 mL aliquots of a mixture of methanol and ammonium hydroxide (e.g., 98:2 v/v).
- The basic eluent neutralizes the analyte, disrupting the ionic interaction, while the organic solvent disrupts the hydrophobic interactions.
Post-Elution Processing:
Protocol 2: Spectrophotometric Determination via Complexation
This protocol provides a simple and accurate method for quantifying metoprolol tartrate in extracted samples based on complex formation with copper(II) ions [8].
Step-by-Step Procedure:
- Reagent Preparation:
- Copper(II) Solution: Prepare a 0.5% (w/v) solution of CuCl₂·2H₂O in deionized water.
- Britton-Robinson Buffer: Prepare a universal buffer of pH 6.0.
- Standard Solution: Prepare a stock solution of pure metoprolol tartrate in water at a concentration of 0.2 mg/mL.
Calibration Curve:
- Pipette aliquots of the standard solution (e.g., 0.425 mL to 3.5 mL, representing 85 μg to 700 μg of MPT) into a series of 10 mL volumetric flasks.
- To each flask, add 1 mL of Britton-Robinson buffer (pH 6.0) and 1 mL of the copper(II) chloride solution.
- Mix well and heat in a thermostatically controlled water bath at 35°C for 20 minutes.
- Cool the solutions rapidly to room temperature and dilute to the mark with deionized water.
- Measure the absorbance of each solution at 675 nm against a reagent blank.
- Plot absorbance versus concentration to generate the calibration curve.
Sample Analysis:
- Take a suitable aliquot of the extracted sample solution (from Protocol 5.1 or a direct tablet extract) and subject it to the same complexation procedure described above.
- Measure the absorbance and determine the concentration of metoprolol tartrate using the regression equation from the calibration curve [8].
Table 3: Method Performance Data for Spectrophotometric Complexation Assay
| Parameter | Value / Observation | Reference |
|---|---|---|
| Analytical Wavelength | 675 nm | [8] |
| Beer's Law Range | 8.5 - 70 μg/mL | [8] |
| Correlation Coefficient (r) | 0.998 | [8] |
| Limit of Detection (LOD) | 5.56 μg/mL | [8] |
| Complex Stoichiometry | 1:1 (MPT:Cu²⁺) | [8] |
| Optimal pH | 6.0 | [8] |
Critical Methodological Considerations
- SPE Sorbent Capacity: The sorbent mass must be appropriate for the analyte mass. A general rule is that the mass of retained solute should be 1-5% of the sorbent mass for silica-based sorbents [7]. For a 60 mg cartridge, this translates to a capacity of 0.6-3 mg of total retained material.
- Flow Rate Control: During SPE, a typical flow rate of 1 mL/minute is recommended. Excessive flow rates can lead to channeling and inconsistent extraction efficiency due to insufficient interaction time between the analyte and sorbent [6].
- Stability of Extracts: Metoprolol tartrate is soluble in water and ethanol. Solutions and extracted samples should be stored in tightly sealed containers, protected from light, and kept at room temperature. Tablets should be protected from moisture and freezing [4].
Excipients are inactive ingredients incorporated into pharmaceutical formulations to play a vital role in drug delivery beyond simply serving as inert carriers [9]. These components are critically important for enhancing stability, improving safety and effectiveness, ensuring patient compliance, and guaranteeing that medications perform precisely as intended [9]. In solid oral dosage forms such as metoprolol tartrate tablets, excipients fulfill specialized functions including binding ingredients together, facilitating tablet disintegration, ensuring uniform drug distribution, and enabling efficient manufacturing processes [9].
The global excipients market, valued between $8.85 and $9.3 billion in 2024, is projected to reach $14–17 billion by 2032–2034, reflecting a compound annual growth rate of 5.5–7.5% and underscoring the expanding role and innovation in excipient technology [9]. For researchers focused on sample preparation and extraction of active pharmaceutical ingredients (APIs) like metoprolol tartrate, understanding excipient composition and potential interferences is paramount to developing accurate analytical methods, ensuring complete API recovery, and obtaining reliable quantification results [10] [11]. Excipients, while pharmacologically inactive, can significantly interfere with analytical techniques through various mechanisms including matrix effects, physical interactions, and chemical incompatibilities [11] [12].
Classification and Functions of Common Tablet Excipients
Excipients are systematically classified based on their specific functions within pharmaceutical formulations. The table below summarizes the primary categories, their purposes, common examples, and key formulation considerations relevant to analytical extraction.
Table 1: Classification, Functions, and Considerations of Common Tablet Excipients
| Function | Primary Purpose | Common Examples | Formulation & Analytical Considerations |
|---|---|---|---|
| Diluents/Fillers | Add bulk to ensure appropriate tablet size and weight [9]. | Lactose, Microcrystalline Cellulose (MCC), Dicalcium Phosphate, Mannitol [9]. | Must be inert and compatible with API; lactose can pose issues for patients with intolerance [9] [13]. |
| Binders | Hold powder particles together, providing tablet strength and integrity [9]. | Cellulose derivatives (e.g., HPMC, MC), Starches, Polyvinylpyrrolidone (Povidone), Gelatin [9]. | Overly strong binding can slow tablet disintegration and potentially hinder API dissolution during extraction [9]. |
| Disintegrants | Facilitate tablet breakup in gastrointestinal fluids to release the drug [9]. | Croscarmellose Sodium, Sodium Starch Glycolate, Crospovidone, Low-substituted Hydroxypropyl Cellulose [9]. | Critical for drug release; must balance rapid disintegration with tablet hardness and stability [9]. |
| Lubricants | Reduce friction during tablet compression and ejection from manufacturing equipment [9]. | Magnesium Stearate, Stearic Acid, Sodium Stearyl Fumarate [9]. | Hydrophobic lubricants like magnesium stearate can retard drug dissolution and create a physical barrier to API extraction [9] [12]. |
| Glidants | Improve powder flow properties during manufacturing [9]. | Colloidal Silicon Dioxide, Talc [9]. | Overuse can impact compressibility and drug content uniformity [9]. |
Additional excipient categories include coating agents (e.g., Hypromellose, Ethylcellulose) for protection and controlled release, and specialized solubility-enhancing excipients (e.g., Cyclodextrins, Povidone) used to improve the bioavailability of poorly soluble drugs [14] [9].
Excipient Composition of Metoprolol Tartrate Tablets
A specific example of excipient composition can be found in the Metoprolol Tartrate 25 mg tablets monograph. According to the official product information, this formulation contains two excipients with known effects [13]:
- Lactose monohydrate (14.00 mg/tablet): Functions primarily as a diluent [13].
- Sodium (0.07 - 0.105 mg/tablet): Likely present as part of a salt-based excipient [13].
This formulation illustrates a critical point for researchers: the presence of lactose must be considered during method development, especially for patients with lactose intolerance, though its primary analytical impact is typically minimal. However, the complete excipient profile, including binders and disintegrants not specified in the patient leaflet, can significantly influence the sample preparation strategy for metoprolol extraction [13].
Mechanisms of Excipient Interference in Analytical Science
Excipients can compromise analytical results through several distinct mechanisms during sample preparation and analysis of APIs like metoprolol tartrate.
Bioanalytical Matrix Effects
Matrix effects represent a major challenge, particularly in chromatographic techniques like LC-MS/MS. Excipients present in the sample but absent in the calibration standards can cause ion suppression or enhancement, leading to over- or under-estimation of the API concentration [11]. The severity of this interference is often concentration-dependent, and the variable composition of generic formulations can exacerbate the problem [11]. For high-potency drugs like metoprolol, which are administered in low doses, the need to limit sample dilution amplifies the relative concentration of excipients in the final extract, thereby increasing their potential for interference [10].
Physicochemical Interactions
Excipients can physically or chemically interact with the API, altering its properties and complicating extraction.
- Eutectic Mixture Formation: Some polymeric excipients can form eutectic mixtures with APIs, lowering the melting point and potentially altering crystallinity and dissolution behavior [12]. A study on metformin generics found that such interactions in a generic product significantly reduced the drug's melting point and enthalpy of fusion, which was linked to a slower drug release rate [12].
- Polymer Interference: Polymeric excipients used for controlled release or as binders can hinder complete API extraction during sample preparation. They may impede solvent penetration or even actively adsorb the API, reducing recovery yields [10]. Furthermore, these polymers can foul analytical instrumentation, depositing on chromatographic columns and reducing column lifetime and performance [10].
Impact on Dissolution and Extraction
The primary function of disintegrants and lubricants can directly conflict with efficient API extraction in a laboratory setting. As demonstrated in quality control tests, a formulation with a higher mean resistance force (harder tablet) and a longer disintegration time will likely require more vigorous mechanical or solvent action to liberate the API completely from the tablet matrix [12]. This is critical for sample preparation, as incomplete disintegration or dissolution of the tablet will directly lead to low and variable analytical recovery of metoprolol.
Experimental Protocols for Investigating Excipient Interference
To ensure accurate analytical results for metoprolol tartrate, researchers should employ the following experimental protocols to identify and mitigate excipient interference.
Protocol for Assessing Matrix Effects in Bioanalysis
This protocol is designed to quantify and correct for ion suppression/enhancement caused by excipients in LC-MS/MS methods.
Diagram: LC-MS/MS Matrix Effect Assessment Workflow
Procedure:
- Sample Preparation:
- Post-extraction Spiked Samples (A): Prepare a minimum of 6 different lots of blank biological matrix (e.g., plasma). Extract these samples using your validated protocol. Immediately after extraction, spike a known concentration of metoprolol tartrate standard into the cleaned-up extract [11].
- Pure Standard Solutions (B): Prepare the same concentration of metoprolol tartrate standard in pure mobile phase or reconstitution solvent. These represent the "neat" samples without matrix [11].
- LC-MS/MS Analysis: Analyze all samples (A and B) in a single batch using the intended analytical method.
- Calculation: For each lot of matrix, calculate the Matrix Effect (ME%) using the formula:
- ME% = (Mean Peak Area of Post-extraction Spiked Sample A / Mean Peak Area of Pure Standard Solution B) × 100% [11].
- Interpretation: An ME% close to 100% indicates negligible matrix effect. Significant deviation from 100% indicates ion suppression (<100%) or enhancement (>100%) attributable to the co-extracted matrix components, including residual excipients or their metabolites. The precision (CV%) of the ME% across the different lots should also be calculated, with a CV% < 15% typically indicating consistent matrix effects [11].
Protocol for Solid-State Characterization of API-Excipient Compatibility
Thermal methods like Differential Scanning Calorimetry (DSC) and Thermogravimetric Analysis (TGA) are fast, reliable tools for detecting incompatibilities between an API and excipients during pre-formulation or when troubleshooting generic drug products [15] [12].
Diagram: Thermal Analysis for API-Excipient Compatibility
Procedure:
- Sample Preparation:
- Weigh 2-5 mg of each sample into standard DSC/TGA crucibles.
- Samples should include: (i) pure metoprolol tartrate, (ii) individual excipients under investigation, and (iii) 1:1 (w/w) physical mixtures of metoprolol with each excipient.
- Instrumental Analysis:
- DSC: Run samples from 25°C to 300°C at a heating rate of 10°C/min under a nitrogen purge (50 mL/min). Seal crucibles with a pinhole lid [12].
- TGA: Run samples under the same temperature program, monitoring weight loss.
- Data Analysis: Overlay the thermograms of the pure API, the physical mixture, and the individual excipient.
- Interpretation: Compare the thermal profiles. Indicators of a potential incompatibility include:
- Disappearance or significant shifting of the characteristic melting endotherm of metoprolol tartrate.
- Appearance of new endothermic or exothermic peaks not present in the individual components.
- Significant changes in the enthalpy of fusion [12].
- Unexpected weight loss events in the TGA profile of the physical mixture that are not a simple addition of the individual component profiles [12].
The Scientist's Toolkit: Key Reagents and Materials
The following table details essential research reagents and materials for studying metoprolol tartrate extraction and excipient interference.
Table 2: Essential Research Reagents and Materials for Metoprolol Extraction Studies
| Item | Function/Application | Specific Examples / Notes |
|---|---|---|
| Metoprolol Tartrate Reference Standard | Primary standard for calibration curves, method development, and quantification. | High-purity certified material from a reputable supplier (e.g., USP). |
| Chromatographic Solvents | Mobile phase preparation and sample extraction. | HPLC-grade Acetonitrile, Methanol, Water; Ammonium acetate/formate for MS compatibility. |
| Solid-Phase Extraction (SPE) Cartridges | Sample clean-up to remove excipients and biological matrix components. | Reversed-phase C18; Mixed-mode cation exchange can be selective for metoprolol [10]. |
| Simulated Biorelevant Media | For in-vitro dissolution and extraction studies. | Phosphate buffers at various pH (1.2, 4.5, 6.8); Fasted State Simulated Intestinal Fluid (FaSSIF). |
| DSC & TGA Instrumentation | Detecting API-excipient incompatibilities and solid-state characterization. | Sealed crucibles with pinhole lids; Nitrogen purge gas [12]. |
| LC-MS/MS System | Sensitive and selective detection and quantification of metoprolol, especially in biological matrices. | Triple quadrupole mass spectrometer with ESI source; C18 analytical column (e.g., 50 x 2.1 mm, 1.8 µm). |
Excipients are indispensable for formulating effective and stable metoprolol tartrate tablets, but their presence introduces significant complexity to the sample preparation and analytical process. A comprehensive understanding of their functions, properties, and potential interferences is not merely an academic exercise but a practical necessity for researchers in drug development and bioanalysis. By employing systematic protocols for assessing matrix effects and API-excipient compatibility, and by utilizing the appropriate toolkit of reagents and analytical techniques, scientists can develop robust, accurate, and reliable methods for the extraction and quantification of metoprolol tartrate, thereby ensuring the validity of their research outcomes.
Within the framework of sample preparation for pharmaceutical analysis, the extraction process is a critical foundational step that directly influences the accuracy, reliability, and efficiency of subsequent analytical determinations. This application note delineates the specific analytical targets for the extraction of metoprolol tartrate from immediate-release tablet formulations, situating the discussion within a broader research context on sample preparation. Metoprolol tartrate, a selective β1-adrenergic receptor blocking agent, is widely used in the management of hypertension and other cardiovascular disorders [16] [17]. The primary objective of the extraction process is to completely and reproducibly isolate the active pharmaceutical ingredient (API) from the excipient matrix of the tablet, thereby producing a clean, representative sample solution suitable for precise quantitative analysis, typically by Reverse-Phase High-Performance Liquid Chromatography (RP-HPLC) [18]. Defining clear goals for this extraction is paramount for developing a robust analytical method that can be applied in quality control (QC) laboratories for assay and dissolution testing, formulation development, and stability studies.
Defining Key Analytical Targets for Extraction
The success of the extraction process is measured against several key analytical targets. These targets are not isolated; they are interconnected and collectively ensure the analytical method meets its intended purpose, as guided by International Conference on Harmonisation (ICH) validation requirements [19].
Target 1: Quantitative Recovery of Analyte. The extraction procedure must achieve a consistent and complete release of metoprolol tartrate from the tablet matrix. The accepted benchmark for recovery, as established in validation protocols, is typically 98.0% to 102.0% when compared to a certified reference standard [18] [19]. Incomplete recovery leads to a negative bias in the assay, directly compromising the accuracy of the dosage form's potency determination.
Target 2: Specificity and Selectivity. The extraction process, in conjunction with the chromatographic separation, must ensure that the measured response is solely attributable to the analyte of interest. This involves demonstrating a lack of interference from common tablet excipients (e.g., binders, fillers, disintegrants, lubricants) and any potential degradation products that may form under stress conditions [19]. Specificity is often verified using peak purity tests with photodiode-array (PDA) or mass spectrometric (MS) detection.
Target 3: Precision and Reproducibility. The extraction methodology must yield highly consistent results. This is measured at multiple levels:
- Repeatability (Intra-assay Precision): Expressed as the Relative Standard Deviation (%RSD) of multiple extractions from a homogeneous sample batch. An acceptable %RSD is typically less than 1.0% for the assay of a drug product [18] [19].
- Intermediate Precision: Demonstrates the reliability of the extraction and analysis when performed under varying conditions within the same laboratory, such as different analysts, equipment, or days.
Target 4: Preparation for Dissolution Profile Comparison. For dissolution testing, the extraction of metoprolol from the dissolution medium is a critical step in generating a complete and accurate release profile. These profiles are essential for comparing test and reference formulations and can support biowaiver claims. The extraction from the medium must be efficient and compatible with the analytical technique to allow for proper comparison using metrics like the similarity factor (f2) [20] [21].
Table 1: Key Analytical Performance Targets for the Extraction and Analysis of Metoprolol Tartrate from Tablets
| Performance Characteristic | Definition & Goal of Extraction | Typical Acceptance Criteria | Primary Influence on Method |
|---|---|---|---|
| Accuracy (Recovery) | Completeness of API release from the matrix. | 98-102% recovery [18] | Ensures the measured concentration reflects the true potency of the tablet. |
| Precision | Consistency of extraction results. | %RSD < 1.0% (Repeatability) [18] | Ensures reliability and reproducibility of the method during routine use. |
| Specificity | Freedom from interference by other components. | No interference from excipients or degradants [19] | Guarantees that the analytical signal is specific to metoprolol tartrate. |
| Linearity & Range | The ability to obtain results proportional to analyte concentration. | Demonstrated across 80-120% of test concentration [19] | Validates that the extraction is consistent across a range of concentrations. |
Detailed Experimental Protocols
Protocol 1: Extraction and HPLC Analysis for Tablet Assay
This protocol details a precise and accurate method for the extraction and simultaneous analysis of metoprolol tartrate from a tablet formulation using RP-HPLC, based on a validated procedure from the literature [18].
I. Principle The powdered tablet material is dissolved and sonicated in methanol to efficiently extract metoprolol tartrate. The resulting solution is filtered to remove particulate matter and insoluble excipients. The filtrate is then analyzed using an isocratic RP-HPLC system with UV detection, enabling quantification against a reference standard.
II. Apparatus and Reagents
- HPLC System: Binary solvent delivery pump, manual/auto injector, column thermostat, and UV/VIS detector.
- Analytical Balance (0.1 mg sensitivity)
- Ultrasonic Bath
- Volumetric Flasks (50 mL, 100 mL)
- Syringe Filters: Nylon, 0.45 µm pore size
- HPLC Column: C18 column (e.g., Inertsil ODS-3, 250 mm x 4.6 mm, 5 µm)
- Metoprolol Tartrate Reference Standard
- Methanol (HPLC Grade)
- Dibasic Potassium Phosphate (AR Grade)
- HPLC Grade Water
III. Procedure Step 1: Mobile Phase Preparation Prepare a mixture of 7.7 g/L dibasic potassium phosphate buffer and methanol in a 60:40 (v/v) ratio. Filter the mixture through a 0.45 µm membrane filter and degas in an ultrasonic bath.
Step 2: Standard Solution Preparation
- Accurately weigh about 25 mg of metoprolol tartrate reference standard and transfer to a 50 mL volumetric flask.
- Add approximately 30 mL of methanol and sonicate to dissolve.
- Dilute to volume with methanol and mix thoroughly. This yields a stock solution with a concentration of approximately 500 µg/mL.
Step 3: Sample Solution Preparation (Extraction)
- Weigh and finely powder not less than 20 tablets.
- Accurately weigh a portion of the powder, equivalent to about 12.5 mg of metoprolol tartrate, and transfer to a 100 mL volumetric flask.
- Add about 50 mL of methanol.
- Sonicate for 15-20 minutes with intermittent shaking, ensuring complete dispersion and dissolution of the API.
- Allow the solution to cool to room temperature.
- Dilute to volume with methanol and mix well.
- Filter a portion of the solution through a 0.45 µm syringe filter, discarding the first few mL of the filtrate.
Step 4: Chromatographic Analysis
- Set the HPLC conditions:
- Detection Wavelength: 226 nm
- Flow Rate: 1.0 mL/min
- Injection Volume: 20 µL
- Column Temperature: Ambient
- Inject the standard and sample solutions in duplicate/triplicate. The typical retention time for metoprolol tartrate under these conditions is approximately 10.81 minutes [18].
Step 5: Calculation Calculate the drug content in the tablet using the following formula: % Label Claim = (At/As) x (Cs/Ct) x (Vs/Vt) x (Average Tablet Weight / Weight of Powder Taken) x 100 x P Where:
- At and As = Peak areas of metoprolol from sample and standard injections, respectively.
- Cs = Concentration of the standard solution (mg/mL).
- Ct = Theoretical concentration of the sample solution (mg/mL).
- Vs and Vt = Volume of standard and sample solutions, respectively.
- P = Potency of the reference standard (on as-is basis).
Diagram 1: Sample Preparation and Extraction Workflow for Tablet Analysis
Protocol 2: Sample Preparation for Dissolution Testing
This protocol describes the preparation of samples from a dissolution test for metoprolol tartrate immediate-release tablets, which can be analyzed using the HPLC method in Protocol 1.
I. Principle Tablets are dissolved in a dissolution apparatus (USP Apparatus I or II). Samples of the dissolution medium are withdrawn at specified time intervals, filtered to remove any undissolved particles or insoluble excipients, and then analyzed to construct a release profile.
II. Apparatus and Reagents
- Dissolution Test Apparatus (USP Apparatus I or II)
- UV-Vis Spectrophotometer or HPLC System
- Syringe Filters: Nylon, 0.45 µm
- Dissolution Medium: 900 mL of degassed simulated gastric fluid (without enzymes) or other suitable medium as per monograph.
- Methanol (HPLC Grade)
III. Procedure
- Set the dissolution apparatus parameters: 900 mL of medium at 37°C ± 0.5°C and a paddle speed of 50 rpm [20].
- Place one tablet in each vessel and start the test.
- At predetermined time intervals (e.g., 5, 10, 15, 20, 30, and 45 minutes), withdraw a 5 mL aliquot from a zone midway between the top of the paddle and the surface of the medium, not less than 1 cm from the vessel wall.
- Immediately filter each aliquot through a 0.45 µm nylon filter.
- If needed, dilute the filtrate with the dissolution medium or methanol to remain within the linear range of the analytical method.
- Analyze the filtered samples using the HPLC method described in Protocol 3.1 or by UV spectrophotometry at 273 nm [20].
- Calculate the cumulative percentage of metoprolol tartrate dissolved at each time point, applying a volume correction for the withdrawn samples.
The Scientist's Toolkit: Research Reagent Solutions
The following table catalogues the essential materials and reagents required to execute the extraction and analysis protocols successfully.
Table 2: Key Research Reagents and Materials for Metoprolol Tartrate Extraction and Analysis
| Item | Specification / Function | Critical Parameters & Notes |
|---|---|---|
| Metoprolol Tartrate Reference Standard | Certified pure substance for preparing calibration standards. | Potency and purity must be certified; used as a benchmark for all quantitative calculations. |
| Methanol | HPLC Grade; primary solvent for extracting the API from the tablet matrix. | Low UV cutoff, low in impurities. Ensures complete dissolution and clean chromatographic baseline. |
| Dibasic Potassium Phosphate | Analytical Reagent Grade; component of the mobile phase buffer. | Required for preparing 7.7 g/L phosphate buffer solution to control mobile phase pH. |
| C18 HPLC Column | 250 mm x 4.6 mm, 5 µm particle size; for chromatographic separation. | The stationary phase for reverse-phase separation. Inertsil ODS-3 is an example [18]. |
| Simulated Gastric Fluid (without enzymes) | Dissolution medium for in vitro release testing. | Mimics the gastric environment; must be degassed prior to use to prevent bubble formation. |
| 0.45 µm Nylon Membrane Filter | For filtration of mobile phase and sample solutions. | Removes particulate matter that could damage the HPLC system or interfere with analysis. |
A meticulously defined extraction process is the cornerstone of any reliable analytical method for determining drug content in solid dosage forms. For metoprolol tartrate tablets, the primary goals of quantitative recovery, specificity, and precision are non-negotiable for ensuring product quality, safety, and efficacy. The protocols detailed herein provide a validated framework for achieving these analytical targets. By adhering to these structured procedures and utilizing the specified research reagents, scientists and drug development professionals can generate accurate, reproducible, and meaningful data that supports robust quality control, formulation optimization, and regulatory submissions.
Established Extraction Protocols: From Simple Solvent Extraction to Advanced Techniques
Solvent extraction, also known as liquid-liquid extraction (LLE), is a fundamental separation technique widely employed in pharmaceutical analysis for isolating and purifying active pharmaceutical ingredients (APIs) from complex matrices such as tablet formulations [22] [23]. This technique leverages the differential solubility of compounds between two immiscible liquid phases, typically aqueous and organic [24]. In the context of analytical method development for metoprolol tartrate, a β1-selective adrenoceptor antagonist used for cardiovascular conditions, efficient extraction is a critical sample preparation step prior to quantitative analysis [16]. The selection and optimization of extraction parameters directly influence the recovery, precision, and accuracy of the analytical method, forming a cornerstone of reliable drug quality assessment and pharmacokinetic studies [23].
Theoretical Principles of Solvent Extraction
The efficiency of solvent extraction is governed by several physicochemical principles. The partition coefficient (K_d) is a fundamental parameter defined as the ratio of the concentration of a solute in the organic phase to its concentration in the aqueous phase at equilibrium [22]. For ionizable compounds like metoprolol, the distribution ratio (D), which accounts for all chemical species of the solute, is more practically relevant. The fraction extracted (E) is given by the equation:
E = [Kd * Vorg / (Kd * Vorg + V_aq)]
where Vorg and Vaq are the volumes of the organic and aqueous phases, respectively [23]. Metoprolol, possessing a basic amine functional group, exhibits pH-dependent partitioning. When the aqueous phase pH is adjusted to at least 1.5 units above its pKa (≈9.7), the molecule is predominantly in its neutral form, favoring partitioning into the organic phase [23]. Conversely, at low pH, the protonated, ionic species remains in the aqueous phase. This principle enables selective extraction and back-extraction (washing) to separate the API from excipients and impurities [23].
Solvent Selection and Optimization for Metoprolol Tartrate
Critical Solvent Properties
The choice of extraction solvent is paramount for achieving high recovery of the target analyte. An ideal solvent for LLE possesses the following characteristics [23]:
- Low solubility in water (<10%) to minimize solvent loss and volume changes.
- High volatility for easy removal and concentration of the analyte post-extraction.
- Compatibility with subsequent analytical techniques (e.g., non-UV absorbing for HPLC-UV).
- High purity to avoid concentration of impurities.
- Favorable polarity and selectivity to maximize the distribution constant (K_d) for the target analyte.
For a relatively polar molecule like metoprolol tartrate, solvents of intermediate polarity are often most effective. Chloroform has been explicitly identified as the solvent of choice in official identification tests for metoprolol tartrate in tablet and injectable formulations [16]. The protocol involves rendering the aqueous phase basic with ammonium hydroxide to deprotonate metoprolol, followed by extraction into chloroform [16].
Table 1: Evaluation of Common Solvents for Metoprolol Extraction
| Solvent | Polarity Index (P') | Water Solubility (%) | Suitability for Metoprolol | Key Considerations |
|---|---|---|---|---|
| Chloroform | 4.1 | 0.8 | High | Official compendial method; good recovery [16]. |
| Dichloromethane | 3.1 | 1.3 | High | Similar to chloroform, with higher volatility. |
| Ethyl Acetate | 4.4 | 8.7 | Moderate | Higher water solubility can be a drawback. |
| Diethyl Ether | 2.8 | 6.0 | Moderate | High flammability and peroxide formation risk. |
| n-Hexane | 0.1 | 0.001 | Low | Too non-polar for effective metoprolol extraction. |
Optimization of Operational Parameters
Beyond solvent identity, several operational parameters require systematic optimization to maximize extraction efficiency and robustness.
Table 2: Key Optimization Parameters for Metoprolol Tartrate LLE
| Parameter | Optimal Condition / Effect | Recommendation for Metoprolol |
|---|---|---|
| pH of Aqueous Phase | Controls ionization state of analyte. | Adjust to ≥11.2 with NH₄OH or NaOH to ensure neutral species [23] [16]. |
| Phase Volume Ratio (Vorg/Vaq) | Impacts concentration factor and recovery. | A ratio of 1:1 to 1:2 is typical; multiple extractions with smaller volumes are more efficient than a single large volume [23]. |
| Extraction Time & Mixing | Governs kinetics of mass transfer. | Vigorous shaking for 5-15 minutes is usually sufficient to reach equilibrium. |
| Ionic Strength | "Salting-out" effect can decrease analyte solubility in water. | Addition of inert salts like NaCl or Na₂SO₄ can improve recovery [23] [24]. |
| Temperature | Affects solubility and partition coefficient. | Room temperature is standard; elevated temperatures are rarely needed. |
Advanced optimization can leverage computational approaches like COSMO-RS (Conductor-like Screening Model for Real Solvents), which uses a quantum chemistry-based method to predict thermodynamic properties and solubility, aiding in the rational selection of optimal solvents or solvent mixtures without exhaustive laboratory experimentation [25].
Detailed Application Protocol: Extraction of Metoprolol Tartrate from Tablets
This protocol describes the standard solvent extraction procedure for the isolation of metoprolol tartrate from tablet formulations prior to identification by Infrared (IR) spectroscopy, as adapted from compendial methods [16].
Research Reagent Solutions and Materials
Table 3: Scientist's Toolkit: Essential Materials and Reagents
| Item | Specification / Function |
|---|---|
| Metoprolol Tartrate Tablets | Ground to a fine, homogeneous powder. |
| Chloroform | HPLC or ACS grade; primary extraction solvent. |
| Ammonium Hydroxide Solution | ~1-3 M; used to alkalize the aqueous phase. |
| Anhydrous Sodium Sulfate (Na₂SO₄) | For drying the organic extract. |
| Volumetric Flasks / Separatory Funnels | For mixing and phase separation. |
| Water Bath / Nitrogen Evaporator | For gentle solvent evaporation and concentration. |
| Centrifuge | Optional, for breaking emulsions. |
| Potassium Bromide (KBr) | For preparation of IR pellets. |
Step-by-Step Experimental Procedure
Sample Preparation: Accurately weigh and finely grind a representative number of metoprolol tartrate tablets. Transfer a portion equivalent to approximately 136 mg of metoprolol tartrate into a suitable container [16].
Initial Dissolution and Basification: Add 25 mL of water and 4 mL of ammonium hydroxide solution to the powder. Stir or shake thoroughly to ensure complete wetting and dissolution of the API. The addition of base is critical to convert metoprolol to its free base form.
Liquid-Liquid Extraction: Transfer the mixture to a separatory funnel. Add a 25-30 mL portion of chloroform. Seal the funnel and shake vigorously for 10-15 minutes, with periodic venting to release pressure. Allow the phases to separate completely until a clear interface is established.
Phase Separation: Drain the lower organic layer (chloroform phase) into a clean, dry flask. If an emulsion forms at the interface, it can often be broken by gentle stirring, centrifugation, or by adding a small amount of salt [23].
Drying: Pass the collected chloroform extract through a bed of anhydrous sodium sulfate to remove any residual water.
Solvent Evaporation and Crystallization: Evaporate the chloroform extract just to dryness using a rotary evaporator or under a gentle stream of nitrogen. To promote crystallization, place the residue in a freezer for a period of time [16].
Analysis: The resulting crystals of metoprolol free base can be triturated with KBr and compressed into a pellet for FT-IR spectroscopic identification, completing the official compendial test [16].
Troubleshooting and Alternative Techniques
Common Challenges and Solutions
- Emulsion Formation: A frequent issue in LLE, often caused by tablet excipients or over-aggressive shaking. Remedies include using a different solvent (e.g., chloroform instead of ethyl acetate), gentle inversion mixing instead of shaking, adding a small volume of salt solution, or centrifugation [23] [24].
- Incomplete Recovery: If recovery is low, perform multiple extractions (e.g., 2-3 times) with fresh solvent. The combined efficiency for n extractions is given by 1 - [1/(1+Kd(Vorg/V_aq))^n] [23]. Also, verify the pH is sufficiently basic.
- Low Concentration Factor: For trace analysis, use a smaller volume of organic solvent relative to the aqueous phase to pre-concentrate the analyte [23].
Modern and Alternative Extraction Approaches
While traditional LLE is robust, newer techniques offer advantages of solvent reduction, automation, and speed.
- Solid Phase Extraction (SPE): Often provides higher selectivity, lower solvent consumption, and is easier to automate compared to LLE [22]. It is highly suitable for clean-up and concentration of metoprolol from biological fluids or complex samples.
- Solid-Liquid Extraction (SLE): Direct extraction of the powdered tablet with a solvent can be a simpler alternative, though it may co-extract more interferents [22] [26].
- Microwave-Assisted Extraction (MAE): Uses microwave energy to heat the solvent and sample rapidly, reducing extraction time and solvent volume [22].
- Automated Systems: Systems like the PromoChrom Automated SPE-03 can be adapted for high-throughput LLE or SPE workflows, improving reproducibility for large sample sets [22].
The effective isolation of metoprolol tartrate from its dosage form is a critical step in pharmaceutical analysis. Standard solvent extraction using chloroform under basic conditions remains a gold-standard, compendial-method-driven technique for this purpose [16]. Its success hinges on the rational selection and meticulous optimization of the solvent and key parameters, primarily pH. A deep understanding of the underlying principles of partition coefficients and the chemistry of the analyte allows researchers to develop robust, efficient, and reliable extraction methods. While traditional LLE is a cornerstone technique, the field continues to evolve with the integration of computational solvent optimization [25] and the adoption of more sustainable and automated sample preparation methods.
Spectrophotometric Method via Copper(II) Complexation
This application note details a validated protocol for the quantitative analysis of metoprolol tartrate (MPT) in pharmaceutical dosage forms. The method is based on the formation of a colored coordination complex between MPT and copper(II) ions in aqueous solution, followed by spectrophotometric detection [27]. The procedure is optimized for the context of sample preparation for MPT extraction from tablets, providing a framework for reliable and accurate determination of drug content. The formation of a stable, binuclear copper(II) complex (Cu~2~MPT~2~Cl~2~) offers a specific and sensitive means of analysis suitable for quality control and research applications [27].
Principle of the Method
Metoprolol tartrate, containing secondary amine and hydroxyl functional groups, acts as a ligand to form a blue-colored, binuclear complex with copper(II) ions at a weakly acidic pH [27]. The complex exhibits a maximum absorbance at 675 nm. The intensity of this absorbance is directly proportional to the concentration of MPT in the solution, allowing for quantitative determination based on the Beer-Lambert law [27] [28]. The method is characterized by its simplicity, as it requires minimal sample preparation and avoids the use of organic solvents for extraction.
Chemical Complexation Pathway
The Scientist's Toolkit: Key Research Reagent Solutions
Table 1: Essential Reagents and Materials for MPT-Cu(II) Complexation Analysis
| Reagent/Material | Specification/Function |
|---|---|
| Metoprolol Tartrate Standard | High-purity reference standard for calibration curve preparation. |
| Copper(II) Chloride Dihydrate (CuCl₂·2H₂O) | Source of Cu²⁺ ions for complex formation; prepared as 0.5% (w/v) aqueous solution [27]. |
| Britton-Robinson (BR) Buffer | Universal buffer system; maintains optimal reaction pH of 6.0 [27]. |
| Deionized Water | Solvent for all aqueous solutions to ensure absence of interfering ions [27]. |
| UV-Vis Spectrophotometer | Instrument for measuring absorbance of the complex at 675 nm. |
| Thermostatically Controlled Water Bath | Maintains consistent reaction temperature of 35°C for complex development [27]. |
Experimental Protocol
Reagent Preparation
- Stock MPT Solution (0.2 mg/mL): Accurately weigh and dissolve an appropriate amount of metoprolol tartrate standard in deionized water. This solution is stable for up to one week when stored at 4°C [27].
- Copper(II) Solution (0.5% w/v): Dissolve 0.5 g of CuCl₂·2H₂O in 100 mL of deionized water.
- Britton-Robinson Buffer (pH 6.0): Prepare the buffer solution as per standard laboratory procedures and adjust the pH to 6.0.
Calibration Curve Construction
- Pipette aliquot volumes of the MPT stock solution to prepare a series of standard solutions covering the concentration range of 8.5 to 70 µg/mL in 10 mL volumetric flasks [27].
- To each flask, add 1.0 mL of BR buffer (pH 6.0) and 1.0 mL of the 0.5% Cu(II) solution [27].
- Mix the solutions thoroughly and heat for 20 minutes in a water bath maintained at 35°C to facilitate complex formation [27].
- After heating, cool the solutions rapidly to room temperature. Dilute to the mark with deionized water and mix well.
- Measure the absorbance of each solution at 675 nm against a reagent blank prepared similarly but without MPT.
- Plot the absorbance values against the corresponding MPT concentrations to construct the calibration curve.
Sample Preparation: Tablet Analysis
- Weigh and finely powder ten tablets.
- Transfer an accurately weighed portion of the powder, equivalent to about 40 mg of MPT, to a conical flask.
- Extract the drug by shaking with four 20 mL portions of deionized water. Filter the extracts quantitatively into a 100 mL volumetric flask.
- Dilute the combined filtrates to volume with deionized water to obtain the sample stock solution [27].
- Dilute an aliquot of this stock solution appropriately to fall within the linear range of the calibration curve (8.5–70 µg/mL).
- Subject the diluted sample solution to the analytical procedure described in Section 4.2 (steps 2-5).
- Determine the MPT concentration in the sample solution using the regression equation of the calibration curve.
Experimental Workflow for Tablet Analysis
Data Analysis and Method Validation
Table 2: Spectrophotometric Method Performance Characteristics for MPT Determination [27]
| Parameter | Result / Value |
|---|---|
| λmax | 675 nm |
| Beer's Law Range | 8.5 - 70 µg/mL |
| Regression Equation (Example) | A = a + bC (r = 0.998) |
| Molar Absorbivity | Reported for the binuclear complex |
| Limit of Detection (LOD) | 5.56 µg/mL |
| Limit of Quantification (LOQ) | 7.11 µg/mL |
| Optimum pH | 6.0 |
| Reaction Temperature | 35°C |
| Complex Stoichiometry | Binuclear (Cu(2)MPT(2)Cl(_2)) |
Discussion
The described method provides a robust and efficient approach for assaying metoprolol tartrate in tablet formulations. The direct complexation with copper(II) at pH 6.0 simplifies the analytical procedure by eliminating the need for extensive sample clean-up or extraction with organic solvents, as required in some other methods [27] [29]. The high selectivity of the reaction is demonstrated by the successful application to pharmaceutical dosage forms with minimal interference from common excipients.
The formation of the binuclear Cu(2)MPT(2)Cl(_2) complex is well-characterized, with confirmed stoichiometry and stability. The blue color of the complex provides a distinct analytical signal at 675 nm, a wavelength where interference from other tablet components is typically minimal. The method's validation data confirms its suitability for routine quality control analysis, offering good accuracy, precision, and linearity over a pharmaceutically relevant concentration range. This protocol fits seamlessly into broader thesis research on sample preparation, highlighting a key spectrophotometric strategy for drug quantification.
RP-HPLC Method for Simultaneous Estimation with Other Drugs
The development of robust, precise, and accurate Reverse Phase High-Performance Liquid Chromatography (RP-HPLC) methods is a critical component of pharmaceutical analysis, particularly for the simultaneous estimation of multiple drug components. Such methods are indispensable for quality control laboratories analyzing multiple therapeutics, clinical studies investigating combination therapies, and for supporting formulation development research [30]. Within the context of a broader thesis investigating sample preparation for metoprolol tartrate extraction from tablets, this application note provides a detailed protocol for a validated RP-HPLC method suitable for the simultaneous estimation of drugs in combination formulations. The systematic approach outlined here, from method selection to validation, ensures reliability and compliance with international regulatory standards.
Experimental Design and Methodology
Selection of the HPLC Method and Initial Conditions
Method development begins with a careful assessment of the analytes and the selection of an appropriate chromatographic system.
- Chromatography Mode: Reverse-phase HPLC is the recommended choice for the majority of pharmaceutical compounds due to its broad applicability and excellent resolving power. It is particularly suited for polar and semi-polar analytes [31].
- Stationary Phase: A C18-bonded silica column is the most widely used and recommended initial choice. For this protocol, columns such as the Hypersil BDS C18 (150 mm × 4.6 mm; 5 μm) or a Phenomenex Luna ODS C18 (250 mm × 4.6 mm; 5 μm) provide a strong starting point for method development [30] [32].
- Mobile Phase: A binary system is preferred for its simplicity. A mixture of a water-miscible organic solvent and an aqueous buffer is standard. Methanol-water or acetonitrile-water systems are most common. The pH of the aqueous component can be adjusted using acids like ortho-phosphoric acid (e.g., 0.1%) or buffers such as phosphate buffer to control the ionization of acidic or basic analytes, thereby influencing retention and peak shape [30] [32].
- Detection: A UV/Visible detector is standard for analytes containing chromophores. The wavelength should be set to the λmax of the primary analyte or an iso-absorptive point for multiple components to ensure optimal sensitivity for all compounds [33] [31].
- Elution Mode: Isocratic elution is sufficient for simple mixtures with a small number of components. For complex samples with a wide range of analyte polarities, gradient elution is necessary to achieve adequate resolution within a reasonable time [31].
Optimization Using Design of Experiments (DoE)
A systematic optimization using Quality by Design (QbD) principles is highly recommended to understand the method's robustness. A Box–Behnken Design (BBD) is an efficient response surface methodology for this purpose [32].
- Independent Variables: Critical method parameters such as the ratio of mobile phase, flow rate (e.g., 0.8-1.2 mL/min), pH of the aqueous buffer, and injection volume can be selected as independent variables [32].
- Responses: Key chromatographic outputs like retention time, peak area, resolution between critical pairs, and theoretical plate count are measured as responses.
- Data Analysis: The data is analyzed using statistical software to generate models and perturbation plots. A desirability function is then used to identify the optimal chromatographic conditions that satisfy all criteria simultaneously [32].
The following workflow outlines the stages of method development from inception to a validated protocol:
Detailed Experimental Protocol
Materials and Reagents
- Drug Substances: Pure reference standards of the drugs to be analyzed (e.g., Metoprolol Tartrate and other compatible drugs for simultaneous estimation).
- Chemicals: HPLC-grade solvents (Methanol, Acetonitrile), high-purity water (Milli-Q or equivalent), and buffer components (Ortho-phosphoric acid, Potassium dihydrogen phosphate, etc.).
- Equipment: HPLC system with quaternary pump, auto-sampler, thermostatted column compartment, and UV/Vis or Diode Array Detector (DAD). An analytical balance, pH meter, ultrasonic bath, and vacuum filtration assembly with 0.45 µm membrane filters are also required [30].
Preparation of Solutions
- Stock Standard Solutions (1000 µg/mL): Accurately weigh and transfer approximately 100 mg of each drug reference standard into separate 100 mL volumetric flasks. Dissolve and make up to volume with methanol or a suitable solvent. Sonicate to ensure complete dissolution [30].
- Working Standard Solutions (100 µg/mL): Pipette 10 mL from each stock solution into a 100 mL volumetric flask and dilute to volume with the mobile phase or diluent [30].
- Sample Solution (Tablet Extraction): Weigh and finely powder not less than 20 tablets. Accurately weigh a portion of the powder equivalent to the label claim of the drug(s) (e.g., ~100 mg of metoprolol tartrate) into a 100 mL volumetric flask. Add about 70 mL of diluent (e.g., methanol or mobile phase), sonicate for 15-20 minutes with intermittent shaking, and allow to cool to room temperature. Dilute to volume with the same solvent, mix well, and filter through a 0.45 µm membrane filter. Further dilute the filtrate as needed to obtain a concentration within the linear range of the calibration curve [33].
Chromatographic Conditions
- Column: Hypersil BDS C18 (150 mm × 4.6 mm, 5 µm) or equivalent.
- Mobile Phase: Methanol: Phosphate Buffer (10 mM, pH adjusted to 6.3 with KOH/OPA) in a ratio of 25:75 (v/v). Note: The ratio and pH should be optimized for the specific drug combination. [32]
- Flow Rate: 1.0 mL/min.
- Column Temperature: 25 ± 2 °C.
- Detection Wavelength: 230 nm (or as optimized for the drugs).
- Injection Volume: 20 µL.
- Run Time: Approximately 6-10 minutes, or as required to elute all components [30].
Validation Protocol
The method must be validated as per International Council for Harmonisation (ICH) guidelines to ensure it is suitable for its intended purpose [31]. The key validation parameters and their typical acceptance criteria are summarized below:
Table 1: Key Validation Parameters and Acceptance Criteria for an RP-HPLC Method
| Parameter | Protocol | Acceptance Criteria |
|---|---|---|
| System Suitability | Inject six replicates of standard solution. | RSD of peak area & retention time ≤ 2.0%; Theoretical plates > 2000; Tailing factor ≤ 2.0 [30] [31]. |
| Specificity | Inject blank (diluent), placebo, standard, and sample. Verify resolution from any potential interferents. | No interference from blank, placebo, or degradation products at the retention time of the analytes [34]. |
| Linearity & Range | Prepare and inject standard solutions at a minimum of 5 concentration levels (e.g., 10-50 µg/mL). Plot peak area vs. concentration. | Correlation coefficient (r²) ≥ 0.999 [30]. |
| Accuracy (Recovery) | Spike placebo with known amounts of standard at three levels (80%, 100%, 120%) in triplicate. Calculate % recovery. | Mean Recovery: 98.0 - 102.0% [33]. |
| Precision | Repeatability (Intra-day): Inject standard at 100% concentration level six times in one day.Intermediate Precision (Inter-day): Perform the assay on a different day, by a different analyst, or on a different instrument. | RSD ≤ 2.0% [30] [34]. |
| Robustness | Deliberately vary parameters (e.g., flow rate ±0.1 mL/min, mobile phase pH ±0.2, temperature ±2°C) and assess system suitability. | System suitability criteria are met in all varied conditions [34]. |
| LOD/LOQ | Determine based on signal-to-noise ratio (S/N). | LOD: S/N ≈ 3:1; LOQ: S/N ≈ 10:1 [30] [34]. |
The Scientist's Toolkit: Essential Research Reagents and Materials
A successful HPLC analysis relies on high-quality materials and reagents. The following table lists the essential items for the protocol described.
Table 2: Key Research Reagent Solutions and Essential Materials
| Item | Function / Explanation |
|---|---|
| C18 Column | The stationary phase for reverse-phase separation; provides hydrophobic interactions with analytes. |
| HPLC-Grade Methanol/Acetonitrile | Organic modifiers in the mobile phase; control the elution strength and selectivity. |
| HPLC-Grade Water | The aqueous component of the mobile phase; must be of high purity to minimize baseline noise. |
| Buffer Salts (e.g., K₂HPO₄, KH₂PO₄) | Used to prepare the aqueous buffer for controlling mobile phase pH, critical for reproducible retention of ionizable analytes. |
| Ortho-phosphoric Acid / Trifluoroacetic Acid (TFA) | Used to adjust mobile phase pH and improve peak shape for acidic or basic compounds. |
| Membrane Filters (0.45 µm or 0.22 µm) | For removing particulate matter from mobile phases and sample solutions to protect the HPLC column and system. |
| Reference Standards | Highly purified materials of known concentration and identity, used to prepare calibration standards for quantitative analysis. |
| Ultrasonic Bath | For efficient degassing of the mobile phase (preventing air bubbles in the system) and dissolving solid samples. |
Data Analysis and Interpretation
After running the samples under the validated conditions, data acquisition software (e.g., ChemStation, LabSolutions) is used to integrate the chromatographic peaks.
- Identification: Identify peaks in the sample chromatogram by comparing their retention times with those of the standard solutions.
- Quantification: Calculate the concentration of the drug(s) in the sample solution using the regression equation (y = mx + c) obtained from the calibration curve of the standard.
- Assay Calculation: The percentage of label claim in the tablet formulation can be calculated using the following formula:
% Assay = (Cs × D × V × 100) / (LC × W)
Where:
- Cs = Concentration of the drug in the sample solution obtained from the calibration curve (µg/mL)
- D = Dilution factor
- V = Volume of the sample solution (mL)
- LC = Label claim of the tablet (mg)
- W = Weight of the sample powder taken (mg)
The systematic approach to method development and validation, as detailed in this application note, provides a reliable framework for the simultaneous estimation of metoprolol tartrate with other drugs from tablet formulations, contributing critical analytical support to pharmaceutical development research.
In pharmaceutical analysis, the accuracy of quantitative results for Active Pharmaceutical Ingredients (APIs) in solid dosage forms is fundamentally dependent on the robustness of the sample preparation workflow. For drugs like metoprolol, a selective β1-adrenoreceptor antagonist used in managing cardiovascular diseases, ensuring precise and reproducible extraction is critical for quality control, bioequivalence studies, and formulation development [35]. The sample preparation process transforms a manufactured tablet into an analysis-ready solution, a procedure that, if not meticulously controlled, becomes a primary source of error and variability in high-performance liquid chromatography (HPLC) and other analytical techniques.
This application note details a standardized protocol for the weighing, pulverizing, and extracting of metoprolol from tablet formulations. The outlined workflow is designed to ensure the complete and consistent dissolution of the API while effectively separating it from the excipient matrix, thereby establishing a solid foundation for accurate and reliable analytical results. The principles discussed are framed within a broader research context on optimizing sample preparation for metoprolol, drawing on established preformulation data and regulated testing practices [36] [37].
Theoretical Background and Preformulation Considerations
A thorough understanding of the physicochemical properties of the API is a prerequisite for developing an effective sample preparation protocol. For metoprolol succinate, key preformulation parameters directly influence the choice of diluent, extraction technique, and overall workflow.
Stability studies are paramount for selecting a suitable diluent. Metoprolol succinate demonstrates excellent stability in distilled water, 0.1N HCl, and phosphate buffer (pH 6.8), with no significant degradation observed over 30 minutes, making any of these solvents viable choices for extraction [36]. Furthermore, the API's high solubility in water facilitates rapid dissolution from the dosage form [36].
Drug-excipient compatibility, a critical aspect of formulation stability, must also be considered during sample preparation. Compatibility studies conducted via infrared spectroscopy (IR) have confirmed no major interactions between metoprolol succinate and common excipients such as various grades of Hypromellose (HPMC), ethyl cellulose, colloidal anhydrous silica, microcrystalline cellulose, and sodium stearyl fumerate [36]. This indicates that these excipients are unlikely to interfere chemically during the extraction process.
Table 1: Key Preformulation Data for Metoprolol Succinate [36]
| Parameter | Result / Observation | Implication for Sample Preparation |
|---|---|---|
| Stability in Solvents | Stable in water, 0.1N HCl, and pH 6.8 phosphate buffer for at least 30 minutes. | These solvents are suitable for use as diluents without causing analyte degradation. |
| Solubility in Water | High solubility (≈ 95,896 µg/mL). | Aqueous-based solvents can effectively dissolve the API, avoiding the need for strong organic solvents initially. |
| Drug-Excipient Compatibility | No major interactions found with common tablet excipients. | Excipients are not expected to complicate the chemical extraction of the analyte. |
| % Compressibility | 13.94% | Suggests good flow properties, relevant for powder handling after pulverization. |
Experimental Protocols
Materials and Reagents
Table 2: Research Reagent Solutions and Essential Materials
| Item | Function / Application |
|---|---|
| Metoprolol Reference Standard | Certified API material used for preparing calibration standards and method validation [37]. |
| Metoprolol Tablets | The drug product to be analyzed. |
| Diluent (e.g., pH 6.8 Phosphate Buffer) | To solubilize and extract the API from the tablet matrix [36]. |
| Class A Volumetric Flasks | For precise, quantitative preparation of sample and standard solutions [37]. |
| Analytical Balance | For accurate weighing of samples and reference standards (recommended accuracy ±0.1 mg) [37]. |
| Porcelain Mortar and Pestle | For particle size reduction (pulverizing) of tablets to a fine powder [37]. |
| Ultrasonic Bath or Laboratory Shaker | To facilitate the complete dissolution of the API in the diluent [37]. |
| Syringe Filters (0.45 µm Nylon or PTFE) | To remove insoluble particulate matter from the sample solution prior to HPLC analysis [37]. |
| HPLC Vials | For holding the final, analysis-ready sample solution. |
Step-by-Step Workflow Protocol
Step 1: Weighing of Tablets and Particle Size Reduction
- Weigh Tablets: Accurately weigh 10-20 intact tablets to determine the average tablet weight (ATW) [37].
- Crush and Pulverize: Transfer the tablets to a clean porcelain mortar and crush them thoroughly using the pestle until a homogeneous fine powder is achieved. This particle size reduction is critical for increasing the surface area and ensuring complete and consistent extraction of the API [37].
- Weigh Sample Powder: Accurately weigh a portion of the powdered sample equivalent to the ATW (or the intended number of tablets) and quantitatively transfer it to an appropriately sized Class A volumetric flask (e.g., 100 mL or 1 L) using a powder funnel. Use the diluent to rinse any residual powder from the funnel into the flask [37].
Step 2: Solubilization and Extraction of the API
- Add Diluent: Fill the volumetric flask approximately halfway with the selected diluent (e.g., pH 6.8 phosphate buffer) [36].
- Initial Mixing: Manually swirl the flask to wet the powder and begin the dissolution process.
- Sonication or Shaking: For complete extraction, place the flask in an ultrasonic bath or on a mechanical shaker. The time required for complete dissolution must be optimized and validated during method development. Typically, sonication for 10-20 minutes with occasional swirling is effective. Visually inspect the solution to ensure all particulates have dissolved and the solution is clear [37].
- Cool and Dilute to Volume: After extraction, allow the solution to return to room temperature if sonication generated heat. Dilute the solution to the final volume with the diluent and mix thoroughly to ensure homogeneity [37].
Step 3: Filtration and Final Preparation
- Filter the Extract: Draw a portion of the sample solution into a disposable syringe. Attach a 0.45 µm membrane filter (e.g., Nylon or PTFE) and discard the first 0.5-1.0 mL of the filtrate to saturate the filter and avoid any potential analyte adsorption or dilution effect [37].
- Transfer to HPLC Vial: Collect the subsequent filtrate and transfer it into a labeled HPLC vial for analysis. For light-sensitive compounds, use amber vials [37].
Diagram 1: Sample preparation workflow for metoprolol tablets.
Key Precautions and Troubleshooting
- Weighing Accuracy: For hygroscopic APIs, allow the sample to reach room temperature before opening the container to prevent moisture absorption. Perform weighing operations swiftly and consistently [37].
- Quantitative Transfer: Ensure all powdered material is rinsed from the weighing paper and funnel into the volumetric flask to avoid sample loss.
- Complete Extraction: The extraction time and technique (sonication vs. shaking) must be validated to ensure 100% recovery of the API from the excipient matrix. Incomplete extraction is a common source of out-of-specification (OOS) results [37].
- Filtration Integrity: Use a compatible filter membrane. Discarding the initial portion of the filtrate is a critical step to prevent biased results [37].
Results and Data Interpretation
A well-executed sample preparation protocol should yield a clear, particle-free solution ready for instrumental analysis. The quantitative data generated from preformulation work provides the foundation for a successful method.
Table 3: Calibration Curve Data for Metoprolol in pH 6.8 Phosphate Buffer [36]
| Concentration (µg/mL) | Absorbance (Set 1) | Absorbance (Set 2) | Absorbance (Set 3) | Average Absorbance ± SD |
|---|---|---|---|---|
| 0 | 0.000 | 0.000 | 0.000 | 0.000 |
| 5 | 0.185 | 0.188 | 0.191 | 0.188 ± 0.003 |
| 10 | 0.356 | 0.360 | 0.352 | 0.356 ± 0.004 |
| 15 | 0.487 | 0.480 | 0.484 | 0.484 ± 0.003 |
| 20 | 0.646 | 0.649 | 0.652 | 0.649 ± 0.003 |
| 30 | 0.981 | 0.987 | 0.993 | 0.987 ± 0.006 |
The linearity of the calibration curve (e.g., y = 0.0323x + 0.0136, R² = 0.9998 as reported in one study [36]) confirms that the sample preparation and analytical conditions are suitable for the accurate quantification of metoprolol over the specified range. The absence of significant interference from excipients at the analytical wavelength (e.g., 222 nm) further validates that the sample preparation process effectively isolates the analyte from the matrix [36].
Discussion
The "grind, extract, and filter" workflow described herein is a foundational approach for preparing solid oral dosage forms like metoprolol tablets for analysis [37]. The integrity of each step is crucial. Inadequate pulverization can lead to poor reproducibility between samples, as the API may not be uniformly distributed in the coarse powder. Conversely, incomplete extraction, whether from insufficient sonication time or an unsuitable diluent, will result in low recovery and a negative bias in potency results.
This protocol emphasizes practices that mitigate these risks, including the use of an average tablet weight for composite assays, quantitative transfer techniques, and validated extraction steps. Furthermore, the stability of metoprolol in aqueous diluents simplifies the process, eliminating the need for complex solvent systems or stabilization agents [36]. The final filtration step is not merely a cleanup procedure but a critical safeguard for protecting expensive HPLC instrumentation and chromatography columns from particulate matter, ensuring robust instrument performance and data quality [38].
A meticulous sample preparation workflow is the cornerstone of reliable pharmaceutical analysis. The detailed protocol for weighing, pulverizing, and extracting metoprolol from tablets, supported by preformulation data and standardized laboratory practices, provides a clear path to generating accurate, precise, and reproducible analytical results. By adhering to these best practices, researchers and quality control scientists can ensure that the sample introduced into the analytical instrument truly represents the drug product, thereby guaranteeing the validity of the data generated in pharmaceutical research and development.
Within the framework of thesis research focused on sample preparation for the extraction of metoprolol tartrate from tablets, the steps of filtration and dilution are critical for ensuring the integrity and analytical suitability of the final sample. Proper execution of these steps directly influences the accuracy, precision, and reproducibility of subsequent chromatographic or spectrophotometric analyses. This protocol details standardized methodologies for preparing the final analytical sample, ensuring the removal of particulate interferents and achieving target concentrations within the instrument's linear range.
The Scientist's Toolkit: Essential Research Reagents and Materials
The following table catalogues the essential materials and reagents required for the sample preparation procedures described in this protocol.
Table 1: Key Research Reagent Solutions and Essential Materials
| Item | Function in Sample Preparation |
|---|---|
| Syringe Filters (0.2 µm or 0.45 µm) | Critical for removing undissolved drug particles and insoluble excipients from the sample solution to prevent column damage and analytical interference [39]. |
| Regenerated Cellulose (RC) or Nylon Membranes | Common filter membrane materials compatible with aqueous samples, such as dissolved tablet matrices [40]. |
| Deionized Water | Serves as a primary solvent for dissolving metoprolol tartrate from tablet powders and for preparing dilution series [27] [40]. |
| HPLC-Grade Acetonitrile | A component of the mobile phase used for dilution or dissolution when preparing samples for chromatographic analysis [40] [41]. |
| Phosphate Buffers (e.g., 12.5 mM, pH 5.0) | Used as a dissolution medium or mobile phase component to maintain stable pH conditions, crucial for reproducible chromatographic retention times [42]. |
| Trifluoroacetic Acid (TFA) / Phosphoric Acid | Added in small volumes (e.g., 0.07% v/v) to the solvent to adjust pH and improve chromatographic peak shape [40]. |
| Ultrasonic Bath | Facilitates the rapid and complete dissolution of the powdered tablet and drug standards in the chosen solvent [40]. |
| Mechanical Shaker | Ensures homogeneous mixing of the sample solution before filtration and dilution [40]. |
Experimental Protocols
Sample Filtration Procedure
This method is adapted from established practices in dissolution testing and pharmaceutical analysis to ensure a particulate-free sample [40] [39].
3.1.1 Principle Following the dissolution of a tablet formulation, the resulting sample contains not only the dissolved active pharmaceutical ingredient (metoprolol tartrate) but also insoluble excipients and potentially undissolved drug particles. Filtration is necessary to prevent these particulates from interfering with the analytical instrumentation, which can cause system blockages, elevated backpressure, and skewed results [39].
3.1.2 Materials and Equipment
- Prepared sample solution (e.g., dissolved tablet powder in solvent)
- 0.2 µm or 0.45 µm RC (Regenerated Cellulose) syringe filters [40]
- Syringe (volume appropriate for sample)
- HPLC vials for collecting filtrate
3.1.3 Step-by-Step Methodology
- Prepare Sample Solution: Accurately weigh and powder not less than 20 tablets. Transfer an equivalent weight of powder containing approximately 40 mg of metoprolol tartrate to a conical flask. Extract with four 20 mL portions of an appropriate solvent (e.g., deionized water, 0.05% v/v phosphoric acid, or mobile phase), filtering the combined extracts into a 100 mL volumetric flask. Dilute to volume with the same solvent [27] [40].
- Mix and Degas: Agitate the sample solution using a mechanical shaker for 5-10 minutes and/or degas using an ultrasonic bath to remove air bubbles that could affect filtration [40] [39].
- Assemble Filtration Apparatus: Attach a compatible syringe filter to the luer-lock tip of the syringe.
- Pre-Wet Filter (Optional): Draw a small volume of the pure solvent used for dissolution into the syringe and pass it through the filter to wet the membrane and prepare the system.
- Load Sample: Draw the required volume of the prepared sample solution into the syringe.
- Perform Filtration: Gently and steadily depress the syringe plunger, collecting the resulting filtrate into a clean HPLC vial.
- Discard Initial Filtrate (Optional): The first 1-2 mL of filtrate may be discarded to account for potential adsorption or dilution effects within the filter housing, unless the sample volume is limited.
3.1.4 Critical Notes
- Filter selection is paramount. The membrane material (e.g., RC, Nylon) and pore size must be validated to ensure no adsorption of the analyte occurs [39].
- Always verify that the filtration process does not introduce bias by comparing results against a centrifuged sample.
Sample Dilution Protocol
This protocol outlines the preparation of a dilution series to bring the sample concentration into the optimal range for detection, using a combined standard of metoprolol and meldonium as an exemplar [40].
3.2.1 Principle The concentration of metoprolol in the initial sample extract often exceeds the linear range of the analytical instrument (e.g., HPLC-UV, MS). Strategic dilution is required to align the analyte concentration with the calibrated range of the instrument, thereby ensuring accurate quantification.
3.2.2 Materials and Equipment
- Stock solution of sample (post-filtration)
- Volumetric flasks (e.g., 10 mL, 25 mL, 100 mL)
- Precision pipettes and pipette tips
- Appropriate diluent (e.g., HPLC mobile phase, 0.07% TFA, or deionized water)
3.2.3 Step-by-Step Methodology
- Define Target Concentration: Based on the analytical method's calibration curve, determine the required concentration of metoprolol in the final injected sample. For instance, a method for metoprolol with azelnidipine uses a target concentration of 0.5 mg/mL for metoprolol [40].
- Calculate Dilution Factor: Using the estimated or known concentration of the stock sample solution, calculate the necessary dilution factor (DF) to achieve the target concentration. DF = (Concentration of Stock Solution) / (Target Concentration)
- Perform Serial Dilution:
- Using a precision pipette, transfer a calculated aliquot (V1) from the filtered stock solution into a clean volumetric flask of volume (V2).
- Fill the flask to the mark with the chosen diluent, ensuring the meniscus rests on the calibration line.
- Cap the flask and invert several times to ensure thorough mixing.
- Validate Dilution: For critical applications, prepare a second, independent dilution at the same factor to confirm accuracy and precision.
3.2.4 Critical Notes
- The diluent should ideally match the mobile phase or sample solvent composition as closely as possible to maintain stability and prevent precipitation [40].
- For LC-MS/MS analysis, which is highly sensitive, larger dilution factors may be required, and the diluent must be compatible with the ionization process [17] [43].
Data Presentation and Analytical Performance
The following table summarizes key quantitative performance data for analytical methods used in the determination of metoprolol, illustrating the target ranges for which filtration and dilution protocols must prepare samples.
Table 2: Analytical Method Performance and Target Concentrations for Metoprolol
| Analytical Technique | Linear Range | Limit of Quantification (LOQ) | Reported Concentration in Matrix | Reference |
|---|---|---|---|---|
| LC-MS/MS (Plasma) | 5 - 1000 ng/L | 0.042 ng/L | 34 - 50.81 μg/L (Patient plasma) | [43] |
| Spectrophotometry (Cu(II) complex) | 8.5 - 70 μg/mL | 5.56 μg/mL | N/A (Pharmaceutical dosage forms) | [27] |
| RP-HPLC (Intestinal Perfusion) | N/S | 2.78 μg/mL | N/A (In-situ studies) | [42] |
| RP-HPLC (with Azelnidipine) | Defined range | N/S | Standard at 0.5 mg/mL | [40] |
| LC-MS/MS (Multi-matrix) | 0.6 - 500 μg/L (EBC) | 0.60 μg/L (EBC) | Mean: 5.35 μg/L (EBC), 70.76 μg/L (Plasma) | [17] |
Abbreviations: N/S: Not Specified in the provided context; EBC: Exhaled Breath Condensate.
Workflow Visualization
The following diagram illustrates the complete integrated workflow for preparing the final analytical sample, from the raw tablet to the instrument-ready solution.
Sample Preparation Workflow
The meticulous preparation of the final analytical sample through proper filtration and dilution is a cornerstone of reliable pharmaceutical analysis for metoprolol tartrate. The protocols outlined herein, when executed with attention to critical parameters such as filter compatibility and dilution integrity, ensure that the sample introduced to the analytical instrument is representative, stable, and free of interferents. This rigorous approach to sample preparation underpins the generation of high-quality, reproducible data essential for both routine quality control and advanced research within a thesis framework.
Troubleshooting Common Extraction Issues and Optimizing for Efficiency
Addressing Low Recovery Yields and Incomplete Extraction
The quantitative analysis of active pharmaceutical ingredients (APIs) from solid dosage forms is a critical step in pharmaceutical development and quality control. For metoprolol tartrate, a selective β1-adrenergic receptor blocking agent used in managing hypertension and angina, efficient extraction is fundamental to obtaining accurate and reproducible bioanalytical and dissolution data [43] [16]. Incomplete extraction and low recovery yields present significant challenges that can compromise data integrity, leading to inaccurate assessments of dosage form performance and bioavailability [44]. This application note details the primary causes of low recovery and provides optimized, detailed protocols to overcome these challenges, framed within the broader context of sample preparation research for robust analytical outcomes.
Several factors contribute to suboptimal extraction of metoprolol tartrate from tablet formulations. A systematic understanding of these factors is the first step in troubleshooting recovery issues.
- Formulation Characteristics: Metoprolol tartrate is commonly formulated as either immediate-release (IR) or extended-release (ER) tablets [43]. ER formulations are particularly challenging as they are designed to control the release of the API over an extended period. Crushing or altering these tablets to facilitate extraction, a practice sometimes used for patients with swallowing difficulties, can drastically change the drug's release profile by deforming the surface morphology of embedded micropellets, leading to erratic and incomplete extraction [44].
- Physicochemical Properties: Metoprolol is a moderately lipophilic compound with a logP of 1.88 and a pKa of 9.68 [20]. Its solubility is highly dependent on the pH of the extraction medium, being more soluble in acidic conditions. Using a solvent system that does not account for this can result in poor dissolution of the API from the excipient matrix.
- Sample Preparation Technique: The choice of extraction technique directly impacts recovery. Simple solvent shaking may be insufficient to disrupt the tablet matrix and fully dissolve the API. Techniques like sonication and vortex mixing, potentially in combination, are often necessary to achieve complete extraction [45].
Quantitative Data on Metoprolol in Biological and Pharmaceutical Matrices
Understanding typical concentrations and recovery benchmarks in related fields provides context for evaluating extraction efficiency from tablets. The following table summarizes key quantitative data from bioanalytical studies, which can inform expectations for extractable amounts from dosage forms.
Table 1: Summary of Reported Metoprolol Concentrations in Biological Fluids and Analytical Performance
| Matrix | Analytical Technique | Linear Range | Limit of Quantification (LOQ) | Reported Concentration (Dose) | Recovery/Accuracy | Citation |
|---|---|---|---|---|---|---|
| Human Plasma | LC-MS/MS (Automated TurboFlow) | 5 – 1000 ng/L | 0.042 ng/L | Up to 34 μg/L (50 mg dose); 3.56–50.81 μg/L (100 mg dose) | Precision CV% ≤ 10.28; Accuracy ER% ≤ 5.38 | [43] |
| Human Plasma | HPLC-FD | 0.003 – 1.00 μg/mL | Not Specified | N/A | Accuracy within ± 10% of nominal concentration | [45] |
| Exhaled Breath Condensate (EBC) | LC-MS/MS | 0.6 – 500 μg/L | 0.60 μg/L | Mean: 5.35 μg/L | Intra-day RSD: 5.2–6.1%; Inter-day RSD: 3.3–4.6% | [17] |
| Urine | LC-MS/MS | 0.7 – 10,000 μg/L | 0.70 μg/L | Mean: 1943.1 μg/L | Intra-day RSD: 5.2–6.1%; Inter-day RSD: 3.3–4.6% | [17] |
Table 2: Impact of Tablet Manipulation on Dissolution Profile (Model-Dependent Analysis)
| Tablet Form | Dissolution Medium (pH) | Best-Fit Model | Adjusted R² (R²adj) |
|---|---|---|---|
| Whole Tablet (WT) | pH 1.2 | Hopfenberg | 0.9986 |
| Crushed Tablet (CT) | pH 1.2 | Higuchi | 0.9990 |
| Whole Tablet (WT) | pH 6.8 | First-Order | 0.9979 |
| Crushed Tablet (CT) | pH 6.8 | Korsmeyer-Peppas | 0.9719 |
Optimized Experimental Protocols
Protocol 1: Standardized Extraction from Metoprolol Tartrate Tablets
This protocol is designed for the complete extraction of metoprolol tartrate from immediate-release tablets for content uniformity or assay tests.
Objective: To achieve >95% recovery of metoprolol tartrate from a tablet formulation using a optimized solvent system and mechanical disruption. Principle: The protocol uses an acidic aqueous-organic solvent to ensure high solubility of the API, combined with sonication to disrupt the tablet matrix and facilitate complete dissolution.
The Scientist's Toolkit: Key Research Reagents and Materials
| Item | Function/Benefit |
|---|---|
| Metoprolol Tartrate Reference Standard | Primary standard for calibration and recovery calculations. |
| HPLC-Grade Methanol & Water | Mobile phase preparation and sample dilution to minimize interference. |
| Ortho-Phosphoric Acid (or Formic Acid) | pH adjustment of the solvent system to enhance metoprolol solubility. |
| Ultrasonic Bath | Applies ultrasonic energy to disrupt the tablet matrix and aid dissolution. |
| Vortex Mixer | Provides vigorous mixing to ensure homogeneity and contact between solvent and sample. |
| Analytical Balance | Precise weighing of tablet powder and standard. |
| Volumetric Flasks | For accurate preparation and dilution of standard and sample solutions. |
| Membrane Filters (0.45 μm Nylon) | Removal of particulate matter prior to chromatographic analysis. |
Step-by-Step Procedure:
- Solvent Preparation: Prepare a mixture of 0.1% formic acid in a water:methanol (50:50, v/v) solution. Degas by sonication for 10 minutes.
- Standard Solution: Accurately weigh approximately 25 mg of metoprolol tartrate reference standard into a 50 mL volumetric flask. Dissolve and make up to volume with the prepared solvent to obtain a 500 μg/mL stock solution. Further dilute as needed to create working standards.
- Sample Preparation: a. Accurately weigh and finely powder not less than 20 tablets. b. Transfer an amount of powder equivalent to the weight of one tablet (or containing about 25 mg of metoprolol tartrate) into a 50 mL volumetric flask. c. Add approximately 40 mL of the extraction solvent. d. Vortex the mixture for 2 minutes to ensure thorough wetting of the powder. e. Sonicate the flask in an ultrasonic bath for 30 minutes, ensuring the flask is securely positioned and the water level is adequate. f. Remove the flask and allow it to cool to room temperature. g. Dilute to volume with the extraction solvent and mix well.
- Clarification: Pass a portion of the sample solution through a 0.45 μm nylon membrane filter, discarding the first 2 mL of the filtrate.
- Analysis: Analyze the filtered sample and standard solutions using a validated HPLC or LC-MS/MS method [43] [45]. Compare the peak response of the sample to that of the standard to calculate the percentage recovery.
Protocol 2: Discriminative Dissolution Testing Using USP Apparatus IV (Open-Loop)
This protocol is vital for evaluating the release profile of metoprolol from formulations, especially when investigating the impact of physical changes (e.g., crushing) on extraction and release.
Objective: To obtain a discriminative dissolution profile of metoprolol tartrate tablets and compare the release kinetics between whole and crushed tablets. Principle: The USP IV apparatus (flow-through cell) operates under sink conditions with laminar flow, providing a more discriminatory and biorelevant environment compared to traditional paddle methods [20].
Step-by-Step Procedure:
- Apparatus Setup: Use a flow-through dissolution apparatus (USP IV) with 22.6 mm diameter cells in an open-loop configuration.
- Cell Preparation: Place a 5 mm ruby bead at the base of the cell. Add 3 grams of 3 mm glass beads. Place a 2.7 μm glass microfiber filter on top of the glass beads.
- Sample Loading: For a whole tablet, place it gently on the filter bed. For a crushed tablet, disperse the powder evenly over the filter bed.
- Dissolution Parameters:
- Medium: Degassed simulated gastric fluid without enzymes (or other suitable medium as per method development).
- Temperature: 37 ± 0.5 °C.
- Flow Rate: 8 mL/min.
- Sample Collection: Collect dissolution samples automatically or manually at predetermined time points (e.g., every minute for 8 min, then every 2 min until 20 min, then every 5 min until 40 min).
- Analysis: Filter all samples through a 0.45 μm nylon filter and analyze using a validated UV-Vis spectrophotometric method at 273 nm or via HPLC [20].
- Data Analysis: Plot the non-cumulative and cumulative drug release profiles. Compare profiles using similarity (f2) and difference (f1) factors, or by comparing kinetic parameters like Cmax, Tmax, and AUC derived from the non-cumulative data [20].
Workflow and Troubleshooting Pathways
The following diagram illustrates the systematic workflow for addressing low recovery yields, from initial problem identification to solution implementation.
Diagram: Troubleshooting Low Recovery Yields
Achieving high recovery yields for metoprolol tartrate from tablets requires a methodical approach that considers the formulation's design, the API's physicochemical properties, and the rigor of the extraction technique. The protocols and troubleshooting framework provided herein offer researchers and drug development professionals validated strategies to overcome common extraction challenges. Employing a discriminative dissolution method like USP IV open-loop can be particularly insightful for evaluating complex release profiles and ensuring that in vitro tests accurately reflect potential in vivo performance. By adhering to these optimized procedures, laboratories can ensure the generation of reliable, high-quality data essential for pharmaceutical development and quality assurance.
Within the framework of thesis research on sample preparation for the extraction of metoprolol tartrate from tablets, the optimization of fundamental physicochemical parameters is paramount for achieving high extraction efficiency, reproducibility, and analytical accuracy. Sample preparation is often the most critical and error-prone step in the analytical process, responsible for approximately 30% of procedural errors [46]. This document provides detailed application notes and protocols for optimizing the key parameters of pH, temperature, and sonication time, which collectively govern the extraction kinetics, stability, and final yield of metoprolol tartrate. The methodologies are designed to support researchers, scientists, and drug development professionals in developing robust, sensitive, and efficient analytical methods.
The Scientist's Toolkit: Essential Research Reagents & Materials
The following table details key reagents and materials essential for experiments involving the extraction and analysis of metoprolol tartrate.
Table 1: Key Research Reagent Solutions and Essential Materials
| Item | Function/Explanation |
|---|---|
| Deep Eutectic Solvent (DES): TBAB & PEG200 | A sustainable, tunable extraction solvent. TBAB acts as a hydrogen bond acceptor (HBA) and PEG200 as a hydrogen bond donor (HBD) in a 1:3 molar ratio, enhancing the partitioning of metoprolol tartrate in aqueous two-phase systems [47]. |
| Ethyl Cellulose (EC) | A non-ionic, pH-insensitive polymer used in sustained-release microcapsules and as a matrix builder in sample preparation for modulating drug release profiles [48]. |
| Polyethylene Glycol (PEG 6,000 & PEG200) | A hydrophilic polymer and plasticizer. It improves the flexibility of microcapsules and acts as a porogen for membrane-controlled release. Also serves as a component in DES formulations [48] [47]. |
| Dipotassium Hydrogen Phosphate (K₂HPO₄) | A salt used in aqueous two-phase systems (ATPS) to induce phase separation and influence the partition coefficient of the target analyte [47]. |
| Methanol (Acidified) | A common organic solvent for ultrasound-assisted extraction. Its composition and pH are critical for optimal analyte recovery from solid samples [49]. |
| Artificial Gastric and Intestinal Fluids | Biorelevant media used in in vitro release studies to simulate the physiological conditions of the gastrointestinal tract for sustained-release formulations [48]. |
Quantitative Parameter Optimization Data
Systematic optimization is crucial for developing a reliable extraction protocol. The following table consolidates critical data and optimal ranges for the core parameters, derived from experimental studies.
Table 2: Summary of Optimized Critical Parameters for Sample Preparation
| Parameter | Optimal Range / Value | Key Experimental Findings |
|---|---|---|
| pH | 2.0 - 6.0 | A pH of 2.0 was optimal for the air-assisted liquid-liquid microextraction of beta-blockers including carvedilol, facilitating the dispersion of the extraction solvent [46]. Another study on cardiovascular drug extraction found a pH of 6.0 to be ideal, as it promoted the non-ionized forms of the molecules, improving their extractability into the organic phase [46]. |
| Temperature | 15°C - 40°C | For sonication-assisted extraction of drugs from tissues, a temperature of 40°C yielded the highest recoveries for metoprolol and other compounds [49]. In contrast, for the delicate process of membrane coating nanoparticles, a lower temperature of 15°C was optimal to prevent increases in nanoparticle size and maintain coating efficiency [50]. |
| Sonication Time | 5 - 30 minutes | A sonication time of 30 minutes was identified as optimal for the ultrasound-assisted extraction of metoprolol from fish tissue [49]. In the context of preparing micron-sized vermiculite particles, a process analogous to nanomaterial preparation for drug delivery, effective particle size reduction was achieved within 5 minutes using an optimized reactor [51]. |
| DES Concentration | Higher concentration increases partition coefficient | In a DES-based ATPS, increasing the concentration of the DES (TBAB:PEG200) directly enhances the partition coefficient of metoprolol tartrate, thereby improving its extraction into the target phase [47]. |
| Salt Concentration | Higher concentration decreases partition coefficient | The addition of salts like K₂HPO₄ to an ATPS induces phase separation but a higher salt concentration in the system decreases the partition coefficient of metoprolol tartrate [47]. |
Detailed Experimental Protocols
Protocol 1: Optimizing pH for Liquid-Liquid Microextraction
This protocol is designed to isolate and pre-concentrate metoprolol tartrate from an aqueous sample, optimizing recovery by controlling the ionization state of the molecule.
Workflow: pH Optimization for Microextraction
Materials:
- Metoprolol tartrate standard solution
- pH meter and standard buffer solutions
- Acid/Base solutions (e.g., HCl, NaOH)
- Extraction solvent (e.g., Acetonitrile, Dichloromethane)
- Salting-out agent (e.g., Ammonium sulfate, NaCl)
- Centrifuge tubes (e.g., 15 mL)
- Microsyringe
- Vortex mixer
- Centrifuge
Procedure:
- Sample Preparation: Transfer 1 mL of the standard metoprolol tartrate solution into a 15 mL centrifuge tube.
- pH Adjustment: Using a calibrated pH meter, adjust the pH of the solution to the target value (e.g., 2.0, 4.0, 6.0, 8.0) using dilute HCl or NaOH solutions. Record the final pH.
- Salt Addition: Add a predetermined amount of salting-out agent (e.g., 110 mg of (NH₄)₂SO₄) to the solution [46].
- Solvent Addition: Precisely add a micro-volume (e.g., 90 µL) of the organic extraction solvent [46].
- Mixing and Separation: Securely cap the tube and vortex mix for 1 minute. Then, centrifuge at 4000 rpm for 5 minutes to achieve complete phase separation.
- Sample Collection: Using a microsyringe, carefully collect the upper organic phase. The sample is now ready for instrumental analysis (e.g., HPLC, LC-MS/MS).
Protocol 2: Optimizing Sonication Time and Temperature for Extraction
This protocol outlines a method for extracting metoprolol tartrate from a solid matrix (e.g., tablet powder) or a complex suspension using ultrasonic energy.
Workflow: Sonication-Assisted Extraction
Materials:
- Probe-type ultrasonic homogenizer (e.g., 20-30 kHz)
- Temperature-controlled water bath with circulator
- Thermostatable reaction vessel (e.g., Rosett reactor) [51]
- Analytical balance
- Centrifuge and tubes
Procedure:
- Sample and Solvent Mixing: Accurately weigh a portion of the solid sample (e.g., homogenized tablet powder) into the sonication vessel. Add the selected extraction solvent (e.g., a mixture of 10 mL methanol and 7 mL water, pH 2.2) [49].
- Temperature Equilibration: Place the vessel in a temperature-controlled bath or use a reactor with an integrated cooling system. Equilibrate the sample suspension to the desired temperature (e.g., 40°C) [49].
- Ultrasonic Treatment: Immerse the ultrasonic probe into the sample suspension. Subject the mixture to sonication at a defined power (e.g., 300 W) for the optimized time (e.g., 30 minutes) [49]. Ensure the probe is positioned centrally to ensure uniform energy distribution.
- Post-Sonication Processing: After sonication, allow the sample to cool and settle. Transfer the entire contents to a centrifuge tube and centrifuge at high speed (e.g., 10,000 rpm) for 10 minutes to separate the solid residue.
- Sample Collection: Carefully collect the clarified supernatant. The extract may require further dilution or cleanup (e.g., solid-phase extraction) before analysis.
Critical Insights and Interparameter Relationships
- Sonication Mechanism and Caveats: The efficiency of sonication is driven by acoustic cavitation, where the formation and collapse of microbubbles generate extreme local temperatures and pressures, facilitating particle size reduction and mass transfer [51]. However, excessive sonication time or power can lead to particle aggregation or degradation of the target analyte [51]. Furthermore, temperature control during sonication is critical; high temperatures can lead to "vaporous cavitation," where bubbles coalesce, decreasing ultrasonic efficiency [51] [50].
- pH and Drug Partitioning: The pH of the solution directly influences the ionization state of metoprolol tartrate, a critical factor in its partitioning behavior in liquid-liquid extraction systems. Adjusting the pH to a value where the drug is in its non-ionized form significantly enhances its transfer into the organic solvent phase [46].
- The Role of Experimental Design: Optimizing multiple interacting parameters (e.g., pH, temperature, time, solvent ratio) is complex. The use of statistical experimental design, such as Box-Behnken or Central Composite Designs (CCD), is highly recommended [46] [49]. These approaches allow for the efficient exploration of a wide experimental space with a reduced number of experiments and can identify interaction effects between parameters that would be missed in one-factor-at-a-time experiments.
Managing Excipient Interference and Achieving Selectivity
The accurate quantification of Active Pharmaceutical Ingredients (APIs) in solid dosage forms is a cornerstone of pharmaceutical analysis, essential for ensuring product quality, efficacy, and safety. For researchers developing extraction and analytical methods for metoprolol tartrate from tablets, a significant challenge is managing interference from excipients—the pharmacologically inactive components of the formulation. Excipients can physically impede API release, chemically interact with the API to form new impurities, or co-elute during chromatographic analysis, thereby compromising selectivity and accuracy.
This application note, framed within a broader thesis on sample preparation, details the key interference mechanisms encountered with metoprolol tartrate tablets and provides validated protocols to achieve selective analysis. We focus on a documented chemical interaction between metoprolol and the common diluent lactose, and outline strategies to mitigate its effects, ensuring the reliability of your analytical results.
Key Interference Mechanisms and Mitigation Strategies
In the analysis of metoprolol tartrate tablets, excipients can cause interference through two primary mechanisms: chemical interaction and physical entrapment.
Chemical Interaction: The Maillard Reaction with Lactose
A critical interference arises from a Maillard reaction between the secondary amine group of metoprolol and the aldehyde group of lactose. This reaction, which can occur during accelerated stability studies (e.g., 40°C ± 2°C / 75% RH ± 5% RH), leads to the formation of a new impurity, a metoprolol lactose adduct [52].
- Identification: This impurity can be identified via High-Performance Liquid Chromatography (HPLC) as an unknown peak at a retention time (e.g., ~3.955 minutes) distinct from the metoprolol peak (e.g., ~7.388 minutes) [52].
- Characterization: Liquid Chromatography-Mass Spectrometry (LC-MS) analysis of the impurity shows a molecular ion peak at m/z 592.29, corresponding to the adduct [52].
- Mitigation Strategy: To prevent this reaction, a key mitigation strategy is to avoid the use of lactose as a diluent in the formulation of metoprolol tartrate tablets. Alternative, non-reducing diluents should be selected during the pre-formulation stage [52].
Physical Interference in Sustained-Release Formulations
In sustained-release dosage forms, excipients are used to control the release rate of the API. Hydrophilic polymers like Hydroxypropyl Methylcellulose (HPMC) and hydrophobic polymers like Ethyl Cellulose (EC) form a gel matrix or a barrier that physically entraps the drug [53]. While this is intentional for drug release, it presents a challenge for complete extraction during sample preparation. Furthermore, additional coating polymers like Eudragit RS/RL can introduce further diffusion barriers that must be overcome to achieve exhaustive extraction for content uniformity assays [53].
Table 1: Common Excipients in Metoprolol Formulations and Their Interference Potential
| Excipient Category | Example | Primary Function | Potential Interference with Analysis |
|---|---|---|---|
| Diluent | Lactose | Bulking agent | Chemical: Maillard reaction, forming a lactose adduct impurity [52] |
| Matrix Former | HPMC K100M, EC | Sustained-release control | Physical: Gel formation and entrapment, hindering complete API extraction [53] |
| Coating Polymer | Eudragit RS/RL | Release rate modifier | Physical: Adds a diffusion barrier, slowing down API extraction [53] |
| Lubricant | Magnesium Stearate | Prevents adhesion | Physical: Can form a hydrophobic layer, potentially reducing extraction efficiency |
Experimental Protocols for Selective Extraction and Analysis
The following protocols are designed to effectively manage the interferences described above.
Protocol 1: Sample Preparation for Impurity Profiling (Maillard Adduct)
This protocol is designed for the identification and quantification of the metoprolol lactose adduct impurity.
- Objective: To extract and separate metoprolol and its lactose adduct from tablet matrices for HPLC analysis.
- Materials:
- Metoprolol tartrate tablets
- HPLC-grade water, acetonitrile, ammonium acetate, acetic acid
- Ultrasonic bath, analytical balance, volumetric flasks
- Procedure:
- Accurately weigh and finely powder not less than 20 tablets.
- Transfer an amount of powder equivalent to about 50 mg of metoprolol tartrate into a 100 mL volumetric flask.
- Add about 70 mL of diluent (e.g., a water-acetonitrile mixture) and sonicate for 30 minutes with intermittent shaking.
- Allow the solution to cool to room temperature, dilute to volume with the diluent, and mix well.
- Centrifuge a portion of the solution or filter through a 0.45-μm membrane filter.
- Analyze the filtrate using the HPLC conditions below [52].
Table 2: HPLC Conditions for Impurity Separation
| Parameter | Specification |
|---|---|
| Column | C18 (250 mm x 4.6 mm, 5 μm) |
| Mobile Phase | Gradient of A: 10mM Ammonium Acetate (pH 4.0 with acetic acid) and B: Acetonitrile |
| Flow Rate | 1.0 mL/min |
| Detection | UV at 274 nm |
| Injection Volume | 20 μL |
| Column Temperature | 30°C |
Protocol 2: Exhaustive Extraction from Sustained-Release Formulations
This protocol is optimized for the complete extraction of metoprolol from complex sustained-release matrices.
- Objective: To achieve complete extraction of metoprolol tartrate from matrix granules or tablets for accurate content assay.
- Materials:
- Sustained-release metoprolol granules or tablets
- Phosphate buffer (pH 6.8) or 0.1 N Hydrochloric acid
- Mechanical shaker or stirrer, heating mantle (optional)
- Procedure:
- Accurately weigh an amount of granules or powdered tablets equivalent to 100 mg of metoprolol tartrate.
- Transfer to a 1000 mL volumetric flask containing 500 mL of dissolution medium (e.g., phosphate buffer pH 6.8).
- Agitate continuously using a mechanical stirrer at a medium speed (e.g., 100 rpm) for 8-12 hours to ensure complete erosion of the polymer matrix and drug release.
- Dilute to volume with the same medium and mix thoroughly.
- Withdraw an aliquot, centrifuge or filter (0.45-μm membrane), and dilute the filtrate appropriately for analysis by HPLC or UV spectrophotometry [53].
The workflow below illustrates the decision-making process for selecting the appropriate sample preparation protocol based on the analysis goal.
The Scientist's Toolkit: Essential Research Reagents and Materials
The following table details key materials and instruments required to execute the protocols effectively.
Table 3: Research Reagent Solutions for Metoprolol Tartrate Analysis
| Item | Function/Application | Specific Example/Note |
|---|---|---|
| HPLC System with UV Detector | Primary instrument for separation and quantification of metoprolol and its impurities. | Ensure capability for gradient elution [52]. |
| C18 Chromatographic Column | Stationary phase for reverse-phase HPLC separation. | 250 mm length, 4.6 mm internal diameter, 5 μm particle size [52]. |
| Reference Standards | Critical for method calibration and accurate quantification. | High-purity Metoprolol Tartrate; impurity standards if available [52]. |
| Ammonium Acetate / Acetic Acid | Components of the aqueous mobile phase for controlling pH and ionic strength. | Used to prepare 10 mM buffer at pH 4.0 [52]. |
| HPLC-Grade Acetonitrile | Organic modifier in the mobile phase for gradient elution. | Essential for achieving separation of the API from impurities [52]. |
| Ultrasonic Bath | Aids in the dissolution and extraction of the API from the tablet matrix. | Used in sample preparation to ensure complete extraction [52]. |
| Membrane Filters (0.45 μm) | Clarification of sample solutions prior to HPLC injection. | Prevents particulate matter from damaging the HPLC system [52]. |
| pH Meter | For accurate adjustment of buffer solutions. | Critical for reproducible HPLC retention times [52]. |
Successfully managing excipient interference is not merely a technical hurdle but a fundamental aspect of robust analytical method development for metoprolol tartrate. A proactive approach that involves understanding the formulation composition, particularly the potential for Maillard reactions with lactose and the physical barriers posed by release-controlling polymers, is paramount. The protocols and strategies outlined herein provide a clear pathway to achieve the selectivity and accuracy required for high-quality pharmaceutical research, directly supporting the rigorous demands of a thesis in analytical pharmaceutics. By implementing these methods, researchers can ensure that their quantification of metoprolol tartrate is a true reflection of the API content, free from the confounding effects of its excipient matrix.
Overcoming Challenges with Filter Blockage and Solution Clarity
In the quantitative analysis of metoprolol tartrate from solid dosage forms, sample preparation is a critical step that directly impacts the correctness and reliability of results. The efficiency of protein isolation, solubilization, and proteolysis often represents the principal bottleneck in analytical workflows. Among these challenges, filter blockage and achieving final solution clarity are particularly prevalent, potentially compromising method linearity, quantitative accuracy, and chromatographic performance, such as in LC-MS-based shotgun proteomics. This document outlines standardized protocols and application notes to overcome these challenges, ensuring robust and reproducible sample preparation for pharmaceutical research and development.
Summarized Quantitative Data on Filtration Methods
The following tables consolidate key performance data and characteristics of different filtration and sample preparation techniques relevant to isolating analytes like metoprolol tartrate from complex matrices.
Table 1: Performance Comparison of Sample Preparation Methods
| Method | Linear Dynamic Range (LDR) | Limit of Detection (LOD) | Key Advantage | Key Disadvantage |
|---|---|---|---|---|
| Filter-Aided Sample Preparation (FASP) [54] | 0.6 x 10^2 and above | 4 fmol (for BSA) | Excellent compatibility with LC-MS; effective detergent removal [54] | Slightly lower protein recoveries with phenol extraction [54] |
| Detergent-Based Lysis [54] | Good Linearity | Not Specified | Better method linearity [54] | Requires detergent removal to avoid compromising LC-MS analysis [54] |
| Phenol Extraction [54] | Good Linearity | Not Specified | Slightly better protein recoveries [54] | Slightly poorer linearity [54] |
Table 2: Comparison of Filter Clog Remediation Techniques
| Cleaning Method | Procedure Summary | Advantages | Disadvantages |
|---|---|---|---|
| Acidic Solvent Soaking [55] | Soak in dilute acid (e.g., HCl, HNO₃), rinse, neutralize, dry. | Can dissolve clogged particulate matter [55] | Ineffective against discoloration; uncertain cleaning efficacy [55] |
| High-Pressure Water Flushing [55] | Disassemble and flush components with a high-pressure water gun. | Effective at removing physically clogged particles [55] | Limited effect on stubborn or chemical residues [55] |
| Ultrasonic Cleaning [55] | Disassemble and clean in an ultrasonic bath with a suitable solution. | Superior to water flushing for fine contaminants [55] | Ineffective against discoloration; requires special equipment [55] |
Experimental Protocols
Protocol: Filter-Aided Sample Preparation (FASP) for Complex Matrices
This protocol is adapted from methods validated for plant proteomics and is applicable to challenging biological samples prone to filter blockage [54].
1. Reagent Preparation:
- Lysis Buffer: Prepare a solution containing 4% (w/v) SDS and 100 mM Tris-HCl, pH 7.6. Add a protease inhibitor cocktail immediately before use.
- UA Solution: 8 M Urea in 100 mM Tris-HCl, pH 8.5.
- IAA Solution: 50 mM Iodoacetamide in UA solution (prepare fresh and keep in dark).
- Digestion Buffer: 50 mM Ammonium bicarbonate or 25 mM urea in 50 mM ammonium bicarbonate.
- Trypsin Solution: Sequence-grade trypsin at 0.1–0.5 µg/µL in digestion buffer.
2. Sample Lysis and Clarification:
- Homogenize the tablet powder or biological sample in the prepared Lysis Buffer.
- Incubate the lysate at 95–100°C for 5–10 minutes to fully denature proteins and solubilize components.
- Centrifuge the lysate at 14,000 × g for 15 minutes at room temperature to pellet insoluble debris.
- Critical Step: Carefully transfer the clarified supernatant to a new microcentrifuge tube. Avoid disturbing the pellet, as this is the first key step in preventing filter blockage.
3. Filter-Aided Detergent Removal and Digestion:
- Transfer the clarified supernatant to a 30 kDa molecular weight cut-off (MWCO) ultrafiltration unit.
- Centrifuge at 14,000 × g for 20–40 minutes until most of the solution has passed through. Discard the flow-through.
- Add 200 µL of UA solution to the filter unit. Centrifuge at 14,000 × g for 20 minutes. Discard the flow-through.
- Repeat the UA wash step once more.
- Add 100 µL of IAA solution to the filter unit. Incubate for 5 minutes in the dark without mixing, then incubate for an additional 20 minutes with occasional mixing.
- Centrifuge at 14,000 × g for 15 minutes. Discard the flow-through.
- Add 100 µL of UA solution and centrifuge at 14,000 × g for 20 minutes. Discard the flow-through.
- Perform two washes with 100 µL of Digestion Buffer, centrifuging each time at 14,000 × g for 20 minutes.
- Add trypsin solution at a 1:50–1:100 (enzyme-to-protein) ratio to the filter unit.
- Incubate the sealed unit at 37°C for 12–16 hours.
- After digestion, centrifuge at 14,000 × g for 20 minutes to collect the peptides.
- Rinse the filter with 50 µL of 50 mM ammonium bicarbonate, centrifuge, and pool with the first eluate.
4. Sample Clean-up:
- Acidify the pooled peptide eluate with trifluoroacetic acid (TFA) to a final concentration of 0.5–1%.
- Desalt the acidified sample using a C18 solid-phase extraction (SPE) microcolumn according to the manufacturer's instructions.
- Lyophilize the purified peptides and reconstitute in a mobile-phase compatible solvent (e.g., 0.1% formic acid) for LC-MS analysis.
Protocol: Centrifugal Filtration for Solution Clarity in Tablet Extracts
This protocol is designed specifically for achieving particle-free solutions from metoprolol tartrate tablet extracts prior to spectrophotometric or chromatographic analysis [29].
1. Sample Extraction:
- Accurately weigh and powder a representative number of tablets.
- Transfer an amount of powder equivalent to one dose of metoprolol tartrate into a suitable vial.
- Add an appropriate volume of extraction solvent (e.g., methanol, water, or a buffer as required by the analytical method [29]).
- Vortex vigorously for 2–3 minutes and then sonicate for 15–20 minutes to ensure complete dissolution and extraction of the API.
2. Clarification by Centrifugation:
- Transfer the extract to a 1.5 mL or 2 mL microcentrifuge tube.
- Centrifuge at 16,000 × g for 10 minutes at room temperature to pellet insoluble excipients like starch, cellulose, and magnesium stearate.
3. Sterile Filtration:
- Critical Step: Use a 0.22 µm or 0.45 µm pore size hydrophilic PVDF or nylon syringe filter.
- Pre-wet the filter with a small volume of the extraction solvent.
- Carefully load the supernatant from the centrifugation step into a syringe and pass it through the filter into a clean vial.
- Avoid forcing the entire volume if resistance is felt, as this indicates potential blockage. It is preferable to use multiple filters if dealing with a large volume of a particularly challenging sample.
4. Analysis:
- The filtrate should be a clear solution suitable for direct analysis via HPLC, UV-Vis spectrophotometry, or other subsequent analytical techniques [29].
Workflow Visualization
Sample Preparation Workflow
Filter Clogging Decision Tree
The Scientist's Toolkit: Key Research Reagent Solutions
Table 3: Essential Reagents and Materials for Sample Preparation
| Item | Function/Application |
|---|---|
| SDS (Sodium Dodecyl Sulfate) [54] | A powerful ionic detergent used for efficient cell lysis and protein solubilization from complex matrices. |
| Ultrafiltration Units (e.g., 30 kDa MWCO) [54] | Used in FASP to retain proteins while removing detergents (SDS), salts, and other small-molecule contaminants. |
| Urea & Tris-HCl Buffer [54] | Urea acts as a chaotropic agent in denaturing buffers, while Tris is a buffering agent to maintain stable pH. |
| Iodoacetamide (IAA) [54] | Alkylating agent used to cysteine residues, preventing disulfide bridge formation and aiding protein denaturation. |
| Sequence-Grade Trypsin [54] | Protease enzyme used to digest proteins into peptides for downstream LC-MS/MS analysis. |
| Hydrophilic PVDF/Nylon Syringe Filters (0.22/0.45 µm) | For final sterile filtration of aqueous samples to achieve solution clarity and remove particulate matter prior to HPLC/UV-Vis. |
| C18 Solid-Phase Extraction (SPE) Cartridges | For desalting and concentrating peptide mixtures after digestion, improving MS signal and longevity. |
| Dilute Acidic Solvents (e.g., HCl, HNO₃) [55] | Used for cleaning heavily clogged glass filter apparatus by dissolving mineral deposits and insoluble residues. |
Strategies for Enhancing Analytical Sensitivity and Precision
In the realm of pharmaceutical analysis, particularly for the quantification of active pharmaceutical ingredients (APIs) like metoprolol tartrate from tablet formulations, the reliability of data hinges on the analytical sensitivity and precision of the method. Analytical sensitivity, defined as the lowest concentration of an analyte that can be reliably distinguished from background noise, establishes the detection limit of an assay [56]. Precision expresses the closeness of agreement between a series of measurements from multiple sampling of the same homogeneous sample, representing the method's reproducibility [57]. For researchers and drug development professionals, optimizing these two parameters is paramount for generating trustworthy data for quality control, stability studies, and bioavailability assessments. This document frames these strategies within the specific context of sample preparation and analysis of metoprolol tartrate, a beta-blocker commonly formulated in fixed-dose combination tablets [41].
The challenge in analyzing APIs from solid dosage forms lies in the complex sample matrix. Excipients can interfere with analysis, while incomplete extraction can compromise both sensitivity (by reducing the detectable analyte signal) and precision (by introducing variability). Therefore, a robust sample preparation strategy is the critical first step in any enhancement protocol.
Core Concepts and Their Significance
Understanding the distinction between fundamental performance characteristics is crucial for effective method optimization.
Analytical Sensitivity vs. Functional Sensitivity: While analytical sensitivity (or detection limit) is the concentration equivalent to the signal of a blank sample plus (for immunometric assays) or minus (for competitive assays) two standard deviations, it has limited practical value for clinical or pharmaceutical reporting [56]. A more pragmatic measure is functional sensitivity, defined as the lowest analyte concentration at which an assay can report clinically useful results with a specified imprecision, typically a ≤20% coefficient of variation (CV) in clinical settings [56]. This represents the concentration where precision becomes acceptable for reliable quantification, not just detection.
Precision and Accuracy: Precision (the degree of scatter in repeated measurements) is distinct from accuracy (the closeness of agreement between a measured value and a true or accepted reference value) [57]. A method can be precise without being accurate, but a truly robust method must demonstrate both. Precision is typically assessed at multiple levels (repeatability, intermediate precision) and is a key component of method validation [57].
The Interplay with Other Validation Parameters: Sensitivity and precision do not exist in isolation. They are intrinsically linked to other validation parameters. Specificity—the ability to assess the analyte unequivocally in the presence of other components—is foundational; without it, sensitivity and precision measurements are meaningless [57]. Linearity and range define the concentration interval over which the method has suitable precision, accuracy, and linearity, establishing the boundaries for reliable quantification above the detection limit [57].
Table 1: Key Analytical Performance Characteristics and Their Definitions
| Characteristic | Formal Definition | Role in Method Validation |
|---|---|---|
| Analytical Sensitivity | The lowest concentration that can be distinguished from background noise [56]. | Establishes the detection limit (LOD) of the method. |
| Functional Sensitivity | The lowest concentration at which results are clinically useful, based on an imprecision goal (e.g., CV ≤20%) [56]. | Defines the practical lower limit of quantification (LLOQ). |
| Precision | The closeness of agreement between a series of measurements under prescribed conditions [57]. | Measures the method's reproducibility and random error. |
| Accuracy | The closeness of agreement between a measured value and a true or accepted reference value [57]. | Measures the method's trueness and systematic error. |
| Specificity | The ability to assess the analyte unequivocally in the presence of other components [57]. | Ensures the signal is derived solely from the target analyte. |
Experimental Protocols for Enhanced Analysis of Metoprolol Tartrate
Protocol 1: Sample Preparation and Extraction for Metoprolol Tartrate Tablets
Objective: To efficiently and completely extract metoprolol tartrate from a tablet matrix while minimizing co-extraction of interferents, thereby enhancing analytical sensitivity and precision for subsequent HPLC analysis.
Materials:
- Metoprolol tartrate tablets (e.g., fixed-dose combination with hydrochlorothiazide) [41]
- Reference standard: Metoprolol tartrate (98–101% purity) [53]
- Solvent: Water, or a mixture of water and acetonitrile, as appropriate
- Analytical balance, ultrasonic bath, volumetric flasks, syringe filters (0.45 µm)
Procedure:
- Weighing: Accurately weigh and finely powder not less than 20 tablets.
- Aliquot Transfer: Transfer an accurately weighed portion of the powder, equivalent to about 50 mg of metoprolol tartrate, to a 100 mL volumetric flask.
- Initial Solubilization: Add about 70 mL of diluent (e.g., water or a water/acetonitrile mixture) to the flask.
- Enhanced Extraction: Sonicate the flask in an ultrasonic water bath for 20 minutes, periodically shaking manually to disperse the powder and ensure complete drug dissolution and extraction from the excipients.
- Equilibration: Allow the solution to cool to room temperature.
- Dilution to Volume: Dilute to volume with the same diluent and mix well.
- Clarification: Centrifuge a portion of the solution or filter through a 0.45 µm membrane filter, discarding the first few mL of the filtrate.
Critical Notes for Enhancement:
- Sonicication Time and Efficiency: The sonication step is critical for complete extraction. Incomplete extraction will directly impair both precision (through variable recovery) and functional sensitivity (by reducing the measurable concentration).
- Diluent Selection: The choice of diluent should be optimized to maximize the solubility of metoprolol tartrate while minimizing the extraction of interfering excipients, thereby improving specificity and the signal-to-noise ratio [41].
Protocol 2: Stability-Indicating HPLC Analysis
Objective: To separate, identify, and quantify metoprolol tartrate and its potential impurities or degradation products in a single run, demonstrating the specificity and robustness of the method.
Materials and Instrumentation:
- HPLC system with UV or DAD detector
- Column: Symmetry C18 (100 mm × 4.6 mm, 3.5 µm) or equivalent [41]
- Mobile Phase A: 34 mM sodium phosphate buffer, pH 3.0 [41]
- Mobile Phase B: Acetonitrile (HPLC grade)
- Gradient program: As developed for metoprolol and hydrochlorothiazide separation [41]
Procedure:
- Chromatographic Conditions:
- Flow Rate: 1.0 mL/min
- Detection Wavelength: 274 nm
- Column Temperature: Ambient
- Injection Volume: 10 µL
- Gradient: Optimize to achieve resolution ≥2.0 between metoprolol, its related compounds, and other API peaks (e.g., hydrochlorothiazide) [41].
- System Suitability: Inject a standard solution of metoprolol tartrate. The relative standard deviation (RSD) for replicate injections should be ≤2.0%, and the tailing factor should be ≤2.0.
- Sample Analysis: Inject the prepared sample solution (from Protocol 1) and the appropriate standard solutions.
- Forced Degradation (Stress Testing): To demonstrate specificity, analyze stressed samples (e.g., exposed to acid, base, oxidation, heat, and light). The method should effectively separate the analyte peak from any degradation peaks [41].
Critical Notes for Enhancement:
- pH Control: Precise adjustment of the mobile phase pH is critical for achieving consistent retention times and peak shape for metoprolol, directly impacting precision.
- Specificity Demonstration: The forced degradation study is essential to prove that the method is stability-indicating, confirming that the quantitation of metoprolol is accurate and precise even in the presence of degradation products.
Protocol 3: Determination of Functional Sensitivity (Lower Limit of Quantification)
Objective: To establish the practical lower limit of quantitation (LLOQ) for metoprolol tartrate based on an acceptable imprecision criterion, moving beyond the theoretical detection limit.
Procedure:
- Preparation of Low-Concentration Samples: Prepare multiple (at least 5) independent samples of metoprolol tartrate at concentrations near the expected LLOQ. Using patient samples or pools diluted with an appropriate diluent is recommended over using routine sample diluents, which may contain interfering substances [56].
- Long-Term Precision Study: Analyze these samples repeatedly over a period of days or weeks (at least 5 different runs) to determine the inter-assay (day-to-day) precision [56].
- Data Analysis: For each low-concentration sample, calculate the mean concentration and the CV%.
- Establish LLOQ: The functional sensitivity is the lowest concentration at which the CV meets a pre-defined goal for clinical usefulness. While a CV of 20% is commonly used, this goal should be based on the assay's intended clinical or pharmaceutical application [56].
Data Presentation and Analysis
A well-designed validation study generates quantitative data that must be summarized clearly. The following table exemplifies how precision and sensitivity data can be structured.
Table 2: Exemplary Data for Precision and Sensitivity Assessment of a Metoprolol Tartrate HPLC Assay
| Analyte Concentration (µg/mL) | Intra-day Precision (n=6, %RSD) | Inter-day Precision (n=18 over 3 days, %RSD) | Mean Accuracy (% Recovery) | Remarks |
|---|---|---|---|---|
| 0.5 (LLOQ) | 4.5% | 8.2% | 98.5% | Functional Sensitivity (CV <20%) |
| 5.0 (Mid-range) | 1.8% | 2.5% | 100.2% | Meets typical validation criteria (RSD ≤2%) |
| 50.0 (High-range) | 1.2% | 1.9% | 99.8% | Demonstrates method robustness |
Workflow and Relationship Visualization
The following diagram illustrates the logical sequence and decision points in the strategy for enhancing analytical sensitivity and precision, from foundational steps to advanced optimization.
Analytical Enhancement Workflow
The Scientist's Toolkit: Essential Research Reagent Solutions
The following table details key materials and reagents required for the successful implementation of the protocols described, specifically for the analysis of metoprolol tartrate.
Table 3: Essential Research Reagents and Materials for Metoprolol Tartrate Analysis
| Item | Function / Rationale | Exemplary Specification / Type |
|---|---|---|
| Metoprolol Tartrate Reference Standard | Serves as the primary benchmark for identifying the analyte and constructing the calibration curve to ensure accuracy [53]. | Pharmacopoeial standard (USP/NF), 98-101% purity [53]. |
| Hydroxypropyl Methylcellulose (HPMC) | Used in formulation studies to create sustained-release matrix granules. Understanding its role is key for efficient extraction [58] [53]. | Viscosity grades K4M, K100M [59] [53]. |
| Chromatography Column | Stationary phase for the HPLC separation of metoprolol from impurities and other API components [41]. | C18, 100 mm × 4.6 mm, 3.5 µm [41]. |
| Sodium Phosphate Buffer (pH 3.0) | Mobile phase component that controls ionization and retention of metoprolol, critical for achieving peak symmetry and resolution [41]. | 34 mM, adjusted with phosphoric acid [41]. |
| Acetonitrile (HPLC Grade) | Organic modifier in the mobile phase for gradient elution, facilitating the elution of metoprolol and related compounds [41] [53]. | Low UV absorbance, high purity. |
Validating Your Extraction Method and Comparative Analysis of Techniques
In the development and validation of analytical methods for pharmaceutical analysis, specific parameters must be rigorously assessed to ensure the reliability, accuracy, and reproducibility of the data generated. This is particularly critical in research involving the extraction and quantification of active pharmaceutical ingredients such as metoprolol tartrate, a cardio-selective β-1 adrenergic receptor antagonist used widely in managing cardiovascular diseases [60]. The method's fitness-for-purpose is demonstrated through the validation of key parameters including specificity, linearity, accuracy, and precision [57] [61]. This application note details protocols for evaluating these parameters within the context of sample preparation and analysis of metoprolol tartrate from tablet formulations, providing a framework for researchers and drug development professionals.
Theoretical Foundations of Key Validation Parameters
Specificity
Specificity is the ability of an analytical method to assess the analyte unequivocally in the presence of components that may be expected to be present in the sample matrix, such as impurities, degradants, or excipients [57]. A specific method should yield results for the target analyte that are free from interference, thereby avoiding false positives or negatives. This is typically the first parameter tested to ensure the method is measuring the correct substance [57].
Linearity and Range
The linearity of an analytical procedure is its ability, within a given range, to obtain test results that are directly proportional to the concentration (amount) of analyte in the sample [57]. The range is the interval between the upper and lower concentrations of analyte for which the method has demonstrated suitable precision, accuracy, and linearity. A minimum of five concentration levels is recommended to establish the calibration curve, with a correlation coefficient (r) of at least 0.995 often required for acceptance [61].
Accuracy
Accuracy expresses the closeness of agreement between the value found and the value accepted as a conventional true value or an accepted reference value [57]. It is a measure of the method's trueness and is typically assessed by analyzing samples of known concentration (e.g., spiked placebo) and calculating the percent recovery against the theoretical value. ICH guidelines recommend at least nine determinations across a minimum of three concentration levels covering the specified range [61].
Precision
Precision refers to the closeness of agreement (degree of scatter) between a series of measurements obtained from multiple sampling of the same homogeneous sample under the prescribed conditions [57]. It is evaluated at three levels:
- Repeatability (intra-assay precision): Precision under the same operating conditions over a short interval of time.
- Intermediate precision: Precision within the same laboratory (different days, different analysts, different equipment).
- Reproducibility: Precision between different laboratories. Precision is usually expressed as the relative standard deviation (RSD) or coefficient of variation (CV), with values below 2% often expected for assay methods [61].
Application to Metoprolol Tartrate Research
Sample Preparation Workflow
The initial and most critical step in the analysis of metoprolol from solid dosage forms is sample preparation. The following workflow diagram outlines the key stages from tablet processing to analysis, highlighting points where validation parameters are critically assessed.
Reagent Solutions and Materials
The following table details essential reagents, materials, and instruments required for the sample preparation and analysis of metoprolol tartrate, drawing from current methodologies [60] [3] [62].
Table 1: Research Reagent Solutions and Essential Materials for Metoprolol Analysis
| Item | Function/Application | Example Specification |
|---|---|---|
| Metoprolol Tartrate Reference Standard | Accuracy assessment; calibration curve preparation | Pharmaceutical Secondary Standard (e.g., Sigma-Aldrich) |
| Phosphate Buffer Saline (PBS) pH 6 | Extraction solvent for solid-liquid extraction | 0.2 mol/L [62] |
| HPLC-grade Methanol and Acetonitrile | Mobile phase components; protein precipitation | >99.9% purity [60] [3] |
| Formic Acid | Mobile phase modifier for LC-MS | 0.1% v/v [3] |
| Trichloroacetic Acid | Protein precipitating agent for biological fluids | 25% w/v solution [3] |
| Reverse-Phase C18 Column | Stationary phase for chromatographic separation | e.g., Zorbax SB-C18, 150 x 4.6 mm, 5 µm [62] |
| Solid-Phase Extraction (SPE) Sorbent | Sample clean-up for complex matrices | Mixed-mode (e.g., Strata-X) or Phospholipid Removal (PLR) sorbents [63] |
| Polyterafluoroethylene (PTFE) Syringe Filters | Sample filtration prior to injection | 0.45 µm or 0.22 µm pore size [62] |
Experimental Protocols and Data Presentation
Protocol for Specificity Assessment
Objective: To demonstrate that the method can unequivocally quantify metoprolol tartrate without interference from tablet excipients or potential degradants.
Procedure:
- Prepare the following solutions:
- Standard Solution: A known concentration of metoprolol tartrate reference standard in diluent.
- Placebo Solution: Prepare a solution containing all excipients from the tablet formulation at concentrations representative of the final sample preparation, but without the active ingredient (metoprolol tartrate).
- Test Solution: A prepared sample of the tablet extract.
- Chromatographic Analysis:
- Inject the placebo, standard, and test solutions into the HPLC or LC-MS/MS system.
- Use a Zorbax SB-C18 column (150 x 4.6 mm, 5 µm) or equivalent.
- Employ a mobile phase consisting of methanol and 0.1% formic acid (65:35, v/v) at a flow rate of 0.6 mL/min [3].
- Monitor the chromatogram at 268 nm for UV detection or use MRM transitions (e.g., 268.1 → 116.2) for MS detection [3].
- Acceptance Criterion: The chromatogram of the placebo solution should show no peak at the retention time of metoprolol, confirming the absence of interference.
Protocol for Linearity and Range Assessment
Objective: To establish that the analytical method produces results that are directly proportional to the concentration of metoprolol tartrate over the specified range.
Procedure:
- Prepare Stock Solution: Accurately weigh and dissolve metoprolol tartrate reference standard to prepare a primary stock solution (e.g., 1000 µg/mL).
- Prepare Calibration Standards: Dilute the stock solution to prepare at least five standard solutions covering the expected range. For metoprolol in tablet assays, a range of 80-120% of the target test concentration is typical [61]. For biological samples, a wider range may be needed (e.g., 0.4-500 µg/L in plasma) [3].
- Analysis and Calculation:
- Analyze each calibration standard in triplicate.
- Plot the peak area (or height) against the corresponding concentration.
- Calculate the regression line using the least-squares method (y = mx + c).
- Determine the correlation coefficient (r), slope, and y-intercept.
Table 2: Exemplary Linearity Data for Metoprolol Tartrate by HPLC-UV
| Concentration (µg/mL) | Peak Area (mAU*s) | Mean Peak Area | Standard Deviation | RSD (%) |
|---|---|---|---|---|
| 20 | 14520, 14895, 14705 | 14706.7 | 187.6 | 1.28 |
| 40 | 29580, 30120, 29750 | 29816.7 | 275.1 | 0.92 |
| 60 | 45010, 44590, 45220 | 44940.0 | 316.2 | 0.70 |
| 80 | 59850, 60550, 60110 | 60170.0 | 350.4 | 0.58 |
| 100 | 75200, 74500, 75800 | 75166.7 | 650.0 | 0.86 |
Calculations:
- Correlation Coefficient (r): > 0.995
- Regression Line: y = 750.5x + 125.8
Acceptance Criteria: The correlation coefficient (r) should be not less than 0.995 [61]. The y-intercept should not be significantly different from zero.
Protocol for Accuracy (Recovery) Assessment
Objective: To determine the closeness of agreement between the measured value and the true value of metoprolol tartrate in the sample.
Procedure:
- Prepare Spiked Samples: Accurately weigh placebo powder equivalent to one tablet into three separate vessels. Spike with known quantities of metoprolol tartrate reference standard to cover three concentration levels (e.g., 80%, 100%, and 120% of the label claim). Prepare three replicates at each level (total of nine determinations) [61].
- Sample Preparation: Process these spiked samples according to the established sample preparation protocol (see section 3.1).
- Analysis: Analyze the prepared samples and a corresponding set of standard solutions.
- Calculation: Calculate the percent recovery for each spiked sample.
Table 3: Accuracy (Recovery) Data for Metoprolol Tartrate from Spiked Placebo
| Spike Level (%) | Theoretical Amount (mg) | Found Amount (mg) | Recovery (%) | Mean Recovery (%) |
|---|---|---|---|---|
| 80 | 80.0 | 79.5, 81.2, 80.8 | 99.4, 101.5, 101.0 | 100.6 |
| 100 | 100.0 | 99.8, 101.1, 100.5 | 99.8, 101.1, 100.5 | 100.5 |
| 120 | 120.0 | 119.0, 121.5, 120.8 | 99.2, 101.3, 100.7 | 100.4 |
Overall Mean Recovery: 100.5%
Acceptance Criteria: The mean recovery at each level should be within 98.0-102.0% [61].
Protocol for Precision (Repeatability) Assessment
Objective: To evaluate the precision of the method under the same operating conditions over a short interval of time (repeatability).
Procedure:
- Prepare Homogeneous Sample: Prepare a single, homogeneous sample of tablet extract at 100% of the test concentration.
- Replicate Analysis: Inject this same preparation six times into the chromatographic system.
- Calculation: For each injection, calculate the assayed content of metoprolol tartrate (as % of label claim). Calculate the mean, standard deviation (SD), and relative standard deviation (RSD).
Table 4: Repeatability Data for Metoprolol Tartrate Tablet Assay
| Replicate No. | Metoprolol Tartrate Found (% of Label Claim) |
|---|---|
| 1 | 99.8 |
| 2 | 101.2 |
| 3 | 100.5 |
| 4 | 99.5 |
| 5 | 100.9 |
| 6 | 100.1 |
| Mean | 100.3 |
| Standard Deviation (SD) | 0.64 |
| Relative Standard Deviation (RSD%) | 0.64 |
Acceptance Criteria: The %RSD for the six replicate measurements should typically be not more than 2.0% [61].
The rigorous application of these protocols for specificity, linearity, accuracy, and precision provides a solid foundation for validating analytical methods used in the sample preparation and analysis of metoprolol tartrate. Adherence to these parameters, guided by ICH Q2(R1) and other regulatory frameworks [61], ensures that the generated data is reliable, reproducible, and fit for its intended purpose in pharmaceutical research and development. As analytical technologies advance, the integration of automated sample preparation [64] and improved column chemistries [63] can further enhance the robustness and efficiency of these validated methods.
Determining Limits of Detection (LOD) and Quantification (LOQ)
In the development and validation of robust analytical methods for pharmaceutical analysis, determining the smallest concentrations of an analyte that can be reliably detected and quantified is a fundamental requirement. The Limit of Detection (LOD) and Limit of Quantification (LOQ) are essential performance characteristics that define the lower boundaries of an analytical method's capability [65] [66]. These parameters are particularly crucial in pharmaceutical research and development, where accurate measurement of low analyte concentrations—such as metoprolol tartrate and its metabolites in biological matrices or dissolution media—directly impacts product quality, safety, and efficacy assessments.
According to International Conference on Harmonization (ICH) guidelines, the LOD represents "the lowest amount of analyte in a sample which can be detected but not necessarily quantitated as an exact value," while the LOQ is "the lowest amount of analyte in a sample which can be quantitatively determined with suitable precision and accuracy" [67] [66]. Proper determination of these limits ensures that analytical methods are "fit for purpose" and provides scientists with clear boundaries of method capability during drug development studies [65].
Theoretical Foundations: Understanding LOD and LOQ
Fundamental Definitions and Distinctions
The LOD represents the lowest analyte concentration likely to be reliably distinguished from the analytical blank and at which detection is feasible [65]. It is the concentration that produces a signal significantly different from the blank with a defined statistical confidence, typically yielding a signal-to-noise ratio of approximately 3:1 [67] [68]. At this level, the analyte can be detected but not necessarily quantified with acceptable precision.
The LOQ is the lowest concentration at which the analyte can not only be reliably detected but also quantified with predefined goals for bias and imprecision [65]. At the LOQ, the method must demonstrate acceptable accuracy (trueness) and precision, typically yielding a signal-to-noise ratio of 10:1 [67] [69]. The LOQ may be equivalent to the LOD or at a much higher concentration, but it cannot be lower than the LOD [65].
The Concept of Limit of Blank (LoB)
Closely related to LOD and LOQ is the Limit of Blank (LoB), defined as the highest apparent analyte concentration expected to be found when replicates of a blank sample containing no analyte are tested [65]. The LoB represents the upper limit of the blank signal and is calculated as:
LoB = mean~blank~ + 1.645(SD~blank~) [65]
This calculation assumes a Gaussian distribution of the raw analytical signals from blank samples, with the LoB set at the 95th percentile of the blank distribution (one-sided) [65] [66]. Understanding the LoB is essential for properly determining the LOD, as the LOD must be distinguished from the analytical noise represented by the LoB.
Statistical Basis and Error Considerations
The determination of LOD and LOQ is fundamentally rooted in statistical concepts of error probability. Two types of statistical errors are particularly relevant:
Type I Error (False Positive): The probability of concluding that an analyte is present when it is actually absent, denoted by α [68]. This typically occurs when a blank sample produces a signal above the decision limit.
Type II Error (False Negative): The probability of failing to detect an analyte that is actually present, denoted by β [65] [68]. This occurs when a sample containing the analyte at the LOD concentration produces a signal below the decision limit.
The relationship between these parameters can be visualized in the following conceptual diagram:
Figure 1: Conceptual Relationship Between LoB, LOD, and LOQ. The LOD is distinguished from the LoB and must account for the distribution of low concentration samples to minimize false negatives [65] [68].
Methodological Approaches for Determining LOD and LOQ
The ICH Q2(R1) guideline describes several accepted approaches for determining LOD and LOQ, each with specific applications and requirements [67] [69] [66]. The table below summarizes the key characteristics of each approach:
Table 1: Comparison of Methods for Determining LOD and LOQ
| Method | Basis | Typical Applications | LOD Calculation | LOQ Calculation |
|---|---|---|---|---|
| Standard Deviation of Blank and Slope [67] [69] | Statistical analysis of blank responses and calibration curve slope | Instrumental methods without significant background noise | ( \text{LOD} = 3.3 \times \frac{\sigma}{S} ) | ( \text{LOQ} = 10 \times \frac{\sigma}{S} ) |
| Signal-to-Noise Ratio [67] [68] | Comparison of analyte signal to background noise | Chromatographic, spectroscopic methods with measurable baseline noise | S/N ≈ 3:1 | S/N ≈ 10:1 |
| Visual Evaluation [67] [66] | Direct observation of analyte response | Non-instrumental methods, qualitative tests | Lowest concentration producing detectable response | Lowest concentration producing quantifiable response |
| Standard Deviation of Response and Slope [69] [66] | Statistical analysis of calibration curve parameters | Quantitative instrumental methods with linear response | ( \text{LOD} = 3.3 \times \frac{\sigma}{S} ) | ( \text{LOQ} = 10 \times \frac{\sigma}{S} ) |
| Based on Calibration Curve [69] [70] | Regression analysis of low-concentration standards | Methods with well-characterized linear range | ( \text{LOD} = 3.3 \times \frac{\sigma}{S} ) | ( \text{LOQ} = 10 \times \frac{\sigma}{S} ) |
Standard Deviation of the Blank and Slope Method
This approach is recommended for methods that do not exhibit significant background noise [67] [66]. The standard deviation (σ) is determined from the analysis of multiple blank samples, and the slope (S) is obtained from the calibration curve of the analyte. The LOD and LOQ are then calculated using the formulas:
The factor 3.3 derives from the multiplication of 1.645 (for 95% one-sided confidence) by 2, accommodating both type I and type II errors at the 5% level [66].
Signal-to-Noise Ratio Method
This approach is specifically applicable to analytical methods that exhibit measurable background noise, such as chromatographic and spectroscopic techniques [67] [68]. The signal-to-noise ratio (S/N) is determined by comparing measured signals from samples with known low concentrations of analyte against those of blank samples.
For chromatographic methods, the European Pharmacopoeia defines the signal-to-noise ratio as:
S/N = 2H/h
where H is the height of the peak corresponding to the component concerned, and h is the range of the background noise in a chromatogram obtained after injection of a blank [68].
Standard Deviation of Response and Slope Method
This approach utilizes the calibration curve characteristics to estimate LOD and LOQ [69] [66]. The standard deviation (σ) can be estimated as the residual standard deviation of the regression line (standard error), or the standard deviation of the y-intercepts of regression lines [67]. The slope (S) is obtained from the calibration curve, and LOD/LOQ are calculated using the same formulas as in the standard deviation of the blank method.
This method is particularly useful during method validation as it leverages data typically generated for establishing the analytical measurement range.
Visual Evaluation Method
Visual evaluation may be used for non-instrumental methods or for methods where instrumental responses are not the primary detection mode [67] [66]. This approach involves the analysis of samples with known concentrations of analyte and establishing the minimum level at which the analyte can be reliably detected or quantified. For visual methods, detection limits are typically determined using logistic regression, with LOD often set at 99% detection probability [66].
Experimental Protocol: LOD and LOQ Determination for Metoprolol Tartrate Analysis
Research Context and Reagent Solutions
In the context of metoprolol tartrate extraction from tablets and subsequent analysis in biological matrices, the determination of LOD and LOQ is essential for method validation. The following table outlines key research reagents and materials required for such analyses:
Table 2: Essential Research Reagent Solutions for Metoprolol Tartrate Analysis
| Reagent/Material | Function/Purpose | Specification Considerations |
|---|---|---|
| Metoprolol Tartrate Reference Standard | Calibration curve preparation, method validation | High purity (>98%), properly characterized and stored |
| Blank Plasma/Matrix | Preparation of calibration standards, determination of blank response | Should be free of interfering substances, commutable with patient specimens [65] |
| Protein Precipitation Reagents (e.g., Acetonitrile, Methanol) | Sample clean-up, protein removal from biological samples | HPLC grade, low background signal |
| Mobile Phase Components | Chromatographic separation | HPLC grade, appropriate pH and buffer capacity |
| Extraction Solvents | Analyte extraction from tablets or biological samples | Appropriate for metoprolol solubility, minimal interfering substances |
Sample Preparation Workflow
The experimental workflow for LOD and LOQ determination in metoprolol tartrate analysis involves several critical steps:
Figure 2: Experimental Workflow for LOD/LOQ Determination. This generalized protocol applies to various analytical methods, with specific adaptations based on the technique and matrix [65] [69] [70].
Detailed Experimental Procedure
Blank Sample Preparation: Prepare a minimum of 10-20 replicates of blank samples using the appropriate matrix (e.g., mobile phase for standard solutions, processed biological matrix for bioanalytical methods) [65] [69]. For metoprolol tartrate analysis in biological matrices, use drug-free plasma or serum that has been verified to not contain interfering substances at the retention time of metoprolol.
Low Concentration Sample Preparation: Prepare samples with known low concentrations of metoprolol tartrate in the range of the expected LOD/LOQ. These can be prepared by serial dilution of a stock solution in the appropriate matrix. A minimum of 10-20 replicates is recommended [65] [69].
Sample Analysis: Process all samples through the complete analytical procedure, including extraction, cleanup, and instrumental analysis. For bioanalytical methods, this should include the protein precipitation or extraction step to account for potential matrix effects.
Data Collection: Record the analytical responses (peak areas, heights, or other relevant signals) for all blank and low concentration samples.
Statistical Analysis:
- Calculate the mean and standard deviation of the blank responses
- Calculate the mean and standard deviation of the low concentration sample responses
- Perform linear regression on calibration standards in the low concentration range to obtain the slope and standard error
LOD and LOQ Calculation: Apply the appropriate formulas based on the selected method (see Section 3). For the standard deviation and slope method commonly used in chromatographic assays:
Verification: experimentally verify the calculated LOD and LOQ by analyzing a minimum of 6 replicates at the proposed limits. The LOD should yield a signal distinguishable from the blank in approximately 95% of measurements, while the LOQ should demonstrate precision (typically ±15-20% RSD) and accuracy (85-115% of nominal concentration) [69].
Application Example: Metoprolol Tartrate Bioanalytical Method
In a study developing an RP-HPLC method for quantification of metoprolol tartrate in rabbit plasma, researchers determined the LOD and LOQ to be 5.8 ng/mL and 16.1 ng/mL, respectively [71]. The method was linear over a concentration range of 20-100 ng/mL, with the LOQ established below the lower limit of quantification to ensure reliable detection and quantitation at the beginning of the calibration curve. This sensitivity was essential for application in pharmacokinetic studies following transdermal and oral administration, where precise measurement of low plasma concentrations is required for accurate assessment of bioavailability.
Data Analysis and Interpretation
Calculation Example Using Calibration Curve Data
The following example demonstrates the calculation of LOD and LOQ using the calibration curve method, based on hypothetical data for metoprolol tartrate analysis:
Table 3: Example LOD and LOQ Calculation from Calibration Data
| Parameter | Value | Source/Calculation |
|---|---|---|
| Slope of calibration curve (S) | 1.9303 area units/(ng/mL) | Linear regression of calibration standards |
| Standard error of regression (σ) | 0.4328 area units | Regression statistics |
| LOD Calculation | 0.74 ng/mL | 3.3 × 0.4328 / 1.9303 |
| LOQ Calculation | 2.24 ng/mL | 10 × 0.4328 / 1.9303 |
| Recommended LOD (rounded) | 1.0 ng/mL | Practical value verified experimentally |
| Recommended LOQ (rounded) | 2.5-3.0 ng/mL | Practical value verified experimentally [69] |
Validation of Proposed Limits
After calculating provisional LOD and LOQ values, experimental verification is essential. This involves:
- Preparing samples at the proposed LOD and LOQ concentrations
- Analyzing a sufficient number of replicates (typically n=6-20)
- Assessing whether the performance meets acceptance criteria [69]
For the LOD, at least 95% of samples should produce detectable signals distinguishable from the blank. For the LOQ, the analysis should demonstrate precision with RSD ≤ 20% and accuracy within ±20% of the nominal concentration [65] [69].
Alternative approaches, such as visual evaluation or signal-to-noise ratio assessment, can be used to confirm that the regression-based calculations provide reasonable values [69].
Troubleshooting and Best Practices
Common Challenges and Solutions
High Background Noise: If excessive background noise adversely affects LOD/LOQ values, optimize sample cleanup procedures, use higher purity reagents, or adjust instrumental parameters to improve signal-to-noise ratio.
Inconsistent Blank Responses: When blank responses show high variability, ensure consistent matrix composition, minimize contamination sources, and increase the number of replicate measurements to improve standard deviation estimates.
Poor Reproduction at Low Concentrations: If experimental results at the calculated LOD/LOQ do not meet acceptance criteria, consider increasing the proposed limits to more practical levels or modifying the method to improve sensitivity and precision at low concentrations.
Regulatory Considerations
For pharmaceutical applications, regulatory guidelines provide specific requirements for LOD/LOQ determination:
- ICH Q2(R1) recommends the visual, signal-to-noise, or standard deviation/slope approaches [67] [66]
- The CLSI EP17 guideline provides detailed protocols for LoB, LOD, and LoQ determination, particularly for clinical methods [65]
- Regardless of the calculation method, experimental verification using samples prepared at the limits is mandatory [69]
When reporting LOD and LOQ values, clearly specify the calculation method used and provide supporting experimental data to demonstrate that the limits have been properly validated.
Within the framework of research on sample preparation for the extraction of metoprolol tartrate from tablets, the selection of an appropriate analytical technique is paramount. This choice directly influences the reliability, efficiency, and scope of the experimental data. Two predominant techniques employed for the quantitative analysis of active pharmaceutical ingredients (APIs) like metoprolol tartrate are UV Spectrophotometry and High-Performance Liquid Chromatography (HPLC). This application note provides a detailed comparative analysis of these two techniques, focusing on their fundamental principles, validation data, and specific application protocols for the analysis of metoprolol tartrate, to guide researchers and drug development professionals in their methodological selection.
While both techniques involve the measurement of light absorption, their core operational principles and capabilities differ significantly. UV Spectrophotometry is based on the Beer-Lambert law, measuring how much ultraviolet light is absorbed by a sample at a specific wavelength in a cuvette [72]. In contrast, HPLC is a separation technique where components in a mixture are partitioned between a stationary phase (column) and a mobile phase (solvent). The separated components then pass through a flow cell in a UV detector for measurement [73] [72]. This fundamental difference—analyzing a mixture as a whole versus separating it into individual components—underpins all subsequent differences in specificity, application, and regulatory acceptance.
The table below summarizes the key distinctions between the two techniques:
Table 1: Core Comparative Overview of UV Spectrophotometry and HPLC
| Parameter | UV Spectrophotometry | HPLC with UV Detection |
|---|---|---|
| Principle | Measures UV light absorption by a sample [72] | Separates compounds first, then detects via UV absorption [72] |
| Specificity | Low. Cannot distinguish compounds with similar chromophores [72] | High. Separates analyte from impurities and excipients [72] |
| Sample Complexity | Best for clear, single-component solutions [72] | Can handle complex mixtures (APIs, impurities, degradants) [72] |
| Sensitivity | Moderate (usually µg/mL level) [72] | High (UV: ng-µg/mL; MS: pg-ng/mL) [72] |
| Regulatory Acceptance | Limited for complex formulations; used when interference is absent [72] | Standard method in pharmacopeias for assays and impurities [72] |
| Time & Cost | Fast, inexpensive [72] | Longer run times, higher operational costs [72] |
Quantitative Method Validation Data
The performance of an analytical method is quantitatively assessed through validation parameters as per ICH guidelines. The following table consolidates typical validation data for both techniques, drawn from analyses of various drugs, including antidiabetics and antifungals, which demonstrates the general performance trends applicable to metoprolol tartrate analysis [74] [75] [76].
Table 2: Comparative Method Validation Parameters
| Validation Parameter | UV-Spectrophotometry | HPLC |
|---|---|---|
| Linearity Range | 5-30 μg/mL (Repaglinide) [74] | 5-50 μg/mL (Repaglinide) [74] |
| Correlation Coefficient (r²) | > 0.999 [74] [75] | > 0.999 [74] |
| Precision (% RSD) | < 1.50% [74], < 2% [75] | < 1% [74], < 1.578% (UHPLC) [76] |
| Accuracy (% Recovery) | 98.54% - 100.45% [74] [75] | 99.71% - 100.25% [74], ~98-101% [76] |
| Limit of Detection (LOD) | Higher (e.g., 1.30 μg for Terbinafine) [75] | Lower (e.g., 0.156 μg/mL for Metformin) [76] |
Experimental Protocols for Metoprolol Tartrate Analysis
Protocol A: Spectrophotometric Determination via Complexation
This protocol details a specific method for metoprolol tartrate based on complexation with copper(II) ions, adapted from the literature [8].
4.1.1 Research Reagent Solutions
- Metoprolol Tartrate Stock Solution (0.2 mg/mL): Prepared in water. Stable for one week if refrigerated.
- Copper(II) Chloride Solution (0.5% w/v): Prepared by dissolving CuCl₂·2H₂O in water.
- Britton-Robinson Buffer (pH 6.0): Used to maintain the optimal pH for complex formation.
4.1.2 Procedure
- Calibration Curve: Transfer aliquots of the stock solution containing 8.5-70 μg of metoprolol tartrate into a series of 10 mL volumetric flasks.
- Complex Formation: Add 1 mL of Britton-Robinson buffer (pH 6.0) and 1 mL of Copper(II) Chloride solution to each flask.
- Heating and Cooling: Mix well and heat for 20 minutes in a thermostatically controlled water bath at 35°C. Cool rapidly afterward.
- Dilution and Measurement: Make up to the mark with distilled water. Measure the absorbance of the resulting blue complex at 675 nm against a reagent blank.
- Sample Preparation: Powder and homogenize 10 tablets. Weigh a portion equivalent to 40 mg of metoprolol tartrate, extract with water, filter into a 100 mL volumetric flask, and dilute to volume. Subject an aliquot of this solution to the procedure above [8].
Protocol B: HPLC-UV Analysis
This protocol outlines a general reversed-phase HPLC approach suitable for metoprolol tartrate, reflecting common conditions used in pharmaceutical analysis [74] [77].
4.2.1 Research Reagent Solutions
- Mobile Phase: A mixture of methanol and a buffer (e.g., phosphate) or water. The pH may be adjusted to 3.5-3.6 with orthophosphoric acid to improve peak shape [74] [76]. A common ratio is methanol:buffer at 80:20 (v/v) [74] or 65:35 (v/v) [76].
- Metoprolol Tartrate Standard Solution: Prepared in the mobile phase or a compatible solvent like methanol-water mixture at a known concentration (e.g., 4×10⁻⁴ M) [29].
- Diluent: Often a mixture of methanol and water in a ratio similar to the mobile phase [77].
4.2.2 Procedure
- Chromatographic Conditions:
- Sample Preparation: Powder and homogenize tablets. Accurately weigh a portion equivalent to the target dose, dissolve and dilute with the diluent, and filter through a 0.45 μm membrane filter before injection.
- System Suitability: Before analysis, ensure the system meets criteria such as a tailing factor of < 2 and RSD of < 2% for peak areas of standard injections [74].
The choice between UV Spectrophotometry and HPLC for the analysis of metoprolol tartrate from tablets hinges on the specific research or quality control objectives. UV-Spectrophotometry, particularly the complexation method, offers a rapid, simple, and cost-effective solution for the routine analysis of formulations where specificity is not a primary concern. However, for methods requiring high specificity, sensitivity, and the ability to separate the API from impurities or degradants—crucial for stability studies, impurity profiling, and regulatory submissions—HPLC is the unequivocally superior and accepted technique. This comparative analysis provides the necessary data and protocols to make an informed, context-driven decision.
Content uniformity and assay testing are two fundamental pillars in the quality assessment of pharmaceutical dosage forms, ensuring that every unit of medication delivered to a patient is consistent in its active pharmaceutical ingredient (API) content. The assay value reflects the mean active content in a production batch, while content uniformity demonstrates the distribution of the active content within that batch, confirming that individual dosage units do not significantly deviate from the label claim [78]. For a drug substance like metoprolol tartrate, a beta-blocker used to treat hypertension and angina, these tests are critical to guarantee therapeutic efficacy and patient safety [16]. This document details the application of these analytical procedures within the broader context of research on sample preparation for metoprolol tartrate extraction from tablets, providing researchers and drug development professionals with detailed protocols and regulatory context.
Regulatory Framework and Key Concepts
Pharmacopeial standards, such as the European Pharmacopoeia (Ph. Eur.) and the United States Pharmacopeia (USP), provide the framework for these tests, with ongoing harmonization efforts between them [78]. The current content uniformity criterion is holistic, reflecting both the extent of content fluctuation across a batch and the deviation of the sample mean from the label claim, thereby directly respecting patient compliance and safety [78].
The relationship between assay and content uniformity (CU) is summarized in the table below.
Table 1: Key Definitions and Requirements for Assay and Content Uniformity
| Parameter | Definition | Typical Requirement | Primary Objective |
|---|---|---|---|
| Assay | Measures the mean active content of a batch relative to the label claim [78]. | Typically ±5% of label claim in Europe; ±10% in the US [78]. | To confirm the batch's overall potency is correct. |
| Content Uniformity (CU) | Measures the distribution of API across individual dosage units within a batch [78]. | Demonstrates that individual unit contents fall within a specified range around the label claim (e.g., ±15%) [78]. | To ensure consistency and dose reliability from one tablet to the next. |
For metoprolol tartrate, a synthetic drug substance comprising a racemic mixture, these quality controls are paramount. The analytical procedures for its tablet dosage form involve multiple identification methods, including UV and IR spectroscopy for the metoprolol moiety and Thin-Layer Chromatography (TLC) for the tartrate ion [16].
Experimental Protocols
Sample Preparation for Metoprolol Tartrate Extraction
The following protocol details the sample preparation for the identification of metoprolol in finished tablets, which serves as a foundational step for both content uniformity and assay analysis [16].
Table 2: Protocol for Metoprolol Tartrate Sample Preparation from Tablets
| Step | Procedure Description | Critical Parameters |
|---|---|---|
| 1. Grinding | Finely grind a representative sample of tablets. | Ensures a homogeneous powder for representative sub-sampling. |
| 2. Dissolution | Dissolve approximately 136 mg of the powdered sample in 25 mL of water with 4 mL of ammonium hydroxide (1:3) [16]. | Ammonium hydroxide helps create the conditions for efficient extraction of the free base. |
| 3. Extraction | Extract the aqueous solution with chloroform [16]. | Chloroform isolates the organic-soluble metoprolol from excipients. |
| 4. Drying | Dry the organic (chloroform) layer over anhydrous sodium sulfate [16]. | Removes trace water that could interfere with subsequent steps. |
| 5. Evaporation | Evaporate the chloroform extract [16]. | Concentrates the analyte. |
| 6. Crystallization | Place the residue in a freezer to congeal crystals [16]. | Purifies the metoprolol for identification. |
| 7. Pellet Preparation | Triturate the formed crystals with potassium bromide (KBr) and prepare a pellet [16]. | Prepares the sample for IR spectroscopy analysis. |
Content Uniformity Testing Procedure
Content uniformity testing requires the individual analysis of a specified number of dosage units. The general procedure, adaptable for metoprolol tartrate tablets, is outlined below.
Diagram 1: Content uniformity testing workflow.
Assay Testing Procedure
The assay test determines the average potency of the batch by analyzing a composite sample.
Diagram 2: Assay testing workflow.
The Scientist's Toolkit: Essential Reagent Solutions
Table 3: Key Research Reagent Solutions for Metoprolol Analysis
| Reagent/Material | Function/Application | Example Use in Protocol |
|---|---|---|
| Chloroform | Organic solvent for liquid-liquid extraction [16]. | Extraction of metoprolol from the aqueous ammonium hydroxide solution [16]. |
| Ammonium Hydroxide | Base used to adjust pH and convert salts to free bases for extraction [16]. | Added to the dissolved tablet powder to facilitate metoprolol extraction into chloroform [16]. |
| Anhydrous Sodium Sulfate | Drying agent for organic extracts [16]. | Used to remove residual water from the chloroform extract before evaporation [16]. |
| Potassium Bromide (KBr) | Matrix for Infrared (IR) spectroscopy [16]. | Triturated with purified metoprolol crystals to create a pellet for IR spectrum identification [16]. |
| HPLC/UPLC Systems | Primary tool for quantitative analysis of assay and content uniformity [16]. | Used for the precise separation and quantification of metoprolol tartrate. |
| Mobile Phase Buffers | Aqueous component of the HPLC eluent system. | Critical for achieving proper separation, often involving buffers like phosphate or acetate. |
Analytical Techniques and Advanced Methods
A variety of analytical techniques are employed for the identification and quantification of metoprolol tartrate, each with specific applications as detailed below.
Table 4: Analytical Techniques for Metoprolol Tartrate in Dosage Forms
| Technique | Application | Specifics for Metoprolol Tartrate |
|---|---|---|
| UV Spectroscopy | Identification and Quantification | Used for the identification of the metoprolol moiety in tablet forms [16]. |
| IR Spectroscopy | Identification | The IR spectrum of extracted crystals is compared to a standard for identity confirmation [16]. |
| Thin-Layer Chromatography (TLC) | Identification | Used for the identification of the tartrate ion; samples and standards are spotted on a plate, developed, and visualized [16]. |
| High-Performance Liquid Chromatography (HPLC) | Quantification (Assay/CU) | The primary method for quantification, often using retention time for identification and peak area for concentration [16]. |
| Capillary Electrophoresis (CE) | Separation and Quantification | A developed method allows for separation and estimation of metoprolol tartrate with electrochemiluminescence detection, useful for complex matrices like human urine [16]. |
Ensuring Regulatory Compliance in Analytical Methodologies
Regulatory compliance in analytical methodologies is paramount in pharmaceutical development, ensuring that drug products like metoprolol tartrate meet stringent standards for identity, strength, quality, and purity. This document outlines compliant application notes and protocols for sample preparation and analysis of metoprolol tartrate from tablet formulations, framed within a broader thesis on advanced sample preparation techniques. Adherence to established guidelines such as ICH Q2(R1) provides the foundation for method validation, encompassing specificity, accuracy, precision, and robustness. The protocols described herein are designed for researchers, scientists, and drug development professionals requiring reliable, reproducible methods that satisfy global regulatory standards for beta-blocker analysis.
Analytical Techniques for Metoprolol Determination
The quantitative determination of metoprolol in pharmaceutical formulations and biological matrices employs various chromatographic techniques. Liquid Chromatography (LC) coupled with different detectors is particularly prominent due to its sensitivity and specificity.
Table 1: Analytical Techniques for Metoprolol Quantification
| Analytical Technique | Detector | Sample Matrix | Key Performance Metrics | Regulatory Consideration |
|---|---|---|---|---|
| LC-MS/MS [3] | Triple Quadrupole Mass Spectrometer | Plasma, Urine, Exhaled Breath Condensate (EBC) | LOD: 0.12-0.21 µg·L⁻¹, LOQ: 0.40-0.70 µg·L⁻¹, Linear Range: 0.4-10,000 µg·L⁻¹ | Demonstrates specificity, sensitivity, and dynamic range per ICH guidelines. |
| HPLC [79] | Diode Array Detector (DAD) | Blood | Not Specified | Method optimization using chemometrics ensures robustness. |
| LC-MS [3] | Mass Spectrometer | Biological Samples | Not Specified | Requires rigorous system suitability testing. |
The selection of an appropriate analytical technique is guided by the required sensitivity, the complexity of the sample matrix, and the intended purpose of the analysis, whether for therapeutic drug monitoring or formulation quality control.
Sample Preparation Protocols
Effective sample preparation is critical for removing interfering substances and pre-concentrating the analyte to ensure accurate and reliable results.
Protocol 1: Dispersive Liquid-Liquid Microextraction (DLLME) for Blood Samples
This protocol, adapted from Raoufi et al., is suitable for extracting metoprolol from blood samples prior to HPLC-DAD analysis [79].
- Materials: Illicium verum extract, 1-butyl-3-methylimidazolium hexafluorophosphate ([BMIM]PF₆) as extraction solvent, methanol as disperser solvent, blood sample.
- Procedure:
- Transfer a 5.0 mL blood sample into a 10 mL conical centrifuge tube.
- Add 1.0 mg of Illicium verum extract to the sample.
- Rapidly inject a mixture of 1.0 mL of methanol (disperser solvent) containing 150 µL of [BMIM]PF₆ (extraction solvent) into the sample tube using a syringe.
- Gently shake the mixture to form a cloudy solution, facilitating the transfer of the analyte to the fine droplets of the extraction solvent.
- Centrifuge the mixture at 5000 rpm for 5 minutes to sediment the extraction solvent phase.
- Carefully remove the sedimented extraction solvent phase using a micro-syringe.
- Transfer the extracted phase into an autosampler vial for HPLC-DAD analysis.
- Compliance Notes: The use of chemometrics (e.g., Central Composite Design) for method optimization should be documented to demonstrate a systematic approach, enhancing method robustness as per Q2(R1).
Protocol 2: Protein Precipitation for Plasma Samples
This protocol is used for sample clean-up prior to LC-MS/MS analysis, as described in the cross-sectional study on metoprolol concentrations [3].
- Materials: Metoprolol standard, methanol, trichloroacetic acid (25% w/v), analyte-free plasma.
- Procedure:
- Pipette 0.4 mL of plasma (blank, spiked, or patient sample) into a microcentrifuge tube.
- Add 0.225 mL of methanol and 0.2 mL of trichloroacetic acid solution (25% w/v).
- Sonicate the mixture for 2 minutes to ensure thorough mixing and protein denaturation.
- Centrifuge the mixture at 13,000 rpm for 10 minutes to pellet the precipitated proteins.
- Carefully collect the clear supernatant phase.
- Inject the supernatant directly into the LC-MS/MS system.
- Compliance Notes: Accuracy and precision (intra-day and inter-day) must be validated. The cited method reported Relative Standard Deviations (RSD) for intra-day and inter-day precision between 3.3–6.1%, meeting typical regulatory requirements for bioanalytical method validation [3].
Protocol 3: Direct Analysis of Exhaled Breath Condensate (EBC)
EBC offers a non-invasive alternative with a simpler matrix [3].
- Materials: EBC collection device, metoprolol standard.
- Procedure:
- Collect EBC from patients using a cooled collection device after mouth washing with distilled water.
- Transfer the EBC sample directly to an autosampler vial.
- Inject the sample directly into the LC-MS/MS system without any pre-treatment.
- Compliance Notes: The lack of extensive sample preparation simplifies the validation process for specificity, as the matrix is less complex. However, the very low analyte concentration requires a highly sensitive detection system like MS/MS.
Advanced Purification: Deep Eutectic Solvent-Based Aqueous Two-Phase System
For the purification of active pharmaceutical ingredients like metoprolol tartrate from complex mixtures, Advanced Aqueous Two-Phase Systems (ATPS) offer an environmentally friendly alternative.
Workflow for DES-ATPS
The following diagram illustrates the logical workflow for employing a Deep Eutectic Solvent-based ATPS for drug partitioning.
Diagram 1: DES-ATPS Workflow.
Protocol: DES-ATPS for Metoprolol Tartrate Partitioning
This protocol is based on the study by Ahmadi Abkenar et al. [47].
- Synthesis of Deep Eutectic Solvent (DES):
- Weigh Tetra-n-butylammonium bromide (TBAB) as the Hydrogen Bond Acceptor (HBA) and Polyethylene Glycol 200 (PEG200) as the Hydrogen Bond Donor (HBD) in a 1:3 molar ratio.
- Mix the components in a sealed container at 60°C with continuous stirring until a homogeneous, clear liquid is formed.
- Confirm the stability and structure of the DES using characterization techniques like Raman spectroscopy.
- Partitioning Experiment:
- Prepare an aqueous two-phase system by mixing the synthesized DES with dipotassium hydrogen phosphate (K₂HPO₄) and water at a predetermined operating point from the phase diagram.
- Add an aqueous solution of metoprolol tartrate (e.g., 0.1-0.15 wt%) to the system.
- Vigorously agitate the mixture to ensure proper mixing, then allow it to settle or centrifuge to accelerate phase separation.
- Carefully separate the top and bottom phases.
- Quantify the concentration of metoprolol tartrate in each phase using a validated analytical method (e.g., HPLC-UV).
- Calculate the partition coefficient (K) as the ratio of the drug concentration in the DES-rich phase to its concentration in the salt-rich phase.
- Key Findings and Compliance Notes: The study reported high extraction yields (85–95%) for metoprolol. It was found that the partition coefficient increased with DES concentration and decreased with higher salt levels [47]. The use of thermodynamic models (e.g., NRTL) to correlate and predict phase equilibrium data supports the understanding and control of the process, which is favorable from a regulatory perspective. Documenting the impact of process variables (DES/salt concentration) is essential for defining the operational design space in a quality-by-design (QbD) framework.
The Scientist's Toolkit: Essential Research Reagents & Materials
Table 2: Key Research Reagent Solutions for Metoprolol Analysis
| Reagent/Material | Function/Application | Example & Specification |
|---|---|---|
| Deep Eutectic Solvent (DES) [47] | Eco-friendly solvent for ATPS; enables selective partitioning of metoprolol. | TBAB:PEG200 (1:3 Molar Ratio). Must be synthesized and characterized (e.g., via Raman spectroscopy) for consistency. |
| Ionic Liquids [79] | Extraction solvent in microextraction techniques; replaces volatile organic solvents. | 1-butyl-3-methylimidazolium hexafluorophosphate ([BMIM]PF₆). Purity >95%. |
| Chromatography Columns [3] | Stationary phase for analytical separation. | Zorbax RR Eclipse C18 (100 mm × 4.6 mm, 3.5 µm). Provides efficient separation of metoprolol. |
| Mass Spectrometry Reagents [3] | Mobile phase components for LC-MS/MS. | HPLC-grade Methanol & 0.1% v/v Formic Acid (65:35 ratio). Ensures optimal ionization and separation. |
| Protein Precipitants [3] | Agent for deproteinizing plasma/serum samples. | Trichloroacetic Acid (25% w/v). Effectively precipitates proteins, clarifying the sample. |
Method Validation & Regulatory Considerations
To ensure regulatory compliance, the developed analytical methods must undergo a comprehensive validation process as per ICH Q2(R1) and other applicable guidelines.
Table 3: Key Validation Parameters and Target Criteria
| Validation Parameter | Objective | Exemplary Target from Literature |
|---|---|---|
| Linearity & Range | Demonstrate proportional response to analyte concentration. | Coefficient of determination (R²) ≥ 0.994 [3]. |
| Limit of Detection (LOD) & Quantification (LOQ) | Establish the lowest detectable and quantifiable levels. | LOD: 0.12 µg·L⁻¹ (Plasma); LOQ: 0.40 µg·L⁻¹ (Plasma) [3]. |
| Accuracy | Measure closeness of results to the true value. | Recovery rates close to 100% (e.g., 96-104% in DLLME [79]). |
| Precision | Measure the degree of repeatability (intra-day) and intermediate precision (inter-day). | RSD ≤ 6.1% for intra-day and ≤ 4.6% for inter-day [3]. |
| Specificity | Ability to assess analyte unequivocally in the presence of other components. | No interference from tablet excipients or biological matrix observed [3]. |
The application of advanced sample preparation techniques, such as DES-ATPS and DLLME, must be thoroughly validated. Furthermore, all procedures must be documented in detail within Standard Operating Procedures (SOPs), and equipment must be maintained under a strict calibration and qualification program to ensure data integrity and regulatory compliance throughout the drug development lifecycle.
Conclusion
Effective sample preparation is the cornerstone of accurate metoprolol tartrate analysis, directly impacting the reliability of quality control and research data. This guide synthesizes key takeaways from foundational principles to advanced validation, demonstrating that a well-designed extraction protocol, whether via simple solvent extraction, complexation for spectrophotometry, or preparation for HPLC, must be robust, optimized, and fully validated. Future directions should focus on developing greener analytical methods, automating extraction processes, and adapting these techniques for novel tablet formulations and combination drugs, thereby continuing to advance pharmaceutical analysis and drug development.
References
- 1. Label: METOPROLOL TARTRATE tablet - DailyMed [https://dailymed.nlm.nih.gov/dailymed/drugInfo.cfm?setid=96ee7ca8-3498-4337-965d-94078664d03b]
- 2. Metoprolol - StatPearls - NCBI Bookshelf [https://www.ncbi.nlm.nih.gov/books/NBK532923/]
- 3. A cross-sectional study on metoprolol concentrations in ... [https://bmcpharmacoltoxicol.biomedcentral.com/articles/10.1186/s40360-024-00773-3]
- 4. Metoprolol Tartrate - an overview [https://www.sciencedirect.com/topics/pharmacology-toxicology-and-pharmaceutical-science/metoprolol-tartrate]
- 5. Metoprolol tartrate | 56392-17-7 [https://www.chemicalbook.com/ChemicalProductProperty_EN_CB7436617.htm]
- 6. Solid Phase Extraction Guide [https://www.thermofisher.com/us/en/home/industrial/chromatography/chromatography-sample-preparation/sample-preparation-consumables/solid-phase-extraction-consumables/spe-guide.html]
- 7. Understanding and Improving Solid-Phase Extraction [https://www.chromatographyonline.com/view/understanding-and-improving-solid-phase-extraction-1]
- 8. Spectrophotometric Determination of Metoprolol Tartrate in ... [https://pmc.ncbi.nlm.nih.gov/articles/PMC4058672/]
- 9. What Are Excipients? 9 Common Examples [https://www.colorcon.com/education-insights/what-are-examples-of-excipients]
- 10. Overcoming Analytical Challenges in High Potency ... [https://www.pharmtech.com/view/overcoming-analytical-challenges-in-high-potency-formulation]
- 11. a critical assessment on orphan excipients, matrix effects ... [https://www.sciencedirect.com/science/article/pii/S2095177919307749]
- 12. Effect of Excipients on the Quality of Drug Formulation and ... [https://pmc.ncbi.nlm.nih.gov/articles/PMC10146418/]
- 13. Metoprolol Tartrate 25mg tablets [https://www.medicines.org.uk/emc/product/12971/smpc]
- 14. Excipients at AAPS 2025: Comprehensive Overview of ... [https://www.pharmaexcipients.com/news/excipients-aaps-2025/]
- 15. Methods of Thermal Analysis as Fast and Reliable Tools ... [https://pmc.ncbi.nlm.nih.gov/articles/PMC12473009/]
- 16. Metoprolol Tartrate - an overview [https://www.sciencedirect.com/topics/chemistry/metoprolol-tartrate]
- 17. A cross-sectional study on metoprolol concentrations in ... [https://pmc.ncbi.nlm.nih.gov/articles/PMC11311911/]
- 18. Analytical Method for the Simultaneous Estimation of ... [https://pmc.ncbi.nlm.nih.gov/articles/PMC3267308/]
- 19. Analytical Method Validation: Back to Basics, Part II [https://www.chromatographyonline.com/view/analytical-method-validation-back-basics-part-ii]
- 20. Discriminative Dissolution Method Using the Open-Loop ... [https://pmc.ncbi.nlm.nih.gov/articles/PMC10537472/]
- 21. Methods to Compare Dissolution Profiles and a Rationale ... [https://www.sciencedirect.com/science/article/pii/S0022354915503274]
- 22. Solvent Extraction Techniques [https://www.organomation.com/solvent-extraction-techniques]
- 23. Practical Aspects of Solvent Extraction [https://www.chromatographyonline.com/view/practical-aspects-solvent-extraction-1]
- 24. Solvent Extraction - an overview [https://www.sciencedirect.com/topics/chemical-engineering/solvent-extraction]
- 25. Solvent Optimization — COSMO-RS 2025.1 documentation [https://www.scm.com/doc/COSMO-RS/Solvent_Optimization.html]
- 26. Comparison of Extraction Techniques for the Determination ... [https://pmc.ncbi.nlm.nih.gov/articles/PMC9099673/]
- 27. Spectrophotometric Determination of Metoprolol Tartrate in ... [https://www.mdpi.com/1424-8247/4/7/964]
- 28. Spectrophotometric Determination of Metoprolol Tartrate in ... [https://www.academia.edu/105650020/Spectrophotometric_Determination_of_Metoprolol_Tartrate_in_Pharmaceutical_Dosage_Forms_on_Complex_Formation_with_Cu_II_]
- 29. AAS and spectrophotometric methods for the determination ... [https://www.sciencedirect.com/science/article/pii/S1386142599001213]
- 30. Development and validation of a RP-HPLC method for ... [https://www.nature.com/articles/s41598-025-09904-0]
- 31. HPLC Method Development and Validation for ... [https://www.pharmtech.com/view/hplc-method-development-and-validation-pharmaceutical-analysis]
- 32. DoE-Aided Optimization of RP-HPLC Method for ... [https://link.springer.com/article/10.1007/s10337-024-04346-8]
- 33. RP-HPLC Method for Simultaneous Estimation of ... [https://pmc.ncbi.nlm.nih.gov/articles/PMC3224417/]
- 34. RP-HPLC Method Development and Validation for ... [https://pmc.ncbi.nlm.nih.gov/articles/PMC5603858/]
- 35. CAS 98418-47-4 Metoprolol succinate [https://www.bocsci.com/metoprolol-succinate-cas-98418-47-4-item-80410.html?srsltid=AfmBOooa4-Nn_zxisGm2FTY7zjDSBTSbc5QPyyEU8bKqscVF0NNNl8Jt]
- 36. Development and formulation of metoprolol succinate ... [https://www.slideshare.net/slideshow/development-and-formulation-of-metoprolol-succinate-extended-release-tablets-for-oral-use/12045168]
- 37. Sample Preparation of Drug Substances and Products in ... [https://www.chromatographyonline.com/view/sample-preparation-of-drug-substances-and-products-in-regulated-testing-a-primer]
- 38. Sample preparation techniques in chromatography [https://www.thermofisher.com/us/en/home/industrial/chromatography/chromatography-learning-center/chromatography-consumables/sample-prep.html]
- 39. Developing and Validating Dissolution Procedures [https://www.chromatographyonline.com/view/developing-and-validating-dissolution-procedures-0]
- 40. Concepts for a New Rapid and Simple HPLC Method ... [https://www.mdpi.com/2218-0532/90/4/65]
- 41. A case study of metoprolol tartrate and hydrochlorothiazide ... [https://www.sciencedirect.com/science/article/pii/S2095177918303289]
- 42. Development and validation of a RP-HPLC method for ... [https://pubmed.ncbi.nlm.nih.gov/39787726/]
- 43. Investigation of Metoprolol Concentrations in Plasma Using ... [https://www.mdpi.com/2297-8739/11/11/306]
- 44. Evaluation of in vitro dissolution profiles of modified ... [https://www.sciencedirect.com/science/article/pii/S0928098724000058]
- 45. An eco-friendly bioanalytical RP-HPLC method coupled ... [https://pmc.ncbi.nlm.nih.gov/articles/PMC12102954/]
- 46. Microextraction-Based Techniques for the Determination of ... [https://www.mdpi.com/2297-8739/12/1/14]
- 47. Partitioning of metoprolol tartrate and mebeverine drugs ... [https://www.sciencedirect.com/science/article/abs/pii/S0167732225014710]
- 48. Development of a sustained-release microcapsule for ... [https://pmc.ncbi.nlm.nih.gov/articles/PMC5443309/]
- 49. Effects of various factors of ultrasonic treatment on the ... [https://www.sciencedirect.com/science/article/pii/S135041771500067X]
- 50. Optimization of critical parameters for coating of polymeric ... [https://pmc.ncbi.nlm.nih.gov/articles/PMC8671476/]
- 51. Effect of sonication conditions: Solvent, time, temperature ... [https://www.sciencedirect.com/science/article/pii/S1350417713002411]
- 52. Identification, synthesis, isolation and characterization of ... [https://www.sciencedirect.com/science/article/abs/pii/S0731708515301357]
- 53. Development of Sustained Release Capsules Containing ... [https://pmc.ncbi.nlm.nih.gov/articles/PMC2974111/]
- 54. Does filter -aided sample provide sufficient method... preparation [https://pubmed.ncbi.nlm.nih.gov/36507396/]
- 55. 3 Ways to Clean Glass Solvent Filters - Hawach [https://www.vacuumfiltrations.com/three-ways-to-clean-glass-solvent-filters/]
- 56. Analytical Sensitivity, Functional Sensitivity [https://www.dpcweb.com/documents/news&views/spring01/performancemeasures.html]
- 57. The 6 Key Aspects of Analytical Method Validation [https://www.elementlabsolutions.com/uk/chromatography-blog/post/6-key-aspects-of-analytical-method-validation]
- 58. Design and Optimization of Bilayer Floating Gastroretentive ... [https://indjst.org/articles/design-and-optimization-of-bilayer-floating-gastroretentive-tablets-of-metoprolol]
- 59. Optimization of bilayer floating tablet containing metoprolol ... [https://pmc.ncbi.nlm.nih.gov/articles/PMC2750284/]
- 60. Development of a RP-HPLC method for simultaneous ... [https://www.sciencedirect.com/science/article/abs/pii/S1570023224001685]
- 61. Key ICH Method Validation Parameters to Know [https://altabrisagroup.com/ich-method-validation-parameters/]
- 62. Versatile High-Performance Liquid Chromatography and ... [https://pmc.ncbi.nlm.nih.gov/articles/PMC12348203/]
- 63. LC Column and Sample Preparation Considerations [https://myadlm.org/cln/cln-industry-insights/2025/lc-column-and-sample-preparation-considerations]
- 64. Chromatography 2025: Sample Preparation Goes Automated [https://www.sepscience.com/chromatography-2025-sample-preparation-goes-automated-11259]
- 65. Limit of Blank, Limit of Detection and Limit of Quantitation [https://pmc.ncbi.nlm.nih.gov/articles/PMC2556583/]
- 66. Method Validation Essentials, Limit of Blank ... [https://www.biopharminternational.com/view/method-validation-essentials-limit-blank-limit-detection-and-limit-quantitation]
- 67. What is meant by the limit of detection and quantification (LOD ... [https://mpl.loesungsfabrik.de/en/english-blog/method-validation/limit-of-detection-quantifcation]
- 68. The Limit of Detection [https://www.chromatographyonline.com/view/limit-detection]
- 69. Determining LOD and LOQ Based on the Calibration Curve [https://www.sepscience.com/hplc-solutions-126-chromatographic-measurements-part-5-determining-lod-and-loq-based-on-the-calibration-curve-6959]
- 70. A tutorial for computing limits of detection and ... [https://www.sciencedirect.com/science/article/abs/pii/S0003267021011685]
- 71. APPLICATION IN PHARMACOKINETIC STUDIES [https://jddtonline.info/index.php/jddt/article/view/1118?articlesBySameAuthorPage=2]
- 72. UV Spectrophotometry vs HPLC: Key Differences [https://www.linkedin.com/posts/satish-s-mane_uv-spectrophotometry-vs-hplc-1-principle-activity-7374455512681086976-wOHu]
- 73. difference between UV-spectrophotometer and HPLC- ... [http://www.chromforum.org/viewtopic.php?t=10576]
- 74. Comparison of UV spectrophotometry and high ... [https://pmc.ncbi.nlm.nih.gov/articles/PMC3658086/]
- 75. Development and validation of the UV-spectrophotometric ... [https://pmc.ncbi.nlm.nih.gov/articles/PMC3658052/]
- 76. Comparative performance of liquid chromatography and ... [https://www.sciencedirect.com/science/article/pii/S2405844024085827]
- 77. Development and Validation of an HPLC Method ... [https://pmc.ncbi.nlm.nih.gov/articles/PMC6431496/]
- 78. Content uniformity and assay requirements in current ... [https://www.sciencedirect.com/science/article/abs/pii/S0021967306020425]
- 79. Journal of Chromatography B [https://www.sciencedirect.com/science/article/abs/pii/S1570023219311043]