Optimizing Injection Volume and Sample Preparation for UFLC-DAD: A Strategic Guide for Robust Pharmaceutical and Bioanalytical Methods
This article provides a comprehensive guide for researchers and drug development professionals on optimizing Ultra-Fast Liquid Chromatography with Diode Array Detection (UFLC-DAD) methods.
Optimizing Injection Volume and Sample Preparation for UFLC-DAD: A Strategic Guide for Robust Pharmaceutical and Bioanalytical Methods
Abstract
This article provides a comprehensive guide for researchers and drug development professionals on optimizing Ultra-Fast Liquid Chromatography with Diode Array Detection (UFLC-DAD) methods. It systematically addresses the critical interplay between injection volume and sample preparation to enhance sensitivity, resolution, and reproducibility. The content spans foundational principles, advanced methodological applications, troubleshooting of complex matrices, and rigorous validation protocols. By integrating modern Quality by Design (QbD) approaches and Design of Experiments (DoE), this guide delivers practical strategies for developing robust, efficient, and regulatory-compliant UFLC-DAD methods suitable for pharmaceutical analysis and complex biological samples.
Core Principles of UFLC-DAD: Mastering Injection Volume and Sample Preparation Fundamentals
The Critical Link Between Injection Volume, Band Broadening, and Chromatographic Performance
FAQs: Troubleshooting Injection Volume and Band Broadening
Q1: What are the specific symptoms that indicate my injection volume is too large?
- In Gas Chromatography (GC): You may observe peak distortion, split peaks, and poor reproducibility.
- In Liquid Chromatography (LC): Look for broader peaks, a loss of resolution between closely eluting compounds, and reduced peak height.
Q2: Why does injecting a volume that is too small cause problems in GC split mode?
Injecting a volume that produces a vapor cloud significantly smaller than the liner's volume leads to poorer reproducibility (higher %RSD) and reduced sample transfer to the column. This effect is most pronounced for early-eluting, volatile compounds [1].
Q3: How does the choice of injection solvent affect my chromatogram in reversed-phase LC?
The solvent used to dissolve your sample can profoundly impact peak shape.
- Strong Injection Solvent (e.g., high organic content relative to the mobile phase): Can cause peak fronting, distortion, and earlier retention times as it sweeps the analyte through the column too quickly [2].
- Weak Injection Solvent (e.g., high water content): Can lead to on-column focusing, resulting in sharper, taller peaks. Ideally, the injection solvent should match the mobile phase composition or be slightly weaker [2].
Q4: What is "band broadening in time" in splitless GC injection?
This is a fundamental broadening mechanism in splitless mode. Because the carrier gas flow through the inlet is slow, it takes a finite time (e.g., 30-60 seconds) to transfer the entire vaporized sample from the liner to the column. The resulting peak entering the column has a width in time roughly equivalent to this "purge off" period [3].
GC Injection Volume and Liner Volume
The table below summarizes the effects of mismatching injection volume and liner volume in gas chromatography, based on experimental data using hexane injections [1].
| Injection Volume (Hexane) | Solvent Vapor Cloud Volume | Impact on Performance (vs. Optimal) |
|---|---|---|
| 0.2 µL | 39 µL | - 5x increase in %RSD (poor reproducibility)- 33% decrease in response for C10 |
| 1.0 µL | 196 µL | - 40% increase in %RSD- 26% less material on-column |
| 4.0 µL | 783 µL | - Peak discrimination & carryover- Poor reproducibility for high MW compounds (>C32) |
Conclusion: For optimal performance in split mode, the solvent vapor cloud should closely match the liner's effective volume. Underfilling the liner is detrimental, particularly for volatile analytes [1].
LC Injection Volume and Solvent Strength
The following table outlines guidelines for managing injection volume and solvent strength in liquid chromatography to minimize band broadening.
| Parameter | Recommendation | Consequence of Deviation |
|---|---|---|
| Max Injection Volume (General) | < 15% of the first peak's volume for <1% resolution loss [2]. | Broadened peaks, loss of resolution. |
| Injection Solvent Strength | Should be equal to or weaker than the mobile phase. | Strong solvent: Peak fronting, distortion, variable retention times.Weak solvent: On-column focusing, sharper peaks. |
| Large Volume Injection (LVI) Strategy | Use a weak solvent for on-column focusing to concentrate the analyte band at the head of the column [2]. | Enables injection of large volumes from dilute samples without significant band broadening. |
Experimental Protocols
Protocol: Determining Maximum Injection Volume for an LC Method
This protocol helps you establish the largest allowable injection volume for your LC method without unacceptable loss of resolution.
Estimate Peak Volume: Inject a standard at a low volume (e.g., 1-5 µL) where broadening is negligible.
- Calculate the peak volume (Vp) using the formula: Vp = w × F, where
wis the baseline peak width (in minutes) andFis the flow rate (in mL/min). - Alternatively, estimate the baseline width: ( w \approx 1.7 \times w{1/2} ), where ( w{1/2} ) is the peak width at half-height [2].
- Calculate the peak volume (Vp) using the formula: Vp = w × F, where
Calculate Maximum Volume: Multiply the peak volume by 0.15 to find the recommended maximum injection volume for less than 1% resolution loss [2].
- ( V{inj(max)} = Vp \times 0.15 )
Empirical Verification: Inject your sample at the calculated ( V_{inj(max)} ) and compare the peak width and resolution to a very small injection. If performance is acceptable, the volume can be used.
Protocol: Optimizing Purge-Off Time for Splitless GC Injection
The "purge-off" time in splitless injection must be set long enough to ensure complete sample transfer from the liner to the column.
Set Initial Conditions: Establish a preliminary method with a constant column oven temperature (isothermal) for the first part of the run.
Run a Series of Injections: Inject your standard using a range of "purge-off" times (e.g., 30, 45, 60, 75, 90 seconds).
Plot and Analyze Results: Plot the peak area of one or several key analytes against the "purge-off" time.
Determine Optimal Time: Identify the point where the peak area reaches a maximum and forms a plateau. Set your final "purge-off" time securely on this plateau, not at the minimum time where the maximum is first reached, to ensure robustness against minor variations [3].
Essential Research Reagent Solutions
The table below lists key materials and tools critical for experiments focused on injection volume optimization.
| Item | Function/Explanation |
|---|---|
| Precision GC Liners (e.g., 4 mm) | Liners with defined internal volume are crucial for reproducible vaporization. The volume must be matched to the injected solvent's vapor cloud [1]. |
| UFLC-MS Grade Solvents | High-purity solvents (water, acetonitrile, methanol, formic acid) are essential for LC-MS to minimize background noise and avoid contaminating the system and column [4] [5]. |
| C18 Reversed-Phase Columns | The workhorse column chemistry for UFLC-DAD research. Available in various dimensions (length, internal diameter, particle size) which directly influence peak volume and optimal injection volume [2]. |
| Solvent Expansion Calculator | Online tools (e.g., from Restek) allow calculation of solvent vapor volume in a GC inlet at defined temperature and pressure, which is fundamental for selecting the correct liner [1] [3]. |
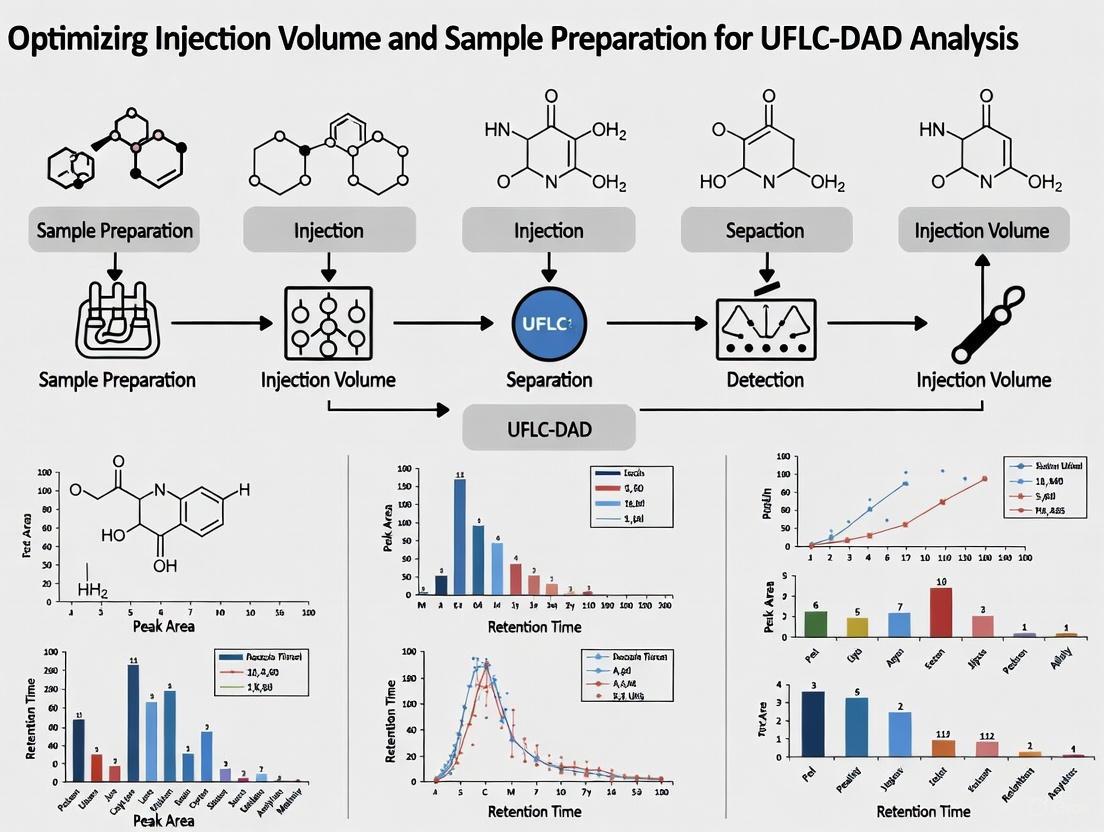
Process Visualization Diagrams
Band Broadening and Focusing in GC
Injection Solvent Strength in LC
FAQs: Core Principles and Method Optimization
Q1: What are the key advantages of using UFLC over traditional HPLC for analyzing complex matrices?
UFLC (Ultra-Fast Liquid Chromatography) offers significant advantages for complex sample analysis, primarily through increased separation efficiency, reduced analysis time, and enhanced sensitivity [6]. This is achieved by using columns packed with sub-2 µm particles and instrumentation capable of operating at much higher pressures (up to 1000 bar or 15,000 psi) than HPLC [6]. A direct comparison study demonstrated that a validated UHPLC method used four times less solvent and a 20 times smaller injection volume than a corresponding HPLC method, leading to better column performance and more economical operation [7].
Q2: Why is sample preparation so critical in UFLC DAD analysis, and what are the common techniques?
Sample preparation is essential to protect the instrument, ensure reproducibility, and achieve accurate quantification. Complex biological and pharmaceutical matrices contain proteins, salts, and other endogenous compounds that can cause ion suppression, matrix effects, and damage to the UFLC system [8]. In a study analyzing tocols in oils and milk, a saponification step was necessary for milk samples to extract the analytes effectively, while a simplified procedure without saponification was sufficient for oils [9]. Common techniques mentioned in the literature include:
- Liquid-liquid extraction (LLE)
- Protein precipitation (PP)
- Solid phase extraction (SPE) [8]
Q3: What specific challenges can arise from the sample itself in chromatographic analysis?
The sample composition can directly lead to operational issues. As reported in troubleshooting guides, highly concentrated or impure samples can cause problems. For instance, analysis of concentrated colorants has been shown to lead to peak broadening, drifting baselines, and potential clogging of column frits as the dye adheres to the hardware [10]. Furthermore, biological matrices require extra filtration because particulates can clog the small-particle columns (≤2 µm) used in UHPLC, leading to increased backpressure, poor peak shape, and costly repairs [6].
Troubleshooting Guides
Problem 1: Ion Suppression or Matrix Effects in LC-MS/MS Bioanalysis
- Symptoms: Reduced or inconsistent analyte response, poor accuracy and precision despite proper sample injection.
- Causes: Co-elution of matrix components from biological fluids (e.g., plasma, serum) that suppress or enhance the ionization of the target analyte in the mass spectrometer source [8].
- Solutions:
- Improve Chromatographic Separation: Optimize the mobile phase and gradient program to separate the analyte from interfering matrix components. Poor column retention can result in detrimental matrix effects [8].
- Optimize Sample Cleanup: Use more selective sample preparation techniques like solid-phase extraction (SPE) or liquid-liquid extraction (LLE) to remove more matrix interferences prior to injection [8].
- Use a Stable Isotope-Labeled Internal Standard (IS): This IS will experience the same matrix effect as the analyte, correcting for the suppression or enhancement and improving quantitative accuracy [8].
- Perform Post-Column Infusion: To diagnose the issue, continuously infuse the analyte into the MS detector while injecting a blank, prepared matrix sample. A dip in the baseline indicates the time window where ion suppression is occurring [8].
Problem 2: Inadequate Separation of Complex Mixtures
- Symptoms: Overlapping peaks, shoulder peaks, inability to resolve all components in a mixture.
- Causes: The chromatographic conditions (column, mobile phase, gradient) are not sufficient for the complexity of the sample.
- Solutions:
- Optimize the Mobile Phase: Systematically adjust the pH, buffer concentration, and organic solvent ratio. Using factorial design of experiments (DoE) makes this optimization faster and more rational than changing one factor at a time [7]. For example, in one study, the addition of acetic acid to the mobile phase was indispensable to achieve suitable peak symmetry and resolution for guanylhydrazones [7].
- Consider Chemical Derivatization: If structural analogs co-elute, consider pre-column derivatization. A study on tocols found that esterification of the hydroxyl group with trifluoroacetic anhydride allowed for the satisfactory separation of otherwise unseparated β- and γ-forms using a conventional C18 column [9].
- Switch to a More Selective Column: If peak overlap persists, investigate columns with different stationary phases (e.g., C18, phenyl, pentafluorophenyl) that offer alternative selectivity.
Problem 3: High Backpressure or Unstable Baselines
- Symptoms: System pressure is consistently at or exceeds the upper-pressure limit; baseline noise or drift.
- Causes: Particulate matter from unfiltered samples or mobile phases clogging the guard column, analytical column, or system tubing [6]. Degassing of the mobile phase can also cause baseline instability.
- Solutions:
- Filter All Samples and Mobile Phases: Use 0.2 µm or 0.45 µm filters for all mobile phases and samples to prevent particulate introduction. This is especially critical in UHPLC due to the small particle sizes and high operating pressures [6].
- Use In-Line Filters and Guard Columns: Always install a guard column between the injector and the analytical column to trap contaminants.
- Check for Mobile Phase Degassing: Ensure the degasser is functioning correctly to prevent bubble formation, which causes baseline noise and pressure fluctuations.
Experimental Protocols & Data
Protocol: Development and Validation of a UFLC-DAD Method for Guanylhydrazones
This protocol summarizes the key steps from a peer-reviewed study that developed and validated methods for analyzing anticancer guanylhydrazones [7].
Instrument Setup:
- Chromatograph: Ultra-Fast Liquid Chromatography (UFLC) system.
- Detector: Diode Array Detector (DAD). Wavelength set to 290 nm based on the maximum absorbance of the compounds.
- Column: C18 column with sub-2 µm particles.
- Mobile Phase: Methanol-water (60:40, v/v).
- pH Adjustment: Adjust mobile phase to pH 3.5 with acetic acid (critical for peak symmetry and resolution).
- Temperature: Ambient temperature.
- Injection Volume: 20 times less than the comparable HPLC method.
Sample Preparation:
- Standards of the guanylhydrazones (LQM10, LQM14, LQM17) were prepared in appropriate solvent.
- The study emphasizes that the synthetic process can generate related impurities, so careful preparation is needed for accurate quantification of the main product [7].
Method Validation Data: The following table summarizes the validation parameters obtained for the UFLC-DAD method, demonstrating its suitability for pharmaceutical analysis [7].
Table 1: Validation Parameters for a UFLC-DAD Method for Guanylhydrazones [7]
| Validation Parameter | LQM10 | LQM14 | LQM17 |
|---|---|---|---|
| Linearity (R²) | 0.9994 | 0.9997 | 0.9997 |
| Accuracy (%) at 10 µg/mL | 99.32 | 99.07 | 99.48 |
| Precision (Intra-day RSD%) | 0.53 | 0.84 | 1.27 |
| Specificity (Similarity Index) | 999 | 999 | 1000 |
Workflow Diagram: UFLC-DAD Method Development and Troubleshooting
The following diagram outlines a logical workflow for developing a UFLC-DAD method, incorporating key optimization and troubleshooting checkpoints derived from the search results.
The Scientist's Toolkit: Essential Research Reagents & Materials
Table 2: Key Materials and Reagents for UFLC-DAD Analysis of Complex Matrices
| Item | Function / Purpose | Considerations for Use |
|---|---|---|
| C18 Chromatographic Column | The stationary phase for separating compounds based on hydrophobicity. | Select columns packed with sub-2 µm particles for UFLC-level performance and high resolution [7] [6]. |
| High-Purity Solvents (ACN, MeOH) | Components of the mobile phase to elute analytes from the column. | Use HPLC-grade solvents to minimize UV background noise and prevent system damage [11] [9]. |
| Acid Modifiers (e.g., Acetic Acid) | Added to the mobile phase to control pH and improve peak shape. | Crucial for suppressing silanol interactions and achieving symmetric peaks and good resolution for ionizable compounds [7]. |
| Internal Standard (e.g., Valsartan) | A compound added to the sample to correct for variability in sample preparation and injection. | Should be chemically similar to the analyte, not interfere with the analysis, and behave similarly during extraction [8]. |
| Syringe Filters (0.2 µm) | To remove particulate matter from samples before injection into the UFLC system. | Essential for protecting UFLC columns and hardware from clogging, given the small particle sizes and high operating pressures [6]. |
| Solid Phase Extraction (SPE) Cartridges | A sample preparation technique to clean up and concentrate analytes from complex matrices. | Used to remove interfering matrix components and reduce ion suppression, improving sensitivity and accuracy [8]. |
FAQ: Troubleshooting Common Chromatographic Challenges
1. My peaks are too close together and are not fully separated. What is the most effective way to improve resolution?
You can improve the resolution (Rs) of closely eluting peaks by manipulating three key factors in the resolution equation: efficiency (N), retention (k), and selectivity (α) [12].
| Approach | Method | Key Parameter Affected | Experimental Implementation |
|---|---|---|---|
| Increase Efficiency | Use a column with smaller particles [12]. | Plate Number (N) | Switch from a 5µm particle column to a sub-2µm or fused-core particle column for sharper peaks [12]. |
| Use a longer column [12]. | Plate Number (N) | Increase column length (e.g., from 100 mm to 200 mm) to increase theoretical plates, improving separation of complex mixtures [12]. | |
| Adjust Retention | Modify mobile phase strength [12]. | Capacity Factor (k) | In Reversed-Phase HPLC, reduce the percentage of organic solvent (%B) to increase analyte retention and potentially improve spacing [12]. |
| Change Selectivity | Change the organic modifier [12]. | Selectivity (α) | Replace acetonitrile with methanol or tetrahydrofuran as the organic modifier; use solvent strength charts to estimate the new %B for similar retention times [12]. |
| Change column chemistry [12]. | Selectivity (α) | Switch to a different stationary phase (e.g., from C18 to a phenyl or cyano column) to alter chemical interactions with analytes [12]. | |
| Adjust mobile phase pH [12]. | Selectivity (α) | For ionizable compounds, using a buffer to control pH can significantly alter the ionization state and retention of analytes [12]. | |
| Increase column temperature [12]. | Selectivity (α)/Efficiency (N) | Elevated temperature can improve efficiency and, for some ionic compounds, change peak spacing [12]. |
2. My chromatographic peaks are broad and lack a sharp, symmetric shape. What causes this and how can I fix it?
Broad, asymmetric peaks indicate a loss of chromatographic efficiency and can be diagnosed by the type of distortion: tailing or fronting.
| Peak Shape Issue | Common Causes | Troubleshooting Solutions |
|---|---|---|
| Peak Tailing | - Secondary interactions with "active sites" in the column or liner [13].- Poor column cut or improper column installation in the inlet [13]. | - Trim the front of the column (10-20 cm) or replace the column [13].- Ensure the column is correctly positioned and has a clean, square cut [13].- Use a fresh, deactivated inlet liner [13]. |
| Peak Fronting | - Column Overload: Injected mass of analyte is too high for the column's capacity [13].- Incorrect method parameters [13]. | - Reduce sample concentration or injection volume [13].- Check that the injection volume and syringe are correct [13].- Use a column with a thicker stationary phase film or larger diameter [13].- Verify split ratio and flow rates are set correctly [13]. |
| Peak Splitting | - Inlet issues during sample focusing (in splitless mode) [13].- Physical damage to the column head [13]. | - Ensure the initial oven temperature is ~20°C below the solvent boiling point [13].- Match solvent polarity with the stationary phase [13].- Re-cut and re-install the column, trimming 10-20 cm from the inlet side [13]. |
3. My method lacks the sensitivity to detect low-concentration analytes. How can I improve the detection limit without changing detectors?
Enhancing sensitivity often involves focusing on sample preparation and injection strategy to introduce more analyte into the system.
| Strategy | Principle | Application Note |
|---|---|---|
| On-line Sample Preparation with Large Volume Injection (LVI) | Directly injects a large sample volume (e.g., 100-500 µL) onto an on-line SPE cartridge, which is then eluted to the analytical column. This pre-concentrates the analyte and reduces matrix effects [14]. | Demonstrated for drug analysis in plasma. Sensitivity improved linearly with injection volume up to 500 µL without significant peak broadening or matrix suppression [14]. |
| Optimize Injection Volume | Increasing the injection volume directly introduces more analyte. However, in direct injection, too large a volume can cause peak broadening [15]. | If peak broadening occurs with larger volumes, consider a) using a stronger injection solvent or b) implementing on-line SPE for focusing [14] [15]. |
| Off-line Sample Pre-concentration | Using off-line techniques like Solid Phase Extraction (SPE) to clean up and concentrate the sample before injection [14]. | SPE is robust and applying a larger sample volume to the SPE cartridge does not significantly alter the procedure, effectively concentrating the analyte [14]. |
Experimental Protocols for Key Scenarios
Protocol 1: Implementing On-line SPE-LC-MS/MS for Sensitivity Enhancement This protocol is adapted from a study that successfully increased sensitivity for drug analysis in plasma using large volume injection [14].
- System Setup: Utilize an LC system configured with an on-line SPE instrument (e.g., Symbiosis Pharma system). The system should allow for large volume injections directly onto an SPE cartridge.
- SPE and Analytical Columns:
- SPE Cartridge: Use a suitable cartridge (e.g., C18 HD 2.0 mm x 10 mm).
- Analytical Column: Use a C18 column (e.g., 2.1 mm x 50 mm, 5 µm).
- Mobile Phase Preparation:
- For SPE Loading: 10 mM ammonium acetate, pH 5.5.
- For Analytical Separation: Employ a binary gradient.
- Eluent A: 10 mM ammonium acetate, pH 5.5.
- Eluent B: Acetonitrile.
- Procedure:
- Sample Preparation: Centrifuge plasma samples and dilute with an equal volume of SPE loading mobile phase.
- Injection: Inject a large volume (e.g., 100-500 µL) of the prepared sample onto the SPE cartridge.
- SPE Clean-up: Wash the cartridge with the loading mobile phase to remove interfering matrix components.
- Elution to Analytical Column: Switch the valve to elute the trapped analytes from the SPE cartridge onto the analytical column using the organic gradient.
- MS/MS Detection: Detect the eluted analytes using mass spectrometry.
- Validation: Demonstrate that sensitivity and detection limits improve proportionally with injection volume without compromising chromatographic peak shape or inducing significant matrix effects [14].
Protocol 2: A Fast HPLC-DAD Method for Multi-Component Analysis This protocol is based on a validated method for separating five synthetic food colorants in under 9 minutes, showcasing how to achieve fast, resolved separations [16].
- Column: Inertsil ODS-3 V C18 (100 mm × 4.6 mm, 5-µm particle size).
- Mobile Phase:
- Eluent A: Water containing 1% ammonium acetate, pH adjusted to 6.8 with ammonium hydroxide.
- Eluent B: Acetonitrile.
- Gradient Program:
Time (min) % Eluent B 0.0 - 3.0 5% 3.0 - 9.0 10% 9.0 - 9.5 40% 9.5 - 12.0 70% 12.0 - 15.0 Return to 5% for column re-equilibration - Detection: Use a Photodiode Array Detector (DAD) with acquisition at appropriate wavelengths for the target analytes.
- Flow Rate: 1.0 mL/min.
- Column Temperature: Maintain constant (e.g., 40°C).
- Injection Volume: 2-10 µL (optimize to avoid overloading).
Protocol 3: Mathematical Resolution Enhancement for Critical Pairs When physical separation of a critical pair is challenging, a mathematical derivative approach can be used to resolve overlapping peaks, provided the resolution is ~0.7-0.8 [17].
- Data Export: Export the chromatographic data (time vs. absorbance) for the region containing the overlapping peaks.
- Data Processing: Import the data into a software tool capable of calculating derivatives (e.g., MATLAB, or a custom Excel template).
- Apply Even-Order Derivatives: Calculate the second or fourth derivative of the absorbance signal. Even-order derivatives can narrow peak widths and enhance resolution in the transformed data space.
- Interpretation: Analyze the derivative chromatogram. The areas under the original peaks are preserved in the derivative plot, allowing for quantification, while the peak apices become more distinct [17].
The Scientist's Toolkit: Research Reagent Solutions
| Item | Function & Importance |
|---|---|
| C18 Analytical Column | The workhorse of Reversed-Phase HPLC; separates analytes based on hydrophobicity. Common dimensions are 50-150 mm in length, 2.1-4.6 mm i.d., with 1.7-5 µm particles [16] [18]. |
| On-line SPE Cartridge | Used for automated sample clean-up and pre-concentration prior to the analytical column, crucial for improving sensitivity and reducing matrix effects in complex samples like plasma [14]. |
| Ammonium Acetate / Formate Buffers | Common volatile buffers for LC-MS mobile phases. They provide pH control for separating ionizable compounds and are compatible with mass spectrometry [14] [16]. |
| Acetonitrile & Methanol (HPLC Grade) | Organic modifiers for reversed-phase mobile phases. Acetonitrile often provides higher efficiency, while methanol can be chosen to alter selectivity [12] [16]. |
| Formic Acid | A common mobile phase additive (0.1%) to promote protonation of analytes in positive-ion LC-MS mode and improve chromatographic peak shape for acidic compounds [18]. |
| Ultra-pure Water | Essential for preparing aqueous mobile phases to minimize UV baseline noise and prevent contamination of the HPLC system or MS ion source. |
Advanced Method Development: Implementing DoE and Modern Preparation Techniques
Troubleshooting Guide: Common Issues in mAb UFLC-DAD Analysis
How do I resolve high backpressure and broadened peaks during mAb analysis?
Problem: Sudden increase in system backpressure accompanied by peak broadening and loss of resolution during Ultra-Fast Liquid Chromatography with Diode Array Detector (UFLC-DAD) analysis of monoclonal antibodies.
Solution:
- Check sample solvent compatibility: Ensure the organic solvent content in your sample diluent does not exceed the mobile phase composition. Mismatched solvents can cause protein precipitation in the column [19].
- Inspect sample preparation: Filter all samples using a 0.45 µm or 0.22 µm syringe filter before injection to remove particulates that could clog the column frit [20].
- Evaluate injection volume: Reduce injection volume if peak broadening occurs, particularly for high-concentration mAb samples (>50 mg/mL). Start with 5-10 µL and optimize empirically [20].
- Column cleaning: Implement a regular column cleaning protocol using the manufacturer's recommended procedure to remove accumulated proteins and contaminants.
What strategies address viscosity challenges in high-concentration mAb formulations?
Problem: High viscosity of concentrated mAb formulations (>100 mg/mL) causes inconsistent injection volumes, sample carryover, and poor chromatographic performance.
Solution:
- Implement viscosity-reducing agents: Incorporate excipients such as arginine hydrochloride (50-100 mM) into the formulation buffer to disrupt protein-protein interactions and reduce viscosity [21].
- Optimize pH and ionic strength: Systematically evaluate formulation pH (typically 5.0-6.5) and buffer ionic strength (10-50 mM) to find conditions that minimize viscosity while maintaining stability [21].
- Employ specialized equipment: Use prefilled syringes with ultra-thin wall (UTW) needles or tapered needles to facilitate injection of viscous samples [21].
- Alternative sample preparation: Consider non-aqueous powder suspensions for extremely high-concentration mabs, though this requires careful method development [21].
How can I improve recovery of mAbs from complex biological matrices?
Problem: Low analyte recovery during sample preparation due to matrix effects, non-specific binding, or protein degradation.
Solution:
- Optimize protein precipitation: For mAb quantification in biological fluids, optimize organic solvent type and volume for protein precipitation. Acetonitrile:methanol (4:1, v/v) typically provides good recovery for most mAbs [20] [22].
- Add stabilizing agents: Include protease inhibitors in sample preparation buffers to prevent enzymatic degradation during extraction.
- Minimize non-specific binding: Use low-protein-binding tubes and tips throughout sample preparation. Consider adding non-interfering carriers like bovine serum albumin (0.1-1 mg/mL) to dilute samples.
- Validate recovery: Use internal standards (e.g., stable isotope-labeled mAbs) to accurately quantify and correct for recovery variations [20].
Frequently Asked Questions (FAQs)
What is the maximum recommended injection volume for mAb analysis on UFLC-DAD?
The optimal injection volume depends on column dimensions, mobile phase composition, and mAb concentration. For a standard 4.6 mm × 250 mm C18 column with 5 µm particles, the recommended injection volume typically ranges from 5-20 µL [20]. For higher volume needs, consider using columns with larger internal diameters, but note that this will increase mobile phase consumption. For high-concentration mAb samples (>50 mg/mL), smaller injection volumes (1-5 µL) are recommended to prevent column overloading and maintain peak shape [21] [23].
Which organic solvents are most compatible with mAb analysis in reversed-phase UFLC?
Electrochemically stable solvents such as 2-propanol (IPA), acetone, and dimethyl sulfoxide (DMSO) have the least impact on chromatographic baseline and separation efficiency [19]. For reversed-phase mAb analysis, acetonitrile is typically preferred over methanol due to its lower viscosity and UV cutoff. When developing methods, maintain organic solvent content in sample diluent below the initial mobile phase composition to prevent on-column focusing issues and peak distortion.
How does sample pH affect mAb stability and analysis reproducibility?
Sample pH significantly impacts mAb stability, viscosity, and chromatographic behavior [21]. Monoclonal antibodies are typically most stable between pH 5.0 and 6.5, where chemical degradation and aggregation are minimized. Outside this range, deamidation (high pH) or fragmentation (low pH) may occur. For UFLC analysis, ensure sample pH is compatible with both mobile phase and column specifications to prevent protein precipitation or irreversible binding.
What column specifications are optimal for separating mAb fragments?
For separating mAb fragments (Fab, Fc, scFv), columns with small pore sizes (300 Å+),* wide-pore C18 stationary phases, and *sub-2 µm particles provide optimal resolution [20] [24]. The C18-UFLC column (e.g., 1.6 µm particle size, 4.6 mm × 250 mm) has been successfully employed for satisfactory separation of closely related mAb variants and fragments [20]. Maintain column temperature between 30-40°C to improve resolution and reduce backpressure.
Table 1: Optimal Organic Solvent Composition for mAb Analysis in UFLC-DAD
| Solvent Type | Recommended Concentration | Impact on Baseline | Best Use Case |
|---|---|---|---|
| 2-Propanol (IPA) | ≤25% in aqueous buffer | Low | High-viscosity mAb formulations |
| Acetonitrile | ≤30% in aqueous buffer | Moderate | Reversed-phase separations |
| Acetone | ≤20% in aqueous buffer | Low | Alternative to acetonitrile |
| DMSO | ≤15% in aqueous buffer | Low | Poorly soluble mAb variants |
| Methanol | ≤35% in aqueous buffer | High | Alternative for specific separations |
Table 2: Injection Volume Optimization Guidelines for Different Column Types
| Column Dimension | Particle Size | Recommended mAb Injection Volume | Maximum Allowable Volume |
|---|---|---|---|
| 2.1 mm × 150 mm | 1.6 µm | 1-5 µL | 10 µL |
| 4.6 mm × 250 mm | 5 µm | 5-20 µL | 50 µL |
| 4.6 mm × 150 mm | 3 µm | 3-15 µL | 30 µL |
| 2.1 mm × 100 mm | 1.7 µm | 1-3 µL | 7 µL |
Table 3: Research Reagent Solutions for mAb Analysis
| Reagent/Chemical | Function in mAb Analysis | Optimal Concentration |
|---|---|---|
| Arginine HCl | Viscosity-reducing agent | 50-250 mM |
| Acetonitrile (HPLC grade) | Mobile phase modifier | 20-50% (gradient) |
| Trifluoroacetic acid (TFA) | Ion-pairing agent | 0.05-0.1% |
| Sodium phosphate buffer | pH control in mobile phase | 10-50 mM, pH 5.0-7.0 |
| Hyaluronidase | Permeation enhancer for SC studies | 10-150 U/mL |
Experimental Protocols
Protocol 1: Method for Optimizing Injection Volume
Objective: Determine the optimal injection volume for mAb analysis that balances detection sensitivity with chromatographic resolution.
Materials:
- UFLC-DAD system with C18 column (4.6 mm × 250 mm, 5 µm)
- mAb sample (1-100 mg/mL in appropriate buffer)
- Mobile phase A: 0.1% TFA in water
- Mobile phase B: 0.1% TFA in acetonitrile
Procedure:
- Prepare mAb sample at target concentration (typically 1 mg/mL for initial method development)
- Set UFLC-DAD detection wavelength to 280 nm (protein absorbance)
- Establish a gradient elution: 5-60% B over 30 minutes, flow rate 1.0 mL/min
- Inject sequentially: 1, 5, 10, 20, and 50 µL of mAb sample
- Record chromatograms and note retention times, peak areas, and peak widths
- Calculate peak asymmetry factor (at 10% peak height) for each injection volume
- Select the injection volume that provides the best compromise between peak area (sensitivity) and peak shape (resolution)
Expected Results: Optimal injection volume typically shows linear increase in peak area with volume while maintaining peak asymmetry factor between 0.8-1.2 [20].
Protocol 2: Organic Solvent Compatibility Assessment
Objective: Evaluate the effect of various organic solvents in sample diluent on mAb stability and chromatographic performance.
Materials:
- mAb reference standard
- Organic solvents: acetonitrile, methanol, 2-propanol, acetone, DMSO
- UFLC-DAD system with appropriate column
Procedure:
- Prepare mAb samples at 0.5 mg/mL in different organic solvent/aqueous mixtures (5%, 10%, 20%, 30% organic)
- Incubate samples at room temperature for 2 hours
- Analyze by UFLC-DAD using established method
- Compare peak areas, retention times, and peak shapes across different solvent conditions
- Check for additional peaks indicating degradation or aggregation
- Assess baseline stability and noise levels for each solvent condition
Expected Results: Electrochemically stable solvents (2-propanol, acetone, DMSO) will show minimal baseline disturbance and better mAb stability compared to methanol or high concentrations of acetonitrile [19].
Workflow Visualization
Diagram 1: mAb Analysis Workflow
Diagram 2: Solvent Troubleshooting Path
This technical support center provides targeted troubleshooting and methodological guidance for researchers developing ultra-fast liquid chromatography (UFLC) methods for the simultaneous analysis of sweeteners and preservatives. The protocols and FAQs are framed within a thesis research context focusing on the optimization of injection volume and sample preparation to achieve robust, high-throughput analysis.
Core Optimized Methodology
The foundational method for the simultaneous separation of multiple food additives is based on reversed-phase chromatography with diode array detection (DAD). The following conditions have been optimized for speed and resolution [25] [26]:
- Chromatographic System: UFLC/HPLC system equipped with a DAD.
- Column: C18 column (e.g., 150 mm × 4.6 mm, 5 µm or 100 mm × 4.6 mm, 3.5 µm for faster analysis).
- Mobile Phase: Gradient elution with Acetonitrile (A) and Phosphate Buffer (B, 12.5 mM, pH = 3.3–4.5).
- Gradient Program:
- 0 min: 5% A
- 0–10 min: 5% A → 50% A
- Hold at 50% A for 5 min
- 15–16 min: 50% A → 5% A
- Hold at 5% A for 5 min for re-equilibration.
- Flow Rate: 1.5 mL/min
- Injection Volume: 10 µL
- Column Temperature: 30 °C
- Detection: DAD, wavelength range 200–380 nm.
The following workflow diagram outlines the complete analytical process, from sample preparation to data analysis.
Troubleshooting Guide & FAQs
This section addresses common challenges encountered during method implementation.
Frequently Asked Questions (FAQs)
Q1: What causes peak tailing or splitting, especially for basic compounds, and how can it be resolved? A: Peak tailing can be caused by several factors [4] [27].
- Silanol Interactions: If analyzing compounds that can interact with acidic silanols on the silica gel, use a high-purity Type B silica-based C18 column or a polar-embedded phase. Adding a competing base like triethylamine (TEA) to the mobile phase can also help.
- Column Degradation: A voided column bed can cause peak tailing and splitting. Replace the column if this is suspected.
- Inappropriate Sample Solvent: If the sample is dissolved in a solvent stronger than the starting mobile phase (e.g., high organic content), it can cause peak distortion. Always prepare or dilute samples in the starting mobile phase composition whenever possible [28].
Q2: The method pressure is abnormally high. What should I check? A: High system pressure is often related to blockages [27].
- Column Frit Blockage: This is the most common cause. Replace the guard column if one is used. The analytical column inlet frit can be replaced or the column can be flushed in the reverse direction (if recommended by the manufacturer).
- Mobile Phase Contamination: Filter all mobile phases through a 0.45 µm or 0.22 µm membrane. Ensure salts are fully dissolved in the buffer.
- System Blockage: Disconnect the column and connect the output of the injector directly to the detector waste. If the pressure remains high, the blockage is in the system tubing or injector. Flush the system with a strong solvent.
Q3: My retention times are shifting. How can I improve run-to-run reproducibility? A: Retention time shifts indicate a lack of equilibration or consistency in the chromatographic conditions [4] [27].
- Mobile Phase Preparation: Ensure mobile phases are prepared accurately and consistently. Use high-purity reagents and HPLC-grade water.
- Column Equilibration: Allow sufficient time for the column to re-equilibrate to the initial gradient conditions after each run. The provided method includes a 5-minute re-equilibration step.
- Temperature Fluctuations: Maintain a constant column temperature using a column oven.
- Pump Performance: Check for faulty pump seals or check valves that could cause fluctuations in flow rate.
Q4: I am observing broad peaks, which reduces my resolution. What are the potential causes? A: Broad peaks reduce efficiency and can be due to [4]:
- Extra-column Volume: Using connecting tubing with too large an internal diameter or that is too long can significantly broaden peaks, especially on systems designed for UFLC. Use short capillaries with the recommended inner diameter (e.g., 0.13 mm for UHPLC).
- Large Detector Flow Cell: The detector cell volume should be appropriate for the column dimensions and peak volumes.
- Long Detector Response Time: Ensure the detector's time constant (response time) is set appropriately for the narrow peaks generated by UFLC.
Troubleshooting Table: Common HPLC Issues
The table below summarizes additional common issues, their causes, and solutions [4] [27].
| Symptom | Possible Cause | Recommended Solution |
|---|---|---|
| No peaks / Flat baseline | No injection, detector lamp failure, or no data transfer. | Check sample vial, injection log, and detector status. Inject a known standard without the column to test detector response [4]. |
| Peak fronting | Column overload, channels in the column, or blocked frit. | Reduce the amount of sample injected; replace the column; replace the pre-column frit [4]. |
| Baseline noise and drift | Contaminated mobile phase, air bubbles, or a failing detector lamp. | Use fresh, high-purity solvents; degas mobile phases thoroughly; replace the UV lamp if it is old [27]. |
| Irreproducible peak areas | Air in the autosampler syringe, a leaking injector seal, or sample degradation. | Purge the autosampler syringe; replace worn injector seals/rotors; use a thermostatted autosampler to stabilize samples [4]. |
Experimental Protocols & Data
This section provides detailed protocols for key experiments relevant to method development and validation.
Sample Preparation Protocol
Proper sample preparation is critical for method accuracy and column longevity [25].
- Carbonated Beverages: Transfer approximately 100 mL of the drink into a beaker. Sonicate for 15 minutes at maximum power (e.g., 300 W) to remove carbon dioxide.
- Fruit Nectars and Viscous Samples: Transfer a representative sample into a centrifuge tube. Centrifuge for 20 minutes at 6000×g to remove suspended solids.
- Dilution: Pipette 1 mL of the degassed or centrifuged sample into a volumetric flask. Dilute to a final volume of 5 mL with high-purity water (dilution factor of 5).
- Filtration: Prior to injection, filter the diluted sample through a 0.22 µm PVDF membrane filter to protect the column and instrument.
System Suitability Test Protocol
Before analyzing samples, perform a system suitability test to ensure the entire HPLC system is performing adequately [25].
- Preparation: Inject three replicates of a mixed standard solution containing all target analytes at a mid-range concentration (e.g., 20 mg/L).
- Evaluation: Calculate the following parameters from the resulting chromatograms:
- Retention Time (tᵣ): Check for consistency (%RSD < 1%).
- Resolution (R): Between critical analyte pairs should be R ≥ 1.5.
- Tailing Factor (As): Should be between 0.8 and 1.2 for each peak.
- Theoretical Plates (N): A measure of column efficiency; higher is better.
- Acceptance Criteria: The method should only be used for sample analysis if all parameters meet the pre-defined acceptance criteria.
The optimized method has been rigorously validated. The table below summarizes key quantitative validation parameters, demonstrating the method's reliability [25].
| Validation Parameter | Result / Value | Acceptance Criteria |
|---|---|---|
| Linearity (R²) | ≥ 0.9995 | R² ≥ 0.999 |
| Accuracy (% Recovery) | 94.1% – 99.2% | 90–110% |
| Precision (Intra-day RSD) | ≤ 2.49% | ≤ 3% |
| Precision (Inter-day RSD) | ≤ 2.49% | ≤ 5% |
| Analysis Time | < 9 minutes | - |
| LOD/LOQ | Excellent sensitivity achieved | Method dependent |
The Scientist's Toolkit: Research Reagent Solutions
The table below lists the essential materials and reagents required to perform this analysis successfully [25] [26].
| Item | Function / Explanation |
|---|---|
| C18 Reversed-Phase Column | The stationary phase for chromatographic separation. A column with 3.5 µm particles enables faster UFLC analysis. |
| HPLC-Grade Acetonitrile | The organic modifier in the mobile phase. High purity is essential for low UV background noise. |
| Potassium Dihydrogen Phosphate | Used to prepare the aqueous buffer component of the mobile phase, which controls pH and modulates retention. |
| Phosphoric Acid | Used to adjust the pH of the aqueous buffer to the optimal range (3.3–4.5). |
| Analytical Standards | High-purity reference compounds (e.g., Acesulfame-K, Saccharin, Aspartame, Sodium Benzoate, etc.) for identification and quantification. |
| 0.22 µm PVDF Filters | For filtering mobile phases and samples to remove particulate matter that could damage the column or system. |
| HPLC-Grade Water | High-purity water (18 MΩ·cm resistivity) for preparing mobile phases and diluting samples. |
Automated Workflows and Column Screening for Rapid Method Development
The landscape of liquid chromatography (LC) method development is being transformed by automation and artificial intelligence (AI), moving away from traditional, labor-intensive "trial-and-error" approaches. These advanced workflows are essential for meeting modern demands for higher throughput, improved accuracy, and cost-efficiency in pharmaceutical, biotech, and environmental analysis [29]. Automation now extends beyond simple robotic sample handling to encompass the entire analytical process, from sample preparation and column screening to separation optimization and data processing [29] [30].
A key advancement is the development of intelligent systems that bridge physical experiments with digital data. Modern instruments can automatically generate reliable, high-quality chromatographic data, with AI-powered prototypes even capable of fully autonomous gradient optimization [29]. For researchers focused on optimizing injection volume and sample preparation for UFLC-DAD research, these automated workflows provide a structured, efficient framework that minimizes manual input, accelerates development timelines, and enhances method robustness.
Automated Column Screening Workflows
A cornerstone of rapid method development is a systematic, automated approach to column and eluent screening, which is particularly valuable for techniques like Hydrophilic Interaction Liquid Chromatography (HILIC) where multiple factors influence the separation.
A Practical UHPLC Screening Workflow
A state-of-the-art automated multicolumn screening workflow for UHPLC has been demonstrated for developing HILIC assays for polar analytes. This workflow overcomes the traditional "hit-or-miss" approach by systematically evaluating a wide range of conditions [31].
- Instrumentation: The platform utilizes readily available UHPLC instrumentation coupled with versatile detection systems (Diode Array Detector - DAD, Charged Aerosol Detector - CAD, and Mass Spectrometry - MS) to accommodate a variety of compounds [31].
- Stationary Phase Screening: The workflow investigates up to 12 complementary columns packed with different stationary phases, including sub-2 µm fully porous and 2.7 µm superficially porous particles [31].
- Mobile Phase Optimization: It automatically evaluates different mobile phase eluents with pH ranging from 3 to 9, using different organic modifiers to find the optimal selectivity [31].
- Gradient and Re-equilibration: The gradient and column re-equilibration times are judiciously set to ensure a reliable and reproducible screening framework, identifying promising conditions for final method optimization [31].
This platform lays the foundation for a generic workflow that significantly accelerates the pace of HILIC method development and facilitates easier method transfer across labs.
AI-Enhanced Method Development
Machine learning (AI) is now being applied to further streamline the process. In one case study for synthetic peptide analysis, an AI algorithm autonomously refined LC gradients to meet resolution targets [29]. This was achieved through:
- Automated Screening: The use of flow selection valves and solvent blending automates the screening of various mobile and stationary phases.
- Intelligent Optimization: An AI algorithm autonomously refines gradients, concentration, time, and flow rate to achieve target resolution, minimizing user input and improving final method quality [29].
Automated Sample Preparation
Sample preparation, often the most variable and intimidating part of chromatography, is a major focus for automation to ensure consistency and minimize errors before analysis even begins [30].
Technologies for Automated Sample Prep
Modern automated systems can perform a comprehensive suite of preparation tasks, which is especially beneficial in high-throughput environments like pharmaceutical R&D [30].
- Integrated Online Cleanup: Systems can perform tasks like dilution, filtration, solid-phase extraction (SPE), and liquid-liquid extraction (LLE) online, merging extraction, cleanup, and separation into a single, seamless process [30].
- Ready-Made Kits: For specific applications like PFAS analysis or oligonucleotide therapeutics, vendors offer standardized kits with stacked cartridges, standards, and optimized LC-MS protocols. These kits minimize background interference and ensure accurate results with minimal processing [30].
- Streamlined Protocols: For complex tasks like peptide mapping, specialized kits can reduce digestion time from overnight to under 2.5 hours, dramatically boosting throughput and consistency [30].
Troubleshooting Guides and FAQs
Even with automated workflows, issues can arise. A systematic, symptom-based troubleshooting approach is key to maintaining efficiency.
Troubleshooting Peak Shape Issues
Peak shape problems are a common challenge during method development and routine analysis. The table below outlines common symptoms, their causes, and solutions.
Table 1: Troubleshooting Guide for Common Peak Shape Issues
| Symptom | Root Cause | Corrective Action |
|---|---|---|
| Peak Tailing [32] [33] | Secondary interactions with active sites on stationary phase; Column overload; Voids in column packing. | Add buffer to mobile phase to block active sites; Reduce injection volume or dilute sample; Examine inlet frit or guard cartridge. |
| Peak Fronting [32] [33] | Sample solvent too strong; Column overload; Physical change in column (e.g., bed collapse). | Dilute sample in a solvent matching the initial mobile phase strength; Reduce injection mass; Replace column. |
| Peak Splitting [32] [33] | Sample solvent mismatch; Sample precipitation; Contamination. | Ensure sample solvent is weaker than mobile phase; Verify sample solubility; Prepare fresh mobile phase and flush column. |
| Broad Peaks [33] | Flow rate too low; Extra-column volume too large; Low column temperature; Coelution. | Increase flow rate; Use shorter, narrower tubing; Raise column temperature; Adjust method (mobile phase, temperature) or try a different column. |
General LC Troubleshooting FAQs
Q: What causes ghost peaks and how can I resolve them? A: Ghost peaks typically arise from carryover in the autosampler, contaminants in mobile phases/solvent bottles, or column bleed. To resolve this, run a blank injection to confirm. Then, clean the autosampler and injection needle/loop, prepare fresh mobile phase, and use high-purity solvents. A guard column can also help capture contaminants early [32].
Q: Why do my retention times shift unexpectedly? A: Retention time shifts can be caused by several factors. The most common are changes in mobile phase composition or pH, fluctuations in flow rate or column temperature, and column aging. To diagnose, verify your mobile phase was prepared correctly and check the pump's flow rate accuracy. Also, ensure the column oven temperature is stable. A uniform shift for all peaks suggests a flow or mobile phase issue, while a selective shift points to a chemical or column-related problem [32].
Q: How can I differentiate between column, injector, and detector problems? A: A structured approach helps isolate the problem source.
- Column issues typically affect all peaks in the chromatogram (e.g., overall loss of efficiency, increased tailing).
- Injector issues often manifest as problems in the early part of the run (peak distortion, split peaks) or as inconsistent peak areas and carryover.
- Detector issues usually affect the baseline (noise, drift) or cause a universal loss of sensitivity [32]. A practical test is to replace the column with a short, known-good column or a connector. If the problem persists, the issue is likely with the injector or detector [32].
Q: What is a systematic process for LC troubleshooting? A: Follow these steps to minimize guesswork [32]:
- Recognize the Deviation: Quantify the change in retention time, peak shape, resolution, or pressure by comparing to a known-good run.
- Check Simple Causes First: Verify mobile phase preparation, sample preparation, and instrument settings.
- Isolate the Problem Source: Use tests like blank injections, column substitution, and pressure measurements to pinpoint the faulty component.
- Check Hardware: Inspect and maintain filters, frits, guard columns, tubing, and pump seals.
- Make One Change at a Time: This is critical for identifying the true root cause.
- Document Results: Keep a log of the issue, actions taken, and outcomes for future reference.
The following diagram illustrates this logical troubleshooting pathway.
The Scientist's Toolkit: Essential Research Reagents and Materials
Successful implementation of automated workflows for UFLC-DAD research relies on the use of specific, high-quality materials.
Table 2: Essential Research Reagents and Materials for Automated Method Development
| Item | Function / Purpose |
|---|---|
| Complementary UHPLC Columns [31] | A suite of columns (e.g., C18, HILIC, cyano, phenyl) with different selectivities (e.g., 12 columns) is fundamental for automated screening to find the best separation. |
| LC-MS Grade Solvents & Additives [33] | High-purity solvents (water, acetonitrile, methanol) and additives (formic acid, ammonium formate) are critical for minimizing background noise, especially with DAD and MS detection. |
| Buffer Salts (e.g., Ammonium Formate/Acetate) [33] | Used to prepare buffered mobile phases, which control pH and block active silanol sites on the stationary phase, improving peak shape for ionizable analytes. |
| Automated Solid-Phase Extraction (SPE) Kits [30] | Application-specific kits (e.g., for PFAS, oligonucleotides) provide standardized, streamlined workflows for sample cleanup, reducing variability and manual effort. |
| Syringe Filters (0.22 µm) [34] | Essential for removing particulates from samples prior to injection, protecting the column and UHPLC system from blockages. |
| Guard Columns / In-Line Filters [32] [33] | Small cartridges placed before the analytical column to capture contaminants and particulates, significantly extending the column's lifetime. |
Experimental Protocols
Protocol: Automated Multi-Column Screening for HILIC Method Development
This protocol is adapted from recent research to streamline the development of HILIC assays for polar analytes [31].
Objective: To rapidly identify the optimal stationary phase and mobile phase combination for separating polar compounds using an automated UHPLC system.
Materials:
- UHPLC system with quaternary pump, autosampler, column oven, and DAD detector.
- Automated column selection valve capable of switching between multiple columns.
- Set of at least 3-5 complementary HILIC columns (e.g., bare silica, amide, amino, diol, zwitterionic).
- Mobile Phase A: 95-100% Acetonitrile with volatile buffer (e.g., 5-20 mM Ammonium Formate/Acetate).
- Mobile Phase B: Aqueous buffer (e.g., 5-20 mM Ammonium Formate/Acetate in Water).
- Test sample of target analytes dissolved in a compatible solvent (typically high organic content).
Procedure:
- System Setup: Install the columns on the selection valve. Prime the system with all mobile phases.
- Method Programming: Create a sequence where the system automatically:
- Switches to the first column.
- Executes a generic, scouting gradient (e.g., 0-100% B over 10-15 minutes).
- Washes and re-equilibrates the column.
- Repeats steps a-c for every column in the set.
- Data Analysis: Review the chromatograms from all runs. Identify the column and starting gradient conditions that provide the best resolution and peak shape for the critical pair of analytes.
- Fine-Tuning: Use the promising conditions from the screen for further optimization of gradient slope, temperature, and pH to finalize the method.
Protocol: Systematic Troubleshooting of Peak Shape
Objective: To diagnose and resolve peak tailing or fronting in an established UFLC-DAD method.
Materials:
- Standard solution of known purity.
- Freshly prepared mobile phase.
- Isopropanol or other strong solvent for cleaning.
- New guard column (if available).
Procedure:
- Establish a Baseline: Inject the standard and document the peak asymmetry (tailing factor).
- Reduce Sample Load: Dilute the sample 5-10 fold and re-inject. If tailing/fronting improves, the original method suffered from column overload [33].
- Check Solvent Compatibility: Re-prepare the sample in a solvent that matches the initial mobile phase composition. Re-inject. If the issue is resolved, a solvent mismatch was the cause [32].
- Replace Guard Column: If steps 2 and 3 do not help, replace the guard column. This often resolves issues caused by contamination at the column inlet [33].
- Flush the Analytical Column: If the problem persists, flush the analytical column according to the manufacturer's instructions using strong solvents to remove any strongly retained contaminants [33].
- Test System without Column: Bypass the column (connect injector directly to detector with a zero-dead-volume union). Inject the standard. Symmetrical peaks indicate the column is the source of the problem. Asymmetrical peaks suggest an issue with the injector or tubing [32].
Troubleshooting UFLC-DAD Methods: Solving Volume, Matrix, and Sensitivity Challenges
Strategies for Minimizing Matrix Effects and Ion Suppression in Biological Samples
Matrix effects and ion suppression are significant challenges in the analysis of biological samples using techniques like Ultra-Fast Liquid Chromatography with Diode Array Detection (UFLC-DAD) and Liquid Chromatography-Mass Spectrometry (LC-MS). These phenomena occur when components in the sample matrix interfere with the detection of target analytes, leading to reduced accuracy, sensitivity, and reliability of analytical results. This technical guide provides troubleshooting and FAQs to help researchers overcome these challenges, with a specific focus on optimizing injection volume and sample preparation within UFLC-DAD research.
Understanding Matrix Effects and Ion Suppression
What are matrix effects and ion suppression? Matrix effects are the combined influence of all sample components other than the analyte on the measurement of the quantity. When this interference specifically reduces the ionization efficiency of the target analyte in the mass spectrometer, it is termed ion suppression. These effects can dramatically decrease measurement accuracy, precision, and sensitivity in chromatographic analyses [35] [36].
How do they affect my UFLC-DAD analysis? In UFLC-DAD, matrix effects may not cause ion suppression (as this is specific to MS detection), but co-eluting matrix components can still lead to baseline noise, shifted retention times, and inaccurate quantification by interfering with UV detection. In LC-MS, ion suppression can reduce signal intensity for your target analytes [36]. One study noted that ion suppression can range from 1% to over 90%, with coefficients of variation from 1% to 20% across different biological matrices [35].
Troubleshooting Guide: Common Issues and Solutions
Problem: Inconsistent Peak Areas or Signal Suppression
Causes:
- Ion suppression from co-eluting matrix components [36]
- Inappropriate injection volume for the sample matrix
- Insufficient sample clean-up
Solutions:
- Optimize sample preparation: Improve extraction and clean-up methods to remove interfering compounds [37].
- Apply stable isotope-labeled internal standards: These can correct for variability in ionization efficiency and ion suppression, as demonstrated in the IROA TruQuant workflow [35].
- Adjust injection volume: For concentrated samples, consider reducing volume; for dilute samples, increase volume while implementing appropriate suppression correction methods [35].
Problem: Poor Peak Shape or Resolution
Causes:
- Column degradation or inappropriate stationary phase [27]
- Sample-solvent incompatibility [38]
- Temperature fluctuations [27]
Solutions:
- Use compatible solvents: Ensure sample solvent matches mobile phase composition [38].
- Replace or clean columns: Follow flushing protocols; replace degraded columns [27].
- Maintain column temperature: Use column ovens to stabilize temperature [27] [39].
Problem: Baseline Noise and Drift
Causes:
- Contaminated solvents or mobile phases [27]
- Air bubbles in the system [38]
- Detector lamp issues [27]
Solutions:
- Use high-purity solvents: Always employ HPLC-grade reagents [27] [38].
- Thoroughly degas mobile phases: Use online degassing or sparging with inert gas [27].
- Clean detector flow cells regularly: Follow manufacturer's maintenance protocols [27].
Problem: Retention Time Shifts
Causes:
Solutions:
- Prepare mobile phases consistently: Use precise measurements and fresh preparations [27].
- Equilibrate columns thoroughly: Allow sufficient time for column equilibrium before analysis [38].
- Service pumps regularly: Maintain according to manufacturer schedules [27].
Experimental Protocols for Minimizing Matrix Effects
Protocol 1: Comprehensive Sample Clean-up for UFLC-DAD Analysis
This protocol is adapted from a method for determining orotic acid in milk using UFLC-DAD [39]:
Sample Preparation:
- Treat biological samples with acetonitrile (1:1, v/v)
- Centrifuge at 4°C to precipitate proteins
- Dilute supernatant with ultrapure water (1:9 ratio)
Chromatographic Conditions:
- Columns: Two serially connected Kinetex C18 columns (1.7 µm, 150 mm × 2.1 mm)
- Guard Column: C18 pellicular packing material
- Column Temperature: 35°C
- Mobile Phase:
- Solvent A: 0.02 M NaH₂PO₄ buffered to pH 2.2 with phosphoric acid
- Solvent B: HPLC-grade acetonitrile
- Gradient Program: Vary from 0% B to various percentages as needed for separation
- Injection Volume: 0.5-6 µL
- Detection: UV at 278 nm
Validation:
- Calculate recovery rates (target: 96.7-105.3%)
- Determine inter- and intra-assay coefficients of variation
Protocol 2: IROA Workflow for Ion Suppression Correction
This protocol utilizes stable isotope-labeled standards to correct for ion suppression in MS-based analyses [35]:
Standard Preparation:
- Prepare IROA Internal Standard (IROA-IS) with specific isotopic patterns
- Create IROA Long-Term Reference Standard (IROA-LTRS) as a 1:1 mixture of chemically equivalent standards at 95% ¹³C and 5% ¹³C
Sample Processing:
- Spike samples with IROA-IS at constant concentrations
- Process samples through your standard extraction protocol
Data Analysis:
- Identify metabolites based on signature IROA isotopolog ladder patterns
- Use specialized software (e.g., ClusterFinder) to automatically calculate and correct ion suppression
- Apply Dual-MSTUS normalization to corrected data
Validation:
- Assess correction efficiency across different sample concentrations
- Verify linearity of response after correction
Quantitative Data on Matrix Effects
Table 1: Ion Suppression Levels Across Different Chromatographic Systems [35]
| Chromatographic System | Ionization Mode | Source Condition | Ion Suppression Range | Effective Correction with IROA |
|---|---|---|---|---|
| Reversed-Phase (RPLC-MS) | Positive | Clean | 8.3% (e.g., Phenylalanine) | Yes |
| Reversed-Phase (RPLC-MS) | Positive | Unclean | Significantly Higher | Yes |
| Ion Chromatography (ICMS) | Negative | Clean | Up to 97% (e.g., Pyroglutamylglycine) | Yes |
| HILIC-MS | Both | Both | 1% to >90% | Yes |
Table 2: Performance Metrics of Optimized UFLC-DAD Method for Biological Samples [39]
| Parameter | Value | Interpretation |
|---|---|---|
| Recovery Rates | 96.7-105.3% | Excellent accuracy |
| Inter-assay CV | 0.784-1.283% | High precision |
| Intra-assay CV | 0.710-1.221% | High repeatability |
| Limit of Detection | 0.04 ng | High sensitivity |
| Limit of Quantification | 0.12 ng | Suitable for trace analysis |
Research Reagent Solutions
Table 3: Essential Materials for Minimizing Matrix Effects
| Reagent/Material | Function | Application Example |
|---|---|---|
| Stable Isotope-Labeled Internal Standards | Correct for ionization variability | IROA workflow for ion suppression correction [35] |
| HPLC-Grade Acetonitrile | Sample protein precipitation; mobile phase component | UFLC-DAD analysis of orotic acid in milk [39] |
| C18 Chromatographic Columns | Analyte separation | Kinetex C18 columns for UFLC separation [39] |
| Phosphoric Acid and Salts | Mobile phase modifiers | Phosphate buffer for pH control in UFLC [39] |
| Specialized Software (e.g., ClusterFinder) | Data analysis and suppression correction | Automatic ion suppression calculation [35] |
Workflow Diagram for Addressing Matrix Effects
Frequently Asked Questions (FAQs)
1. What is the most effective way to minimize matrix effects in UFLC-DAD analysis? The most effective approach involves optimizing sample preparation to remove interfering compounds, using appropriate injection volumes, and implementing robust chromatographic separation. The method described for orotic acid analysis in milk demonstrates that protein precipitation with acetonitrile followed by dilution and optimized UFLC conditions can effectively minimize matrix effects [39].
2. How can I determine if my samples are experiencing ion suppression? For MS detection, you can use the post-column infusion method: inject a blank sample extract while infusing the analyte standard post-column. Signal suppression or enhancement at specific retention times indicates matrix effects. For UFLC-DAD, analyze blank samples to identify regions where matrix components elute and may interfere with your analyte [36].
3. What injection volume is optimal for minimizing matrix effects? The optimal injection volume depends on your sample concentration and clean-up efficiency. One study successfully used 0.5-6 µL for milk analysis after appropriate sample preparation [39]. With effective ion suppression correction methods like IROA, you can inject larger volumes to detect low-abundance analytes while correcting for the resulting matrix effects [35].
4. When should I use stable isotope-labeled internal standards? These standards are particularly valuable when:
- Analyzing complex biological matrices with variable composition
- High precision and accuracy are required
- Developing methods for regulatory compliance
- Analyzing compounds prone to significant ion suppression in MS-based methods [35] [36]
5. Can changing my chromatographic system reduce matrix effects? Yes, different separation mechanisms can significantly impact matrix effects. Research shows that ion suppression varies across reversed-phase, ion chromatography, and HILIC systems. Evaluating different chromatographic approaches for your specific application may help minimize co-elution of analytes with interfering matrix components [35].
6. How does sample clean-up affect matrix effects? Sample clean-up is crucial for reducing matrix effects. Efficient extraction and purification steps remove interfering compounds that cause suppression. However, note that excessive clean-up may also remove your target analytes, so method development should balance clean-up efficiency with analyte recovery [36] [37].
Overcoming Sensitivity Limitations via On-Column Focusing and Pre-concentration
For researchers in drug development, achieving high sensitivity in Ultra-Fast Liquid Chromatography (UFLC) is often critical, especially when analyzing complex biological samples with low analyte concentrations. Injection volume is a key parameter in method development. While larger injections can enhance sensitivity, they often lead to volume overload and peak broadening, compromising data quality. This technical guide explores how the principles of on-column focusing and pre-concentration provide a robust solution, enabling the injection of larger volumes without sacrificing chromatographic performance.
Core Concepts: On-Column Focusing Explained
What is On-Column Focusing?
On-column focusing, or pre-concentration, is a powerful technique that allows for the injection of larger sample volumes by creating transient conditions at the head of the column where analytes are highly retained and concentrated into a narrow band [40]. This process mitigates the peak broadening that typically results from large-volume injections.
The mechanism relies on two key phenomena [40]:
- High Initial Retention: The sample is dissolved and injected in a solvent that has a weaker elution strength than the starting mobile phase. As the sample enters the column, the analytes experience strong retention (characterized by a high retention factor,
k1), causing them to accumulate at the column inlet. - Zone Compression: When the stronger mobile phase reaches this concentrated analyte band, it creates a step-gradient effect. The rear of the analyte zone, exposed to the stronger mobile phase for a longer time, moves faster than the front, compressing the entire band. The analyte then elutes under the isocratic or gradient conditions of the method (with a retention factor
k2).
Quantitative Foundation
The effectiveness of solvent-based, on-column focusing is quantitatively described by the ratio of the eluted peak volume to the injected volume. Research has demonstrated that this ratio is approximately k2/k1 [40].
k1: The retention factor of the solute in the sample solvent.k2: The retention factor of the solute in the mobile phase under isocratic conditions.
This relationship means that if an analyte is strongly retained in the sample solvent (k1 = 50) but weakly retained in the mobile phase (k2 = 5), the eluted peak volume will be approximately 10 times smaller than the injected volume, resulting in a significant increase in peak height and detection sensitivity [40].
Frequently Asked Questions (FAQs)
1. How does sample solvent strength affect my chromatogram?
The solvent used to dissolve your sample is a critical factor. If the sample solvent is stronger than your mobile phase, it can cause severe peak distortion, broadening, and shortened retention times as analytes travel too quickly through the column initially [41]. For optimal on-column focusing, the sample should be dissolved in a solvent that is weaker than the mobile phase [34] [41]. A best practice is to prepare your sample in your mobile phase A or a similar solvent [34].
2. What is the maximum volume I can inject without causing band broadening?
The allowable injection volume depends on your column dimensions and the focusing effect. The following table provides general guidelines for volumes that avoid band broadening when the sample is in the same solvent as the mobile phase [41].
| Column Inner Diameter (ID) | Typical Injection Volume (µL) |
|---|---|
| 2.1 mm | 1 - 3 µL |
| 3.0 - 3.2 mm | 2 - 12 µL |
| 4.6 mm | 8 - 40 µL |
When using a weaker sample solvent for on-column focusing, you can significantly exceed these volumes. The achievable focusing, and thus the maximum practical injection volume, is directly related to the k2/k1 ratio [40] [41].
3. My peaks are broad and tailing. Could this be related to my injection technique?
Yes, broad or tailing peaks are a classic symptom of volume overload or an incompatible sample solvent [34] [4]. This confirms that the on-column focusing effect is not functioning correctly. To resolve this, first ensure your sample is dissolved in a solvent that is weaker than your mobile phase. If the problem persists, dilute your sample or reduce the injection volume [4].
4. Are there any special considerations for column care when using this technique?
No special care is needed solely for on-column focusing. However, best practices always apply. Using a guard column is highly recommended to protect your analytical column from particulate matter or contamination from complex samples, which can extend the column's lifespan [41]. Regularly flushing your column with a strong solvent according to the manufacturer's instructions will help remove any accumulated contaminants [4].
Troubleshooting Guides
Problem: Poor Peak Shape After Large-Volume Injection
| Symptom | Possible Cause | Solution |
|---|---|---|
| Severe fronting or broadening | Sample solvent is stronger than the mobile phase. | Re-prepare the sample in a weaker solvent, ideally mobile phase A [34] [4]. |
| Injection volume is too large, even with focusing. | Dilute the sample and inject a smaller volume [34]. | |
| Peak tailing | Column degradation or voiding. | Replace the column. If possible, try flushing the column in the reverse direction [4]. |
| Incompatibility between the analyte and the stationary phase (e.g., basic compounds with silica). | Use a high-purity silica column or a polar-embedded phase [4]. |
Problem: Inconsistent Retention Times
| Symptom | Possible Cause | Solution |
|---|---|---|
| Gradual retention time shift | Column has not reached equilibrium after the gradient. | Ensure adequate re-equilibration with the starting mobile phase between runs (typically 7-10 column volumes) [34]. |
| Random retention time fluctuation | Variations in mobile phase composition or preparation. | Prepare mobile phases consistently and use HPLC-grade solvents. Ensure the mobile phase reservoir has a lid to prevent evaporation [27]. |
| Pump delivering an inconsistent flow rate. | Check for pump leaks, seal integrity, and purge the pump of any air bubbles [27]. |
Experimental Protocol: Implementing On-Column Focusing
The following workflow outlines the general procedure for developing a method that utilizes on-column focusing for sensitivity enhancement.
1. Choose Chromatographic Mode: This technique is most commonly applied in Reversed-Phase (RP) chromatography [34]. For RP, the stationary phase is non-polar (e.g., C18) and the mobile phase starts with a high percentage of aqueous solvent.
2. Select Weak Sample Solvent: The sample must be dissolved in a solvent that is significantly weaker than the starting mobile phase [34] [41]. For reversed-phase, this typically means a solvent with a lower percentage of organic modifier or a higher percentage of water. For example, if your mobile phase A is 95% water / 5% acetonitrile, a suitable sample solvent might be 100% water.
3. Dissolve Sample: Prepare the sample in the selected weak solvent. Ensure the sample is fully dissolved and free of particulates by centrifugation or filtration through a 0.22 µm membrane [34] [39].
4. Perform Large-Volume Injection: Inject a volume larger than the standard recommendation for your column. The optimal volume should be determined experimentally, but the principle of k2/k1 indicates you can go significantly higher than non-focused injections [40] [41].
5. Elute with Analytical Gradient: Begin the analytical gradient. The transition from the weak sample solvent to the stronger mobile phase at the column inlet creates the step-gradient that compresses the analyte band [40] [42].
6. Evaluate and Optimize: Assess chromatographic performance. If peak shape is poor, consider using a weaker sample solvent or a slightly stronger starting mobile phase to increase the k1 value. If more sensitivity is needed, consider increasing the injection volume further [34].
Research Reagent Solutions
The following table lists essential materials and reagents commonly used in UFLC analyses that utilize on-column focusing, as exemplified in published methodologies [39].
| Item | Function in Analysis |
|---|---|
| C18 Analytical Column | The standard stationary phase for reversed-phase separations; provides the non-polar surface for analyte retention and focusing [34] [39]. |
| C18 Guard Column | Protects the expensive analytical column from particulate matter and contaminants in the sample matrix, extending its life [41] [39]. |
| HPLC-Grade Water | Used as the primary aqueous component of mobile phases and as a potential weak solvent for sample preparation to achieve focusing [34] [39]. |
| HPLC-Grade Acetonitrile/Methanol | Common organic modifiers for reversed-phase mobile phases. Acetonitrile is often preferred for its low viscosity and UV transparency [34]. |
| Mobile Phase Buffers (e.g., NaH₂PO₄) | Added to the aqueous mobile phase to control pH, which can sharpen peaks and improve the separation of ionizable compounds [34] [39]. |
| 0.22 µm Membrane Filters | Critical for removing particulates from samples and mobile phases to prevent column blockage [34]. |
Advanced Insights: Focusing in Narrow-Bore Systems
The principles of on-column and gradient focusing are not limited to conventional columns. Recent studies with narrow open tubular (OT) columns, with inner diameters as small as 2 µm, have demonstrated exceptionally sharp peaks. Research confirms that the primary contributor to this high resolution is a gradient focusing effect caused by the composition difference between the eluent and the sample matrix, rather than reduced diffusion within the narrow confines of the column [42]. This reinforces that the strategic mismatch between sample solvent and mobile phase is a universally powerful tool for enhancing sensitivity and resolution across different chromatographic platforms.
Optimizing Injection Parameters for Volatile Organic Modifiers and Viscous Samples
Troubleshooting Guides
Peak Shape and Integrity Issues
Q1: My chromatograms show severe peak tailing. What could be the cause and how can I resolve it?
A: Peak tailing often results from secondary interactions between basic analytes and acidic silanol groups on the silica surface of the column. To resolve this:
- Column Selection: Use high-purity silica (Type B) or polar-embedded stationary phases to minimize silanol interactions [4].
- Mobile Phase Modification: Add a competing base such as triethylamine (TEA) to the mobile phase [4].
- Alternative Columns: Consider using polymeric columns which are less prone to these interactions, especially when working with type A silica columns [4].
- Buffer Capacity: Increase buffer concentration to ensure sufficient capacity, which maintains stable pH and minimizes ionization effects [4].
Q2: I am observing peak splitting in my analyses. What are the primary causes and solutions?
A: Peak splitting typically indicates problems at the column head or sample solvent incompatibility:
- Blocked Frit: Replace the pre-column frit. If problem recurs quickly, investigate sources of particles (sample, eluents, pump mechanics, or injection valve) [4].
- Column Channels: Replace the column if channels have formed, and verify that application conditions remain within column specifications (pressure and pH ranges) [4].
- Sample Solvent Strength: Ensure sample is dissolved in the starting mobile phase rather than a stronger eluent. Reduce sample solvent strength or decrease injection volume if necessary [4].
- Column Overload: Reduce the amount of sample injected or increase column volume by using a column with larger internal diameter [4].
Q3: Why are my early-eluting peaks broader than later-eluting ones?
A: This problem is commonly associated with extra-column volume and detection parameters:
- Extra-Column Volume: Use short capillary connections with appropriate internal diameters (0.13 mm for UHPLC columns, 0.18 mm for conventional HPLC columns). The extra-column volume should not exceed 1/10 of the smallest peak volume [4].
- Detector Flow Cell Volume: Ensure flow cell volume doesn't exceed 1/10 of the smallest peak volume. For UHPLC or microbore columns, use smaller volume flow cells [4].
- Detector Response Time: Set detector response time (time constant) to less than 1/4 of the peak width at half-height of the narrowest peak [4].
Injection and Precision Problems
Q4: My peak areas show poor precision between injections. How can I improve reproducibility?
A: Poor peak area precision often originates from the autosampler or sample itself:
- Diagnostic Test: Perform multiple injections to differentiate between sampler and sample-related issues. If the sum of peak areas varies, the issue is likely with the injector. If only some peak areas vary, the sample may not be stable [4].
- Air Bubbles: Check that the autosampler isn't drawing air from the vial. Verify sample filling height and sampling height of the injector needle [4].
- Needle Condition: Replace the needle if clogged or deformed at the tip [4].
- Draw Speed: Reduce draw speed to take at least 2-3 seconds, and program a delay time after sample drawing to allow for pressure equilibration [4].
- Seal Integrity: Check for leaking injector seals or bubbles in the syringe [4].
Q5: How does sample viscosity affect injection parameters, and how can I optimize for viscous samples?
A: Viscous samples present particular challenges for injection precision and chromatographic performance:
- Sample Dilution: Dilute viscous samples with an appropriate solvent to reduce viscosity and improve injection precision [4].
- Needle Wash: Implement a thorough needle wash cycle with a solvent compatible with both the sample and mobile phase to prevent carryover [4].
- Solvent Strength Matching: Ensure sample solvent strength closely matches the initial mobile phase composition to avoid peak distortion [4].
- Temperature Control: Maintain consistent temperature in the autosampler to minimize viscosity variations between injections [4].
Q6: What special considerations are needed when working with volatile organic modifiers?
A: Volatile compounds require specific approaches to prevent loss and maintain detection sensitivity:
- Derivatization Strategies: For volatile carbonyl compounds, consider pre-column derivatization with agents like 2,4-dinitrophenylhydrazine (DNPH) to enhance detectability and stability [43].
- Headspace Techniques: Implement dynamic headspace sampling to separate volatile analytes from complex matrices like oils [43].
- Sealed Injection Systems: Ensure the injection system is properly sealed to prevent evaporation of volatile components during the injection process [4].
- Temperature Control: Maintain lower temperatures in the autosampler compartment when working with highly volatile modifiers to reduce evaporation [4].
Baseline and Detection Issues
Q7: My baseline shows periodic fluctuations. What should I investigate?
A: Periodic baseline fluctuations typically indicate system-related issues:
- Degassing Problems: Check degasser operation, as insufficient degassing can cause bubbling and baseline noise [4].
- Pump Pulsation: Verify pump performance and check for worn pump seals that might cause pulsation [4].
- Mixing Ripple: If using a low-pressure mixing system, ensure solvents are properly degassed and check for mixing issues [4].
- Temperature Fluctuations: Ensure column compartment temperature is stable, as variations can cause baseline drift [4].
Q8: I'm getting negative peaks in my chromatogram. What causes this and how can I fix it?
A: Negative peaks typically occur when the sample has lower absorbance than the mobile phase:
- Wavelength Selection: Change UV/fluorescence detection wavelength(s) to a region where the mobile phase has less background absorption [4].
- Mobile Phase Adjustment: Use mobile phase with less background absorption/fluorescence [4].
- Sample Solvent: Dissolve sample in mobile phase rather than a different solvent [4].
- Reference Wavelength: For DAD detectors, ensure the sample doesn't absorb at the reference wavelength. If possible, use a method without a reference wavelength [4].
Experimental Protocols
Protocol 1: Method for Troubleshooting Peak Tailing
Objective: Identify and resolve causes of peak tailing in chromatographic separations.
Materials: HPLC/UHPLC system with appropriate column, mobile phase components, standard solutions.
Procedure:
- Initial Assessment: Inject a test mixture and document the extent of tailing using asymmetry factor calculations.
- Column Evaluation: Replace existing column with a high-purity silica (Type B) or polar-embedded phase column [4].
- Mobile Phase Modification: Add 0.1% triethylamine (TEA) to the mobile phase as a competing base [4].
- Buffer Optimization: Increase buffer concentration incrementally (e.g., from 10 mM to 25 mM, 50 mM) while monitoring peak shape improvement [4].
- Alternative Chemistry: If tailing persists, switch to a polymeric column with similar dimensions and stationary phase chemistry [4].
- Validation: Inject the test mixture after each modification and compare peak asymmetry factors to document improvement.
Protocol 2: Optimization of Injection Parameters for Viscous Samples
Objective: Establish optimal injection conditions for viscous samples to ensure precision and accuracy.
Materials: Autosampler-equipped LC system, viscous sample, appropriate diluents.
Procedure:
- Sample Dilution: Prepare a series of dilutions (neat, 1:1, 1:2, 1:5) of the viscous sample using a solvent compatible with the mobile phase.
- Injection Volume Study: Inject each dilution at volumes spanning the linear range of the detection system (e.g., 1, 2, 5, 10 μL).
- Precision Assessment: Perform quintuplicate injections at each condition and calculate %RSD for peak areas.
- Needle Wash Optimization: Test different needle wash solvents and durations to eliminate carryover without causing sample precipitation.
- Draw Speed Evaluation: Program the autosampler to use different draw speeds (1, 2, 3, 5 seconds) and assess impact on injection precision.
- Data Analysis: Identify the combination of dilution factor, injection volume, and instrument settings that provides optimal precision (typically %RSD < 1%).
Protocol 3: Handling Volatile Carbonyl Compounds in Oil Matrices
Objective: Reliably analyze volatile carbonyl compounds in complex oil matrices.
Materials: LC system with DAD detector, derivatization agent (DNPH), internal standard (cyclopentanal), oil samples [43].
Procedure:
- Derivatization: React oil samples with DNPH solution to form stable hydrazone derivatives of carbonyl compounds [43].
- Internal Standard Addition: Add a known amount of cyclopentanal as an internal standard to correct for procedural variations [43].
- Extraction: Extract the derivatized compounds using an appropriate solvent system.
- Chromatographic Separation: Employ a reversed-phase UHPLC method with gradient elution to separate the derivatives [43].
- Detection and Quantification: Detect at appropriate wavelengths and quantify using the internal standard method [43].
- Validation: Determine linearity, repeatability, LOD, LOQ, and recovery for the method to ensure reliability [43].
Data Presentation
Table 1: Troubleshooting Guide for Common Injection and Separation Issues
| Symptom | Possible Cause | Solution | Reference |
|---|---|---|---|
| Peak Tailing | Basic compounds interacting with silanol groups | Use high-purity silica columns; Add triethylamine to mobile phase | [4] |
| Peak Splitting | Blocked column frit; Sample solvent too strong | Replace pre-column frit; Dissolve sample in starting mobile phase | [4] |
| Broad Early Peaks | Extra-column volume too large; Detector cell volume too large | Use shorter, narrower capillaries; Use smaller volume flow cell | [4] |
| Poor Peak Area Precision | Air in autosampler; Sample degradation; Clogged needle | Degas samples; Use thermostatted autosampler; Replace needle | [4] |
| Negative Peaks | Sample absorption lower than mobile phase | Change detection wavelength; Use mobile phase with less background | [4] |
| Retention Time Drift | Temperature mismatch; Column degradation | Use eluent pre-heater; Replace column | [4] |
Table 2: Optimization Parameters for Challenging Sample Types
| Sample Type | Challenge | Injection Parameter Optimization | Sample Preparation Strategy | |
|---|---|---|---|---|
| Viscous Samples | Poor injection precision; Column overload | Reduce injection volume; Slow draw speed (2-3 sec); Dilute samples 1:1 to 1:5 | Dilution with compatible solvent; Filtration | [4] |
| Volatile Compounds | Evaporation losses; Poor detection | Use sealed vials; Lower autosampler temperature; Larger injection volume (if compatible) | Derivatization (e.g., with DNPH); Headspace sampling | [43] |
| Complex Matrices (Oils) | Matrix interference; Poor solubility | Use partial loop injection; Needle wash with strong solvent | Pre-column treatment; Solid-phase extraction; Saponification | [20] [44] |
| Low Concentration Analytes | Detection limits; Integration issues | Increase injection volume; Optimize detector settings | Pre-concentration; Derivatization for enhanced detection | [20] |
Workflow Visualization
Injection Issue Resolution
The Scientist's Toolkit: Essential Research Reagent Solutions
Table 3: Key Reagents and Materials for Optimizing Injection Parameters
| Reagent/Material | Function | Application Notes |
|---|---|---|
| High-Purity Silica (Type B) Columns | Minimize silanol interactions with basic compounds | Essential for reducing peak tailing; superior to Type A silica [4] |
| Polar-Embedded Phase Columns | Provide alternative selectivity and reduced secondary interactions | Particularly useful for challenging separations of basic compounds [4] |
| Triethylamine (TEA) | Competing base to minimize silanol interactions | Add at 0.1-0.5% to mobile phase; not compatible with MS detection [4] |
| Trifluoroacetic Anhydride | Derivatization agent for enhancing separation | Improves separation of tocopherol and tocotrienol isomers [20] |
| 2,4-Dinitrophenylhydrazine (DNPH) | Derivatization agent for volatile carbonyl compounds | Enhances stability and detectability of volatile aldehydes and ketones [43] |
| Viper or nanoViper Fingertight Fitting System | Minimize extra-column volume | Critical for UHPLC applications; maintains separation efficiency [4] |
| EDTA Solution | Chelating agent to prevent metal interactions | Add to mobile phase when analyzing compounds prone to chelation [4] |
Addressing Carryover, Contamination, and Column Degradation from Crude Samples
This guide provides targeted troubleshooting strategies to help researchers mitigate common HPLC/UFLC problems arising from the analysis of crude samples, framed within the context of optimizing injection volume and sample preparation for UFLC-DAD research.
Troubleshooting Guides
Guide: Resolving Loss of Chromatographic Resolution
A drop in resolution, evident from overlapping peaks, is a frequent challenge when working with complex, crude samples.
Common Causes and Solutions [45] [46]
| Symptom | Potential Cause | Corrective Action |
|---|---|---|
| Broad or Tailing Peaks | Column contamination from sample matrix. | Flush column with 20-30 mL of a strong solvent (e.g., 100% acetonitrile) [45]. Use a guard column [46]. |
| Column aging or bed voiding. | Reverse-flush the column (as a last resort) or replace the column [45]. | |
| Shifting Retention Times | Insufficient column equilibration. | Flush with 10-20 column volumes of mobile phase before analysis [45]. |
| Mobile phase pH fluctuations or buffer precipitation. | Use high-purity buffers and ensure accurate mobile phase preparation [46]. | |
| Overlapping Peaks / Co-elution | Sample overloading (volume or concentration). | Reduce injection volume; filter and dilute samples prior to injection [46]. |
| Inappropriate mobile phase solvent strength. | Adjust the organic-to-aqueous phase ratio to improve selectivity [46]. | |
| High Backpressure | Particulate clogging at the column inlet frit. | Install an inline filter; filter all samples and mobile phases through a 0.22 µm membrane [45] [46]. |
| Ghost Peaks / Baseline Instability | Contaminants leaching from the system or sample. | Install a ghost peak trap column between the mixer and degasser [46]. Ensure thorough mobile phase degassing [46]. |
Guide: Preventing and Recovering from Column Degradation
Column degradation is often accelerated by crude samples. Proper maintenance can restore performance and extend column lifespan.
Essential Maintenance Protocols [45]
- Post-Use Washing Protocol: After analysis, flush the column with 20-30 mL (10-20 column volumes) of a strong organic solvent like 100% methanol or acetonitrile, followed by a flush with your storage solvent (e.g., 70% methanol in water) [45].
- Preventing Hydrophobic Collapse: Never store or extensively flush a reversed-phase C18 column with 100% water. The hydrophobic stationary phase can "de-wet," causing a permanent loss of retention and efficiency. Always maintain at least 5-10% organic solvent [45].
- Re-wetting a De-wetted Column: If you suspect de-wetting, flush the column with 95-100% of a strong organic solvent like acetonitrile or isopropanol for several column volumes before gradually returning to the analytical mobile phase [45].
Decision Framework: Recondition vs. Replace [45] Consider reconditioning if issues are due to minor contamination, hydrophobic collapse, or insufficient equilibration. Consider replacement if performance issues (poor efficiency, high backpressure, irreproducible results) persist after thorough washing and troubleshooting, or if the column has suffered irreversible physical damage.
Frequently Asked Questions (FAQs)
Q1: What are the clear signs that my HPLC column is performing poorly? Key indicators include broad or tailing peaks, shifting retention times, a steady increase in system backpressure, inconsistent peak areas, and an unstable baseline [45].
Q2: How can I prevent "carryover" in my analyses? Carryover is often caused by contaminants adsorbed on the column or in the autosampler. To prevent it, implement a rigorous strong solvent flush as part of your post-run washing protocol [45]. Furthermore, using a ghost peak trap column can remove hidden impurities in the system that contribute to carryover [46].
Q3: My column is clogged. Can I reverse the flow to clear it? Flow reversal can sometimes dislodge particles clogging the inlet frit. However, this is a last-resort measure, as it can disrupt the packed bed integrity and cause irreversible channeling, permanently damaging the column. Always try extensive flushing in the normal direction first [45].
Q4: How does injection volume affect my separation of crude samples? Injecting too large a volume can lead to "volume overloading," which causes peak broadening and fronting, ultimately reducing resolution [47]. A general rule is to keep the injection volume below 1-2% of the total column void volume, especially for isocratic methods. For a standard 50 x 2.1 mm UHPLC column, this translates to roughly 1.2-2.4 µL [47]. Always empirically test the impact of injection volume on critical peak pair resolution.
Q5: What is the single most important step in preparing a crude sample? Filtration. Always filter your samples through a 0.22 µm or 0.45 µm syringe filter before injection. This removes insoluble particulates that are the primary cause of column clogs and frit blockages [46].
Experimental Protocols for Robust Analysis
Optimized Sample Preparation for Complex Matrices
The following protocol, adapted from a study on cannabis extracts, demonstrates an optimized approach for handling challenging, lipid-rich crude samples [48]. This ultrasound-assisted liquid-liquid extraction (UA-LLE) is designed to be efficient and fast.
Methodology [48]:
- Sample Homogenization: Mix the crude sample (e.g., 100 mg of oil) thoroughly with an internal standard.
- Ultrasound-Assisted Extraction: Add a methanol/hexane (9:1 v/v) extraction mixture.
- Agitation and Sonication: Subject the mixture to agitation (e.g., 400 rpm) followed by sonication in an ultrasound bath. Experimental designs have identified agitation and sonication time as the most significant parameters for extraction efficiency [48].
- Centrifugation: Centrifuge the samples to separate phases.
- Filtration: Filter the extract through a 0.22 µm membrane filter before UFLC analysis.
Validated UFLC-DAD Method for Multi-Analyte Determination
This protocol, validated for sugar-free beverages, provides a framework for a precise and accurate UFLC-DAD analysis of multiple additives in a complex matrix, relevant to pharmaceutical and food science research [25].
Chromatographic Conditions [25]:
- Column: Reversed-phase C18 (e.g., 150 mm × 4.6 mm, 5 µm).
- Mobile Phase: Gradient of acetonitrile (A) and phosphate buffer (12.5 mM, pH = 3.3) (B).
- Gradient Program: 5% A to 50% A over 10 min, held for 5 min, then re-equilibrated.
- Flow Rate: 1.5 mL/min.
- Injection Volume: 10 µL.
- Column Temperature: 30 °C.
- Detection: DAD, wavelength range 200–380 nm.
Sample Preparation [25]:
- Carbonated Drinks: Sonicate for 15 min to degas.
- Viscous Samples (e.g., Fruit Nectars): Centrifuge for 20 min at 6000×g.
- Final Preparation: Dilute all sample aliquots 5-fold with H2O and filter through a 0.22 µm PVDF membrane prior to injection.
Validation Data [25]:
- Linearity: All analytical curves showed R² ≥ 0.9995.
- Accuracy: Recovery values in real samples ranged from 94.1 to 99.2%.
- Precision: Intra- and inter-day relative standard deviations were ≤ 2.49%.
Workflow and Toolkit
Sample Preparation and Analysis Workflow
The diagram below outlines a logical workflow for handling crude samples, integrating preventive measures and key decision points.
Research Reagent Solutions
This table details essential materials and reagents for preparing and analyzing crude samples, as cited in the research.
| Item | Function / Application | Example from Literature |
|---|---|---|
| 0.22 µm PVDF Membrane Filter | Removes insoluble particulates from samples and mobile phases to prevent system clogs and column damage [25] [46]. | Used in UFLC-DAD analysis of beverages [25]. |
| Guard Column | Protects the expensive analytical column by trapping strongly retained contaminants and particulates from crude samples [46]. | Recommended for preserving column lifetime when analyzing complex matrices [46]. |
| Ghost Peak Trap Column | Placed between the mixer and degasser to remove hidden impurities from the mobile phase or system, reducing ghost peaks and baseline noise [46]. | Applied to resolve ghost peaks and improve baseline stability in impurity analysis [46]. |
| High-Purity Solvents (HPLC Grade) | Ensures low UV background noise and prevents introduction of impurities that can cause baseline drift or artifact peaks [46]. | HPLC grade acetonitrile and methanol used for mobile phase preparation [25] [48]. |
| Phosphate Buffer (pH 3.3) | Provides buffering capacity to control mobile phase pH, which is critical for reproducible retention of ionizable compounds [25]. | 12.5 mM phosphate buffer used for separation of sweeteners, preservatives, and caffeine [25]. |
| Methanol/Hexane (9:1 v/v) | Effective solvent mixture for ultrasound-assisted liquid-liquid extraction (UA-LLE) of non-polar to semi-polar analytes from oily matrices [48]. | Used for optimized extraction of neutral cannabinoids from cannabis herbal extracts [48]. |
Method Validation and Comparative Analysis: Ensuring Regulatory Compliance and Performance
Comprehensive Validation of Optimized Methods per ICH and FDA Guidelines
This technical support center provides troubleshooting guides and FAQs to help researchers address specific issues encountered during the validation of analytical methods, with a focus on optimizing injection volume and sample preparation for UFLC-DAD research.
Troubleshooting FAQs: Method Validation and Optimization
1. My UFLC peaks are broad or show fronting. What should I check?
- Injection Volume: Begin by verifying that your injection volume is between 1-5% of the total column volume. Exceeding this range often causes peak fronting and broadening due to column overloading [49].
- Sample Diluent: Ensure your sample diluent matches the initial mobile phase conditions in solvent strength. A mismatch, especially a stronger diluent, causes the sample to load as a diffuse band at the head of the column, degrading peak shape [49] [50]. For isocratic methods, a weaker diluent than the mobile phase can help pre-concentrate the sample and sharpen peaks [50].
2. How can I improve the sensitivity and resolution of my UFLC method for trace analysis?
- Minimize Extra-Column Volume: System dwell volume, particularly from the injector loop, causes sample dispersion. Implement an injector program to bypass the loop after sample loading to reduce this volume [50].
- Optimize Sample Preparation: For complex matrices, the extraction method is critical. Liquid-liquid extraction (LLE) has been demonstrated to provide higher recovery rates and lower matrix effects compared to QuEChERS and lyophilization for certain analytes, improving the accurate detection of trace components [51].
3. My method's performance is inconsistent between validation and study samples. What could be wrong?
- Robustness Testing: A robust method should produce consistent results under small, deliberate variations in chromatographic conditions (e.g., pH, mobile phase composition, flow rate). Failure to optimize and test for robustness during development can lead to irreproducible data [52].
- Matrix Effects: Validate your method using multiple lots of the biological matrix (e.g., plasma, urine) to assess and rule out interference from endogenous substances. The use of stable isotopically labeled internal standards (SIL-IS) is highly recommended to compensate for these effects [52].
4. What are the key regulatory focus areas for FDA submission of a bioanalytical method?
- Adherence to ICH M10: The FDA expects compliance with ICH M10 guidance for bioanalytical method validation. This includes comprehensive validation of selectivity, sensitivity, linearity, accuracy, precision, and stability [53] [52].
- Stability Demonstration: You must provide rigorous stability data for the analyte under various conditions, including benchtop, freeze-thaw, and long-term storage [52].
- Comprehensive Documentation: Maintain complete and meticulous records of method development, validation, instrument maintenance, and study conduct to ensure data integrity [52].
Experimental Protocols for Key Validation Experiments
Protocol 1: Optimizing Injection Parameters for Peak Shape
This protocol is designed to systematically address peak broadening and fronting issues.
1. Materials and Equipment
- UFLC system with DAD detector
- Analytical column (e.g., C18, 1.6 µm particle size)
- Test analyte and sample matrix
- Different solvent types for diluent preparation (e.g., water, acetonitrile, methanol)
2. Experimental Procedure
- Step 1: Determine Column Volume. Calculate the total column volume based on column dimensions.
- Step 2: Injection Volume Scoping. Inject the analyte at volumes of 1%, 3%, 5%, and 10% of the column volume. Keep all other method parameters constant [49].
- Step 3: Diluent-Mobile Phase Matching. Prepare sample diluents with organic strength that is weaker than, matching, and stronger than the initial mobile phase. Perform injections with the optimized volume from Step 2 [50].
- Step 4: Data Analysis. Compare peak symmetry, width, and resolution across the different experiments.
3. Data Interpretation
- Optimal Injection Volume: The largest volume that does not cause significant peak fronting or broadening (typically within the 1-5% range) [49].
- Optimal Diluent: The solvent that provides the sharpest peaks and highest efficiency, typically one that is slightly weaker than or matches the initial mobile phase [50].
Protocol 2: Validation of Sample Preparation Efficiency
This protocol evaluates different extraction techniques to maximize analyte recovery and minimize matrix effects.
1. Materials and Equipment
- Biological samples (e.g., urine, plasma, plant oils)
- Standard solutions of target analytes
- Equipment for LLE, QuEChERS, and SPE
- UFLC-MS/MS or UFLC-DAD system for analysis
2. Experimental Procedure (Adapted from [51])
- Step 1: Sample Fortification. Fortify multiple aliquots of the blank matrix with known concentrations of the analyte.
- Step 2: Parallel Extraction. Process the fortified samples using LLE, QuEChERS, and/or SPE methods. For example, for LLE: mix 200 µL of sample with 800 µL of cold ethyl acetate, shake, centrifuge, and evaporate the supernatant under nitrogen before reconstitution [51].
- Step 3: Analysis. Analyze all extracted samples alongside non-extracted standards (in solvent) using the optimized UFLC method.
- Step 4: Calculation. Calculate the recovery percentage for each method by comparing the peak area of the extracted fortified sample to the non-extracted standard.
3. Data Interpretation
- Recovery:
(Peak Area of Extracted Fortified Sample / Peak Area of Non-extracted Standard) * 100. Aim for consistent and high recovery (e.g., 93-102% as achieved in [51]). - Precision: Calculate the relative standard deviation (RSD) of replicate extractions. The method with the highest recovery and most precise repeatability (lowest RSD) is optimal [51].
The table below summarizes key acceptance criteria for fundamental validation parameters as per regulatory expectations [52].
Table 1: Key Bioanalytical Method Validation Parameters and Targets
| Validation Parameter | Description | Typical Acceptance Criterion |
|---|---|---|
| Accuracy | Closeness of measured value to true value | Within ±15% of nominal value for QC samples (±20% at LLOQ) |
| Precision | Degree of scatter in repeated measurements | RSD ≤15% for QC samples (≤20% at LLOQ) |
| Linearity | Ability to produce results proportional to concentration | Correlation coefficient (R²) ≥0.99 |
| Lower Limit of Quantification (LLOQ) | Lowest measurable concentration with acceptable accuracy and precision | Signal-to-noise ratio ≥5, accuracy and precision within ±20% |
| Calibration Curve Points | Number of non-zero standard concentrations | Minimum of 6-8 points, including LLOQ and ULOQ |
The Scientist's Toolkit: Research Reagent Solutions
Table 2: Essential Reagents and Materials for UFLC Method Validation
| Item | Function / Purpose | Example Application |
|---|---|---|
| C18 Chromatographic Column | Separation of analytes based on hydrophobicity. Core-shell particles can offer high efficiency [50]. | Universal workhorse for reversed-phase LC; used in separating tocopherols, tocotrienols, and DAP metabolites [20] [51]. |
| Stable Isotopically Labeled Internal Standards (SIL-IS) | Compensates for variability in sample preparation and matrix effects, improving accuracy and precision [52]. | Essential for robust quantitative bioanalysis in biological matrices like plasma and urine. |
| Different Solvent Types (e.g., ACN, MeOH, Water) | Used to prepare mobile phases and sample diluents. Matching diluent strength to the mobile phase is critical for peak shape [49]. | Optimizing injection conditions to prevent peak broadening and splitting. |
| Extraction Solvents (e.g., Ethyl Acetate) | Used in Liquid-Liquid Extraction (LLE) to isolate analytes from complex biological matrices [51]. | Achieving high recovery rates (e.g., 93-102%) for pesticide metabolites in urine [51]. |
Method Validation and Optimization Workflow
The diagram below outlines the logical workflow for developing and validating a robust analytical method.
Evaluating Greenness and Sustainability of Sample Preparation and Chromatographic Methods
For researchers in drug development, balancing analytical performance with environmental responsibility is a growing priority. The principles of Green Analytical Chemistry (GAC) provide a framework for reducing the environmental impact of chromatographic methods, focusing on minimizing hazardous waste, reducing energy consumption, and improving overall safety [54]. This technical support center addresses the specific challenges you might encounter when implementing these principles in your UFLC DAD research, with a particular focus on optimizing injection volume and sample preparation to achieve both sustainability and high-quality results.
Green Assessment Metrics: A Researcher's Toolkit
Before troubleshooting specific issues, it is essential to understand how to measure the environmental impact of your methods. Several standardized metrics have been developed to evaluate and compare the greenness of analytical procedures.
Table 1: Key Greenness Assessment Metrics for Analytical Methods
| Metric Name | Output Format | Main Focus | Notable Features | Reference |
|---|---|---|---|---|
| Analytical Eco-Scale | Score (100 = ideal) | Reagent toxicity, energy, waste | Penalty-point system; simple and semi-quantitative | [54] |
| GAPI (Green Analytical Procedure Index) | Color-coded pictogram | Entire analytical workflow | Visual summary of environmental impact across all steps | [54] [55] |
| AGREE (Analytical GREEnness) | Radial chart & score (0-1) | All 12 GAC principles | Holistic, single-score output; user-friendly software | [54] [56] |
| AGREEprep | Pictogram & score | Sample preparation | First dedicated metric for sample preparation | [54] [57] |
| BAGI (Blue Applicability Grade Index) | Score & "asteroid" pictogram | Practical/economic applicability | Assesses practical viability in real-world labs | [54] |
These tools help quantify your method's sustainability. For instance, a recent study evaluating standard methods from CEN, ISO, and Pharmacopoeias found that 67% scored below 0.2 on the AGREEprep scale (where 1 is the highest), highlighting a significant need for modernization [57].
Troubleshooting Common Issues in Green Method Development
FAQ: How can I reduce solvent waste in my UFLC methods without compromising sensitivity?
Answer: The most effective strategy is miniaturization and solvent substitution.
- Adopt Micro-Scale Techniques: Utilize techniques like micro-extraction for sample preparation. A recent study successfully used a miniaturized headspace solid-phase microextraction (HS-SPME) method with only 0.20 g of sample, eliminating the need for solvents entirely [56].
- Replace Hazardous Solvents: Substitute traditional, hazardous solvents like acetonitrile with safer, bio-based alternatives where chromatographically feasible [54].
- Optimize Chromatographic Conditions: Use narrower and shorter columns (e.g., 50 mm x 2.1 mm) packed with sub-2μm or core-shell particles. These columns require lower flow rates and shorter run times, drastically reducing solvent consumption per analysis [54] [58].
FAQ: My peaks are broad when I try to use low injection volumes. What is the cause and solution?
Answer: Broad peaks from low injection volumes are often due to injection-band broadening or suboptimal sample diluent.
- Problem: The instrument's injector and connecting tubing contribute to band spreading (extra-column volume), which is especially detrimental when using high-efficiency columns and small injection volumes [58] [59].
- Solution:
- Optimize Sample Diluent: Ensure your sample is dissolved in a solvent that is weaker than the initial mobile phase composition. This allows the analytes to focus at the head of the column, resulting in a tighter band and sharper peaks [60] [59].
- Use Injector Programming: For advanced users, instrument methods can be programmed to bypass the injector loop after the sample is loaded, effectively reducing the system's dwell volume and the associated band broadening [59]. This technique, outlined in Table 2, can be implemented on many modern UFLC systems.
Table 2: Example Injector Programming Steps to Reduce Band Broadening
| Step | Command | Comment |
|---|---|---|
| 1 | DRAW | Draw the specified injection volume from the vial. |
| 2 | INJECT | Introduce the sample into the flow path. |
| 3 | WAIT | Flush the sample loop (wait time = 6x (injection volume + 5 μL) / flow rate). |
| 4 | VALVE bypass | Direct flow from pump to column, bypassing the injection valve to exclude its volume. |
| 5 | WAIT 1.5 min | Maintain the bypass for a specified period of the run. |
| 6 | VALVE mainpass | Switch the valve back to include the injector loop in the flow to prepare for the next injection. |
FAQ: How do I balance the high energy consumption of my UHPLC-MS/MS system with green principles?
Answer: This is a recognized trade-off. The key is to maximize the output and efficiency of the system to justify its energy use.
- Acknowledge the Trade-off: GC-Q-TOF and UHPLC-MS/MS instruments are significant energy consumers, with one GC-Q-TOF system reported to use over 1.5 kWh per sample [56]. This high energy demand is often a necessary compromise for achieving the required sensitivity and selectivity.
- Maximize Throughput: To improve energy efficiency, focus on strategies that increase sample throughput. This can be achieved by:
Optimizing Injection Volume: A Detailed Protocol
A critical step in greener UFLC methods is optimizing the injection volume to maximize signal without causing volume overloading, which leads to peak broadening and lost resolution.
Principle: The goal is to find a "sweet spot" – a balance between detection limit (sensitivity) and chromatographic resolution [60].
Step-by-Step Experimental Protocol
- Initial Setup: Start with the smallest volume your autosampler can inject reproducibly (e.g., 0.5 - 1 µL).
- Column Volume Calculation: Calculate your column's void volume (V₀). A common rule of thumb is that the injection volume should be between 1% and 2% of V₀ to avoid volume overloading. For a standard 50 x 2.1 mm column with a V₀ of ~120 µL, this translates to 1.2 - 2.4 µL [60].
- Empirical Testing:
- Prepare your sample at a standard concentration (~1 µg/µL).
- Inject a series of volumes, systematically doubling the volume each time (e.g., 1 µL, 2 µL, 4 µL) until you reach approximately 3% of the column's void volume.
- Data Analysis:
- For each injection, calculate the resolution (Rs) of a critical peak pair and the signal-to-noise ratio (S/N).
- Plot the resolution and S/N against the injection volume.
- Identify the Compromise: The optimal injection volume is typically at the point where the S/N is acceptable, but before a significant drop in resolution is observed. Be prepared to accept a compromise between these two parameters [60].
Note: Isocratic methods are much more prone to volume overloading effects than gradient methods [60].
Essential Research Reagent Solutions for Green UFLC
Table 3: Key Materials for Sustainable Chromatographic Methods
| Item / Solution | Function | Green/Sustainable Rationale |
|---|---|---|
| Core-Shell Particle Columns | High-efficiency chromatographic separation | Provide UHPLC-level performance on conventional HPLC instruments, reducing backpressure and energy consumption [58]. |
| Safer Solvent Alternatives | Mobile phase and sample reconstitution | Replacing toxic acetonitrile with ethanol or other green solvents reduces hazardous waste and occupational risk [54] [55]. |
| Solid-Phase Microextraction (SPME) Fibers | Solvent-free sample preparation | Eliminates the use and disposal of large volumes of organic solvents during extraction [56]. |
| Automated Parallel Processing Systems | High-throughput sample preparation | Enables the simultaneous preparation of multiple samples, reducing energy and solvent consumption per sample [57]. |
Workflow for Developing a Green and Sustainable UFLC Method
The following diagram visualizes the decision-making process for developing a greener chromatographic method, integrating greenness assessment with practical optimization.
Transitioning to greener and more sustainable chromatographic methods is an iterative process that requires careful consideration of both environmental impact and analytical performance. By leveraging the troubleshooting guides, experimental protocols, and assessment tools provided in this technical support center, researchers and drug development professionals can systematically optimize their UFLC DAD methods. The journey towards sustainability is continuous, driven by innovation and a commitment to reducing the environmental footprint of analytical science.
In the context of a broader thesis on optimizing injection volume and sample preparation for Ultra-Fast Liquid Chromatography with Diode Array Detection (UFLC-DAD) research, this technical support center addresses the critical need for efficient chromatographic methods. The drive for higher throughput in pharmaceutical and bioanalytical laboratories necessitates a paradigm shift from traditional High-Performance Liquid Chromatography (HPLC) to more advanced techniques like UFLC. This transition focuses on achieving significant reductions in analysis time and solvent consumption without compromising data quality, resolution, or sensitivity. This guide provides targeted troubleshooting and frequently asked questions to help researchers, scientists, and drug development professionals overcome specific challenges encountered during method development and routine analysis, enabling robust and high-throughput UFLC-DAD operations.
Performance Benchmarking: UFLC vs. Traditional HPLC
Ultra-Fast Liquid Chromatography (UFLC) represents a significant evolution from traditional HPLC, primarily through the use of columns packed with smaller particles (often sub-2-µm) and instrumentation capable of operating at higher pressures. This advancement directly enhances key performance metrics crucial for modern laboratories.
Table 1: Comparative Performance Metrics: UFLC vs. Traditional HPLC
| Performance Metric | Traditional HPLC | UFLC | Experimental Context and Conditions |
|---|---|---|---|
| Typical Analysis Time | 10 - 60 minutes [61] [62] | ~0.5 - 5 minutes [39] [61] | Isocratic separation of Rosmarinic Acid: 14 min (HPLC) vs. 3.5 min (UFLC) [61] |
| Gradient Run Time | 30 - 45 minutes [62] | ~27 minutes (including re-equilibration) [39] | Determination of Orotic Acid in milk using a binary gradient [39] |
| Solvent Consumption per Run | High (e.g., 45 mL/run) [62] | Significantly Lower (e.g., < 10 mL/run) [61] | Calculated for a 45-min run at 1.0 mL/min vs. a 3.5-min run at 0.8 mL/min [61] [62] |
| Theoretical Plates (Efficiency) | ~10,000 for a 150 mm column [63] | ~15,000 in 4-second dead time [63] | Achievable maximum for a t0=4s separation using three-parameter optimization [63] |
| Typical Particle Size | 3 - 5 µm [63] [62] | 1.7 - 2.6 µm [39] [61] [63] | As reported in method descriptions for C18 columns [39] [61] [62] |
The data in Table 1 demonstrates that UFLC facilitates a dramatic increase in sample throughput by reducing analysis times by up to an order of magnitude. Furthermore, the substantial reduction in solvent consumption per run not only lowers operational costs but also minimizes the environmental impact of analytical operations, aligning with the principles of green chemistry.
UFLC Troubleshooting Guide and FAQs
This section addresses common practical challenges faced during UFLC-DAD analysis, providing targeted solutions to ensure optimal system performance.
Frequently Asked Questions (FAQs)
Q1: Our method was transferred from a conventional HPLC system to a UFLC system, but we are not achieving the expected resolution. What could be the cause? A1: This is a common issue. The higher efficiency of UFLC columns can reveal limitations in the instrument itself. The most likely cause is extra-column volume [4]. This includes the volume in capillary connections, the injector, and the detector flow cell. On a UFLC system, this volume should be minimized as much as possible. Ensure that the inner diameter of connecting capillaries is appropriate (e.g., 0.13 mm for UHPLC) and that all connections are tight and dead-volume-free [4].
Q2: We observe peak broadening, especially for early-eluting peaks. How can this be resolved? A2: Peak broadening, particularly for early peaks, is a classic symptom of excessive extra-column volume [4]. To address this:
- Check Capillaries: Use short capillaries with the smallest feasible inner diameter.
- Detector Flow Cell: Ensure the detector flow cell volume is not too large. It should not exceed 1/10 of the volume of the smallest peak of interest [4].
- Detector Time Constant: Select a detector response time (time constant) that is less than 1/4 of the width of the narrowest peak at half-height [4].
Q3: What is the best way to maximize efficiency (plate count) in a very short analysis time? A3: Achieving maximum efficiency under time constraints requires a systematic optimization approach that goes beyond just adjusting flow rate. A stepwise procedure is recommended [63]:
- Fix Particle Size and Length: Choose a commercially available column (e.g., 50 mm long, 1.8 µm particles).
- Optimize Velocity and Length: For your target analysis time (t0) and maximum system pressure (Pmax), calculate the optimal column length (Lopt) and linear velocity (uopt) using the Poppe plot (kinetic plot) method [63]. This often involves using a longer column than initially presumed, operated at a velocity higher than the van Deemter optimum.
- Consider Three Parameters: The absolute maximum performance is achieved by simultaneously optimizing particle size, column length, and velocity (the Knox-Saleem limit), though this may require custom column configurations [63].
Symptom-Based Troubleshooting Table
| Symptom | Possible Cause | Recommended Solution |
|---|---|---|
| No Peaks / Flat Baseline | No injection, detector or data transfer failure, high background noise. | Ensure sample is drawn into the loop. Inject a known test substance without a column to check detector response. Check mobile phase quality and degassing [4]. |
| Tailing Peaks | Secondary interactions with silanol groups, chelation with trace metals, column degradation. | Use high-purity silica (type B) or polar-embedded phase columns. Add a competing base (e.g., triethylamine) or chelating agent (e.g., EDTA). Replace the column if degraded [4]. |
| Fronting Peaks | Column overload, channels in the column, sample dissolved in a solvent stronger than the mobile phase. | Reduce the amount of sample injected. Dissolve the sample in the starting mobile phase composition. Replace the column if channels have formed [4]. |
| Low Recovery / Poor Quantitation | Sample adsorption/degradation, contaminated autosampler, air in fluidics. | Use appropriate sample storage (e.g., thermostatted autosampler). Check and flush autosampler fluidics for air or clogging (e.g., in the needle). Replace deformed or clogged injector needles [4]. |
| Retention Time Drift | Insufficient buffer capacity, column temperature mismatch, contaminated eluents. | Increase buffer concentration. Use an eluent pre-heater to ensure consistent temperature. Replace with fresh, HPLC-grade solvents and buffers to prevent bacterial growth [4]. |
Detailed Experimental Protocols for High-Throughput UFLC-DAD
The following protocols, adapted from recent literature, provide detailed methodologies for reproducible sample preparation and analysis using UFLC-DAD.
Protocol 1: Determination of Orotic Acid in Milk [39]
This protocol exemplifies a robust and simple sample preparation for a complex biological matrix (milk), resulting in a precise and accurate UFLC-DAD analysis.
Research Reagent Solutions:
- Solvent A: 0.02 M Sodium Dihydrogen Phosphate (NaH₂PO₄), buffered to pH 2.2 with 10% ortho-phosphoric acid. Must be filtered through a 0.2 µm membrane filter.
- Solvent B: Super-gradient HPLC grade Acetonitrile.
- Sample Solvent: Acetonitrile and Ultrapure Water.
- Standard: ≥98% Orotic Acid.
Sample Preparation:
- Treat the milk sample with acetonitrile in a 1:1 (v/v) ratio.
- Centrifuge the resulting mixture at 4 °C.
- Dilute 1 mL of the obtained supernatant with 9 mL of ultrapure water.
- Filter the final solution through a 0.45 µm membrane filter prior to injection.
Chromatographic Conditions:
- Columns: Two Kinetex C18 columns (1.7 µm, 150 mm × 2.1 mm) in series, with a C18 guard column.
- Mobile Phase: Gradient elution (see Table 2 for details).
- Flow Rate: Not specified in extract, but typical for such columns is 0.2-0.4 mL/min.
- Column Temperature: 35 °C.
- Injection Volume: 0.5 - 6 µL.
- DAD Detection: 278 nm.
- Run Time: 27 minutes (including re-equilibration).
Table 2: Gradient Elution Program for Orotic Acid Analysis [39]
| Time (min) | Solvent A (%) | Solvent B (%) | Function |
|---|---|---|---|
| 0.01 | 100 | 0 | - |
| 10.00 | 95 | 5 | - |
| 15.00 | 80 | 20 | - |
| 20.00 | 50 | 50 | - |
| 25.00 | 50 | 50 | - |
| 25.10 | 100 | 0 | - |
| 27.00 | 100 | 0 | Re-equilibration |
Protocol 2: High-Throughput Vibration and Vortex-Assisted MSPD for Isoflavones [64]
This protocol showcases an advanced, efficient sample preparation technique that aligns with the need for high throughput in the analysis of complex traditional medicine matrices.
Research Reagent Solutions:
- Sorbent: SBA-3 mesoporous silica.
- Eluting Solvent: Methanol/Water (80:20, v/v).
- HPLC Mobile Phase: Typically a gradient of methanol-water with 0.1% formic acid.
- Standards: Genistein, Genistin, Daidzein, Daidzin.
Sample Preparation (VVA-MSPD):
- Weigh 20 mg of the powdered sample and 40 mg of SBA-3 sorbent directly into a 2.0 mL micro-centrifuge tube.
- Add a 5 mm ceramic bead and crush the mixture using a ball mill machine for 2 minutes at a vibration frequency of 800 times per minute.
- Add 1.5 mL of Methanol/Water (80:20, v/v) eluting solvent.
- Vortex the mixture for 3 minutes to achieve extraction.
- The supernatant can be directly filtered and injected into the UFLC-DAD system.
Chromatographic Conditions (Typical for such analyses):
- Column: C18 column (e.g., 100 mm x 2.1 mm, sub-2-µm).
- Mobile Phase: Gradient of methanol and water (with 0.1% formic acid).
- Flow Rate: 0.3 - 0.5 mL/min.
- Column Temperature: 40 °C.
- DAD Detection: 260 nm or 280 nm.
- Injection Volume: 1 - 5 µL.
Workflow Visualization and Research Toolkit
Visual Guide: High-Throughput UFLC-DAD Analysis Workflow
The following diagram illustrates the logical flow of steps involved in a high-throughput UFLC-DAD analysis, from sample preparation to data interpretation, highlighting critical optimization points.
Diagram 1: High-Throughput UFLC-DAD Analysis Workflow. Critical optimization points (diamonds) are shown for sample preparation, injection, and separation.
Essential Research Reagent Solutions
This table details key materials and reagents used in the featured protocols, with an explanation of their specific functions in the UFLC-DAD analysis workflow.
Table 3: Research Reagent Solutions for UFLC-DAD Analysis
| Reagent / Material | Function and Importance in UFLC-DAD Analysis |
|---|---|
| Sub-2-µm C18 Column | The core of UFLC performance. Provides high efficiency and resolution, enabling faster separations and higher peak capacity compared to traditional 3-5 µm columns [39] [61]. |
| SBA-3 Mesoporous Silica | A sorbent used in Vortex-Vibration-Assisted MSPD. It provides a large surface area for efficient extraction and clean-up of target analytes from complex solid samples in a high-throughput manner [64]. |
| HPLC-Grade Acetonitrile | A common organic modifier in reversed-phase chromatography. Its high purity is critical for low UV background noise, ensuring high sensitivity in DAD detection [39] [62]. |
| Acidified Aqueous Buffer (e.g., pH 2.2) | Used in the mobile phase to suppress the ionization of acidic analytes (like orotic acid), improving peak shape and enhancing retention and reproducibility [39]. |
| Phosphoric Acid / Trifluoroacetic Acid (TFA) | Mobile phase additives used to control pH and act as ion-pairing agents, which helps minimize peak tailing and improve separation efficiency for a wide range of compounds [39] [61] [62]. |
| Methanol (HPLC Grade) | A versatile organic solvent used in mobile phases and for sample preparation (e.g., extraction, dilution). Its UV cut-off is higher than acetonitrile, which must be considered for low-wavelength DAD detection [62] [64]. |
The successful implementation of UFLC-DAD for high-throughput analysis is contingent upon a holistic strategy that integrates instrument capability, column selection, and meticulous sample preparation. As demonstrated, optimizing for speed and efficiency requires careful attention to parameters such as extra-column volume, injection conditions, and gradient profile. The troubleshooting guides and detailed protocols provided here offer a practical framework for researchers to overcome common experimental hurdles. By adopting these optimized approaches, drug development professionals and scientists can significantly accelerate their analytical workflows, reduce solvent consumption, and enhance overall laboratory productivity without sacrificing the quality and reliability of their chromatographic data.
Conclusion
Optimizing injection volume and sample preparation is not merely a technical step but a foundational strategy for developing robust, sensitive, and efficient UFLC-DAD methods. By adopting a systematic approach grounded in QbD and DoE principles, researchers can effectively navigate the complexities of pharmaceutical and biological matrices. The integration of advanced sample cleanup, strategic volume selection, and thorough validation ensures methods meet rigorous regulatory standards while maximizing analytical performance. Future directions will likely involve greater automation, the adoption of greener chemistry principles, and the development of multi-dimensional LC systems to address increasingly complex analytical challenges in drug development and biomedical research, further solidifying UFLC-DAD's role as a versatile and powerful analytical tool.
References
- 1. Liner Volume Matters | LCGC International [https://www.chromatographyonline.com/view/liner-volume-matters]
- 2. The Role of the Injection Solvent | LCGC International [https://www.chromatographyonline.com/view/role-injection-solvent-0]
- 3. Optimizing Splitless Injections in Gas Chromatography, Part II: Band Broadening and Focusing Mechanisms | LCGC International [https://www.chromatographyonline.com/view/optimizing-splitless-injections-in-gas-chromatography-part-ii-band-broadening-and-focusing-mechanisms]
- 4. HPLC Troubleshooting Guide [https://www.thermofisher.com/us/en/home/industrial/chromatography/chromatography-learning-center/high-performance-liquid-chromatography-hplc-support/hplc-troubleshooting.html]
- 5. Optimization and Validation of a High Throughput UHPLC-MS ... [https://pmc.ncbi.nlm.nih.gov/articles/PMC8953077/]
- 6. UHPLC: Advancements and Challenges [https://lifesciences.danaher.com/us/en/products/chromatography-columns/topics/ultra-high-performance-liquid-chromatography-developments.html]
- 7. Development and Validation of HPLC-DAD and UHPLC ... [https://pmc.ncbi.nlm.nih.gov/articles/PMC6151785/]
- 8. TROUBLE SHOOTING DURING BIOANALYTICAL ... [https://pmc.ncbi.nlm.nih.gov/articles/PMC3255387/]
- 9. Research Assistant - Bohrium | AI for Science with Global Scientists [https://www.bohrium.com/paper-details/optimization-of-high-efficient-pre-column-sample-treatments-and-c18-uflc-method-for-selective-quantification-of-selected-chemical-forms-of-tocopherol-and-tocotrienol-in-diverse-foods/949074592251510834-1325]
- 10. Agilent 1100 HPLC DAD [http://www.chromforum.org/viewtopic.php?t=17734]
- 11. Antinociceptive and anti-inflammatory activities of the Jatropha isabellei... [https://pmc.ncbi.nlm.nih.gov/articles/PMC6130469/]
- 12. Methods for Changing Peak Resolution in HPLC [https://www.chromatographyonline.com/view/methods-changing-peak-resolution-hplc-advantages-and-limitations]
- 13. Troubleshooting GC peak shapes [https://www.elementlabsolutions.com/uk/chromatography-blog/post/gc-troubleshooting-peak-shapes]
- 14. Increase of the LC–MS/MS sensitivity and detection limits ... [https://www.sciencedirect.com/science/article/abs/pii/S157002320500245X]
- 15. Improve the resolution of the chromatographic peak - Forum [https://community.agilent.com/technical/lc/f/forum/6767/improve-the-resolution-of-the-chromatographic-peak]
- 16. Fast Sensitive and Accurate Analysis of the Most Common ... [https://link.springer.com/article/10.1007/s12161-022-02370-8]
- 17. Increasing chromatographic resolution of analytical signals ... [https://www.sciencedirect.com/science/article/abs/pii/S0039914018309585]
- 18. Analysis of bioactive compounds in Gardenia jasminoides ... [https://pmc.ncbi.nlm.nih.gov/articles/PMC12517822/]
- 19. Mitigating the effects of organic solvents in sample diluents ... [https://pubmed.ncbi.nlm.nih.gov/40288230/]
- 20. Optimization of high-efficient pre-column sample ... [https://www.sciencedirect.com/science/article/abs/pii/S030881462302527X]
- 21. Current and emerging strategies for subcutaneous delivery ... [https://pubmed.ncbi.nlm.nih.gov/40516697/]
- 22. Optimization of Phenolic Compound Extraction from Bee ... [https://link.springer.com/article/10.1007/s12161-025-02846-3]
- 23. Monoclonal antibody and protein therapeutic formulations ... [https://pmc.ncbi.nlm.nih.gov/articles/PMC10793682/]
- 24. High-throughput strategies for monoclonal antibody screening [https://jbioleng.biomedcentral.com/articles/10.1186/s13036-025-00513-z]
- 25. Optimization and validation of HPLC–DAD method for simultaneous analysis of sweeteners, preservatives, and caffeine in sugar-free beverages | European Food Research and Technology [https://link.springer.com/article/10.1007/s00217-023-04328-4]
- 26. Optimization of Mobile Phase for Simultaneous Determination of Sweeteners, Preservatives and Dyes by UFLC | Zenodo [https://zenodo.org/record/1246180]
- 27. Expert Guide to Troubleshooting Common HPLC Issues [https://aelabgroup.com/expert-guide-to-troubleshooting-common-hplc-issues/]
- 28. Feed injection in liquid chromatography: Reducing the ... [https://www.sciencedirect.com/science/article/pii/S0021967324005399]
- 29. HPLC 2025 Day 1: Automating The Analytical Laboratory [https://www.chromatographyonline.com/view/hplc-2025-day-1-automation]
- 30. Chromatography 2025: Sample Preparation Goes Automated [https://www.sepscience.com/chromatography-2025-sample-preparation-goes-automated-11259]
- 31. Automated multicolumn screening workflow in ultra-high ... [https://pubmed.ncbi.nlm.nih.gov/39163703/]
- 32. LC Troubleshooting Essentials: A Guide to Common ... [https://www.chromatographyonline.com/view/lc-troubleshooting-essentials-a-guide-to-common-problems-and-solutions-for-peak-tailing-ghost-peaks-and-pressure-spikes]
- 33. Effective LC Troubleshooting: Symptom-Based Strategies ... [https://www.restek.com/articles/effective-lc-troubleshooting-symptom-based-strategies-and-solutions?srsltid=AfmBOor6cEEZlrll9GPfqT4z9dUa_DRizc65ABA3yHY5jqtVEvAG9uUk]
- 34. Sample Preparation – HPLC [https://pccl.chem.ufl.edu/sample-preparation-hplc/]
- 35. Ion suppression correction and normalization for non-targeted ... [https://pmc.ncbi.nlm.nih.gov/articles/PMC11794426/]
- 36. Compensate for or Minimize Matrix Effects? Strategies ... [https://www.mdpi.com/1420-3049/25/13/3047]
- 37. Matrix effects demystified: Strategies for resolving ... [https://pubmed.ncbi.nlm.nih.gov/37897324/]
- 38. HPLC Troubleshooting Guide: 10 Common Issues and ... [https://www.linkedin.com/posts/haanjimishra_hplc-troubleshooting-analysis-activity-7373401767197360128-ky0G]
- 39. The Improved Method for Determination of Orotic Acid in ... [https://www.mdpi.com/2076-2615/11/11/3196]
- 40. Quantitative Evaluation of Models for Solvent-based, On ... [https://pmc.ncbi.nlm.nih.gov/articles/PMC4535311/]
- 41. Frequently Asked Questions FAQs HPLC and UHPLC [https://www.restek.com/articles/frequently-asked-questions-hplc-and-uhplc?srsltid=AfmBOooB6bCs30wZQgUflxyqMuRyl2s-oiGzKfSC7yFDG46AdEeWEmnF]
- 42. On-column and gradient focusing-induced high-resolution ... [https://www.sciencedirect.com/science/article/abs/pii/S0003267019304167]
- 43. Ultrahigh Performance Liquid Chromatography Analysis of ... [https://pubmed.ncbi.nlm.nih.gov/24279346/]
- 44. Advancements in Sample Preparation Methods for the ... [https://pmc.ncbi.nlm.nih.gov/articles/PMC10572225/]
- 45. HPLC Column Troubleshooting: Restore Performance & ... [https://www.labx.com/resources/hplc-column-troubleshooting-restore-performance-optimize-your-chromatography/26]
- 46. How to Prevent and Solve Resolution Loss in HPLC ... [https://uhplcs.com/how-to-prevent-and-solve-resolution-loss-in-hplc-workflows/]
- 47. HPLC Tips & Tricks: Optimizing Injection Volume [https://www.sigmaaldrich.com/US/en/technical-documents/technical-article/analytical-chemistry/small-molecule-hplc/optimizing-injection-volume?srsltid=AfmBOoqBkNwqzHzOQmtMFXXfU9XJUvXgt7xAvu8ifpG9ufTCpdadYexA]
- 48. Optimized Extraction Method for Neutral Cannabinoids ... [https://pmc.ncbi.nlm.nih.gov/articles/PMC11852687/]
- 49. LC Troubleshooting—Optimizing Your Injection to Improve ... [https://www.restek.com/videos/lc-troubleshooting-optimizing-your-injection-to-improve-peak-shape?srsltid=AfmBOoqqYMhIjbyfgv5sc69NaqOAfstfnKzSvEDSuYKmjghnhUdMPXtB]
- 50. LC Technical Tip: LC System Optimization [https://www.phenomenex.com/knowledge-center/hplc-knowledge-center/lc-system-optimisation-for-uhplc-performance-on-any-hplc?srsltid=AfmBOoqEbC5FzjViGZrJTPrMZCeRSzCOWPrlk2LQ7lxNdcNWLDLcPNX4]
- 51. Development and Validation of a New UFLC–MS ... [https://pmc.ncbi.nlm.nih.gov/articles/PMC10421278/]
- 52. Designing LCMS Studies with the FDA in Mind from the Start [https://www.agilexbiolabs.com/designing-lcms-studies-with-the-fda-in-mind-from-the-start/]
- 53. FDA Guidance for Industry on Bioanalytical Method ... [https://labs.iqvia.com/blog/fda-guidance-bioanalytical-method-validation-biomarkers]
- 54. Green Approaches in High-Performance Liquid ... [https://pmc.ncbi.nlm.nih.gov/articles/PMC12430196/]
- 55. Review Article Advances in green liquid chromatography ... [https://www.sciencedirect.com/science/article/abs/pii/S0026265X24015121]
- 56. A Sustainable Approach to Green Sample Preparation and ... [https://www.chromatographyonline.com/view/a-sustainable-approach-to-green-sample-preparation-and-analytical-performance-using-hs-spme-gc-qtof-ms]
- 57. HPLC 2025 Preview: The Road To Sustainable Analytical ... [https://www.chromatographyonline.com/view/hplc-2025-preview-the-road-to-sustainable-analytical-chemistry]
- 58. Performance optimizing injection sequence for minimizing ... [https://www.sciencedirect.com/science/article/abs/pii/S0021967312001355]
- 59. LC Technical Tip: LC System Optimization [https://www.phenomenex.com/knowledge-center/hplc-knowledge-center/lc-system-optimisation-for-uhplc-performance-on-any-hplc?srsltid=AfmBOoqEyTXNj_BoBN8ILSEOltvQc7BTe6WBvatAMDxguSIBIR7WsPgS]
- 60. HPLC Tips & Tricks: Optimizing Injection Volume [https://www.sigmaaldrich.com/US/en/technical-documents/technical-article/analytical-chemistry/small-molecule-hplc/optimizing-injection-volume?srsltid=AfmBOoqsra5O7oL_xXiodB60G1L_wTejhZ_60WA1yN2rr5CHHQXKdm_T]
- 61. A novel, simplified and stability-indicating high-throughput ... [https://www.sciencedirect.com/science/article/abs/pii/S157002321731927X]
- 62. High Performance Liquid Chromatography-Diode Array ... [https://pmc.ncbi.nlm.nih.gov/articles/PMC5307898/]
- 63. A Simple Approach to Performance Optimization in HPLC ... [https://www.chromatographyonline.com/view/simple-approach-performance-optimization-hplc-and-its-application-ultrafast-separation-development]
- 64. A Rapid High Throughput Vibration and Vortex-Assisted ... [https://pmc.ncbi.nlm.nih.gov/articles/PMC7665882/]