Overcoming Matrix Effects: Advanced Strategies for Metoprolol Extraction and Analysis in Pharmaceutical Formulations
This article provides a comprehensive overview of the technical challenges and advanced solutions for extracting and quantifying metoprolol from complex tablet matrices.
Overcoming Matrix Effects: Advanced Strategies for Metoprolol Extraction and Analysis in Pharmaceutical Formulations
Abstract
This article provides a comprehensive overview of the technical challenges and advanced solutions for extracting and quantifying metoprolol from complex tablet matrices. Aimed at researchers, scientists, and drug development professionals, it explores foundational obstacles like excipient interference, details modern microextraction and chromatographic methodologies, offers troubleshooting and optimization strategies for enhanced recovery, and discusses rigorous validation protocols and comparative technique analysis. The content synthesizes current research and green chemistry principles to deliver a practical guide for reliable metoprolol analysis in quality control and pharmaceutical development.
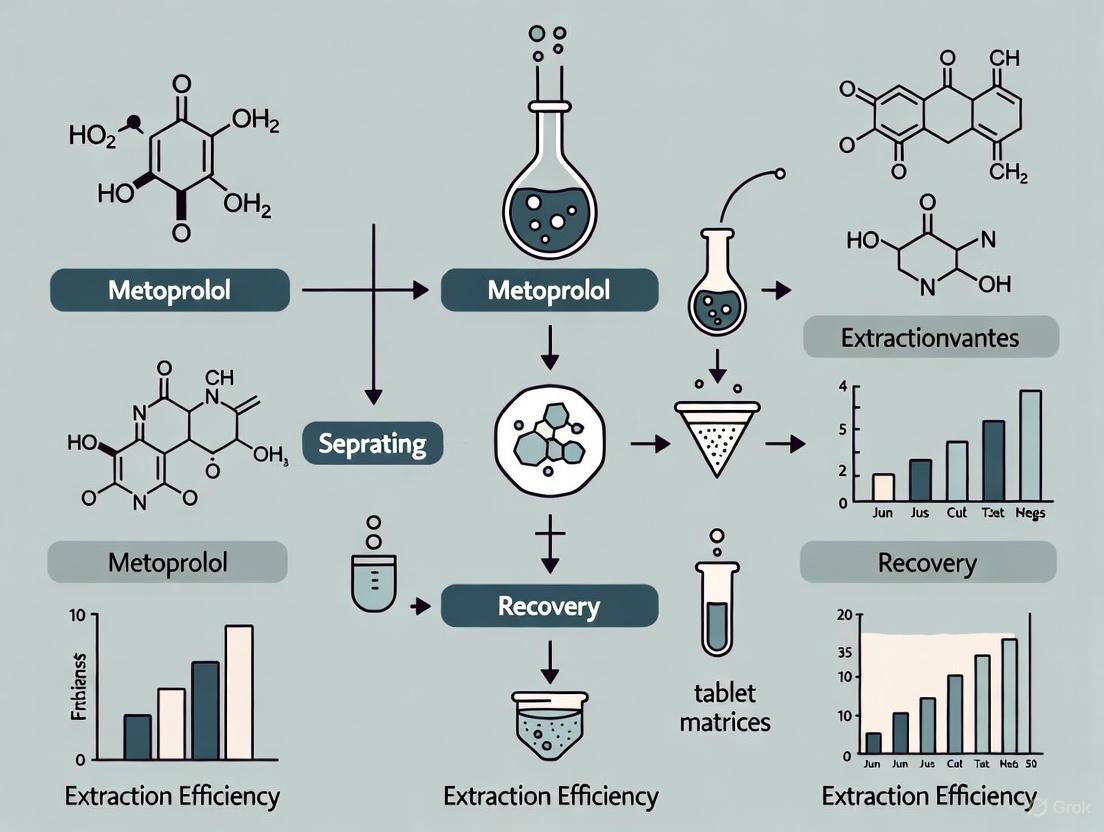
Understanding the Complexities: Metoprolol and Tablet Matrix Interference
Metoprolol, a selective β₁-adrenergic receptor blocking agent, is widely used in cardiovascular therapy for conditions including hypertension, angina, and heart failure [1]. To tailor its therapeutic application, metoprolol is formulated into different salt forms, primarily the tartrate and succinate salts, which exhibit distinct physicochemical and pharmacokinetic properties [2]. A core challenge in metoprolol research, particularly concerning extraction and analysis from solid dosage forms, stems from the intricate integration of the drug within complex polymeric matrices designed for controlled release [3] [4]. These advanced formulations are necessary to modulate the drug's release profile but consequently create significant hurdles for efficient drug extraction and analysis. This technical guide provides a comparative analysis of metoprolol salts, details experimental methodologies for formulation and evaluation, and discusses the implications for pharmaceutical research and development.
Chemical and Functional Comparison of Metoprolol Salts
The tartrate and succinate salts of metoprolol are not merely different in chemical structure but are strategically designed for specific clinical and manufacturing purposes. Metoprolol tartrate is typically used in immediate-release (IR) formulations, such as conventional tablets and injections. Its rapid absorption leads to a shorter duration of action, often requiring multiple daily doses, with a typical daily dosage ranging between 100 and 450 mg [2]. In contrast, metoprolol succinate is almost exclusively used in extended-release (ER) formulations. Its daily dosage ranges from an initial 25-100 mg to a maximum of 200 mg, administered just once per day [2]. This fundamental difference in release kinetics is the primary driver for their different clinical indications; while both are used for hypertension and angina, only the tartrate form is prescribed for post-heart attack management, and only the succinate form is indicated for chronic heart failure [2] [5].
Table 1: Key Characteristics of Metoprolol Tartrate vs. Succinate
| Characteristic | Metoprolol Tartrate | Metoprolol Succinate |
|---|---|---|
| Primary Formulation Type | Immediate-Release (IR) | Extended-Release (ER) |
| Standard Dosage Frequency | Multiple times per day | Once daily |
| Key Clinical Indications | Hypertension, Angina, Arrhythmia, Post-MI therapy | Hypertension, Angina, Chronic Heart Failure |
| Recommended Daily Dose | 100 - 450 mg | 25 - 200 mg (max) |
| Pharmacokinetic Profile | Rapid absorption, higher peak-to-trough variation | Slower, more consistent release profile |
Beyond clinical applications, the salt form significantly influences formulation design and processing. Research on injection-moulded sustained-release matrix tablets has demonstrated that the choice of salt (tartrate, succinate, or fumarate) directly impacts the optimal processing temperature, with tartrate requiring temperatures around 120-155°C depending on drug load [4]. Furthermore, the salt form affects the solid-state stability of the final dosage form. Studies have shown that while metoprolol tartrate forms stable solid solutions within Eudragit polymers, high drug loadings of metoprolol succinate and fumarate show a tendency to recrystallize during storage, posing a challenge for long-term formulation stability [4].
Formulation Strategies and Technical Challenges
Overcoming Solubility and Release Rate Challenges
A principal challenge in formulating metoprolol, a Biopharmaceutics Classification System (BCS) Class I drug (high solubility, high permeability), is controlling its rapid release from extended-release dosage forms [6] [7]. Without sophisticated formulation techniques, the drug can be released too quickly, leading to potential "dose dumping" and associated safety concerns [6]. To achieve a controlled, extended release profile that is robust against physiological variables, several advanced formulation strategies have been employed:
- Layered Matrix Tablets: These systems use swellable polymers as release-retardant layers. Research has evaluated polymers like carrageenan, HPMC, guar gum, and ethyl cellulose. A study found that a three-layered tablet with carrageenan provided a more linear, controlled release of metoprolol tartrate compared to a two-layered system, exhibiting a "super case II" release mechanism indicative of relaxation-driven drug release [3].
- Barrier Membrane (BM) Coated Matrices: This approach involves coating a hydrophilic matrix tablet with a permeable membrane. The BM-coated matrices are particularly effective at eliminating the initial burst release common in uncoated hydrophilic matrices. This design has shown robust drug release that is consistent even under varying physiological conditions, such as changes in agitation, osmolality, and surface tension, making it a promising alternative to more complex Osmotic Release Oral Systems (OROS) [6].
- Injection-Moulded Matrices: Utilizing polymers like Eudragit RL and RS, this hot-melt process allows for the creation of a solid solution or dispersion of the drug within the polymer. The ratio of the polymers (e.g., 70/30% Eudragit RL/RS) and the drug loading can be adjusted to fine-tune the release kinetics, which typically follow first-order patterns [4].
- Coated Mini-Tablets: This modern approach involves the production of small tablets (e.g., 3.0 mm diameter) that are subsequently coated with controlled-release polymer membranes. A key advantage is the ability to mix mini-tablets with different release characteristics (e.g., immediate and extended-release) within a single capsule to achieve a desired overall release profile [7].
Diagram: Workflow for Developing Extended-Release Metoprolol Formulations
The following diagram illustrates a generalized experimental workflow for the development and evaluation of extended-release metoprolol formulations, integrating concepts from the cited research:
Experimental Protocols for Formulation and Evaluation
Protocol 1: Preparation of Layered Matrix Tablets
This protocol is adapted from studies investigating swellable polymers for controlled release of metoprolol tartrate [3].
Objective: To fabricate two-layered or three-layered matrix tablets capable of providing zero-order release kinetics for twice-daily administration.
Materials:
- Active Pharmaceutical Ingredient (API): Metoprolol tartrate.
- Polymers: Carrageenan, Hydroxypropyl methyl cellulose (HPMC E4M), Pectin, Guar Gum, Xanthan Gum, Chitosan, Ethyl Cellulose (N7, N10, N100).
- Equipment: Single-punch hydraulic hand press (e.g., Carver Laboratory Press) with flat-faced punches (13 mm diameter), V-type powder mixer.
Methodology:
- Powder Blending: For the matrix layer, mix 150 mg of metoprolol tartrate with 150 mg of the selected polymer(s) using a V-type mixer for 10 minutes.
- Tablet Compression:
- For a Two-Layered Tablet:
- Place a pre-weighed amount (e.g., 150 mg) of polymer as the release-retardant layer into the die cavity.
- Apply a slight pre-compression for uniform spreading.
- Carefully add the matrix layer mixture (300 mg containing 150 mg drug + 150 mg polymer) over the bottom layer.
- Compress the full assembly at a defined pressure (e.g., 3,768 kg/cm² for 10 seconds).
- For a Three-Layered Tablet:
- Place a pre-weighed amount (e.g., 75 mg) of polymer as the bottom release-retardant layer and pre-compress.
- Add the matrix layer mixture and pre-compress again.
- Add the top release-retardant layer (e.g., 75 mg of polymer).
- Compress the entire three-layer structure.
- For a Two-Layered Tablet:
Evaluation:
- Tablets must be evaluated for weight variation, hardness, diameter/thickness ratio, friability, and drug content uniformity.
- In vitro drug release studies should be conducted using USP Apparatus 1 (basket) at 100 rpm in pH 1.2 HCl buffer for 2 hours, followed by pH 7.4 phosphate buffer.
Protocol 2: In-Vitro Drug Release Under Biorelevant Conditions
This protocol assesses formulation robustness by simulating physiological stresses, which is critical for predicting in vivo performance and ensuring consistent extraction profiles [6].
Objective: To evaluate the drug release performance of extended-release metoprolol formulations under physiologically relevant conditions simulating the fasted and fed states.
Materials:
- Test Formulations: Uncoated and barrier membrane (BM)-coated metoprolol tartrate matrix tablets.
- Dissolution Media: Fasted State Simulated Intestinal Fluid (FaSSIF), Fed State Simulated Intestinal Fluid (FeSSIF), media with varying osmolality (adjusted with NaCl) and surface tension (adjusted with surfactants like sodium lauryl sulfate (SLS) or Tween 80).
- Equipment: USP dissolution apparatus (paddle or basket), apparatus capable of simulating mechanical stress (e.g., incorporating alternating agitation intensities).
Methodology:
- Standard Dissolution Test: Perform tests according to standard protocols (e.g., USP Apparatus 2, 50-100 rpm, 37 ± 0.5°C) in FaSSIF and FeSSIF to establish a baseline profile.
- Media Property Variation: Conduct dissolution studies in Blank FaSSIF pH 6.8 with different osmolalities (e.g., 100, 200, 300 mOsm/kg) and different concentrations of ionic (SLS) and non-ionic (Tween 80) surfactants.
- Mechanical Stress Testing: Subject the formulations to dissolution tests with alternating agitation rates (e.g., between 50 and 100 rpm) or using specialized equipment that mimics the physical pressures and shear forces of the GI tract.
Analysis:
- Compare release profiles (e.g., time for 50%, 80%, and 100% release) across different test conditions.
- A robust formulation will show minimal sensitivity to changes in media properties and mechanical stress, indicating a lower risk of food effects or erratic in vivo absorption.
The Scientist's Toolkit: Key Research Reagents and Materials
The following table catalogues essential materials used in the development and analysis of metoprolol formulations, as featured in the cited experimental research.
Table 2: Essential Research Reagents and Materials for Metoprolol Formulation Research
| Reagent/Material | Function/Application | Example from Literature |
|---|---|---|
| Carrageenan | Swellable polymer for release-retardant layers in matrix tablets. Provides near zero-order release. | Used as a single polymer in two- and three-layered tablets [3]. |
| Hypromellose (HPMC) | Hydrophilic matrix former; primary polymer for controlling drug release via gel layer formation. | Used in high-viscosity grades (e.g., Methocel K100M) in matrix tablets and mini-tablets [6] [7]. |
| Eudragit RL/RS | Poly(meth)acrylate polymers for sustained release. RL is more permeable than RS. Used in injection-moulded matrices. | Formulated with different metoprolol salts to create solid solutions and control release rate [4]. |
| Kollicoat SR 30D | Aqueous polymeric dispersion for controlled-release coating of tablets or mini-tablets. | Used as a coating material on mini-tablets to modulate drug release [7]. |
| Triethyl Citrate (TEC) | Plasticizer; added to polymer coatings to improve flexibility, processability, and reduce brittleness. | Used in Eudragit-based injection-moulded formulations [4]. |
| Microcrystalline Cellulose | Diluent/Filler; provides bulk and improves compressibility in solid dosage forms. | Used as an excipient in the core formulation of mini-tablets [7]. |
| Magnesium Stearate | Lubricant; reduces friction during tablet ejection from the die. | A standard lubricant in compressed tablets and mini-tablets [3] [7]. |
Analytical and Modeling Approaches
Diagram: Integrated Development Using DoE and PBBM
The application of statistical design and computational modeling is a modern paradigm for rational formulation development. The following diagram outlines this integrated approach, which is highly relevant for optimizing complex metoprolol formulations and predicting their performance [7].
Advanced Analytical and Computational Techniques
The complexity of modern metoprolol formulations necessitates sophisticated analytical and computational tools for development and evaluation.
- Green Analytical Chemistry: There is a growing emphasis on developing sustainable analytical methods for metoprolol determination. Frameworks like the Analytical GREEnness Metric Approach (AGREE) and Green Analytical Procedure Index (GAPI) are used to assess and improve the environmental footprint of analytical methods, focusing on reducing hazardous chemicals, energy consumption, and solvent volumes [8].
- Physiologically Based Biopharmaceutics Modeling (PBBM): Software tools like GastroPlus allow researchers to create mechanistic models that link in vitro dissolution data to predicted in vivo* absorption profiles. This is instrumental in establishing a "safe space" for formulation performance and can support virtual bioequivalence (VBE) studies, especially for extended-release products that must demonstrate performance in both fasted and fed states [7].
- Design of Experiments (DoE): This statistical approach is critical for efficiently optimizing formulation parameters. For example, in developing coated mini-tablets, a DoE can systematically vary the percentages of controlled-release and pore-forming polymers in the coating to achieve a target dissolution profile, significantly rationalizing the development process [7].
The selection between metoprolol succinate and tartrate is a fundamental decision that dictates the therapeutic application, formulation strategy, and manufacturing process. The tartrate salt is synonymous with immediate-release profiles, while the succinate salt is engineered for extended-release. The primary challenge in researching these formulations, particularly concerning extraction from tablet matrices, lies in the sophisticated polymeric systems—from layered matrices and barrier membranes to injection-moulded solid dispersions—designed to tightly control drug release. A modern, efficient approach to navigating this complexity involves the integration of statistical experimental design (DoE) and computational modeling (PBBM). This integrated strategy not only accelerates development but also enhances the predictability of a formulation's in vivo performance, ensuring the delivery of safe, effective, and reliable metoprolol therapy to patients.
Common Tablet Excipients and Their Potential for Analytical Interference
The accurate quantification of active pharmaceutical ingredients (APIs) in solid dosage forms is a cornerstone of pharmaceutical analysis, crucial for quality control, stability testing, and bioequivalence studies. However, the reliable extraction and analysis of the API are fundamentally complicated by the presence of excipients, which are indispensable components of any tablet formulation. These substances, while pharmacologically inert, are not analytically inert. They can interact with the API, with extraction solvents, and with the analytical instrumentation itself, leading to substantial interference that compromises the accuracy, precision, and reproducibility of analytical methods [9] [10]. This challenge is particularly acute in research focused on specific APIs like metoprolol, where the composition of the tablet matrix can vary significantly between branded and generic products, leading to inconsistent analytical outcomes and difficulties in method development and validation [9].
Framed within the context of metoprolol extraction research, this whitepaper provides an in-depth examination of the common tablet excipients and their demonstrated potential for analytical interference. It will explore the mechanisms of interference, present experimental data on their effects, detail robust analytical protocols to mitigate these issues, and propose a strategic framework for the development of interference-resistant methods. The goal is to equip researchers and drug development professionals with the knowledge and tools necessary to navigate and overcome the complex challenges posed by tablet matrices.
Mechanisms of Analytical Interference by Excipients
Excipients can interfere with the analysis of APIs through a variety of physical and chemical mechanisms. Understanding these pathways is the first step in designing analytical methods that can circumvent them.
Physical Interference: This often involves the impediment of API extraction. Hydrophobic polymers and certain binders can form a gel matrix or a physical barrier that traps the API, preventing its complete dissolution into the extraction solvent [3] [6]. For instance, high-viscosity grades of hypromellose (HPMC) are designed to hydrate and form a robust gel layer that controls the release of the API, such as metoprolol, in extended-release formulations. While this is therapeutically desirable, it presents a significant challenge for complete and rapid extraction during sample preparation for analysis [6].
Chemical Interactions: More insidious than physical barriers are chemical interactions. Excipients can form complexes with the API, engage in acid-base reactions, or catalyze degradation pathways. Research on metformin tablets has shown that certain polymeric excipients can form eutectic mixtures with the API, altering its melting point, crystallinity, and dissolution profile [9]. Such interactions not only affect drug performance but also its analytical detection, as the physicochemical properties of the API are measurably changed.
Co-elution and Signal Masking in Chromatography: In techniques like UPLC/HPLC, excipients or their impurities may co-elute with the analyte of interest. This can lead to inaccurate quantification by distorting the peak shape, shifting the retention time, or contributing to the detector signal. The problem is exacerbated in fixed-dose combination products, where multiple APIs and a host of excipients are present, increasing the probability of overlap and interference [11] [10].
Alteration of Sample Solution Properties: Excipients can change the pH, ionic strength, or viscosity of the sample solution. These changes can affect the efficiency of the extraction process, the stability of the API in solution, and the performance of the chromatographic system, leading to poor reproducibility and inaccurate results [6].
Excipient-Specific Interference Profiles and Data
The potential for interference is highly dependent on the chemical nature of the excipient. The following table summarizes the interference profiles of common classes of excipients, with a specific focus on findings relevant to metoprolol analysis.
Table 1: Common Tablet Excipients and Their Documented Analytical Interference
| Excipient Class | Common Examples | Primary Function | Documented Interference & Relevant Findings |
|---|---|---|---|
| Polymeric Binders & Matrix Formers | Hypromellose (HPMC), Carrageenan, Guar Gum, Ethyl Cellulose | Control drug release, sustain action | Forms a hydrated gel barrier that impedes drug extraction [3] [6]. Carrageenan-based layered matrix tablets provided controlled release for metoprolol tartrate, indicating a challenging matrix for complete extraction [3]. |
| Super-Disintegrants | Sodium Starch Glycolate, Croscarmellose Sodium | Promote tablet breakup in GI tract | Generally low interference, but high concentrations may affect solution viscosity. |
| Diluents/Fillers | Microcrystalline Cellulose, Lactose, Starch | Increase tablet bulk | Reported incompatibility with some APIs (e.g., L-phenylalanine) [9]. Can harbor API, preventing complete extraction if not fully disrupted. |
| Surfactants | Sodium Lauryl Sulfate (SLS), Tween 80 | Enhance dissolution | Can drastically alter chromatographic separation; used in mobile phase for metoprolol combination analysis [11]. Requires careful method validation. |
| Lubricants | Magnesium Stearate | Prevent sticking to machinery | Can cause hydrophobic coating of particles, slowing dissolution and extraction. Associated with degradation/discoloration in some formulations [9]. |
Beyond these general profiles, specific experimental data highlights the tangible impact of excipients. A 2023 study directly comparing branded and generic metformin products found that the different excipient compositions led to significant variations in the drug's physicochemical properties. The generic product exhibited a slower drug release rate, a lower melting point (as determined by DSC), and changes in crystallinity (via XRD)—all attributable to interactions with its specific excipient blend [9]. This underscores that even for a high-solubility drug like metformin, excipient choice can profoundly influence analytical outcomes.
In the context of metoprolol, the choice of matrix polymer is critical. Research shows that a barrier membrane (BM) coating applied to a hydrophilic matrix tablet can eliminate the initial burst release of metoprolol tartrate, resulting in more consistent and robust drug release profiles [6]. From an analytical perspective, this also implies that the extraction method must be powerful enough to liberate the API from this more resilient membrane-coated system.
Advanced Analytical Techniques for Detection and Mitigation
Overcoming excipient interference necessitates the use of sophisticated analytical techniques that can probe the solid-state properties of the dosage form and separate complex mixtures with high resolution.
Chromatographic Separation (UPLC/HPLC): This is the workhorse for quantifying APIs in the presence of excipients. The key is to achieve baseline separation of the API from interfering components. For the simultaneous analysis of metoprolol, atorvastatin, and ramipril, a validated UPLC method was developed using a Zorbax XDB-C18 column and a mobile phase containing the ion-pair reagent sodium lauryl sulphate to achieve specific separation of all analytes and their known degradants within 5 minutes [11]. The method was proven to be specific, indicating that it could distinguish the APIs from excipients and degradation products.
Thermal Analysis (DSC & TGA): Differential Scanning Calorimetry (DSC) and Thermogravimetric Analysis (TGA) are vital for detecting API-excipient interactions. A shift in the melting point or enthalpy of the API in the formulated product compared to the pure API, as seen in the metformin study, is a strong indicator of a potential interaction, such as the formation of a solid solution or a eutectic mixture [9] [4].
Solid-State Characterization (XRD, FTIR, SEM): X-ray Diffraction (XRD) can reveal changes in the crystallinity of the API. Scanning Electron Microscopy (SEM) provides visual evidence of particle morphology and potential interactions. Fourier-Transform Infrared (FTIR) and Confocal Raman microscopy can identify chemical interactions, such as hydrogen bonding between the API and polymer, which was evidenced in injection-moulded metoprolol-Eudragit systems [9] [4].
Table 2: The Scientist's Toolkit: Key Reagents and Materials for Mitigating Interference in Metoprolol Analysis
| Reagent/Material | Function in Analysis | Application Example |
|---|---|---|
| Ion-Pair Reagents (e.g., Sodium Lauryl Sulphate) | Modifies the retention of ionic analytes in reverse-phase chromatography, helping to separate APIs from interferences. | Used in UPLC mobile phase for simultaneous determination of metoprolol, atorvastatin, and ramipril [11]. |
| High-Viscosity Hypromellose (HPMC) | Rate-controlling polymer in extended-release formulations; represents a key interferent to be overcome. | Studying robust drug release and extraction from barrier membrane-coated metoprolol tablets [6]. |
| Triethyl Citrate (TEC) | Plasticizer used in polymer-based matrices; can affect polymer integrity and drug release during stability testing. | Used in injection-moulded Eudragit matrices for metoprolol; high levels led to deformation [4]. |
| Eudragit RL/RS PO | Polymethacrylate polymers used to create sustained-release matrix tablets via hot-melt processing. | Carrier in injection-moulded solid solutions/solid dispersions of metoprolol salts [4]. |
| pH-Modified Buffers | Dissolution media that simulates gastrointestinal conditions (e.g., pH 1.2, 6.8) to evaluate release and extraction. | Used in biorelevant dissolution testing of metoprolol tartrate matrix tablets [3] [6]. |
Detailed Experimental Protocols
Protocol for Dissolution Testing of Matrix Tablets
This protocol is adapted from methods used to evaluate sustained-release metoprolol tablets [3] [6].
- Apparatus: Use USP Dissolution Apparatus 1 (baskets) or 2 (paddles). For extended-release formulations like metoprolol matrix tablets, Apparatus 1 at 100 rpm is often specified.
- Dissolution Medium: Commonly, a volume of 900 mL is used. The study often begins with a simulated gastric fluid (e.g., pH 1.2 hydrochloric acid buffer) for the first 2 hours, followed by a transfer to a simulated intestinal fluid (e.g., pH 6.8 or 7.4 phosphate buffer) for the remainder of the test. To assess robustness, media with different osmolalities and surface tensions (e.g., with added surfactants like SLS or Tween 80) may be employed [6].
- Temperature: Maintain the medium at 37 ± 0.5 °C.
- Sampling: Withdraw aliquots (e.g., 5-10 mL) at predetermined time intervals (e.g., 1, 2, 4, 8, 12, 16, 20, and 24 hours). Replace the medium with an equal volume of fresh pre-warmed medium to maintain sink conditions.
- Filtration: Immediately filter the samples through a membrane filter (e.g., 0.45 μm porosity) to remove any undissolved particles or excipients.
- Analysis: Analyze the filtered samples using a validated UV-spectroscopic or chromatographic method (e.g., UPLC). For UV analysis, validate the method for specificity against potential interference from excipients and degradation products at the analytical wavelength (e.g., 222 nm for metoprolol) [3].
Protocol for UPLC Analysis of Metoprolol in Combination Products
This protocol is based on a validated method for the simultaneous quantification of metoprolol, atorvastatin, and ramipril [11].
- Chromatographic System: UPLC system equipped with a UV detector.
- Column: Zorbax XDB-C18 (4.6 mm × 50 mm, 1.8 μm) or equivalent.
- Mobile Phase: Prepare a mixture of Buffer and Acetonitrile in a 50:50 (v/v) ratio.
- Buffer: 0.06% ortho-phosphoric acid in Milli-Q water, containing 0.0045 M Sodium Lauryl Sulphate.
- Flow Rate: 1.0 mL/min.
- Column Temperature: 55 °C.
- Detection Wavelength: 210 nm.
- Injection Volume: Typically 1-10 μL.
- Sample Preparation: Powder tablets and extract a quantity equivalent to one dose in a suitable solvent (e.g., the mobile phase). Sonicate and vortex to ensure complete extraction. Centrifuge or filter (0.2 μm) before injection.
- System Suitability: Before analysis, ensure the method meets suitability criteria: theoretical plates >2000 for metoprolol peak, tailing factor <2.0, and RSD of peak responses from repeated injections <2.0%.
Strategic Framework for Method Development and Validation
Developing an analytical method that is robust to excipient interference requires a systematic and strategic approach. The following diagram outlines a recommended workflow for researchers.
Diagram 1: Workflow for Robust Method Development
This workflow emphasizes several critical strategies:
Initial Scouting with Pure API and Placebo: The process begins by analyzing the pure API to understand its intrinsic chromatographic behavior and spectral properties. The most critical step is to then create and analyze a placebo blend containing all excipients in their actual proportions. This allows for the direct identification of which excipients cause interference, such as co-eluting peaks or baseline noise [10].
Forced Degradation Studies: Subjecting the finished formulation to stress conditions (acid, base, oxidation, heat, light) is a cornerstone of developing a stability-indicating method. As demonstrated in the UPLC method for metoprolol combinations, this process helps identify degradation products and confirms that the method can accurately quantify the API without interference from these potential degradants [11].
Systematic Optimization and Validation: Based on the findings from the placebo and forced degradation studies, chromatographic conditions (column chemistry, mobile phase pH and composition, temperature) and sample preparation techniques (sonication time, filter compatibility, extraction solvent) are systematically optimized. The final method must be rigorously validated per ICH guidelines, with a heavy emphasis on specificity to prove its ability to unequivocally assess the analyte in the presence of excipients and degradation products [11].
The analysis of metoprolol, and APIs in general, within complex tablet matrices is a non-trivial challenge defined by the pervasive potential for analytical interference from excipients. These inert components can physically hinder extraction, chemically interact with the API, and co-elute during chromatographic separation, leading to significant inaccuracies. As demonstrated by research on both metoprolol and other drugs like metformin, the problem is not merely theoretical but has a measurable impact on drug release profiles and analytical results.
Success in this arena depends on a deep understanding of excipient-specific interference profiles and the deployment of a sophisticated toolkit. Advanced techniques like UPLC with ion-pair reagents, DSC, and XRD are indispensable for detecting and characterizing these interactions. Furthermore, adopting a strategic framework for method development—centered on comprehensive placebo analysis and forced degradation studies—is essential for creating robust, specific, and validated analytical methods.
Looking forward, the field must move towards greater standardization and knowledge sharing. As noted in studies on multi-ingredient products, the lack of unified analytical frameworks and standardized testing protocols leads to variable and sometimes suboptimal quality control practices [10]. Future efforts should focus on developing matrix-specific pretreatment protocols and optimized extraction strategies, particularly for challenging extended-release formulations. By systematically addressing the hidden challenge of excipient interference, researchers can ensure the accuracy and reliability of pharmaceutical analysis, thereby safeguarding drug quality and efficacy.
The accurate analysis of metoprolol from tablet matrices and biological samples presents a multifaceted challenge for pharmaceutical researchers and drug development professionals. The reliability of data generated in pharmacokinetic studies, bioavailability assessments, and quality control measures hinges on effectively addressing three interconnected analytical obstacles: significant protein binding, low circulating concentrations of the active moiety, and substantial spectral interference from complex matrices. These challenges collectively impact the precision, accuracy, and sensitivity of metoprolol quantification across different analytical platforms. Within the broader context of metoprolol extraction research, understanding these core limitations is fundamental to developing robust methodologies that can withstand regulatory scrutiny and provide meaningful data for formulation development and therapeutic drug monitoring.
Protein Binding Complications in Metoprolol Analysis
The Protein Binding Phenomenon
Metoprolol exhibits considerable protein binding in biological systems, primarily to plasma proteins such as albumin and α1-acid glycoprotein. This binding creates a dynamic equilibrium between free and bound drug fractions, with only the free fraction being pharmacologically active and available for extraction. The protein-bound complex presents a substantial challenge during sample preparation because conventional extraction techniques often co-precipitate or fail to efficiently separate the bound drug, leading to underestimation of total drug concentration and reduced analytical recovery.
The extent of protein binding varies inter-individually based on genetic polymorphisms, disease states, and concomitant medications, introducing additional variability that must be accounted for during method development. For instance, patients with inflammatory conditions may exhibit elevated α1-acid glycoprotein levels, potentially altering metoprolol binding characteristics and complicating therapeutic drug monitoring efforts [12].
Methodological Approaches to Overcome Protein Binding
Protein Precipitation Techniques: The most common approach to disrupt protein binding involves chemical denaturation using organic solvents or acids. In one validated method for plasma metoprolol analysis, researchers employed trichloroacetic acid solution (25% w/v) combined with methanol to effectively precipitate proteins while maintaining metoprolol stability in the supernatant. This single-step extraction procedure demonstrated excellent recovery rates while effectively dismantling protein-drug complexes [12].
Organic Solvent Selection: The choice of solvent significantly impacts protein precipitation efficiency. Methanol, acetonitrile, and ethyl acetate have all been successfully utilized in metoprolol extraction protocols, with selection criteria based on precipitation efficiency, evaporation characteristics, and compatibility with subsequent analytical techniques. For GC-MS analysis, ethyl acetate and diethyl ether have shown particular utility in metoprolol extraction from plasma while minimizing aqueous phase co-extraction of interfering substances [13].
Table 1: Protein Precipitation Reagents for Metoprolol Analysis
| Reagent | Concentration/Volume | Sample Volume | Efficiency | Compatibility |
|---|---|---|---|---|
| Trichloroacetic acid | 25% w/v, 0.2 mL | 0.4 mL plasma | >95% protein removal | LC-MS/MS, HPLC |
| Methanol | 0.225 mL | 0.4 mL plasma | >90% protein removal | LC-MS/MS, HPLC |
| Acetonitrile | 1:2 sample ratio | Variable | >92% protein removal | HPLC, UV detection |
| Ethyl acetate | 1:3 sample ratio | 0.5 mL plasma | ~85% recovery | GC-MS |
Low Concentration Challenges in Metoprolol Detection
Therapeutic Ranges and Analytical Sensitivity
Metoprolol circulates at relatively low concentrations in biological fluids following therapeutic dosing, creating significant demands on analytical sensitivity. After a standard 50 mg dose, plasma concentrations typically range from 14–212 µg·L⁻¹ (mean 111 µg·L⁻¹), while lower doses (20 mg) yield correspondingly lower concentrations of 5–80 µg·L⁻¹ (mean 33 µg·L⁻¹) [12]. These concentrations approach the detection limits of conventional analytical instrumentation, necessitating either extensive sample pre-concentration or highly sensitive detection systems.
The challenge is further compounded in alternative matrices like exhaled breath condensate (EBC), where metoprolol concentrations are substantially lower (mean 5.35 µg·L⁻¹) due to limited partitioning from plasma [12]. Such low concentrations demand exceptional method sensitivity and careful optimization to avoid interference from background matrix components.
Enhancing Detection Sensitivity
Pre-concentration Strategies: Liquid-liquid extraction (LLE) and solid-phase extraction (SPE) techniques effectively concentrate metoprolol from large sample volumes while simultaneously purifying the analyte from matrix interferents. In one GC-MS method, extraction from 0.5 mL plasma followed by derivatization enabled reliable detection at concentrations as low as 0.12 µg·L⁻¹, well below the therapeutic range [13].
Advanced Detection Platforms: The implementation of mass spectrometric detection, particularly tandem mass spectrometry (MS/MS), has dramatically improved sensitivity for metoprolol quantification. LC-MS/MS methods now achieve detection limits of 0.18 µg·L⁻¹ in EBC, 0.12 µg·L⁻¹ in plasma, and 0.21 µg·L⁻¹ in urine, with quantification limits of 0.60, 0.40, and 0.70 µg·L⁻¹ respectively [12]. These sensitivity levels adequately cover the therapeutic range while allowing for accurate measurement at trough concentrations.
Table 2: Sensitivity Parameters for Metoprolol Analytical Methods
| Analytical Method | Matrix | Linear Range (µg·L⁻¹) | LOD (µg·L⁻¹) | LOQ (µg·L⁻¹) | Reference |
|---|---|---|---|---|---|
| LC-MS/MS | EBC | 0.6-500 | 0.18 | 0.60 | [12] |
| LC-MS/MS | Plasma | 0.4-500 | 0.12 | 0.40 | [12] |
| LC-MS/MS | Urine | 0.7-10,000 | 0.21 | 0.70 | [12] |
| GC-MS | Plasma | 1-500 | 0.12 | 0.40 | [13] |
| HPLC with fluorescence | Plasma | 10-300 | 5.0 | 10.0 | [14] |
Spectral Overlap and Matrix Interference
Spectral overlap poses a substantial challenge in metoprolol analysis, particularly in complex matrices like tablet formulations and biological samples. Tablet excipients—including microcrystalline cellulose, methacrylic acid copolymers, and ethylcellulose—can interfere with both chromatographic separation and spectral detection of metoprolol [15]. In biological samples, endogenous compounds such as proteins, lipids, and metabolites create similar interference issues, potentially leading to inaccurate quantification.
The extended-release formulation of metoprolol succinate introduces additional complexity due to its multi-particulate structure, where individually coated units are compressed into tablets. This formulation design creates heterogeneity that can manifest as spectral variation when analyzing different tablet segments or split portions [15]. Near-infrared chemical imaging has revealed significant API distribution variations in commercially available metoprolol products, particularly after tablet splitting, which complicates spectral interpretation [15].
Chromatographic and Spectral Resolution Techniques
Chromatographic Separation Optimization: Reversed-phase chromatography using C18 columns (100 mm × 4.6 mm i.d., 3.5 μm particle size) with mobile phases combining methanol and formic acid solution (0.1% v/v) at a ratio of 65:35 (v/v) has demonstrated excellent separation of metoprolol from interfering compounds [12]. This configuration effectively resolves metoprolol from its major metabolites and matrix components, minimizing spectral overlap at the detection stage.
Derivatization Strategies: For GC-MS applications, derivatization of metoprolol's hydroxyl group using N-methyl-N-(trimethylsilyl)trifluoroacetamide (MSTFA) improves chromatographic behavior and generates characteristic mass fragments with high relative intensity, facilitating selective detection in selected ion monitoring (SIM) mode [13]. This approach enhances specificity by shifting retention times and generating unique mass spectral patterns that differentiate metoprolol from co-extracted interferents.
High-Selectivity Detection: Mass spectrometric detection, particularly using multiple reaction monitoring (MRM), provides exceptional specificity by monitoring specific precursor-to-product ion transitions (e.g., m/z 268.1→116.2 for metoprolol) [12]. This approach effectively discriminates against isobaric compounds and matrix background, virtually eliminating spectral overlap concerns when coupled with appropriate chromatographic separation.
Integrated Methodologies for Comprehensive Metoprolol Analysis
Experimental Workflows for Different Matrices
The analytical workflow for metoprolol quantification varies significantly based on the sample matrix and required sensitivity. The following diagram illustrates a comprehensive approach for metoprolol analysis from tablet and biological matrices:
Detailed Protocol: LC-MS/MS Analysis of Metoprolol in Plasma, EBC, and Urine
Sample Preparation:
- Plasma: Mix 0.4 mL plasma with 0.225 mL methanol and 0.2 mL trichloroacetic acid solution (25% w/v). Sonicate for 2 minutes, then centrifuge at 13,000 rpm for 10 minutes. Collect the clear supernatant for analysis [12].
- EBC: Analyze directly without pretreatment when using sensitive LC-MS/MS systems. For conventional HPLC, consider pre-concentration via lyophilization and reconstitution in smaller volumes [12].
- Urine: Dilute 1:10 with mobile phase or deionized water to bring within calibration range. Filter through 0.2 μm membrane if particulate matter is present [12].
Instrumental Parameters:
- Column: Zorbax RR Eclipse C18 (100 mm × 4.6 mm i.d., 3.5 μm particle size)
- Temperature: 30°C
- Mobile Phase: Methanol and 0.1% formic acid (65:35, v/v)
- Flow Rate: 0.6 mL·min⁻¹
- Injection Volume: 50 μL
- MS Parameters: ESI positive mode; precursor ion m/z 268.1; product ion m/z 116.2; cone voltage 35 V; collision energy 35 eV [12]
Validation Parameters:
- Linearity: Verify with coefficient of determination ≥0.99 across expected concentration range
- Precision: Intra-day and inter-day RSD should be <10% for bioanalytical methods
- Accuracy: 85-115% of nominal values across calibration range
- Recovery: Consistent and reproducible extraction efficiency [12]
Detailed Protocol: GC-MS Analysis of Metoprolol in Plasma
Derivatization Procedure:
- Extract metoprolol from 0.5 mL plasma using ethyl acetate or diethyl ether.
- Evaporate organic layer to dryness under nitrogen stream.
- Reconstitute residue in 50 μL MSTFA (N-methyl-N-(trimethylsilyl)trifluoroacetamide).
- Heat at 60°C for 15 minutes to complete silylation of hydroxyl group.
- Inject 1-2 μL into GC-MS system [13].
GC-MS Conditions:
- Column: Capillary column coated with 5% phenyl and 95% dimethylpolysiloxane
- Injector Temperature: 280°C
- Detector Temperature: 280°C
- Oven Program: 50°C (hold 1 min) to 280°C at 15°C/min
- Carrier Gas: Helium at 1.0 mL/min
- Detection: Selected Ion Monitoring (SIM) mode [13]
The Scientist's Toolkit: Essential Research Reagents and Materials
Table 3: Essential Research Reagents for Metoprolol Analysis
| Reagent/Material | Function/Purpose | Application Examples | Technical Considerations |
|---|---|---|---|
| Trichloroacetic acid | Protein precipitation | Plasma sample preparation | Use at 25% w/v concentration; compatible with LC-MS/MS |
| Methanol | Protein solvent, mobile phase component | Sample preparation, HPLC mobile phase | HPLC grade; effective for metoprolol extraction |
| N-methyl-N-(trimethylsilyl)trifluoroacetamide (MSTFA) | Derivatizing agent for hydroxyl group | GC-MS analysis | Enh volatility & detection; use at 60°C for 15 min |
| Ethyl acetate | Organic extraction solvent | Liquid-liquid extraction | GC-MS compatible; evaporates easily under N₂ stream |
| C18 Chromatography column | Stationary phase for separation | HPLC, LC-MS/MS analysis | 100×4.6mm, 3.5μm particles optimal for metoprolol |
| Formic acid | Mobile phase modifier | LC-MS/MS analysis | 0.1% v/v in water improves ionization & peak shape |
| Metoprolol reference standard | Quantitative calibration | Method development & validation | USP grade for regulatory compliance |
| Atenolol | Internal standard | GC-MS, LC-MS quantification | Corrects for variability in extraction & ionization |
The analytical challenges associated with metoprolol extraction—particularly protein binding, low concentration detection, and spectral overlap—require integrated methodological approaches that leverage advanced instrumentation and optimized sample preparation techniques. The strategies outlined in this technical guide provide frameworks for overcoming these obstacles while generating reliable, reproducible data suitable for regulatory submission and clinical decision-making. As analytical technologies continue to evolve, particularly in mass spectrometry and high-resolution separation science, sensitivity and specificity limitations will further diminish, enabling more precise metoprolol quantification across increasingly complex matrices. Nevertheless, the fundamental principles of thorough method validation and matrix-specific optimization will remain paramount regardless of technological advancements.
The Critical Role of Sample Preparation in Isolating the Active Pharmaceutical Ingredient
The precise isolation and quantification of an Active Pharmaceutical Ingredient (API) from its formulated dosage form represent a foundational step in pharmaceutical analysis, crucial for ensuring drug safety, efficacy, and quality. Sample preparation directly influences the accuracy, sensitivity, and reproducibility of subsequent analytical results. Within the context of metoprolol research—a cornerstone beta-blocker therapy—extracting the API from complex tablet matrices presents unique challenges, including the need to separate the drug from excipients, account for its specific physicochemical properties, and accurately quantify both the parent compound and its metabolites. This guide details the core principles and advanced techniques for effective API isolation, using metoprolol as a primary case study.
Fundamentals of Sample Preparation for Drug Products
Sample preparation for solid oral dosage forms, such as tablets and capsules, typically involves a three-step process: "grind, extract, and filter" [16]. This workflow is designed to liberate the API from the insoluble excipients that constitute the tablet's matrix and prepare a clean, analyzable solution.
Core Steps and Considerations
- Particle Size Reduction (Grind): Tablets are often crushed using a mortar and pestle to increase the surface area, which facilitates more rapid and complete dissolution of the API. For content uniformity testing, a single tablet may be crushed by wrapping it in weighing paper and hammering it [16].
- Solubilization (Extract): The powdered sample is transferred to a volumetric flask. The choice of diluent is critical and is determined during method development based on the API's solubility and stability. For many drugs like metoprolol, which is a weak base, an acidified water or a buffer may be used. Sonication, shaking, or vortex mixing is then employed to dissolve the API [16].
- Clarification (Filter): The extract is filtered through a membrane filter (e.g., 0.45 µm nylon or PTFE) to remove any remaining particulate matter. The first 0.5 mL of filtrate is typically discarded to avoid potential adsorption of the API onto the filter membrane [16].
Analytical Techniques for Metoprolol Extraction and Quantification
The analysis of metoprolol often requires sophisticated sample preparation and chromatographic techniques to achieve the necessary selectivity and sensitivity, especially in complex biological or environmental matrices.
Advanced Microextraction Techniques
Hollow Fiber-Liquid Phase Microextraction (HF-LPME) has been developed as a green and efficient method for extracting free metoprolol from plasma samples [17]. This technique offers high enrichment factors, minimal organic solvent consumption, and natural sample clean-up by extracting only the protein-unbound, biologically active form of the drug [17].
A specific experimental protocol for HF-LPME of metoprolol is as follows [17]:
- Apparatus Setup: A home-made U-shape device is used to increase the contact surface area.
- Hollow Fiber Preparation: A porous hollow fiber membrane is impregnated with tissue culture oil, which acts as a green and inert extraction solvent.
- Extraction: The impregnated fiber is placed in a plasma sample (alkalinized to pH 11 with NaOH). Metoprolol is extracted from the sample into the organic solvent within the fiber's pores.
- Back-Extraction: The analyte is then back-extracted into an acidic acceptor solution inside the fiber's lumen.
- Analysis: The acceptor solution is retrieved and analyzed via High-Performance Liquid Chromatography with Diode Array Detection (HPLC-DAD).
Key optimized parameters for this method include an extraction temperature of 45°C, a sonication time of 8.5 minutes, and the addition of salt (NaCl) to enhance recovery [17].
Dispersive Liquid-Liquid Microextraction (DLLME) is another miniaturized technique effective for pre-concentrating metoprolol from aqueous samples. It involves a rapid injection of a mixture of extraction and disperser solvents into an aqueous sample, forming a cloudy solution that enables efficient extraction. The sedimented phase containing the enriched analytes is then collected for analysis [18].
Chromatographic Analysis and Metabolite Profiling
An HPLC method with fluorescence detection has been established for the simultaneous determination of metoprolol and its two main metabolites, α-hydroxymetoprolol and O-desmethylmetoprolol, in human plasma and urine [19]. This is vital for pharmacokinetic studies.
The experimental protocol for this assay is as follows [19]:
- Sample Preparation: Plasma or urine samples undergo protein precipitation. An internal standard (esmolol) is added to correct for variability.
- Chromatography: Separation is achieved on an Agilent ZORBAX XDB-C18 column (150 mm × 4.6 mm, 5 µm).
- Mobile Phase: A mixture of 10 mM ammonium acetate buffer (pH 5.0) and acetonitrile (78:22, v/v) is used in an isocratic elution mode.
- Detection: Fluorescence detection is set at an excitation wavelength of 225 nm and an emission wavelength of 310 nm.
- Performance: The method is validated, with a run time of under 16 minutes, and is demonstrated to be sensitive, precise, and accurate for clinical application.
Table 1: Performance Data of Analytical Methods for Metoprolol
| Method | Matrix | Limit of Quantification (LOQ) | Extraction Recovery | Key Advantage |
|---|---|---|---|---|
| HF-LPME-HPLC-DAD [17] | Human Plasma | Not Specified | Optimized and efficient | Green solvent; extracts only free, active drug |
| HPLC-Fluorescence [19] | Human Plasma/Urine | Sufficient for pharmacokinetics | Precise and accurate | Simultaneously quantifies drug and two metabolites |
| DLLME/SPOME [18] | Wastewater | 0.20–0.45 µg/mL (for LC) | 53.04–92.1% | High enrichment factor (61.22–243.97) for environmental sampling |
The Scientist's Toolkit: Essential Research Reagent Solutions
Successful isolation and analysis of metoprolol require specific reagents and materials. The following table details key components and their functions in the experimental workflow.
Table 2: Key Research Reagents and Materials for Metoprolol Analysis
| Reagent/Material | Function/Application | Example from Research |
|---|---|---|
| Tissue Culture Oil | A green, high-quality mineral oil used as an extraction solvent in HF-LPME [17]. | Used as the organic solvent in the hollow fiber for extracting metoprolol from plasma [17]. |
| Hollow Fiber Membrane | A porous, hydrophobic membrane that holds the extraction solvent and separates the donor and acceptor phases in HF-LPME [17]. | Serves as the support for the organic solvent, enabling the microextraction process [17]. |
| C18 Reverse-Phase Column | A standard chromatography column for separating non-polar to moderately polar compounds like metoprolol and its metabolites [19]. | Agilent ZORBAX XDB-C18 column used for chromatographic separation [19]. |
| Ammonium Acetate Buffer | A volatile buffer compatible with mass spectrometry, used to control the pH of the mobile phase [19]. | Used in the mobile phase (pH 5.0) for the HPLC-fluorescence assay of metoprolol [19]. |
| Solid-Phase Extraction (SPE) Columns | Used for sample clean-up and pre-concentration of analytes from complex matrices like plasma [20]. | Employed in a pediatric drug monitoring method to extract metoprolol from small plasma volumes (500 µL) [20]. |
The meticulous process of sample preparation is undeniably critical to the integrity of pharmaceutical analysis. As demonstrated through the case of metoprolol, overcoming the challenges posed by tablet matrices and biological samples requires a strategic approach, combining fundamental techniques like grinding and filtration with advanced methods such as HF-LPME and DLLME. The continuous evolution of these "grind, extract, and filter" protocols and the development of greener, more efficient microextraction technologies ensure that researchers can achieve the precise and reliable data necessary for drug development, quality control, and therapeutic monitoring. A robust sample preparation protocol is the indispensable first step in generating data that safeguards public health.
Experimental Workflow Diagrams
Sample Preparation Core Process
HF-LPME Metoprolol Extraction
Modern Extraction and Analytical Techniques for Efficient Metoprolol Recovery
The determination of active pharmaceutical ingredients (APIs) in complex matrices, whether for drug formulation quality control or bioanalytical monitoring, presents significant analytical challenges. Efficient sample preparation is a critical step, directly impacting the accuracy, sensitivity, and precision of the final analysis [17] [21]. This guide focuses on two prominent liquid-phase microextraction (LPME) techniques—Hollow Fibre LPME (HF-LPME) and Dispersive Liquid-Liquid Microextraction (DLLME)—framed within the specific context of challenges encountered in extracting and analyzing metoprolol, a widely used beta-blocker, from tablet matrices and biological samples [3] [17] [6]. Conventional techniques like liquid-liquid extraction (LLE) and solid-phase extraction (SPE) are often hampered by high consumption of toxic organic solvents, long extraction times, and lack of selectivity [22] [21]. LPME techniques have emerged as strategic, miniaturized alternatives that curtail solvent use, reduce extraction time, and improve contaminant selectivity and enrichment, aligning with the principles of Green Analytical Chemistry (GAC) [22] [23].
Fundamental Principles of LPME
Hollow Fibre Liquid-Phase Microextraction (HF-LPME)
HF-LPME, introduced in 1999, involves the use of a porous hollow fibre, typically made of polypropylene, which serves to protect and contain a small volume of extraction solvent [21] [24]. This configuration provides a high surface area for extraction while acting as a barrier to matrix interferences such as proteins and particulate matter, offering inherent sample clean-up [17] [24]. The technique can be operational in two primary modes:
- Two-Phase HF-LPME: The pores of the hollow fibre are impregnated with a water-immiscible organic solvent, which also fills the fibre's lumen. Analytes are extracted from the aqueous sample (donor phase) directly into this organic acceptor phase based on their solubility [22] [21].
- Three-Phase HF-LPME: The pores are impregnated with a water-immiscible organic solvent to form a Supported Liquid Membrane (SLM). An aqueous acceptor solution, immiscible with the organic SLM, is housed within the fibre's lumen. Analytes are extracted from the aqueous donor phase, through the organic SLM, and into the aqueous acceptor phase. This mode offers higher selectivity, particularly for ionizable compounds like metoprolol, which can be transferred by pH control [22] [17] [21].
A significant advancement in HF-LPME is the development of Hollow Fibre Polymer Inclusion Membranes (HF-PIM-LPME), which replace the conventional SLM with a membrane composed of a base polymer, an extractant, and a plasticizer. PIMs exhibit superior stability compared to SLMs, which can suffer from solvent dissolution, thereby improving the method's robustness for industrial applicability [22].
Dispersive Liquid-Liquid Microextraction (DLLME)
DLLME is based on a ternary component solvent system [24]. A typical procedure involves the rapid injection of a mixture containing an extraction solvent and a disperser solvent into an aqueous sample. The disperser solvent, miscible with both the sample and the extraction solvent, creates a turbid solution with a vast surface area between the fine droplets of the extraction solvent and the aqueous sample, leading to rapid and efficient extraction [25] [18]. After extraction, the mixture is centrifuged to sediment the extraction solvent droplets, which are then collected for analysis [18]. A common green variant is Solidification of Floating Organic Droplet Microextraction (SFOME), which uses an organic solvent with a density lower than water and a melting point near room temperature. After extraction, the sample is cooled, the solidified solvent droplet is collected, and then melted for analysis, simplifying the collection process [18].
Experimental Protocols and Methodologies
A Specific HF-LPME Protocol for Metoprolol from Plasma
The following method details a two-phase HF-LPME procedure for extracting free metoprolol from plasma samples using tissue culture oil as a green extraction solvent [17].
Materials and Reagents:
- Hollow Fibre: Porous polypropylene hollow fibre.
- Extraction Solvent: Tissue culture oil (a light mineral oil).
- Standard Solution: Metoprolol stock solution (100 mg L⁻¹ in methanol).
- Sample: Plasma samples (from patients receiving metoprolol).
- Device: A home-made U-shape extraction device.
- Analysis: HPLC with Diode Array Detection (DAD).
Optimized Procedure:
- Fibre Preparation: Cut the hollow fibre to an optimized length (e.g., 2.5 cm). Rinse with acetone and dry.
- Solvent Impregnation: Impregnate the fibre pores with tissue culture oil via sonication for 5 minutes.
- Sample Preparation: Adjust the pH of the plasma sample to 10.5-11. Load the sample into the U-shaped device.
- Extraction: Introduce the impregnated hollow fibre containing the acceptor phase (tissue culture oil) into the sample. Extract for 30 minutes at 25°C with stirring.
- Analysis: Retract the acceptor phase into a micro-syringe and inject directly into the HPLC-DAD system.
Critical Optimization Parameters:
- HF Length: Optimized to 2.5 cm for sufficient surface area and efficient extraction.
- Sonication Time: 5 minutes for complete membrane impregnation.
- Extraction Temperature: Room temperature (25°C).
- Salt Addition: No salt added, as it decreased extraction efficiency.
- Sample pH: 10.5-11, ensuring metoprolol is in its uncharged form for efficient extraction [17].
A Generic DLLME/SFOME Protocol for Beta-Blockers from Aqueous Matrices
This protocol, applicable for the extraction of metoprolol and other beta-blockers from wastewater, compares DLLME and SFOME [18].
Materials and Reagents:
- Extraction Solvents: Chloroform (for DLLME) or 1-undecanol (for SFOME).
- Disperser Solvent: Acetonitrile.
- Standard Solution: A mixture of eight beta-blockers, including metoprolol.
- Sample: Wastewater samples, adjusted to pH 11.
Optimized Procedure:
- Sample Preparation: Place 10 mL of alkalinized (pH 11) aqueous sample into a 15 mL polypropylene conical tube.
- Injection: Rapidly inject a mixture of 250 µL acetonitrile (disperser) and 100 µL extraction solvent (1-undecanol for SFOME or chloroform for DLLME) into the sample.
- Dispersion and Extraction: Mix to form a cloudy solution. Stir for a defined period to allow for analyte partitioning.
- Phase Separation:
- For DLLME (Chloroform): Centrifuge the mixture. The dense chloroform phase sediments at the bottom and is collected with a micro-syringe.
- For SFOME (1-undecanol): Centrifuge the mixture. The light 1-undecanol phase floats. Transfer the entire tube to an ice-water bath to solidify the organic droplet. Collect the solidified droplet and let it melt at room temperature.
- Analysis: Analyze the extracted phase by GC-MS or LC-PDA [18].
Comparative Analysis: HF-LPME vs. DLLME
Table 1: Comparative analysis of HF-LPME and DLLME for pharmaceutical extraction.
| Feature | Hollow Fibre LPME (HF-LPME) | Dispersive Liquid-Liquid Microextraction (DLLME) |
|---|---|---|
| Basic Principle | Analyte partitioning across a supported liquid membrane or into a protected organic solvent [22] [21]. | Ternary solvent system creating a cloudy solution for rapid extraction [25] [18]. |
| Solvent Consumption | Very low (microliters) [21]. | Very low (microliters), but uses an additional disperser solvent [18]. |
| Extraction Time | Moderate to long (20 min - several hours) [21]. | Very rapid (minutes) [25]. |
| Selectivity & Clean-up | High. The fibre pore structure provides excellent sample clean-up, excluding macromolecules and particulates [17] [21]. | Moderate. Limited clean-up; matrix components can be co-extracted [24]. |
| Enrichment Factor | High (up to 27,000-fold reported) [21]. | High [18]. |
| Operational Stability | SLM can be unstable; PIMs offer better robustness [22]. Drop dislodgement can be an issue in unprotected SDME [24]. | High. The dispersion process is inherently stable [25]. |
| Automation Potential | Possible but can be complex and costly [21]. | Challenging due to the centrifugation and collection steps [25] [26]. |
| Ideal for Matrices | Complex, dirty samples (e.g., wastewater, plasma, urine) [17] [21]. | Relatively cleaner aqueous matrices (e.g., environmental water, pre-processed samples) [18]. |
Table 2: Quantitative performance data for metoprolol and other beta-blockers using LPME techniques.
| Analyte | Technique | Matrix | Limit of Detection (LOD) | Extraction Recovery (%) | Enrichment Factor | Citation |
|---|---|---|---|---|---|---|
| Metoprolol | HF-LPME (Two-phase) | Plasma | Not specified | - | - | [17] |
| Metoprolol | DLLME-GC-MS | Wastewater | 0.13 - 0.69 µg/mL | 53.04 - 92.1% | 61.22 - 243.97 | [18] |
| Metoprolol | SFOME-LC-PDA | Wastewater | 0.07 - 0.15 µg/mL | 53.04 - 92.1% | 61.22 - 243.97 | [18] |
| 6 β-blockers | HF-LPME (Two-phase) | Wastewater | 80-500 ng/L | - | - | [21] |
The Scientist's Toolkit: Essential Research Reagents and Materials
Table 3: Essential materials and reagents for HF-LPME and DLLME protocols.
| Item | Function / Purpose | Specific Examples |
|---|---|---|
| Hollow Fibre | A porous, hydrophobic membrane that contains and protects the acceptor phase; provides sample clean-up. | Polypropylene hollow fibres [22] [24]. |
| Extraction Solvent | The primary liquid that extracts the target analytes from the sample matrix. | Tissue culture oil, 1-undecanol, chloroform, dihexyl ether, 1-octanol [17] [21] [18]. |
| Disperser Solvent | A solvent miscible with both the extraction solvent and sample, used to disperse the extraction solvent into fine droplets (for DLLME). | Acetonitrile, methanol, acetone [18]. |
| Carrier Molecules | Added to the SLM in three-phase HF-LPME to facilitate the transport of ionized analytes across the organic membrane. | Aliquat 336, Di-(2-ethylhexyl) phosphoric acid (DEHPA), Trioctylphosphine oxide (TOPO) [21]. |
| Salt | Added to the sample solution to increase ionic strength, potentially improving extraction efficiency via "salting-out". | Sodium chloride (NaCl) [18]. |
| Syringe / U-shape Device | For precise handling of microliter volumes of solvents and samples, and for housing the hollow fibre during extraction. | Micro-syringe (e.g., 10 µL), home-made U-shape device [17] [24]. |
Workflow and Signaling Pathways
The following diagram illustrates the core decision-making workflow for selecting and applying HF-LPME or DLLME for the analysis of a drug like metoprolol.
Challenges in Metoprolol Extraction from Tablet Matrices
The extraction of metoprolol from its tablet dosage form presents unique challenges that can be addressed by LPME techniques. Metoprolol is often formulated as a controlled-release matrix tablet using swellable polymers like carrageenan or hypromellose (HPMC) to provide a prolonged therapeutic effect [3] [6]. These excipients are designed to hydrate and form a gel layer, controlling the drug's release rate. Consequently, a simple dissolution may not be sufficient for sample preparation prior to analysis, as the gel-forming polymers can create a viscous solution that hampers efficient analyte mass transfer and can lead to matrix effects in chromatographic systems [3] [6]. HF-LPME is particularly suited to handle such complex matrices. The hollow fibre's pores act as a physical barrier, preventing the polymeric materials and other insoluble excipients from interfering with the extraction process, thus providing a clean extract for instrumental analysis [17] [21]. Furthermore, the risk of "dose dumping" or inconsistent release profiles from these formulations [6] underscores the need for robust analytical methods like HF-LPME and DLLME for precise and accurate monitoring of metoprolol release during formulation development and quality control.
Reversed-phase high-performance liquid chromatography (RP-HPLC) and ultra-high-performance liquid chromatography (UHPLC) represent cornerstone analytical technologies in pharmaceutical development and quality control. These techniques provide the selectivity, sensitivity, and reproducibility required to analyze complex drug formulations, including those containing metoprolol succinate. The fundamental principle involves the separation of components based on their relative hydrophobicity using a non-polar stationary phase (typically C18) and a polar mobile phase. The evolution from HPLC to UHPLC has brought significant improvements in resolution, speed, and solvent consumption through the use of smaller particle sizes (<2 μm) and higher operating pressures.
Within the context of metoprolol research, chromatographic method development faces specific challenges due to the complex tablet matrices and the need to separate the active pharmaceutical ingredient from its degradation products and metabolites. Metoprolol succinate extended-release tablets present additional complexities as they incorporate a multi-particulate drug delivery system where individually coated units are compressed into tablets [15]. This matrix complexity necessitates robust chromatographic methods that can selectively quantify metoprolol while resolving it from formulation excipients and potential impurities.
Critical Method Development Parameters for Metoprolol Analysis
Stationary Phase Selection
The C18 column serves as the workhorse for metoprolol analysis, though performance characteristics vary significantly between different column brands and particle technologies. Research indicates that columns such as Agilent ZORBAX XDB-C18 (150 mm × 4.6 mm, 5 μm) have demonstrated excellent peak shape and resolution for metoprolol and its metabolites [19]. When developing methods for metoprolol formulations, the selection of appropriate column dimensions and particle size is paramount. For conventional HPLC, columns of 150-250 mm in length with 5 μm particles provide sufficient efficiency, while UHPLC methods benefit from shorter columns (50-100 mm) packed with sub-2 μm particles for faster analysis times [27].
The kinetic plot method offers a sophisticated approach to compare column performance by transforming Van Deemter curve data into practically relevant relationships between analysis time and efficiency. This method reveals that different C18 phases exhibit distinct performance optima - some demonstrating superior separation speeds for simple applications requiring fewer theoretical plates, while others excel in high-efficiency separations needing longer analysis times [28]. This trade-off between efficiency and permeability must be carefully considered when developing methods for complex matrices such as metoprolol formulations.
Mobile Phase Optimization
Mobile phase composition significantly impacts the retention, selectivity, and peak shape of metoprolol in chromatographic separations. For metoprolol analysis, the most common mobile phase systems employ mixtures of aqueous buffers and organic modifiers such as acetonitrile or methanol. A validated stability-indicating method for metoprolol succinate utilizes sodium dihydrogen phosphate buffer (pH unspecified) and acetonitrile in a 70:30 ratio [29]. The buffer concentration plays a critical role in suppressing silanol interactions and improving peak symmetry.
More recent methods have employed gradient elution to simultaneously separate multiple β-blockers. One developed RP-HPLC method for atenolol, metoprolol tartrate, and phenol red uses a gradient starting from 10% to 35% acetonitrile over 15 minutes with a phosphate buffer (pH 7.0, 12.5 mM) [30]. The pH of the mobile phase significantly affects the ionization state of metoprolol (pKa ≈ 9.7), with neutral to slightly alkaline conditions typically providing optimal retention and peak shape on C18 columns.
Table 1: Mobile Phase Composition in Reported Metoprolol Methods
| Analysis Type | Buffer Component | Organic Modifier | Mode | Flow Rate (mL/min) | Detection |
|---|---|---|---|---|---|
| Stability-indicating [29] | Sodium dihydrogen phosphate | Acetonitrile (30%) | Isocratic | 1.0 | UV 274 nm |
| Metoprolol with metabolites [19] | Ammonium acetate (10 mM, pH 4.0) | Acetonitrile (gradient) | Gradient | 1.0 | Fluorescence |
| Simultaneous with atenolol [30] | Phosphate buffer (pH 7.0, 12.5 mM) | Acetonitrile (10-35%) | Gradient | 1.0 | UV 224 nm |
| UHPLC with ramipril [27] | Not specified | Not specified | Isocratic | 0.7 | Not specified |
Detection System Configuration
Detection parameters must be optimized based on the analytical requirements. UV detection at 224 nm provides sufficient sensitivity for metoprolol in formulation quality control [30], while 274 nm has been used for stability-indicating methods [29]. For enhanced sensitivity in biological matrices, fluorescence detection offers superior performance with excitation at 225 nm and emission at 335 nm, enabling quantification of metoprolol and its metabolites in plasma at nanogram per milliliter levels [19].
Analytical Methodologies for Metoprolol Research
Sample Preparation Techniques
The extraction of metoprolol from tablet matrices requires consideration of the specific formulation characteristics. For conventional immediate-release tablets, simple solvent extraction with sonication typically suffices. However, extended-release formulations like metoprolol succinate ER tablets present greater challenges due to their complex multi-particulate structure [15]. These often require more vigorous extraction procedures, potentially including initial grinding followed by extended mixing in appropriate solvents.
For biological samples, protein precipitation with acetonitrile or methanol represents the most common sample preparation approach. When developing an HPLC-FLD method for metoprolol and its metabolites in human plasma, researchers employed protein precipitation with acetonitrile, followed by centrifugation and direct injection of the supernatant [19]. This approach provided adequate clean-up for therapeutic drug monitoring while maintaining high recovery rates (>85%) for metoprolol and its metabolites.
Method Validation Parameters
Chromatographic methods for pharmaceutical analysis must undergo comprehensive validation according to ICH guidelines. The developed UHPLC method for simultaneous quantification of ramipril and metoprolol succinate demonstrated excellent linearity ranges of 18.56-58.79 μg/mL for ramipril and 25.10-75.15 μg/mL for metoprolol succinate [27]. The method exhibited precision with relative standard deviation values of 0.49% for ramipril and 0.59% for metoprolol succinate, confirming method robustness.
Table 2: Validation Parameters for Reported Chromatographic Methods
| Validation Parameter | Metoprolol with Metabolites [19] | Stability-Indicating [29] | UHPLC with Ramipril [27] | Simultaneous with Atenolol [30] |
|---|---|---|---|---|
| Linearity Range | 5-500 ng/mL (plasma) | Not specified | 25.10-75.15 μg/mL | 1.14-50 μg/mL |
| Precision (%RSD) | <10% | Not specified | 0.59% | Meets ICH M10 criteria |
| Accuracy (% Recovery) | 85-115% | Not specified | 100.05-100.18% | Meets ICH M10 criteria |
| LOD/LOQ | 1 ng/mL (LOD) | Established | Not specified | Established |
Advanced Applications and Specialized Methodologies
Stability-Indicating Methods
Forced degradation studies provide critical information about the stability characteristics of drug substances and products. A validated stability-indicating HPLC method for metoprolol succinate demonstrated that the drug undergoes extensive degradation under alkaline and thermal stress conditions, while remaining relatively stable in acidic, oxidative, and photolytic conditions [29]. The method successfully separated metoprolol from its degradation products, enabling accurate quantification of the active ingredient in stability samples.
The development of stability-indicating methods requires careful optimization of chromatographic conditions to achieve resolution between the parent drug and all potential degradation products. For metoprolol succinate, this typically involves gradient elution to accommodate degradation products with varying polarities. The C18 column demonstrated sufficient selectivity to resolve metoprolol from its major degradation products formed under various stress conditions [29].
Bioanalytical and Pharmacokinetic Applications
Chromatographic methods play an essential role in understanding the pharmacokinetic profiles of different metoprolol formulations. A crossover study comparing brand and generic metoprolol ER tablets utilized liquid chromatography tandem mass spectrometry for precise quantification of metoprolol concentrations, revealing differences in time to maximum concentration (Tmax) between formulations despite similar AUC and Cmax values [31]. Such findings highlight the importance of robust bioanalytical methods in establishing therapeutic equivalence.
The simultaneous determination of metoprolol with its metabolites α-hydroxymetoprolol and O-desmethylmetoprolol requires specialized method development. An optimized HPLC method with fluorescence detection achieved complete elution within 16 minutes with well-resolved peaks for all analytes, enabling application in pharmacokinetic studies following a single 100 mg oral dose of metoprolol [19]. The method employed an Agilent ZORBAX XDB-C18 column (150 mm × 4.6 mm, 5 μm) with a gradient mobile phase of 10 mM ammonium acetate (pH 4.0) and acetonitrile.
Experimental Workflows and Protocols
Detailed Method Development Protocol
The following workflow outlines a systematic approach to develop and validate an RP-HPLC/UHPLC method for metoprolol analysis in tablet formulations:
Step 1: Column Screening and Mobile Phase Selection
- Select 3-5 different C18 columns with varying dimensions (e.g., 150 mm, 100 mm) and particle sizes (5 μm, 3.5 μm, sub-2 μm)
- Prepare mobile phase alternatives: (a) phosphate buffer (pH 3.0)/ACN, (b) phosphate buffer (pH 7.0)/ACN, (c) ammonium acetate/ACN
- Perform initial isocratic runs (e.g., 70:30 aqueous:organic) with standard solutions to evaluate retention, peak shape, and efficiency
Step 2: Gradient Optimization
- For complex samples, develop gradient methods starting with a broad gradient (e.g., 5-95% organic over 20 minutes)
- Adjust gradient slope and initial/final organic percentages based on initial separation
- Fine-time gradient segments to optimize resolution of critical pairs
Step 3: Detection Optimization
- Perform UV scan of metoprolol standard to determine λmax (typically 224-274 nm)
- For enhanced sensitivity, explore fluorescence detection (excitation 225 nm, emission 335 nm)
Step 4: Method Validation
- Establish linearity using minimum 5 concentrations across expected range
- Evaluate precision through replicate injections (n=6) at target concentration
- Assess accuracy through spike recovery studies in placebo and actual matrices
Forced Degradation Study Protocol
Forced degradation studies provide critical data for developing stability-indicating methods. The following protocol outlines a systematic approach:
Stress Conditions:
- Acid degradation: 0.1N HCl at room temperature for 24 hours or 60°C for 1 hour
- Base degradation: 0.1N NaOH at room temperature for 24 hours or 60°C for 1 hour
- Oxidative degradation: 3% H2O2 at room temperature for 24 hours
- Thermal degradation: Solid state at 105°C for 24 hours
- Photodegradation: Exposure to UV light (254 nm) for 24 hours
Procedure:
- Prepare metoprolol solution at approximately 1 mg/mL in appropriate solvent
- Subject aliquots to each stress condition, removing samples at appropriate time points
- Neutralize acid/base samples immediately after stress period
- Analyze samples against unstressed control using developed HPLC method
- Identify degradation peaks through LC-MS if necessary
Metoprolol succinate demonstrates significant degradation under alkaline conditions and thermal stress, while remaining relatively stable under acidic, photolytic, and oxidative conditions [29]. The forced degradation samples should be analyzed using a photodiode array detector to establish peak purity and confirm complete separation of degradation products from the main peak.
The Scientist's Toolkit: Essential Research Reagents and Materials
Table 3: Essential Research Reagents and Materials for Metoprolol Chromatographic Analysis
| Category | Specific Items | Function/Purpose | Example Applications |
|---|---|---|---|
| Chromatographic Columns | C18 columns (e.g., Agilent ZORBAX, InertSustain) | Separation of analytes based on hydrophobicity | All metoprolol analyses [30] [27] [19] |
| Mobile Phase Components | Acetonitrile (HPLC grade), Methanol (HPLC grade), High-purity water, Buffer salts (e.g., potassium phosphate, ammonium acetate) | Creation of elution environment for compound separation | Mobile phase preparation [30] [29] [19] |
| Reference Standards | Metoprolol tartrate/succinate, Metoprolol metabolites (α-hydroxymetoprolol, O-desmethylmetoprolol) | Method calibration and compound identification | Quantification and identification [30] [19] |
| Sample Preparation Materials | Solvents (acetonitrile, methanol), Ultrasonic bath, Centrifuge, Syringe filters (0.22 μm, 0.45 μm) | Extraction and cleaning of samples prior to analysis | Protein precipitation, sample clarification [19] |
| Instrumentation | HPLC/UHPLC system with UV/Vis, PDA, or FLD detectors, pH meter, Analytical balance | Separation, detection, and measurement of analytes | All chromatographic analyses [30] [27] [29] |
Analysis of Tablet Matrix Challenges
The analysis of metoprolol in tablet formulations presents specific challenges related to the complex excipient composition and drug delivery system design. Extended-release formulations like metoprolol succinate ER incorporate a multi-particulate system where individual controlled-release units are compressed into tablets [15]. This complexity necessitates thorough extraction procedures and chromatographic methods capable of resolving the active ingredient from formulation components.
Recent research has highlighted additional challenges when tablets are split or crushed for clinical administration. Crushing metoprolol succinate modified-release tablets significantly alters their dissolution profile across gastrointestinal pH ranges (1.2, 4.5, 6.8) due to damage to the embedded micropellets [32]. These findings underscore the importance of dissolution testing coupled with chromatographic analysis to evaluate product performance under different administration scenarios.
RP-HPLC and UHPLC methods with C18 columns provide powerful analytical tools for metoprolol analysis in pharmaceutical formulations and biological matrices. Successful method development requires careful optimization of stationary phase selection, mobile phase composition, and detection parameters to address the specific challenges posed by different metoprolol formulations. The continued advancement in column technologies and instrument capabilities promises further improvements in separation efficiency, analysis speed, and method sensitivity for metoprolol research.
The integration of chromatographic data with other analytical techniques such as NIR chemical imaging [15] and dissolution testing [32] provides a comprehensive understanding of metoprolol product performance. As formulation technologies evolve toward more complex delivery systems, chromatographic method development must similarly advance to meet emerging analytical challenges in metoprolol pharmaceutical research.
In pharmaceutical analysis, a significant challenge is the simultaneous determination of multiple drugs in a single sample, especially when their fluorescence spectra extensively overlap. Conventional fluorescence spectroscopy, while highly sensitive, often lacks the selectivity required for such multi-component analyses due to the broad nature of fluorescence bands. This spectral overlap becomes particularly problematic when analyzing drugs in complex matrices such as tablet formulations and biological fluids, where excipients, degradation products, or endogenous compounds can interfere with accurate quantification [33].
Synchronous fluorescence spectroscopy (SFS) has emerged as a powerful solution to this challenge. This technique involves scanning both the excitation and emission monochromators simultaneously while maintaining a constant wavelength interval (Δλ) between them. The resulting synchronous spectra are characteristically narrower and simpler than conventional fluorescence spectra, leading to reduced spectral overlap and improved selectivity for multi-component analysis [34]. When combined with green chemistry principles, these methods offer environmentally sustainable alternatives to traditional chromatographic techniques, which often consume substantial amounts of organic solvents and generate significant chemical waste [35].
The application of these advanced spectrofluorimetric techniques is particularly relevant in the context of metoprolol research, where extraction from tablet matrices presents challenges related to excipient interference and spectral resolution. This technical guide explores the fundamental principles, methodological considerations, and practical applications of these alternative techniques for resolving complex analytical problems in pharmaceutical research and development.
Theoretical Foundations of Synchronous Fluorescence Spectroscopy
Fundamental Principles
Synchronous fluorescence spectroscopy operates on a fundamentally different principle than conventional fluorescence spectroscopy. In traditional fluorescence measurements, either the excitation wavelength is fixed while the emission spectrum is recorded, or the emission wavelength is fixed while the excitation spectrum is recorded. In contrast, SFS involves the simultaneous scanning of both monochromators while maintaining a constant wavelength difference (Δλ) or energy difference between them [34].
The synchronous fluorescence intensity (Is) can be mathematically represented as:
Is = K · C · l · Ex(λexc) · Em(λexc + Δλ)
Where K is an instrumental constant, C is the analyte concentration, l is the path length, Ex is the excitation function at wavelength λexc, and Em is the emission function at wavelength (λexc + Δλ) [34]. The resulting spectrum represents a mathematical product of the excitation and emission properties, which leads to significant band narrowing and spectral simplification compared to conventional fluorescence spectra.
Derivative Techniques for Enhanced Resolution
For cases where synchronous fluorescence alone does not provide sufficient resolution, derivative techniques can be employed to further enhance spectral selectivity. By converting the normal synchronous spectrum into its first or second derivative, the resolution of overlapping bands can be significantly improved because derivative signals are inversely proportional to the original spectral bandwidth [36].
Second derivative synchronous fluorescence spectroscopy is particularly effective for resolving overlapping peaks, as it converts shoulder peaks into distinct, measurable signals with negative amplitudes. This approach has been successfully applied to simultaneous determination of drug mixtures such as chlorzoxazone and ibuprofen in pharmaceutical preparations and biological fluids, where normal synchronous spectra still exhibited considerable overlap [36].
Greenness Assessment Tools
The environmental sustainability of analytical methods can be quantitatively evaluated using several metric tools. The Green Analytical Procedure Index (GAPI) and Analytical GREEnness (AGREE) are widely used tools that provide visual representations of a method's environmental impact across multiple parameters, including energy consumption, waste generation, and use of hazardous chemicals [33]. More recently, the Multi-Color Assessment (MA) tool and RGB12 whiteness evaluation have been developed, providing comprehensive scoring systems that compare the sustainability of new methods against conventional approaches [35].
Methodological Approaches and Workflows
Standard Synchronous Fluorescence Methodology
The implementation of synchronous fluorescence methods follows a systematic workflow that begins with careful optimization of experimental parameters. A generalized protocol for method development includes the following steps:
Preliminary Spectral Analysis: Record conventional excitation and emission spectra of individual analytes to determine their spectral characteristics and identify optimal Δλ values [33].
Δλ Optimization: Systematically vary Δλ between 20-200 nm to identify the value that provides the best compromise between sensitivity and resolution. Different drugs may require different optimal Δλ values; for example, agomelatine and venlafaxine were effectively resolved at Δλ = 20 nm [33], while lacidipine required Δλ = 160 nm for separation from its degradation product [37].
Solvent and Medium Optimization: Evaluate different solvents and organized media (e.g., micellar systems) to enhance fluorescence intensity and selectivity. Sodium dodecyl sulfate (SDS) at 1% w/v concentration has been widely used to significantly enhance fluorescence signals [33] [35].
pH Optimization: Study the effect of pH on fluorescence intensity using appropriate buffer systems. Most methods utilize Britton-Robinson buffer, phosphate buffer, or borate buffer in the pH range of 7-10 [33] [38].
Derivatization (if required): For compounds lacking native fluorescence, employ derivatization agents such as o-phthalaldehyde in the presence of β-mercaptoethanol to produce highly fluorescent derivatives [38].
The following workflow diagram illustrates the generalized experimental procedure for synchronous fluorescence method development:
Advanced Chemometric Approaches
For particularly challenging analytical problems with extensive spectral overlap, multivariate calibration methods coupled with synchronous fluorescence can provide enhanced resolution. The genetic algorithm-partial least squares (GA-PLS) approach has demonstrated superior performance for simultaneous quantification of drugs with overlapping spectra, such as amlodipine and aspirin [35].
The GA-PLS method combines the variable selection capability of genetic algorithms with the dimensional reduction ability of partial least squares regression. This hybrid approach identifies the most informative spectral variables while eliminating redundant or noise-dominated regions, resulting in more robust and accurate predictive models. Implementation typically involves:
Experimental Design: Construction of a calibration set using factorial designs to ensure adequate concentration variation across the analytical range.
Spectral Acquisition: Recording synchronous fluorescence spectra of standard mixtures across the predetermined wavelength range.
Variable Selection: Application of genetic algorithms to identify optimal wavelength subsets that contribute most significantly to the predictive model.
Model Validation: Internal validation through cross-validation and external validation using independent sample sets to ensure model reliability and transferability [35].
Research Reagent Solutions
The successful implementation of green spectrofluorimetric methods relies on several key reagents and materials that enhance sensitivity, selectivity, and environmental sustainability.
Table 1: Essential Research Reagents for Green Spectrofluorimetric Methods
| Reagent/Material | Function/Purpose | Application Examples |
|---|---|---|
| Sodium dodecyl sulfate (SDS) | Micellar medium for fluorescence enhancement | Venlafaxine and agomelatine determination [33] |
| Tween-80 | Non-ionic surfactant for fluorescence enhancement | Lacidipine analysis in presence of degradation product [37] |
| β-cyclodextrin | Molecular encapsulation for selectivity improvement | Host-guest complex formation for spectral resolution |
| o-Phthalaldehyde | Derivatizing agent for non-fluorescent compounds | Determination of aripiprazole and clozapine [38] |
| β-mercaptoethanol | Stabilizing agent for derivatization products | Enhancement of o-phthalaldehyde derivative stability [38] |
| Borate buffer | pH control for derivatization reactions | Optimal pH for o-phthalaldehyde reactions [38] |
| Methanol/Ethanol | Green solvents for extraction and dilution | Alternative to more hazardous organic solvents |
Applications in Pharmaceutical Analysis
Simultaneous Determination of Multi-component Formulations
Synchronous fluorescence spectroscopy has been successfully applied to the simultaneous determination of numerous drug combinations in pharmaceutical formulations and biological fluids. The technique is particularly valuable for fixed-dose combination products, where conventional methods often require extensive sample preparation or chromatographic separation.
Table 2: Applications of Synchronous Fluorescence in Pharmaceutical Analysis
| Drug Combination | Δλ (nm) | Linear Range (ng/mL) | LOD (ng/mL) | Application Matrix |
|---|---|---|---|---|
| Agomelatine & Venlafaxine [33] | 20 | 5.0-200 (AGM)20.0-1000 (VFX) | 0.14-0.84 | Human plasma |
| Chlorzoxazone & Ibuprofen [36] | 60 | 200-4000 (CLZ)100-1600 (IP) | 28 (CLZ)8.3 (IP) | Capsules & human plasma |
| Amlodipine & Aspirin [35] | 100 | 200-800 (both) | 22.05 (AML)15.15 (ASP) | Pharmaceutical formulations & human plasma |
| Telmisartan & Rosuvastatin [39] | 70 | 30-300 (TEL)10-150 (ROS) | 3.51 (TEL)1.72 (ROS) | Tablets & rat plasma |
| Lacidipine [37] | 160 | 50-300 | 14.51 | Pharmaceutical preparation & spiked human plasma |
The application of these methods to real pharmaceutical formulations typically involves simple sample preparation procedures. For tablet analysis, the general protocol includes:
- Powder Preparation: Finely powdering and homogenizing tablet contents.
- Extraction: Sonication or shaking with appropriate solvents (frequently water, ethanol, or methanol).
- Filtration: Removal of insoluble excipients using membrane filters (0.45 μm).
- Dilution: Appropriate dilution within the method's linear range.
- Analysis: Measurement of synchronous fluorescence intensity at predetermined wavelengths [33] [37].
Analysis in Biological Fluids
The high sensitivity of synchronous fluorescence methods makes them particularly suitable for therapeutic drug monitoring and pharmacokinetic studies in biological fluids. The determination of drugs in plasma typically requires protein precipitation using organic solvents such as methanol or acetonitrile, followed by centrifugation and analysis of the supernatant [33] [35].
For example, a green synchronous spectrofluorimetric method was developed for the simultaneous determination of agomelatine and venlafaxine in human plasma with excellent recovery (97.4-102.2%) and very low detection limits (0.14-0.84 ng/mL), enabling therapeutic drug monitoring at part per billion levels [33]. Similarly, a first-derivative synchronous fluorescence method was successfully applied to the pharmacokinetic study of telmisartan and rosuvastatin in rat plasma following oral administration [39].
The following diagram illustrates the complete analytical workflow for pharmaceutical formulation analysis, from sample preparation to data analysis:
Method Validation and Analytical Performance
Validation Parameters
Comprehensive method validation is essential to establish the reliability and suitability of synchronous fluorescence methods for their intended applications. Validation follows established guidelines such as ICH Q2(R2) and typically includes the following parameters:
- Linearity: Demonstrated through correlation coefficients (r² > 0.999) across the analytical range [33] [35].
- Accuracy: Evaluated through recovery studies (typically 95-105%) from spiked placebo or biological matrices [33] [37].
- Precision: Assessed as intra-day and inter-day precision, expressed as relative standard deviation (RSD < 2%) [35] [38].
- Limit of Detection (LOD) and Quantification (LOQ): Determined based on signal-to-noise ratios of 3:1 and 10:1, respectively [33] [36].
- Robustness: Evaluated by examining the effect of small, deliberate variations in method parameters [37].
- Specificity: Demonstrated through the analysis of samples containing potential interferents, including degradation products and matrix components [37].
Greenness Assessment
The environmental sustainability of analytical methods can be quantitatively evaluated using modern assessment tools. The Analytical GREEnness (AGREE) calculator and Green Analytical Procedure Index (GAPI) provide comprehensive evaluations of method greenness based on multiple parameters, including energy consumption, waste generation, and use of hazardous chemicals [33].
For example, the GA-PLS method for amlodipine and aspirin quantification achieved an overall sustainability score of 91.2% using the MA Tool and RGB12 whiteness evaluation, demonstrating clear superiority over conventional HPLC-UV (83.0%) and LC-MS/MS (69.2%) methods across environmental, analytical, and practical dimensions [35].
Synchronous fluorescence spectroscopy and green spectrofluorimetric approaches represent powerful alternatives to conventional analytical methods for resolving spectral overlap challenges in pharmaceutical analysis. These techniques offer significant advantages in terms of simplicity, sensitivity, selectivity, and environmental sustainability, making them particularly valuable for routine analysis in quality control laboratories and for therapeutic drug monitoring.
The application of these methods in the context of metoprolol extraction from tablet matrices can address common challenges related to excipient interference and spectral resolution. By implementing the methodologies and protocols outlined in this technical guide, researchers and pharmaceutical analysts can develop robust, sustainable, and cost-effective analytical procedures that align with the principles of green chemistry while maintaining high analytical performance standards.
Future perspectives in this field include the increased integration of chemometric approaches for handling complex multi-component systems, the development of miniaturized and automated spectrofluorimetric systems, and the implementation of whiteness metrics as standard practice for evaluating analytical method sustainability. As regulatory requirements for environmental impact assessment become more stringent, these green analytical techniques are poised to play an increasingly important role in pharmaceutical analysis and drug development workflows.
The development of robust and precise analytical methods is paramount in pharmaceutical quality control, especially for drugs like metoprolol tartrate, a widely prescribed β1-adrenergic blocking agent. A significant challenge in this endeavor is the efficient extraction and accurate quantification of the active pharmaceutical ingredient (API) from its dosage form, particularly against the background interference of excipients that constitute the tablet matrix. Metoprolol is a highly water-soluble drug (BCS Class I), and its analysis often employs Reversed-Phase High-Performance Liquid Chromatography (RP-HPLC or RPLC), which is the dominant mode for approximately 80% of all HPLC applications due to its excellent precision and reliability [40]. The core of this analytical challenge lies in achieving sufficient peak resolution—a measure of how well two adjacent peaks are separated—to ensure that the metoprolol peak is distinct from any interfering peaks originating from the matrix or degradation products. The mobile phase, a critical component of the chromatographic system, plays the most significant role in manipulating this retention and selectivity. Among the various choices, the combination of methanol and phosphate buffer presents a classic, yet highly effective, solution for overcoming these challenges and achieving optimal peak resolution for metoprolol.
Mobile Phase Fundamentals: The Role of Methanol and Phosphate Buffer
In RP-HPLC, a hydrophobic stationary phase is paired with a polar mobile phase. Analytes are retained based on hydrophobic interactions, and their elution is controlled by the composition of the mobile phase. The mobile phase typically consists of two components: an aqueous component (Mobile Phase A) and an organic component (Mobile Phase B). For metoprolol analysis, the selection of methanol and phosphate buffer as the organic and aqueous components, respectively, is driven by their complementary physicochemical properties.
- Methanol as Mobile Phase B: Methanol is a protic solvent, meaning it can function as both a proton donor and a proton acceptor. This property allows for specific interactions with analytes that possess hydrogen-bonding capabilities. While acetonitrile is often preferred for its lower viscosity and higher eluotropic strength, methanol offers distinct selectivity differences, is less expensive, and is highly effective in resolving compounds like metoprolol. Its higher viscosity compared to acetonitrile must be considered, as a 50% methanol:water mixture has a viscosity of 1.62 cP, which can lead to higher backpressures but can also be beneficial in certain separations [40].
- Phosphate Buffer as Mobile Phase A: Most drug substances, including metoprolol, are ionizable. The degree of ionization profoundly affects their retention on a reversed-phase column. Phosphate buffer is historically the most common buffer in HPLC due to its excellent buffering capacity at pH values around 2, 7, and 10 (as phosphoric acid has three pKa values). It is highly UV-transparent, making it ideal for methods using UV detection, which is common in the analysis of metoprolol from matrix tablets [3] [40]. By maintaining a stable pH, the phosphate buffer ensures that the ionization state of metoprolol remains constant, leading to reproducible retention times and consistent peak shapes.
Table 1: Key Properties of Common RP-HPLC Mobile Phase Components
| Component | Type | Eluotropic Strength | Viscosity (cP) | Key Advantages | Key Disadvantages |
|---|---|---|---|---|---|
| Methanol | Protic Solvent | Intermediate | 0.55 | Cost-effective, good for hydrogen-bonding, distinct selectivity | Higher viscosity, UV cut-off ~210 nm |
| Acetonitrile | Aprotic Solvent | Stronger than methanol | 0.37 | Low viscosity, high efficiency, UV transparent to ~190 nm | More expensive, different selectivity |
| Phosphate Buffer | Aqueous Buffer | N/A | N/A | Excellent buffering capacity, UV transparent, widely accepted | Not MS-compatible, can precipitate with acetonitrile |
| Trifluoroacetic Acid | Acidic Additive | N/A | N/A | Volatile (MS-compatible), effective at low pH | Can cause baseline shift in low-UV, corrosive |
Experimental Protocols for Method Optimization
Developing a validated HPLC method for metoprolol extraction from tablets requires a systematic approach to optimize the mobile phase composition, pH, and gradient profile.
Sample Preparation from Tablet Matrix
Metoprolol tartrate matrix tablets are complex formulations. A typical sample preparation protocol, as derived from literature, involves the following steps [3]:
- Pulverization: The matrix tablet is first pulverized into a fine powder using a mortar and pestle.
- Extraction: The powdered tablet is transferred to a volumetric flask (e.g., 250 mL). The volume is adjusted with the mobile phase solvent or a pH 7.4 phosphate buffer.
- Shaking: The mixture is shaken for a defined period (e.g., 24 hours) to ensure complete extraction of the drug from the matrix.
- Filtration: The mixture is then filtered to remove insoluble excipients and polymer components (e.g., carrageenan, HPMC, Eudragit).
- Dilution: The filtrate is further diluted as necessary to fall within the linear range of the UV detector, typically to a concentration range of 5–40 μg/mL [3].
Chromatographic Conditions and Optimization
The core of the analysis lies in the chromatographic separation. A typical experimental setup is as follows:
- Apparatus: USP Dissolution Rate Apparatus or standard HPLC system.
- Column: C18 reversed-phase column (e.g., 250 mm x 4.6 mm, 5 μm).
- Detection: UV-spectrophotometric detection at 222 nm, validated for linearity, specificity, and precision according to USP criteria [3].
- Mobile Phase: A mixture of Methanol and Phosphate Buffer in a defined ratio. A common starting point is a ratio between 30:70 and 40:60 (Methanol:Buffer).
- Buffer Preparation: The phosphate buffer (e.g., 10-50 mM) is prepared by mixing potassium dihydrogen phosphate with water and adjusting the pH with phosphoric acid or potassium hydroxide. For metoprolol, a basic compound, a pH of 7.0-7.5 is often optimal as it suppresses the ionization of the drug, increasing its retention and improving peak shape by reducing interaction with residual silanols on the stationary phase [40].
- Optimization Strategy: The mobile phase ratio and pH should be varied systematically. For instance, increasing the methanol percentage decreases retention time, while adjusting the pH can significantly alter the selectivity. The goal is to achieve a resolution (Rs) value of >2.0 between the metoprolol peak and the closest eluting interference peak from the matrix.
The following workflow diagram illustrates the key decision points in the method development process:
Diagram 1: Mobile Phase Optimization Workflow for Metoprolol Analysis
Data Presentation: Quantitative Analysis of Optimized Methods
The success of mobile phase optimization is measured by key performance metrics. The following table summarizes target values for a validated method and the impact of mobile phase parameters, based on data from formulation studies [3] [4].
Table 2: Target Performance Metrics for Metoprolol HPLC Analysis
| Performance Metric | Target Value | Influence of Methanol | Influence of Phosphate Buffer pH |
|---|---|---|---|
| Retention Time (min) | 5 - 15 minutes | Increasing % decreases retention time | Higher pH increases retention for basic drugs |
| Peak Asymmetry (Tailing Factor) | < 2.0 | Can improve with optimized strength | Critical; correct pH minimizes silanol interactions |
| Theoretical Plates | > 2000 | Higher % can reduce efficiency (viscosity) | Stable pH ensures consistent efficiency |
| Resolution (Rs) | > 2.0 from any adjacent peak | Adjusts selectivity vs. other solvents | Can dramatically alter selectivity |
The robustness of the method can be further assessed by testing the system suitability with a specific optimized mobile phase. For example, a study on metoprolol sustained-release matrix tablets reported successful analysis using a mobile phase and specific conditions that yielded high-resolution separation from matrix components [4].
Table 3: Example of an Optimized Mobile Phase System for Metoprolol
| Parameter | Specification | Experimental Observation |
|---|---|---|
| Mobile Phase | Methanol: Phosphate Buffer (pH 7.2) [35:65 v/v] | Baseline separation of metoprolol from excipient peaks |
| Flow Rate | 1.0 mL/min | Backpressure within acceptable instrument limits |
| Column Temperature | 30°C | Improved efficiency and consistent retention |
| Injection Volume | 20 μL | Good detector response with minimal peak broadening |
| Resulting Resolution (Rs) | > 2.5 | Meets pharmacopeial requirements for quantification |
The Scientist's Toolkit: Essential Research Reagents
The following table details the key reagents and materials required for the development and execution of an RP-HPLC method for metoprolol using methanol and phosphate buffer.
Table 4: Research Reagent Solutions for Metoprolol HPLC Analysis
| Reagent/Material | Function in the Experiment |
|---|---|
| Metoprolol Tartrate API | Active Pharmaceutical Ingredient standard for calibration curve and identification. |
| Metoprolol Matrix Tablets | The test formulation from which the drug is extracted, containing polymers like HPMC or Eudragit [3] [4]. |
| HPLC-Grade Methanol | The organic modifier (strong solvent) in the mobile phase, controlling elution strength and selectivity. |
| Potassium Dihydrogen Phosphate / Disodium Hydrogen Phosphate | Components for preparing the phosphate buffer, which controls pH and ionic strength. |
| Ortho-Phosphoric Acid / Sodium Hydroxide | Used to adjust the pH of the aqueous buffer to the desired setpoint (e.g., 7.2). |
| C18 Reversed-Phase Column | The stationary phase where chromatographic separation occurs based on hydrophobic interactions. |
| UV Spectrophotometer / DAD | The detection system for quantifying metoprolol, typically at its λ_max of ~222 nm [3]. |
The combination of methanol and phosphate buffer represents a powerful and robust mobile phase system for addressing the persistent challenge of resolving metoprolol from complex tablet matrices. Methanol provides a cost-effective and selectivity-tuning organic component, while the phosphate buffer offers unparalleled pH control and UV transparency, which is crucial for achieving symmetrical peaks and reproducible retention times. By following a systematic optimization protocol that carefully adjusts the methanol-to-buffer ratio and the pH, researchers can develop a highly resolved, stability-indicating HPLC method. This ensures accurate quantification of metoprolol, which is fundamental for quality control, stability testing, and ensuring the safety and efficacy of this essential cardiovascular medication. The move towards simpler, binary solvent systems in modern HPLC, as highlighted in the literature, further underscores the enduring relevance and utility of the methanol-phosphate buffer combination in robust analytical method development [40].
Troubleshooting Extraction Hurdles and Optimizing for Precision and Recovery
The development of robust and effective pharmaceutical drug delivery systems, such as those for metoprolol tartrate, presents a significant challenge. Conventionally, formulators manipulated one variable at a time (OVAT), an approach that is not only time-consuming but often fails to identify optimal conditions because it overlooks interactions between critical parameters [41]. The systematic approach of Design of Experiments (DoE) provides an economical and effective analytical tool to overcome these limitations, enabling researchers to control and optimize input variables to maximize the quality of the output formulation [42]. For challenges like optimizing the extraction or release of metoprolol from complex tablet matrices, Response Surface Methodology (RSM) is a particularly powerful DoE technique used to find the optimal combination of factors that produce the best possible response [43] [44].
Among the various RSM designs, the Box-Behnken Design (BBD) has emerged as a proficient and powerful tool. It is a class of rotatable or nearly rotatable second-order design based on three-level incomplete factorial designs [43] [44]. Its utility is paramount in pharmaceutical research where running experiments at extreme, simultaneous factor levels can be physically impossible, too expensive, or even dangerous [45].
Theoretical Foundations of Box-Behnken Design
Core Principles and Structure
Box-Behnken designs, devised by George E. P. Box and Donald Behnken in 1960, are constructed to achieve specific goals [43]. They are spherical designs where all design points are located on a sphere and are equidistant from the center. Furthermore, they are either rotatable or nearly rotatable, meaning the prediction variance depends only on the distance from the center and not on the direction, ensuring consistent precision throughout the experimental region [43] [45].
A key characteristic of BBD is that it avoids conducting experiments at the extreme vertices of the design space (e.g., combinations where all factors are simultaneously at their highest or lowest levels) [45] [44]. The design can be visualized as a combination of two-level factorial designs with an incomplete block design. For each "block," a subset of factors is put through all combinations of a two-level factorial, while the remaining factors are held at their central, mid-point values [43].
Table 1: Number of Experiments in a Box-Behnken Design
| Number of Factors (k) | Number of Experiments (N = 2k(k-1) + C0) | Typical Total with Center Points |
|---|---|---|
| 3 | 12 + C0 | 15, 17 |
| 4 | 24 + C0 | 27, 29 |
| 5 | 40 + C0 | 42, 46 |
Comparative Advantages and Disadvantages
When selecting an experimental design, understanding its relative strengths and weaknesses is crucial.
Advantages:
- High Efficiency: BBD is slightly more efficient than Central Composite Designs (CCD) for a quadratic model, meaning it can estimate the model coefficients with fewer experimental runs, especially as the number of factors increases [43] [44].
- Avoids Extreme Conditions: The design is advantageous when combined factor extremes are risky, impractical, or prohibitively costly [45].
- Reasonable Run Count: The number of required experiments grows at a manageable rate, making it practical for pharmaceutical applications with multiple factors [43].
Disadvantages:
- Poor Coverage of Corners: BBD does not contain points at the vertices of the design space cube, which can be a drawback if information about these extreme conditions is desired [43] [44].
- Limited to Continuous Factors: This design type is exclusively for continuous factors [45].
Table 2: Comparison of Response Surface Designs
| Design Type | Efficiency | Runs for 3 Factors | Ability to Estimate Extreme Points |
|---|---|---|---|
| Box-Behnken (BBD) | High | ~15 | No |
| Central Composite (CCD) | Medium | ~20 | Yes |
| 3-Level Full Factorial | Low | 27 | Yes |
Practical Application to Metoprolol Tartrate Formulation
A Case Study: Layered Matrix Tablets
A practical application of BBD can be illustrated in the development of a controlled-release layered matrix tablet for metoprolol tartrate (MT), a widely used beta-blocker for cardiovascular diseases [3]. The objective was to identify a formulation that provides a zero-order release profile for twice-daily administration, aligning with a target release profile plotted from clinical pharmacokinetic data.
In this study, various swellable polymers, including carrageenan (CN), hydroxypropylmethyl cellulose (HPMC), pectin (PC), guar gum (GG), and xanthan gum (XG), were evaluated alone or in combination as release-retardant layers [3]. The performance of these formulations was evaluated against the target profile, and carrageenan was identified as the best polymer due to its superior fit.
Detailed Experimental Protocol
The following protocol, derived from the research, provides a reproducible methodology for formulating and testing layered matrix tablets [3].
1. Materials:
- Active Pharmaceutical Ingredient (API): Metoprolol Tartrate (150 mg per tablet).
- Polymers: Carrageenan, HPMC, Pectin, Guar Gum, Xanthan Gum, Chitosan, Ethyl Cellulose.
- Equipment: Single-punch hydraulic hand press (e.g., Carver Laboratory Press), V-type mixer, micrometer, hardness tester, friabilator, USP dissolution apparatus.
2. Formulation and Preparation (Two-Layered Tablet):
- Step 1: Matrix Layer Preparation. Precisely weigh 150 mg of MT and 150 mg of the polymer (or polymer mixture). Mix them uniformly in a V-type mixer for 10 minutes.
- Step 2: Inferior Layer Compression. Place a pre-weighed amount (e.g., 150 mg) of the polymer as the release-retardant layer into the die cavity (13 mm diameter). Apply a slight pre-compression for uniform spreading.
- Step 3: Final Compression. Lift the upper punch and add the mixed matrix layer (API + polymer) over the bottom layer in the die. Compress the two layers at a pressure of 3,768 kg/cm² for 10 seconds.
3. Physical Tests of Tablets:
- Hardness: Evaluate using a Monsanto-type hardness tester.
- Friability: Weigh 10 tablets (W1), rotate them in a friabilitor for 100 revolutions (4 minutes), and weigh again (W2). Calculate percentage friability as %F = [(W1 - W2) / W1] * 100.
- Drug Content Uniformity: Pulverize a tablet, transfer it to a 250-ml volumetric flask, and make up the volume with pH 7.4 phosphate buffer. Shake for 24 hours, filter, and assay the drug content spectrophotometrically at 222 nm.
4. In Vitro Drug Release Studies:
- Use USP dissolution Rate Apparatus 1 (basket apparatus).
- Conditions: 100 rpm, 37 ± 0.5°C, 900 ml of pH 1.2 hydrochloric acid buffer for the first 2 hours, followed by pH 7.4 phosphate buffer until the end of the test.
- Regularly sample and analyze the dissolution medium using a validated UV-spectroscopic method at 222 nm.
Data Analysis and Optimization Strategy
Building and Interpreting the Quadratic Model
The data collected from the BBD experiments are analyzed using multiple linear regression to fit a second-order (quadratic) model. The general form of this model is:
Y = β₀ + β₁A + β₂B + β₃C + β₁₂AB + β₁₃AC + β₂₃BC + β₁₁A² + β₂₂B² + β₃₃C²
Where Y is the response variable (e.g., % drug release at 8 hours), β₀ is the intercept, A, B, C are the factors, β₁, β₂, β₃ are the main effect coefficients, β₁₂, β₁₃, β₂₃ are the interaction effect coefficients, and β₁₁, β₂₂, β₃₃ are the quadratic effect coefficients [45].
The statistical analysis provides an Effect Summary that identifies which terms are active (statistically significant). For example, in a BBD for a tennis ball's stretch, active curvature (quadratic effect) for Sulfur and Silica, and active interactions between Silica-Sulfur and Sulfur-Silane were found [45]. Insignificant terms are removed from the model using variable selection techniques to create a refined, predictive model.
Multi-Response Optimization using the Desirability Function
Pharmaceutical optimization often involves balancing multiple, often conflicting, response goals (e.g., target drug release profile, tablet hardness, minimal friability). A powerful solution is the use of a desirability function (D), as proposed by Derringer and Suich [44].
The process is as follows:
- Define Individual Desirability (dᵢ): For each response (Yᵢ), a desirability function dᵢ is created. This function scales the predicted value of Yᵢ to a range from 0 (completely undesirable) to 1 (fully desirable). The shape of the function (one-sided or two-sided) depends on whether the goal is to maximize, minimize, or hit a target value.
- Calculate Overall Desirability (D): The individual desirabilities are combined into a single composite metric, D, by calculating their geometric mean:
D = (d₁ × d₂ × … × dₘ)^{1/m}. - Optimize: An algorithm is used to find the factor settings that maximize the overall desirability, D, thus identifying the optimal compromise that satisfies all critical-to-quality responses simultaneously [44].
The Scientist's Toolkit: Essential Research Reagents and Materials
Table 3: Key Research Reagent Solutions for Metoprolol Formulation Development
| Reagent/Material | Function in the Experiment | Example from Literature |
|---|---|---|
| Metoprolol Tartrate | Active Pharmaceutical Ingredient (API); model drug for cardiovascular extended-release formulations. | 150 mg per tablet as the standard dose [3]. |
| Carrageenan | Swellable polymer; acts as a release-retardant layer in matrix tablets to control drug release. | Identified as the best polymer for achieving target release profile in layered tablets [3]. |
| Hypromellose (HPMC) | High-viscosity rate-controlling polymer; forms a gel layer in hydrophilic matrix tablets for extended release. | Used in robustness studies of barrier-membrane coated MT tablets [6]. |
| Chitosan | Natural polymer; can be used in combination with other polymers to modify release characteristics. | Used in a 1:1 mixture with carrageenan in two-layered tablet formulations [3]. |
| Ethyl Cellulose | Insoluble polymer; can act as a barrier membrane to further retard drug release and eliminate burst release. | EC grades (N7, N10, N100) tested as release-retardant layers [3] [6]. |
| pH 1.2 HCl Buffer | Simulates the acidic environment of the stomach in dissolution testing. | Used for the first 2 hours of in vitro drug release studies [3]. |
| pH 7.4 Phosphate Buffer | Simulates the intestinal environment in dissolution testing. | Used after 2 hours to complete the drug release study [3]. |
Advanced Considerations and Robustness Testing
A formulation is only successful if it performs consistently under variable conditions. Robustness testing is the capacity of an analytical method (or formulation) to remain unaffected by small, deliberate variations in method parameters [44]. For an MT extended-release formulation, this means ensuring consistent drug release not only under standard conditions but also under physiologically relevant variations.
Research on barrier-membrane (BM) coated MT tablets demonstrates this principle. The drug release from these advanced formulations was tested under varying media osmolality, surface tension (using surfactants like SLS and Tween 80), and mechanical stress simulating fed and fasted states [6]. The BM-coated matrices showed minimal sensitivity to these changes, unlike uncoated matrices which exhibited faster release under certain stresses. This demonstrates a robust formulation, a critical goal achievable through systematic optimization using designs like BBD [6].
The extraction of active pharmaceutical ingredients (APIs) like metoprolol from finished dosage forms presents significant challenges for pharmaceutical researchers and analytical scientists. Tablet matrices contain complex mixtures of excipients—binders, fillers, disintegrants, and lubricants—that can interfere with extraction efficiency, analytical accuracy, and method validation. Metoprolol, a selective β₁-adrenergic receptor blocker existing primarily as tartrate and succinate salts in commercial formulations, requires precise parameter optimization to overcome these matrix effects and achieve quantitative recovery.
The fundamental challenges in metoprolol extraction research include: (1) achieving complete drug liberation from sustained-release polymer matrices, (2) minimizing co-extraction of interfering excipients, (3) maintaining drug stability during extraction, and (4) ensuring method compatibility with subsequent analytical techniques. This whitepaper examines three critical parameter classes—pH adjustment, salt addition, and solvent selection—that govern extraction efficiency, with a focus on practical, experimentally-validated approaches for maximizing metoprolol yield from various pharmaceutical formulations.
Theoretical Foundations: Physicochemical Properties of Metoprolol
Metoprolol is a moderately basic compound (pKa ~9.7) exhibiting pH-dependent solubility. The drug exists predominantly in its protonated, water-soluble cationic form under acidic conditions, while the free base form predominates at alkaline pH, favoring organic solvent partitioning. Understanding this equilibrium is fundamental to parameter optimization.
Table 1: Key Physicochemical Properties of Metoprolol
| Property | Value/Characteristics | Extraction Implications |
|---|---|---|
| pKa | 9.7 [12] | Dictates pH-dependent ionization; cationic form dominates at pH <8.7 |
| Solubility | Highly soluble in water; pH-dependent [46] | Aqueous extraction feasible; organic solvents require pH adjustment |
| Salt Forms | Tartrate, succinate, fumarate [4] | Salt dissociation required prior to extraction |
| log P | ~1.7 (moderate lipophilicity) [47] | Partitions to both aqueous and organic phases based on pH |
| Stability | Stable in acidic conditions; susceptible to oxidation | Extraction pH and solvent selection critical for stability |
The extraction strategy must account for the specific salt form in the formulation. Metoprolol tartrate (MPT) is highly water-soluble, while the free base can be extracted into organic solvents. The dissociation of metoprolol salts and subsequent control of the ionic equilibrium through pH adjustment forms the theoretical basis for efficient extraction.
Key Parameter 1: pH Adjustment
Fundamental Principles and Experimental Evidence
pH adjustment represents the most critical parameter for optimizing metoprolol extraction efficiency. The primary amine group in metoprolol's molecular structure undergoes protonation-deprotonation equilibrium, fundamentally altering solubility and partitioning behavior across different pH conditions.
Experimental evidence demonstrates that complexation efficiency between metoprolol and copper(II) ions peaks at pH 6.0 when using Britton-Robinson buffer, yielding a colored complex with maximum absorbance at 675 nm [48]. This pH optimizes coordination between the metal ion and metoprolol's secondary amine and ether oxygen groups while maintaining sufficient drug solubility. For biological sample extraction, protein precipitation for plasma samples employs acidic conditions using trichloroacetic acid (25% w/v) to denature proteins and liberate bound drug molecules [12].
Detailed Protocol: pH Optimization for Complexation
Objective: To determine optimal pH for metoprolol-copper complex formation to enable spectrophotometric quantification.
Reagents:
- Metoprolol standard solution (0.2 mg/mL in water)
- Copper(II) chloride dihydrate solution (0.5% w/v in water)
- Britton-Robinson buffer series (pH 3.0-9.0)
- Deionized water
Methodology:
- Prepare aliquot volumes of stock solution containing 8.5-70 μg of metoprolol in 10 mL volumetric flasks
- Add 1 mL of Britton-Robinson buffer at varying pH values (3.0, 4.0, 5.0, 6.0, 7.0, 8.0, 9.0)
- Add 1 mL CuCl₂·2H₂O solution to each flask
- Mix well for 20 minutes while heating at 35°C in a thermostatically controlled water bath
- Cool rapidly and dilute to mark with distilled water
- Measure absorbance at 675 nm against reagent blank
- Plot absorbance versus pH to identify optimal complexation pH
Expected Outcome: Maximum complex formation occurs at pH 6.0, producing a blue-colored adduct with linear Beer's Law response between 8.5-70 μg/mL [48].
Key Parameter 2: Salt Addition
Strategic Application of Salt Effects
Salt addition influences metoprolol extraction through multiple mechanisms: (1) salting-out effects that reduce API solubility in aqueous phases, (2) ionic strength modification that alters extraction kinetics, and (3) competitive ion pairing that disrupts drug-excipient interactions in solid matrices.
The formation of a binuclear copper(II) complex with metoprolol (MPT₂Cu₂Cl₂) demonstrates how salt addition can create a unique extraction pathway [48]. The chloride counterions facilitate precipitation of the complex, enabling separation from the aqueous matrix. In biological sample preparation, the addition of salts like sodium chloride can improve recovery by minimizing analyte adhesion to container surfaces and reducing nonspecific binding.
Detailed Protocol: Binuclear Copper Complex Formation
Objective: To precipitate and isolate metoprolol as a copper complex for quantitative extraction and analysis.
Reagents:
- Metoprolol tartrate standard
- Copper(II) chloride dihydrate
- Methanol
- Deionized water
Methodology:
- Prepare methanolic CuCl₂·2H₂O solution (0.171 g, 1.0 mmol in 20 mL)
- Prepare methanolic metoprolol tartrate solution (0.267 g, 1.0 mmol in 20 mL)
- Add copper solution dropwise to metoprolol solution with constant stirring
- Heat reaction mixture at 35°C for 4 hours in thermostatically controlled water bath
- Filter resulting blue precipitate
- Wash with methanol/water (1:1 v/v)
- Dry under vacuum over P₂O₅ for several days
- Confirm complex formation by chloride titration with AgNO₃ and elemental analysis
Characterization: The complex exhibits specific IR spectra changes with disappearance of ν(OH) bands at 3459 cm⁻¹ due to deprotonation of the alcohol oxygen, and appearance of M-N, M-O, and M-Cl vibrations at 487, 430, and 318 cm⁻¹, respectively [48].
Key Parameter 3: Solvent Selection
Systematic Solvent Evaluation
Solvent selection for metoprolol extraction must balance multiple competing factors: extraction efficiency, selectivity against excipients, compatibility with analytical instrumentation, environmental impact, and practical handling considerations. The physicochemical properties outlined in Table 1 guide appropriate solvent selection.
Water proves effective for immediate-release formulations containing metoprolol tartrate, with studies demonstrating complete extraction using water alone [48]. For sustained-release formulations based on Eudragit polymers, methanol and methanol-water mixtures show superior extraction efficiency due to polymer swelling and drug diffusion enhancement [4]. In biological sample preparation, mixtures of methanol with trichloroacetic acid provide optimal protein precipitation while maintaining metoprolol stability in solution [12].
Detailed Protocol: Exhaustive Extraction from Sustained-Release Formulations
Objective: To completely extract metoprolol from sustained-release matrix tablets containing polymer blends.
Reagents:
- Ground tablet powder
- Methanol
- Deionized water
- Trichloroacetic acid
Methodology:
- Weigh and pulverize ten tablets
- Transfer powder equivalent to 40 mg metoprolol to conical flask
- Add 20 mL methanol:water (70:30 v/v)
- Sonicate for 15 minutes at 35°C
- Centrifuge at 4000 rpm for 10 minutes
- Collect supernatant and repeat extraction 3× with fresh solvent
- Combine supernatants in 100 mL volumetric flask
- Dilute to volume with extraction solvent
- Filter through 0.45 μm membrane before analysis
- For HPLC/LC-MS analysis, mix 0.4 mL plasma sample with 0.225 mL methanol and 0.2 mL trichloroacetic acid (25% w/v), sonicate 2 min, centrifuge at 13,000 rpm for 10 min, and inject clear supernatant [12]
Validation: Method accuracy should be verified through standard addition techniques, with extraction efficiency exceeding 95% for validated methods.
Integrated Workflow and Parameter Interdependencies
The following workflow diagram illustrates the strategic integration of the three key parameters—pH adjustment, salt addition, and solvent selection—in a sequential extraction process for metoprolol from tablet matrices.
Figure 1: Strategic integration of key parameters in metoprolol extraction workflow. The diagram illustrates how pH adjustment, salt addition, and solvent selection function in a coordinated manner rather than as independent variables.
Research Reagent Solutions Toolkit
Table 2: Essential Reagents for Metoprolol Extraction Methodology
| Reagent Category | Specific Reagents | Function | Application Context |
|---|---|---|---|
| Buffering Agents | Britton-Robinson buffer (pH 6.0) | Optimizes complex formation | Spectrophotometric determination [48] |
| Complexing Salts | Copper(II) chloride dihydrate | Forms extractable complex | Preconcentration and separation [48] |
| Extraction Solvents | Water, methanol, methanol-water mixtures | Dissolves API selectively | Immediate and sustained-release forms [48] [4] |
| Protein Precipitants | Trichloroacetic acid (25% w/v) | Denatures binding proteins | Biological sample preparation [12] |
| HPLC Mobile Phase | Methanol:formic acid (0.1%) (65:35 v/v) | Chromatographic separation | LC-MS/MS quantification [12] |
| Solid-Phase Sorbents | C18 functionalized silica | Retains analyte during clean-up | Biological sample extraction [47] |
Strategic tuning of pH, salt addition, and solvent selection parameters enables researchers to overcome the fundamental challenges in metoprolol extraction from complex pharmaceutical matrices. The experimentally-determined optimal condition of pH 6.0 for complexation, combined with copper(II) chloride as a complexing salt and water-methanol mixtures as extraction solvents, provides a validated foundation for method development.
Future research directions should explore more sustainable solvent systems aligned with green chemistry principles, investigate domain-specific salts for enhanced selectivity, and develop high-throughput screening approaches for rapid parameter optimization. The integration of these fundamental parameters with advanced analytical techniques will continue to advance metoprolol extraction methodology, ultimately supporting drug development, quality control, and bioequivalence assessment in pharmaceutical research.
In pharmaceutical research and development, achieving complete and reproducible recovery of Active Pharmaceutical Ingredients (APIs) from solid dosage forms is a fundamental yet challenging task. Low recovery, primarily driven by excipient binding and incomplete dissolution, can compromise bioavailability studies, bioequivalence assessments, and stability testing. This challenge is particularly acute for drugs formulated with advanced functional excipients designed to modulate release profiles. This technical guide examines these hurdles within the context of metoprolol tartrate, a widely studied model drug, and outlines strategic approaches to ensure robust and quantitative API extraction from complex tablet matrices.
The Challenge: Excipient Interactions and Formulation Complexity
The evolution of pharmaceutical excipients from inert fillers to advanced functional components has introduced new complexities for analytical scientists. Modern biofunctional excipients, including smart polymers, lipids, and surfactants, are engineered to precisely control drug release, but this same functionality can inadvertently impede complete API extraction [49]. For highly soluble drugs like metoprolol tartrate, the primary challenge is not dissolution per se, but the physical and chemical barriers posed by the rate-controlling polymer matrix.
Hydrophilic matrix tablets, often based on polymers like hypromellose (HPMC), are designed to hydrate and form a gel layer that controls drug release. During extraction, this gel layer can act as a diffusion barrier, potentially leading to incomplete recovery. Research on metoprolol tartrate matrix tablets has shown that the initial "burst release" from uncoated matrices can be followed by a slower, diffusion-controlled phase, which must be fully overcome during analytical method development [3]. Furthermore, the robustness of this gel layer can be influenced by physiological variables such as pH, osmolality, and hydrodynamic stresses, which should be considered when designing in vitro extraction methods to predict in vivo performance [6].
Strategic Approaches to Enhance Recovery
Overcoming low recovery requires a multi-faceted approach that targets the underlying mechanisms of entrapment and binding. The following strategies have proven effective.
Selection of Dissolution Media
The choice of dissolution medium is critical for disrupting polymer matrices and displacing API bound to excipients. The use of surfactants is a cornerstone strategy.
- Mechanism: Surfactants reduce surface tension and penetrate the gel layer of hydrophilic polymers, disrupting hydrogen bonding and increasing polymer chain mobility. This action creates larger pores and channels for the API to diffuse out.
- Application: Studies on metoprolol tartrate matrices have demonstrated that drug release remains consistent and controlled in media containing surfactants like sodium lauryl sulfate (SLS) or non-ionic surfactants like Tween 80, indicating effective matrix wetting and drug solubilization without compromising the method's ability to discriminate formulation changes [6].
Table 1: Surfactant-Enhanced Media for Improved Recovery
| Surfactant | Typical Concentration | Primary Mechanism | Considerations |
|---|---|---|---|
| Sodium Lauryl Sulfate (SLS) | 0.1% - 2.0% w/v | Ionic solubilization, disrupts gel layer | Can be ionic strength sensitive; check compatibility with analytical instruments. |
| Polysorbate 80 (Tween 80) | 0.1% - 2.0% w/v | Non-ionic solubilization, mild gel disruption | Less likely to interfere with HPLC analysis; suitable for sensitive APIs. |
| Triton X-100 | 0.1% - 1.0% w/v | Non-ionic solubilization, effective for hydrophobic binding | Environmental and health concerns; use as a last resort. |
Physical and Mechanical Means
Enhancing the physical driving forces for dissolution can effectively overcome diffusion-limited release.
- Hydrodynamic Stress: Increasing agitation rate from the standard 50 RPM to 100 RPM or higher in a USP Apparatus 1 (baskets) or 2 (paddles) can apply greater shear force, eroding the gel layer and improving drug release [6]. The use of biorelevant dissolution models that incorporate mechanical stress simulating gastrointestinal motility can be particularly informative for ensuring robust recovery under physiologically relevant conditions [6].
- Ultrasonication: Application of ultrasound energy creates cavitation bubbles that implode near the solid surface, generating micro-jets that efficiently break apart the polymer matrix and desorb API from excipient surfaces. This is highly effective as a sample preparation step prior to analysis.
- Osmotic Shock: Utilizing media of high osmolality can draw water out of the hydrogel matrix, potentially reducing its viscosity and integrity, thereby facilitating API release. Research has shown that drug release from metoprolol matrices is largely independent of media osmolality, suggesting that for some formulations, this may be a less critical factor [6].
Advanced Formulation Engineering
The formulation design itself can be optimized to minimize analytical recovery issues. The application of a barrier membrane (BM) coating on a hydrophilic matrix tablet is a promising approach. This technology eliminates the initial burst release and provides a more consistent, zero-order release profile that is less sensitive to variability in hydrodynamic conditions and media composition [6]. From an analytical perspective, this controlled and robust release behavior can translate to more predictable and reproducible extraction profiles, reducing the risk of low or variable recovery.
Experimental Workflows for Method Development
Developing a robust analytical recovery method requires a structured approach. The following workflows outline the logical progression from problem identification to method implementation and validation.
Figure 1: A logical workflow for developing an analytical method to address low recovery, from problem identification to validation.
Protocol for Surfactant Screening
This protocol provides a detailed methodology for evaluating surfactants to improve API recovery.
- Objective: To identify the optimal type and concentration of surfactant for maximizing the recovery of a poorly extracted API from a controlled-release formulation.
- Materials:
- Test Formulation: Metoprolol tartrate layered matrix tablets (or relevant dosage form) [3].
- Apparatus: USP Dissolution Apparatus 1 or 2.
- Media: 900 mL of various media, e.g., 0.1N HCl (pH 1.2) or Phosphate Buffer (pH 6.8), with and without surfactants.
- Surfactants: SLS (0.5%, 1.0%), Tween 80 (0.5%, 1.0%).
- Analytical Instrument: UV-Vis Spectrophotometer or HPLC with validated method.
- Method:
- Standardize the dissolution apparatus to 37°C ± 0.5°C.
- For each test medium, place one tablet into each vessel (n=6-12).
- Operate the apparatus at 50-100 RPM.
- Withdraw samples (e.g., 5-10 mL) at predetermined time intervals (e.g., 1, 2, 4, 8, 12, 24 hours).
- Filter samples immediately through a 0.45μm membrane filter.
- Analyze the filtrate for API concentration using the calibrated analytical method.
- Compare the dissolution profiles and total recovery (% Label Claim) across the different media.
Table 2: Key Research Reagents and Materials for Recovery Studies
| Item Category | Specific Examples | Function in Experiment |
|---|---|---|
| Rate-Controlling Polymers | Hypromellose (HPMC), Carrageenan, Guar Gum, Ethyl Cellulose [3] | Forms the gel matrix that controls drug release; the target for disruption. |
| Surfactants | Sodium Lauryl Sulfate (SLS), Polysorbate 80 (Tween 80) [6] | Disrupts the polymer gel network and solubilizes the API to enhance recovery. |
| Dissolution Media | HCl Buffer (pH 1.2), Phosphate Buffer (pH 6.8), Fasted/Fed State Simulated Fluids [3] [6] | Provides the liquid environment for extraction; pH and ionic strength can influence polymer behavior and API solubility. |
| Analytical Standards | Metoprolol Tartrate Reference Standard [3] | Provides the benchmark for accurate quantification of the API during analysis. |
Addressing low recovery in API extraction is a critical step in ensuring the quality and efficacy of pharmaceutical products. The challenges posed by excipient binding and incomplete dissolution, as exemplified in metoprolol tartrate matrix tablets, can be systematically overcome. By leveraging a combination of media engineering, physical enhancement, and an understanding of formulation design, researchers can develop robust analytical methods. The strategic application of surfactants, optimized hydrodynamics, and advanced formulation technologies like barrier membranes provides a powerful toolkit for achieving complete and reliable API recovery, thereby strengthening the entire drug development pipeline.
The analysis of active pharmaceutical ingredients (APIs) like metoprolol from complex tablet matrices presents significant analytical challenges, primarily due to the interference of excipients and the low concentrations of target analytes in biological and environmental samples. Traditional sample preparation techniques, particularly liquid-liquid extraction (LLE), consume substantial volumes of organic solvents, generating environmental concerns and increasing operational costs. The principles of green chemistry demand the development of alternative methods that minimize solvent usage while maintaining analytical performance [50].
Microextraction techniques have emerged as sustainable alternatives that align with green chemistry metrics by dramatically reducing organic solvent consumption. These methods enable researchers to achieve high enrichment factors and excellent detection limits while minimizing environmental impact. This technical guide explores the application of microextraction techniques within the specific context of metoprolol research, providing detailed methodologies, performance comparisons, and implementation strategies for pharmaceutical scientists and drug development professionals seeking to enhance their green metrics profile [51] [52].
Within pharmaceutical analysis, metoprolol presents particular challenges as a frequently monitored beta-blocker with specific extraction requirements. Research indicates that conventional analysis techniques for beta-blockers like metoprolol typically require milliliter volumes of organic solvents per sample, creating substantial waste streams. The transition to microextraction approaches represents both a technical advancement and a commitment to sustainable analytical practices [53].
Green Metrics in Analytical Chemistry
Key Performance Indicators for Green Methods
The evaluation of greenness in analytical methodologies requires specific metrics that quantify environmental impact, safety, and sustainability. These metrics provide objective criteria for comparing traditional and novel approaches, enabling researchers to make informed decisions about method selection and development [50].
Table 1: Key Green Metrics for Analytical Method Evaluation
| Metric | Calculation | Interpretation | Ideal Value |
|---|---|---|---|
| Atom Economy (AE) | (Molecular weight of product / Molecular weight of reactants) × 100% | Efficiency of incorporating starting materials into final product | Closer to 100% |
| Reaction Mass Efficiency (RME) | (Mass of product / Total mass of reactants) × 100% | Overall process efficiency including stoichiometry | Closer to 100% |
| Organic Solvent Consumption | Volume of solvent used per sample (mL) | Environmental impact and waste generation | Minimized |
| EFP (Environmental Factor Profile) | Mass of waste / Mass of product | Overall environmental impact of the process | Minimized |
| Temperature | Energy requirements for the process | Energy efficiency and safety | Ambient preferred |
Among these metrics, organic solvent consumption represents a particularly critical parameter for analytical chemists, as it directly impacts waste generation, operational costs, and operator safety. Microextraction techniques specifically target this parameter by reducing solvent volumes from milliliters to microliters, representing a 100- to 1000-fold reduction compared to traditional methods [50].
Comparative Green Metrics: Traditional vs. Microextraction Methods
Radar diagrams provide a powerful graphical tool for evaluating multiple green metrics simultaneously, allowing direct comparison between different methodologies. For pharmaceutical analysis, microextraction techniques typically demonstrate superior performance across most green metrics, particularly in solvent reduction and waste minimization. Case studies in fine chemical production have demonstrated that process sustainability improves significantly with better material recovery, a principle that directly applies to analytical sample preparation [50].
Microextraction Techniques: Principles and Applications
Solid-Phase Microextraction (SPME)
Solid-Phase Microextraction (SPME) represents a solvent-free approach that integrates sampling, extraction, and concentration into a single step. The technique utilizes a fused silica fiber coated with a selective stationary phase, which is exposed to the sample matrix for a predetermined time. Analytes partition between the sample matrix and the coating based on their affinity, after which the fiber is transferred to an analytical instrument for desorption and analysis [51].
SPME method development involves careful selection of fiber coatings, extraction modes (direct immersion or headspace), and desorption conditions. The availability of various commercial fiber coatings, including polyacrylate, polydimethylsiloxane, and divinylbenzene-based materials, enables method customization for specific analyte classes. For polar pharmaceuticals like metoprolol, mixed-mode coatings often provide optimal extraction efficiency [51].
The green credentials of SPME are exceptional, as the technique completely eliminates organic solvents from the sample preparation workflow. This characteristic makes SPME particularly valuable for drug analysis in biological matrices, where complex sample compositions benefit from selective extraction mechanisms. Furthermore, automated SPME systems enhance reproducibility and throughput while maintaining minimal environmental impact [51] [54].
Homogeneous Liquid-Liquid Microextraction (HLLME)
Homogeneous Liquid-Liquid Microextraction (HLLME) represents a significant advancement in liquid-based extraction technology, reducing solvent consumption while maintaining the favorable partitioning kinetics of traditional LLE. The technique utilizes a binary solvent system in which a water-miscible extraction solvent forms a homogeneous solution with the aqueous sample, followed by phase separation induced by various mechanisms [52].
Table 2: Comparison of Microextraction Techniques for Pharmaceutical Analysis
| Technique | Solvent Consumption (μL) | EF Range | LOD Range | Analysis Time (min) | Key Applications |
|---|---|---|---|---|---|
| HLLME | 50-200 | 160-662 | 0.11-0.55 μg/L | 15-30 | Pesticides, pharmaceuticals in water |
| SPME | 0 (solvent-free) | 50-500 | Low ng/L | 30-60 | Volatiles, drugs in biological fluids |
| DLLME | 100-500 | 200-800 | 0.05-0.5 μg/L | 5-15 | Water analysis, food contaminants |
A recent innovation in HLLME methodology utilizes a specially designed test tube with a capillary tip to facilitate phase separation and collection. In this approach, a homogeneous solution is created using n-hexanol as a water-miscible solvent, followed by the addition of di-n-butyl ether as a homogeneity-breaking agent. After centrifugation, the organic phase containing enriched analytes collects in the capillary tip, enabling easy retrieval for analysis. This approach has demonstrated enrichment factors of 160-662 for various analytes, with well-linear calibration curves (r² = 0.986-0.999) and limits of detection in the range of 0.11-0.55 μg/L [52].
Compared to dispersive liquid-liquid microextraction (DLLME), which employs a ternary solvent system (aqueous phase, extraction solvent, and disperser solvent), HLLME reduces solvent consumption by eliminating the dispersive solvent component. This modification not only enhances green metrics but also simplifies the extraction process and reduces potential contamination sources [52].
Experimental Protocols for Microextraction Techniques
HLLME Protocol for API Extraction
The following detailed protocol describes the HLLME procedure for extracting analytes from aqueous samples, adaptable for metoprolol analysis from dissolution studies or environmental samples:
Reagents and Materials:
- Analytical standards of target compounds (e.g., metoprolol reference standard)
- n-Hexanol (extraction solvent)
- Di-n-butyl ether (homogeneity-breaking agent)
- Internal standard solution (e.g., cetyl alcohol at 200 mg/L in di-n-butyl ether)
- Buffer solutions for pH adjustment (e.g., Robinson buffer)
- Deionized water
- Specially designed test tubes with capillary tips
Equipment:
- Vortex mixer
- Centrifuge
- Gas chromatograph with flame ionization detector (GC-FID) or alternative analytical instrument
- Micropipettes (10-1000 μL range)
- Analytical balance
Step-by-Step Procedure:
Sample Preparation: Transfer 5-10 mL of aqueous sample (standard solution or diluted dissolution medium) to the specially designed test tube.
Homogeneous Solution Formation: Add 50-100 μL of n-hexanol to the sample tube. Vortex the mixture for 30-60 seconds to obtain a homogeneous solution.
Phase Separation Induction: Add 25-50 μL of di-n-butyl ether as a homogeneity-breaking agent. Vortex the mixture again for 30 seconds until a turbid solution forms, indicating the creation of fine droplets.
Phase Partitioning: Centrifuge the turbid solution at 3500 rpm for 5 minutes to accelerate phase separation. The organic phase, containing the extracted analytes, collects at the beginning of the capillary part of the tube due to its lower density.
Sample Analysis: Retrieve 1-2 μL of the organic phase using a microsyringe and inject into the GC-FID system for analysis. Alternatively, for HPLC compatibility, evaporate and reconstitute in mobile phase-compatible solvent.
Critical Parameters:
- Solvent Selection: The extraction solvent should have partial water solubility and high affinity for target analytes.
- pH Optimization: Adjust sample pH to suppress analyte ionization and enhance partitioning into the organic phase.
- Salt Addition: In some cases, adding salt (e.g., NaCl) can improve extraction efficiency by reducing analyte solubility in the aqueous phase.
- Volume Ratios: The ratio of sample volume to extraction solvent volume significantly impacts enrichment factors.
This HLLME protocol has demonstrated excellent performance characteristics, with intra-day and inter-day repeatabilities of 3.6-13.2% and 5.8-13.3% RSD, respectively, at a concentration of 25 μg/L [52].
SPME Protocol for Metoprolol Analysis
Fiber Selection and Conditioning:
- Choose an appropriate SPME fiber coating based on metoprolol's polarity (e.g., polyacrylate, C18, or mixed-mode coatings)
- Condition the fiber according to manufacturer specifications before first use
- Perform blank runs to ensure no carryover or contamination
Extraction Process:
- Place the sample (1-2 mL) in a sealed vial with magnetic stirring
- Expose the SPME fiber to the sample via direct immersion for a predetermined time (30-60 minutes)
- Maintain constant stirring speed to enhance mass transfer
- Control sample pH to optimize extraction efficiency for ionizable compounds
Desorption and Analysis:
- Transfer the fiber to the analytical instrument injection port
- Desorb analytes at appropriate temperature (typically 250-300°C for GC)
- Maintain desorption time sufficient for complete transfer (2-15 minutes)
- For LC applications, use appropriate desorption solvents and interfaces
Method development should systematically evaluate and optimize extraction time, temperature, pH, ionic strength, and desorption conditions to achieve optimal performance for metoprolol analysis [51].
The Scientist's Toolkit: Essential Research Reagents and Materials
Table 3: Research Reagent Solutions for Microextraction Methods
| Reagent/Material | Function | Application Notes | Green Characteristics |
|---|---|---|---|
| n-Hexanol | Extraction solvent in HLLME | Partially water-miscible; forms homogeneous solution | Low volume requirement (μL) |
| Di-n-butyl ether | Homogeneity-breaking agent | Induces phase separation in HLLME | Low toxicity compared to chlorinated solvents |
| Polyacrylate SPME Fiber | Extraction phase for SPME | Suitable for polar compounds like metoprolol | Reusable, solvent-free |
| Cetyl Alcohol | Internal standard for GC analysis | Corrects for volume variations | Minimal usage concentration |
| Kollidon SR | Matrix agent for tablet formulation | Used in metoprolol extended-release formulations | Pharmaceutical-grade excipient |
| Methocel K100M | Controlled-release polymer | Modifies drug release profile | Water-soluble polymer |
Metoprolol-Specific Applications and Challenges
Metoprolol Extraction from Pharmaceutical Formulations
Metoprolol exists in various dosage forms, including immediate-release and extended-release formulations, each presenting unique extraction challenges. Extended-release formulations often incorporate complex matrix systems containing controlled-release polymers such as hypromellose (HPMC) or polyvinyl acetate/polyvinylpyrrolidone copolymers (Kollidon SR), which can interfere with extraction efficiency [55] [56].
Recent studies have demonstrated the development of extended-release mini-tablets containing metoprolol succinate, utilizing design of experiments (DOE) and physiologically based biopharmaceutics modeling (PBBM). These formulations present particular challenges for extraction due to their coated structures and modified-release characteristics. For quality control purposes, microextraction techniques can provide efficient extraction of metoprolol from these complex formulations while minimizing solvent consumption [55].
Research has shown that crushing modified-release metoprolol tablets significantly alters their dissolution profile by deforming the surface morphology of embedded micropellets. This practice, common in clinical settings for patients with swallowing difficulties, necessitates robust analytical methods to monitor drug release patterns. Microextraction techniques offer a viable approach for rapid monitoring of metoprolol concentrations in dissolution studies with high sensitivity and minimal solvent usage [32].
Analytical Techniques for Metoprolol Quantification
The analysis of beta-blockers including metoprolol has been accomplished using various analytical techniques, each with distinct advantages and limitations. Comparative studies have evaluated immunoassay (ELISA), gas chromatography-mass spectrometry (GC-MS), and liquid chromatography-mass spectrometry (LC-MS) for beta-blocker analysis. While ELISA offers rapid screening capability with poor selectivity, chromatographic techniques coupled with mass spectrometry provide confirmation procedures with excellent sensitivity, accuracy, and precision [53].
LC-MS analytical procedures enable the determination of target analytes in the lower ng/mL range (0.53-2.23 ng/mL), making them particularly valuable for bioequivalence studies and therapeutic drug monitoring. When coupled with microextraction techniques, these analytical methods provide comprehensive solutions for metoprolol analysis across various matrices, including pharmaceutical formulations, biological fluids, and environmental samples [53].
Workflow Integration and Implementation Strategy
The implementation of microextraction techniques requires systematic integration into existing analytical workflows. The following diagram illustrates the complete experimental workflow for microextraction techniques in pharmaceutical analysis:
Microextraction Workflow Selection
Successful implementation begins with method selection based on specific analytical requirements, including target sensitivity, matrix complexity, and available instrumentation. For metoprolol analysis, HLLME provides excellent enrichment factors and linear dynamic ranges, while SPME offers complete solvent elimination and compatibility with various analytical platforms [52] [51].
Method validation should establish key performance parameters including linearity, accuracy, precision, limits of detection and quantification, and robustness. For regulated environments, additional validation elements including stability, specificity, and system suitability must be addressed according to relevant regulatory guidelines [53].
The integration of microextraction techniques with advanced detection systems creates powerful analytical platforms for pharmaceutical analysis. As research continues to refine these methodologies, the application of microextraction approaches in metoprolol research and development is expected to expand, driven by the dual benefits of enhanced analytical performance and improved green metrics [52] [51].
Ensuring Reliability: Method Validation, Green Assessment, and Technique Comparison
The International Council for Harmonisation (ICH) Q2(R2) guideline provides a foundational framework for the validation of analytical procedures for pharmaceuticals. This guideline outlines the key validation characteristics required to demonstrate that an analytical method is suitable for its intended purpose, forming a critical component of registration applications submitted to regulatory authorities [57]. The core objective is to establish documented evidence that the procedure consistently delivers results that accurately reflect the quality of the drug substance or product.
The application of these guidelines is particularly relevant in complex analytical scenarios, such as the development and analysis of metoprolol dosage forms. Metoprolol succinate extended-release formulations and metoprolol tartrate mucoadhesive buccal tablets present distinct challenges for analytical scientists, including complex matrix interference from excipients and the need for method specificity to accurately quantify the drug substance amidst potential degradants [7] [58]. Per ICH, validation is essential for procedures used in the release and stability testing of commercial drug substances and products, including both chemical and biological entities [57]. The recent update to the guideline (March 2024) continues to emphasize these principles while providing a more general framework for validation, including analytical uses of spectroscopic data [59].
Core Validation Characteristics: Definitions and Regulatory Expectations
Linearity
Linearity is defined as the ability of an analytical procedure to obtain test results that are directly proportional to the concentration (amount) of analyte in the sample within a given range [60]. It demonstrates that the method exhibits a directly proportional relationship between the theoretical concentration of the analyte and the instrument response or the final calculated result.
- Experimental Protocol: To establish linearity, a minimum of five concentrations across the specified range should be prepared and analyzed in duplicate or triplicate [61]. The data is typically evaluated by plotting the measured response against the theoretical concentration and performing statistical analysis on the regression line.
- Data Analysis: While the coefficient of determination (R²) has been traditionally used, it has limitations as it merely represents a fitting correlation and suffers from heteroscedasticity [60]. A more rigorous approach involves evaluating the residuals (the difference between the observed and predicted values) to detect any systematic non-linear patterns. For methods with a non-linear response, the ICH Q2(R2) guideline states that linearity is not required, but the procedure must still demonstrate proportionality between the true value and the measured result across the validated range [60].
- Advanced Statistical Approach: A novel method based on double logarithm function linear fitting has been proposed to more accurately demonstrate the degree of data proportionality. This approach involves taking the same base logarithm of both the theoretical concentrations and the measured results, then performing linear fitting. The slope of this log-log plot indicates the proportionality relationship, with a slope of 1.0 indicating perfect direct proportionality [60].
Accuracy
Accuracy expresses the closeness of agreement between the value which is accepted as either a conventional true value or an accepted reference value and the value found [61]. It is a measure of the total error of the method, including both systematic and random error components.
- Experimental Protocol: Accuracy should be established across the specified range of the analytical procedure using a minimum of three concentration levels (e.g., low, medium, high), with a minimum of three replicates per level [61]. For drug product analysis, accuracy is typically determined by spiking known amounts of the analyte into a placebo mixture that mimics the formulation composition.
- Data Presentation and Acceptance Criteria: Accuracy is usually reported as percent recovery of the known, added amount of analyte. The ICH guidelines recommend using confidence intervals for reporting accuracy results. For example, one might require that the average percentage recovery at each concentration level falls within 95-105% with a specified confidence level [61]. Tolerance intervals can also be used to set specifications for individual measurements, ensuring that a certain proportion of future results will fall within acceptable limits (e.g., no individual percentage recovery should be less than 80% or greater than 120%) [61].
Table 1: Typical Acceptance Criteria for Accuracy in Drug Product Analysis
| Analytical Procedure Type | Concentration Level | Target Recovery (%) | Number of Determinations |
|---|---|---|---|
| Assay of Drug Product | 100% of test concentration | 98.0-102.0 | Minimum of 6 (3 concentrations x 3 replicates) |
| Impurity Quantitation | Reporting threshold to specification limit | Varies with level | Minimum of 6 across the range |
Precision
Precision expresses the closeness of agreement (degree of scatter) between a series of measurements obtained from multiple sampling of the same homogeneous sample under the prescribed conditions [61]. Precision is typically investigated at three levels: repeatability, intermediate precision, and reproducibility.
- Repeatability (Intra-assay Precision): This expresses the precision under the same operating conditions over a short interval of time. The experimental protocol involves assaying a minimum of three concentrations with multiple replicates (e.g., six determinations at 100% of the test concentration, or three concentrations with three replicates each) [61].
- Intermediate Precision: This expresses within-laboratory variations, such as different days, different analysts, different equipment, etc. The suggested testing consists of a minimum of two analysts on two different days with three replicates at a minimum of three concentrations [61].
- Reproducibility: This expresses the precision between different laboratories, typically assessed during method transfer or collaborative studies.
- Statistical Analysis: Precision is usually expressed as variance, standard deviation, or relative standard deviation (RSD). Variance components analysis is a powerful statistical method to partition the different sources of variation (e.g., analyst, day, instrument) into their respective contributions to the total variability [61]. This information is crucial for understanding the major sources of variation and implementing appropriate controls.
Table 2: Precision Evaluation Parameters and Typical Targets for Assay Methods
| Precision Level | Experimental Design | Recommended Acceptance (RSD for Assay) | Statistical Evaluation |
|---|---|---|---|
| Repeatability | 6 determinations at 100% test concentration | NMT 1.0% for drug substance; NMT 2.0% for drug product | Standard deviation, RSD |
| Intermediate Precision | 2 analysts x 2 days x 3 concentrations | Overall RSD NMT 2.0% for drug substance | Variance components analysis, ANOVA |
| Reproducibility | Multiple laboratories using standardized protocol | Comparable results across laboratories with justified acceptance criteria | Interlaboratory study analysis |
Robustness
While not explicitly detailed in the search results, robustness is defined as a measure of the analytical procedure's capacity to remain unaffected by small, deliberate variations in method parameters. It indicates the reliability of the method during normal usage.
Robustness should be investigated early in method development, examining the effect of variations such as pH of the mobile phase, mobile phase composition, column temperature, flow rate, and detection wavelength. The experimental design typically involves a systematic approach where one parameter is changed at a time while monitoring its effect on the method performance. The results help establish a "robustness space" and identify critical method parameters that require tight control in the analytical procedure.
Application in Metoprolol Dosage Form Analysis
The principles of ICH Q2(R2) validation find practical application in the analysis of various metoprolol dosage forms. For instance, in the development of extended-release metoprolol succinate mini-tablets, analytical methods must be validated to ensure accurate quantification of the drug substance throughout the development and quality control processes [7]. The complex nature of these formulations, which often include multiple functional excipients and coating systems, presents significant challenges for method specificity and accuracy.
Similarly, in the analysis of multilayer mucoadhesive buccal tablets of metoprolol tartrate, validated analytical methods are essential to characterize the drug content, uniformity, and release profile [58]. The presence of novel polymers such as chitosan extracted from different crustacean sources (with varying degrees of deacetylation) and other matrix components like HPMC K300 and Eudragit S100 necessitates rigorous method validation to ensure specificity in the presence of these potentially interfering substances [58].
The following workflow diagram illustrates the strategic approach to method validation in the context of metoprolol pharmaceutical development:
Research Reagent Solutions for Analytical Method Development
The development and validation of analytical methods for pharmaceutical analysis requires specific, high-quality reagents and materials. The following table details key research reagent solutions and their functions in the context of analytical method development for metoprolol formulations:
Table 3: Essential Research Reagents for Analytical Method Development and Validation
| Reagent/Material | Function in Analytical Development | Example from Metoprolol Research |
|---|---|---|
| HPLC-Grade Solvents (Acetonitrile, Methanol) | Mobile phase components providing separation efficiency and peak resolution | Mobile phase preparation for metoprolol assay and related substances [7] |
| Buffer Salts (Monobasic potassium phosphate) | Mobile phase pH control and ionic strength adjustment for reproducible retention | Dissolution medium and mobile phase component for metoprolol analysis [7] |
| Reference Standards | Provides known purity material for calibration curve construction and method qualification | Metoprolol succinate or tartrate reference standard for quantification [7] [58] |
| Chromatographic Columns (C18, C8) | Stationary phase for compound separation based on chemical properties | HPLC column for separating metoprolol from impurities and formulation excipients [7] |
| Placebo Formulation Components | Specificity assessment by confirming no interference with analyte detection | Microcrystalline cellulose, HPMC, chitosan used in specificity testing [7] [58] |
Statistical Framework for Validation Data Interpretation
A robust statistical approach is essential for proper interpretation of validation data. The ICH guidelines acknowledge that "approaches other than those set forth in this guideline may be applicable and acceptable," emphasizing that the applicant is responsible for choosing the appropriate validation procedure and protocol [61]. This flexibility necessitates a thorough understanding of statistical principles.
For specificity assessment, a combination of statistical rigor and scientific judgment is recommended. The use of equivocal tests or methods similar to those assessing parallelism can be employed [61]. This approach establishes an "equivocal zone" (determined by the distance between -λ and +λ), representing a predetermined level that is scientifically not different from the target. This method helps reconcile scenarios where statistical significance and practical relevance might diverge [61].
For precision analysis, variance components analysis is particularly valuable as it partitions the total variability into its respective sources (e.g., analyst-to-analyst, day-to-day, preparation error) [61]. This information is crucial for understanding the major sources of variation in the analytical procedure and implementing appropriate controls to ensure method robustness over time.
The following diagram illustrates the statistical decision process for evaluating specificity using the equivocal zone approach:
The successful validation of analytical procedures per ICH Q2(R2) guidelines requires a systematic, scientifically rigorous approach that integrates statistical principles with practical pharmaceutical knowledge. The establishment of linearity, accuracy, precision, and robustness forms the foundation for demonstrating that an analytical method is fit for its intended purpose, whether for release testing, stability monitoring, or characterization of complex dosage forms like metoprolol extended-release mini-tablets or mucoadhesive buccal systems.
The recent update to the ICH Q2(R2) guideline maintains the core principles of validation while providing a more flexible framework that accommodates both traditional physicochemical methods and modern analytical techniques [59]. As analytical science continues to evolve, with novel approaches like the double logarithm function for linearity assessment emerging [60], the fundamental requirement remains unchanged: to generate reliable, meaningful data that supports the quality, safety, and efficacy of pharmaceutical products.
Metoprolol is a selective β1-adrenergic antagonist widely prescribed for cardiovascular diseases such as hypertension, angina pectoris, and myocardial infarction, dominating the beta-blocker market in many regions, including China, where it accounts for 62.2% of beta-blocker prescriptions [62]. The analysis of metoprolol in pharmaceutical formulations and biological samples presents significant challenges due to matrix complexity, low concentration levels, and the need for precise quantification. Tablet matrices, in particular, contain excipients that can interfere with analytical determination, while biological samples like plasma feature complex protein-binding characteristics that complicate extraction [63] [15]. Furthermore, the growing emphasis on green analytical chemistry demands methods that minimize environmental impact while maintaining accuracy and sensitivity [8]. This technical guide provides an in-depth examination of figures of merit—specifically Limit of Detection (LOD), Limit of Quantification (LOQ), and Enrichment Factors—for different metoprolol analysis methods, contextualized within the challenges of extraction from complex matrices.
Core Principles: Defining Key Figures of Merit
Limit of Detection (LOD) and Limit of Quantification (LOQ)
The Limit of Detection (LOD) represents the lowest concentration of an analyte that can be reliably detected but not necessarily quantified under the stated experimental conditions. It is typically defined as a signal-to-noise ratio of 3:1. The Limit of Quantification (LOQ) is the lowest concentration that can be quantitatively determined with acceptable precision and accuracy, usually defined as a signal-to-noise ratio of 10:1 [64] [63]. These parameters are crucial for validating analytical methods, especially when dealing with trace concentrations in complex matrices like pharmaceutical formulations or environmental samples.
Enrichment Factor (EF)
The Enrichment Factor (EF) is a metric used primarily in microextraction techniques to evaluate the efficiency of preconcentration. It is calculated as the ratio of the analyte concentration in the acceptor phase to that in the donor phase after extraction. A high EF indicates superior preconcentration capability, which is particularly valuable when analyzing metoprolol at trace levels in biological or environmental samples [63] [65].
Analytical Methods and Their Performance Characteristics
Spectrophotometric Methods
A spectrophotometric method based on complexation with copper(II) at pH 6.0 demonstrates application for metoprolol determination in tablet formulations. The method produces a blue adduct with maximum absorbance at 675 nm [64].
- Linear Range: 8.5-70 μg/mL
- LOD: 5.56 μg/mL
- Correlation Coefficient (r): 0.998 [64]
While this method offers simplicity and cost-effectiveness, its relatively high LOD limits utility for trace analysis compared to chromatographic techniques.
Chromatographic Methods with Microextraction
Chromatographic methods coupled with advanced microextraction techniques provide significantly enhanced sensitivity for metoprolol determination, especially in complex biological matrices like plasma.
Hollow Fiber-Liquid Phase Microextraction with HPLC-DAD (HF-LPME-HPLC-DAD) This method utilizes a hollow fiber membrane and tissue culture oil as an eco-friendly solvent for extracting free metoprolol from plasma samples [63].
- LOD: 0.41 ng/mL
- LOQ: 1.30 ng/mL
- Enrichment Factor: 50
- Extraction Recovery: 86% [63]
Dispersive Liquid-Liquid Microextraction (DLLME) and Solidification of Floating Organic Droplet Microextraction (SFOME) These green microextraction procedures effectively extract beta-blockers, including metoprolol, from aqueous matrices for analysis by gas chromatography (GC) or liquid chromatography (LC) [65].
- DLLME-GC-MS LOD Range: 0.13-0.69 μg/mL
- SFOME-LC-PDA LOD Range: 0.07-0.15 μg/mL
- Enrichment Factors: 61.22-243.97 for different beta-blockers
- Extraction Recovery: 53.04-92.1% [65]
Comparison of Method Performance
Table 1: Comparison of Figures of Merit for Different Metoprolol Analysis Methods
| Analytical Method | Matrix | LOD | LOQ | Enrichment Factor | Linear Range |
|---|---|---|---|---|---|
| Spectrophotometry with Cu(II) complexation [64] | Tablets | 5.56 μg/mL | - | - | 8.5-70 μg/mL |
| HF-LPME-HPLC-DAD [63] | Plasma | 0.41 ng/mL | 1.30 ng/mL | 50 | - |
| DLLME-GC-MS [65] | Aqueous matrices | 0.13-0.69 μg/mL* | 0.39-2.10 μg/mL* | 61.22-243.97* | - |
| SFOME-LC-PDA [65] | Aqueous matrices | 0.07-0.15 μg/mL* | 0.20-0.45 μg/mL* | 61.22-243.97* | - |
*Values represent ranges for multiple beta-blockers including metoprolol
Detailed Experimental Protocols
Hollow Fiber-Liquid Phase Microextraction for Plasma Samples
The HF-LPME method provides an effective approach for extracting free metoprolol from plasma samples prior to HPLC analysis [63].
Workflow Overview:
Step-by-Step Protocol:
- Sample Preparation: Collect plasma samples and stabilize with appropriate anticoagulants.
- Hollow Fiber Preparation: Cut hollow fibers to optimal length (parameter optimized for maximum recovery).
- Extraction Setup: Load the hollow fiber with tissue culture oil as the extraction solvent.
- Sonication: Subject the sample to sonication to enhance extraction efficiency.
- Temperature Control: Maintain optimal extraction temperature throughout the process.
- Salt Addition: Adjust ionic strength with salt to improve extraction recovery.
- Centrifugation: Separate the extracted phase by centrifugation.
- Chromatographic Analysis: Analyze the extract using HPLC with diode-array detection.
Critical Parameters: The method optimization identified hollow fiber length, sonication time, extraction temperature, and salt addition as crucial parameters affecting extraction efficiency. Under optimum conditions, the method achieved an enrichment factor of 50 and extraction recovery of 86% [63].
Spectrophotometric Determination via Copper Complexation
This method enables metoprolol determination in tablets through complex formation with copper(II) ions [64].
Workflow Overview:
Step-by-Step Protocol:
- Sample Preparation: Weigh and pulverize ten tablets. Transfer powder equivalent to 40 mg metoprolol to a conical flask.
- Extraction: Extract with 4 × 20 mL of water, filter into a 100 mL volumetric flask, and dilute to volume.
- Complex Formation: Transfer aliquots to 10 mL volumetric flasks. Add 1 mL Britton-Robinson buffer (pH 6.0) and 1 mL CuCl₂·2H₂O solution (0.5% w/v).
- Heating: Mix well for 20 minutes while heating in a thermostatically controlled water bath at 35°C.
- Cooling: Cool rapidly after the heating step.
- Dilution: Dilute to mark with distilled water.
- Measurement: Measure absorbance at 675 nm against a reagent blank.
- Quantification: Determine concentration using a pre-established calibration curve.
Critical Parameters: The method optimization identified pH 6.0 (using Britton-Robinson buffer), reaction temperature of 35°C, and reaction time of 20 minutes as optimal conditions. The method follows Beer's law in the concentration range 8.5-70 μg/mL [64].
The Scientist's Toolkit: Essential Research Reagents and Materials
Table 2: Key Research Reagent Solutions for Metoprolol Analysis
| Reagent/Material | Function/Application | Specific Examples |
|---|---|---|
| Hollow Fiber Membranes | Selective barrier for liquid-phase microextraction | Polypropylene hollow fibers for HF-LPME [63] |
| Tissue Culture Oil | Eco-friendly extraction solvent | Alternative to traditional organic solvents in HF-LPME [63] |
| Copper(II) Chloride | Complexing agent for spectrophotometric detection | Formation of blue adduct with metoprolol for UV-Vis detection [64] |
| Britton-Robinson Buffer | pH control for complexation reactions | Optimal pH 6.0 for Cu(II)-metoprolol complex formation [64] |
| Chromatographic Columns | Stationary phase for separation | HPLC columns for separation pre- or post-extraction [63] [65] |
| Hydroxypropyl Methylcellulose | Sustained-release polymer in tablet formulations | Methocel K100M for controlling metoprolol release [66] |
Advanced Considerations and Future Perspectives
Overcoming Matrix Effects in Tablet Analysis
Metoprolol tablet formulations present unique challenges due to the presence of excipients and the specific delivery system design. Extended-release formulations often utilize multi-particulate systems where individually coated units are compressed into tablets [15]. This complexity necessitates rigorous extraction procedures to ensure complete drug recovery while avoiding excipient interference. Furthermore, practices such as tablet splitting can significantly impact content uniformity, with studies demonstrating higher failure rates in split tablets compared to whole tablets [15]. Near-infrared chemical imaging (NIR-CI) has emerged as a valuable tool for visualizing API distribution within tablets, providing crucial information for developing effective extraction methodologies [15].
Green Analytical Chemistry in Metoprolol Analysis
The development of environmentally sustainable methods represents a growing trend in pharmaceutical analysis. Green metrics such as the Analytical GREEnness Metric Approach (AGREE), Green Analytical Procedure Index (GAPI), Blue Applicability Grade Index (BAGI), and Carbon Footprint Reduction Index are increasingly applied to evaluate the environmental impact of analytical methods [8]. Microextraction techniques like HF-LPME and DLLME align with green chemistry principles by minimizing organic solvent consumption, reducing waste generation, and utilizing safer alternatives like tissue culture oil [63] [65]. These approaches offer promising directions for future method development that balances analytical performance with environmental responsibility.
The accurate determination of metoprolol in various matrices requires careful selection of analytical methods based on required sensitivity, matrix complexity, and environmental considerations. This comprehensive evaluation of figures of merit demonstrates that while spectrophotometric methods offer simplicity for tablet analysis, chromatographic techniques coupled with microextraction provide superior sensitivity for biological and environmental samples. The LOD values range from 5.56 μg/mL for basic spectrophotometry to 0.41 ng/mL for HF-LPME-HPLC-DAD, highlighting the dramatic sensitivity improvements achievable with advanced extraction techniques. As research progresses, the integration of green chemistry principles with high-performance analytical methods will continue to shape the field of metoprolol analysis, addressing both analytical challenges and environmental responsibilities simultaneously.
Metoprolol tartrate (MPT) is a cardioselective β1-adrenergic receptor blocking agent widely used in the management of hypertension, angina pectoris, and heart failure. The determination of MPT in pharmaceutical dosage forms and biological samples presents significant analytical challenges due to matrix complexity, excipient interference, and the need for precise quantification at varying concentration levels. Tablet formulations, in particular, contain fillers, binders, disintegrants, and lubricants that can interfere with analytical measurements, necessitating robust sample preparation and selective analytical techniques.
The selection of an appropriate analytical method is crucial for supporting formulation screening, quality control, and bioavailability studies. This technical guide provides an in-depth comparison of three principal analytical techniques—High-Performance Liquid Chromatography (HPLC), Spectrophotometry, and Spectrofluorimetry—for the determination of metoprolol, with emphasis on their applications, advantages, and limitations within the context of tablet matrix analysis.
Fundamental Principles and Instrumentation
High-Performance Liquid Chromatography (HPLC)
HPLC separates compounds based on their differential partitioning between a mobile phase and stationary phase. Reverse-phase HPLC (RP-HPLC), which employs a non-polar stationary phase and polar mobile phase, is particularly suitable for the analysis of pharmaceutical compounds like metoprolol. The typical HPLC system consists of a solvent delivery pump, injector, column compartment, detector, and data processing unit. For metoprolol analysis, UV or fluorescence detectors are commonly employed, with C18 columns serving as the preferred stationary phase [67] [68].
Spectrophotometry
Spectrophotometric methods measure the absorption of electromagnetic radiation by analyte molecules in the ultraviolet-visible region (200-800 nm). These methods are based on the Beer-Lambert law, which states that absorbance is proportional to concentration. Metoprolol tartrate exhibits native absorbance due to its aromatic structure, allowing direct quantification, or it can form colored complexes with various reagents for enhanced sensitivity [64] [69].
Spectrofluorimetry
Spectrofluorimetry exploits the fluorescent properties of molecules that emit radiation after excitation at specific wavelengths. This technique offers inherent sensitivity and selectivity advantages due to dual wavelength selection (excitation and emission). Metoprolol possesses native fluorescence, but its intensity can be significantly enhanced through various strategies, including pH modification to block photoinduced electron transfer (PET) processes, derivation reactions, or synchronous scanning techniques [70] [71] [72].
Critical Performance Parameters: A Quantitative Comparison
The following tables summarize key performance metrics for each analytical technique as applied to metoprolol determination, compiled from validation data across multiple studies.
Table 1: Analytical Performance Characteristics of Techniques for Metoprolol Determination
| Parameter | HPLC | Spectrophotometry | Spectrofluorimetry |
|---|---|---|---|
| Linear Range | 100-600 μg/mL [68] | 8.5-70 μg/mL [64] | 0.1-14 μg/mL [71] |
| LOD | 0.10 mg/mL [68] | 5.56 μg/mL [64] | 0.11-0.02 μg/mL [70] [71] |
| LOQ | 0.30 mg/mL [68] | Not specified | 0.32-0.06 μg/mL [70] [71] |
| Precision (%RSD) | 0.33-0.44% [68] | <1.50% [73] | 1.17-1.49% [70] |
| Accuracy (% Recovery) | 99.27-100.83% [68] | 99.63-100.45% [73] | 98-102% [71] |
| Analysis Time | 10-16 minutes [68] | Rapid (minutes) | Rapid (minutes) |
Table 2: Applications and Limitations in Metoprolol Tablet Analysis
| Aspect | HPLC | Spectrophotometry | Spectrofluorimetry |
|---|---|---|---|
| Matrix Complexity Tolerance | High (separation step) | Moderate (requires selective detection) | Moderate to High (dual wavelength selection) |
| Selectivity in Mixtures | Excellent (chromatographic separation) | Poor for overlapping spectra | Good with synchronous techniques [70] |
| Simultaneous Determination | Yes [67] [68] | Limited without separation | Possible with derivative techniques [71] |
| Sample Preparation | Extensive (extraction, filtration) | Simple (dissolution, dilution) | Moderate (may require derivatization) |
| Equipment Cost | High | Low | Moderate |
| Environmental Impact | High (organic solvent consumption) | Low to Moderate | Low to Moderate |
Experimental Protocols for Metoprolol Analysis
HPLC Methodology for Metoprolol in Combined Tablet Formulations
Materials and Reagents: Metoprolol tartrate standard, hydrochlorothiazide (for combination products), methanol (HPLC grade), potassium dihydrogen phosphate, water (HPLC grade), commercial tablet formulations.
Mobile Phase Preparation: Prepare a mixture of dibasic potassium phosphate buffer and methanol in ratio of 60:40 (v/v). The buffer is prepared by dissolving 7.7 g of dibasic potassium phosphate in 1000 mL of water. Filter through a 0.45 μm membrane filter and degas prior to use.
Chromatographic Conditions:
- Column: Inertsil ODS-3 C18 (250 mm × 4.6 mm, 5 μm)
- Flow rate: 1.0 mL/min
- Detection wavelength: 226 nm
- Injection volume: 20 μL
- Temperature: Ambient
Sample Preparation:
- Weigh and powder 20 tablets.
- Transfer an amount equivalent to half the average tablet weight to a 100 mL volumetric flask.
- Add 50 mL methanol and sonicate for 30 minutes with intermittent shaking.
- Dilute to volume with methanol and mix well.
- Filter through a 0.45 μm nylon filter.
- Further dilute as necessary to obtain final concentration within the working range [68].
Spectrophotometric Method Based on Complexation
Materials and Reagents: Metoprolol tartrate standard, copper(II) chloride dihydrate, methanol, Britton-Robinson buffer (pH 6.0).
Procedure:
- Prepare stock solution of metoprolol tartrate (0.2 mg/mL) in water.
- Transfer aliquots containing 8.5-70 μg of MPT to 10 mL volumetric flasks.
- Add 1 mL Britton-Robinson buffer (pH 6.0) and 1 mL of 0.5% CuCl₂·2H₂O solution.
- Mix well and heat for 20 minutes in a thermostatically controlled water bath at 35°C.
- Cool rapidly and dilute to volume with distilled water.
- Measure absorbance at 675 nm against a reagent blank [64].
Spectrofluorimetric Method with PET Inhibition
Materials and Reagents: Metoprolol tartrate standard, acetic acid (0.5 M), ethanol, distilled water.
Optimized Conditions (determined via D-optimal experimental design):
- Acid type: Acetic acid
- Acid volume: 1.0 mL of 0.5 M solution
- Diluting solvent: Ethanol:water (50:50, v/v)
- Reaction time: 5 minutes
Procedure:
- Prepare stock solution of metoprolol (100 μg/mL) in ethanol.
- Transfer aliquots covering the concentration range 1-14 μg/mL to 10 mL volumetric flasks.
- Add 1 mL of 0.5 M acetic acid.
- Dilute to volume with ethanol:water (50:50, v/v).
- Allow to stand for 5 minutes.
- Measure fluorescence intensity at excitation and emission wavelengths of 230 nm and 302 nm, respectively [72].
Analytical Workflow and Technique Selection
The following diagram illustrates the decision-making process for selecting the appropriate analytical technique based on research objectives and sample characteristics:
Essential Research Reagent Solutions
Table 3: Key Reagents and Materials for Metoprolol Analysis
| Reagent/Material | Function | Application Examples |
|---|---|---|
| C18 Chromatographic Columns | Reverse-phase separation | HPLC analysis of metoprolol [67] [68] |
| Methanol (HPLC Grade) | Mobile phase component | Solvent for extraction and chromatography [67] [68] |
| Potassium Phosphate Salts | Buffer preparation | Mobile phase modification in HPLC [68] |
| Copper(II) Chloride | Complexing agent | Spectrophotometric determination [64] |
| Acetic Acid | PET inhibition | Fluorescence enhancement in spectrofluorimetry [72] |
| Britton-Robinson Buffer | pH control | Optimization of complex formation [64] |
| Acetonitrile | Protein precipitation | Plasma sample preparation [71] |
Advanced Applications and Recent Innovations
Synchronous Fluorescence Techniques
Synchronous fluorescence spectroscopy (SFS) involves simultaneous scanning of both excitation and emission monochromators while maintaining a constant wavelength difference (Δλ). This technique provides simplified spectra, reduced background interference, and enhanced selectivity for simultaneous determination of drugs in mixtures. For metoprolol and felodipine combination, Δλ = 70 nm allowed determination at 260 nm and 375 nm, respectively, without interference [70].
Green Analytical Chemistry Approaches
Recent developments emphasize environmentally friendly methodologies. A novel spectrofluorimetric method based on photoinduced electron transfer (PET) inhibition achieved exceptional sensitivity (LOD 0.67 ng/mL) using ethanol-water mixtures and minimal reagent consumption. The method received high scores on the AGREE and GAPI greenness assessment metrics [72].
Simultaneous Determination in Fixed-Dose Combinations
HPLC methods have been successfully developed for simultaneous quantification of metoprolol with other cardiovascular drugs. For metoprolol and hydrochlorothiazide combinations, isocratic elution with phosphate buffer-methanol (60:40) provided excellent resolution with retention times of 4.13 and 10.81 minutes, respectively [68]. Similarly, methods for metoprolol with atenolol and phenol red have been developed for intestinal perfusion studies [67].
The comparative analysis of HPLC, spectrophotometry, and spectrofluorimetry for metoprolol determination reveals distinctive advantages and limitations for each technique. HPLC remains the gold standard for complex matrices and regulatory applications due to its superior selectivity and robustness. Spectrophotometry offers the advantages of simplicity, cost-effectiveness, and rapid analysis for routine quality control of simple formulations. Spectrofluorimetry provides exceptional sensitivity for bioanalytical applications and trace analysis, with recent innovations significantly enhancing its selectivity.
Future directions in metoprolol analysis include the development of miniaturized systems, increased automation, integration with mass spectrometric detection for unequivocal identification, and the adoption of green analytical chemistry principles to reduce environmental impact. The choice of technique ultimately depends on the specific analytical requirements, including sensitivity needs, sample complexity, available instrumentation, and intended application.
The pharmaceutical industry faces increasing pressure to adopt sustainable practices, extending from manufacturing to analytical quality control. Green Analytical Chemistry (GAC) has emerged as a critical discipline focused on minimizing the environmental footprint of analytical methods while maintaining data quality and reliability [74]. Within pharmaceutical research, this is particularly relevant for the analysis of active pharmaceutical ingredients (APIs) like metoprolol, a widely prescribed beta-blocker for cardiovascular diseases [75]. The assessment of method greenness has evolved from basic checklists to sophisticated multi-factor metrics that provide comprehensive environmental impact evaluations [76] [74]. This shift reflects growing recognition that sustainability must be quantitatively assessed alongside traditional method validation parameters.
The challenge of metoprolol extraction from tablet matrices provides a compelling context for greenness evaluation. Tablets contain not only the API but also various excipients that complicate extraction and analysis [7] [77]. Conventional sample preparation methods often involve substantial quantities of hazardous solvents and energy-intensive processes, generating significant waste [75] [78]. As global metoprolol consumption increases—reaching tens of tons annually in many countries—the cumulative environmental impact of analytical methodologies used for quality control, bioequivalence studies, and environmental monitoring becomes substantial [75]. This technical guide explores the application of two prominent greenness assessment metrics—AGREE and GAPI—within this specific research context, providing pharmaceutical scientists with practical frameworks for environmental impact assessment.
Foundational Principles of Greenness Assessment Metrics
The Evolution of Green Metrics in Analytical Chemistry
Green chemistry principles were formally applied to analytical chemistry in 2000, establishing GAC as a dedicated subdiscipline [74]. Early assessment tools like the National Environmental Methods Index (NEMI) introduced a simple pictogram indicating whether a method met basic environmental criteria related to toxicity, waste, and safety [74] [79]. While accessible, NEMI's binary (pass/fail) approach lacked granularity to differentiate between degrees of greenness or assess complete analytical workflows [74]. The subsequent development of the Analytical Eco-Scale (AES) introduced a semi-quantitative approach by assigning penalty points to non-green attributes subtracted from a base score of 100 [76] [74]. This facilitated method comparisons but still relied heavily on expert judgment and lacked visual components [74].
The field advanced significantly with the introduction of metrics that combined comprehensive assessment frameworks with intuitive visualization. The Green Analytical Procedure Index (GAPI) expanded evaluation scope to encompass the entire analytical process through a five-part, color-coded pictogram [74] [79]. Concurrently, the Analytical Greenness (AGREE) metric emerged as a tool based directly on the 12 principles of GAC, providing both a unified circular pictogram and a numerical score between 0 and 1 [74]. Recent refinements have produced specialized tools like AGREEprep for sample preparation, Modified GAPI (MoGAPI) with cumulative scoring, and Analytical Green Star Analysis (AGSA) with star-shaped visualization [74] [79]. The progression toward more holistic, quantitative, and user-friendly assessments reflects the growing sophistication of greenness evaluation in analytical science [74].
The Twelve Principles of Green Analytical Chemistry
The AGREE metric directly incorporates the 12 principles of GAC established by Jacek Namieśnik, which provide the foundational framework for comprehensive greenness assessment [79]. These principles address the complete analytical lifecycle from sample collection to final analysis:
- Direct analysis techniques should be employed to eliminate sample preparation steps
- Energy consumption should be minimized throughout the analytical process
- Automated and miniaturized methods are preferred to reduce resource consumption
- Derivatization steps should be avoided due to additional reagent use and waste generation
- Sample preservation is crucial to prevent repeated analyses
- Multi-analyte methods maximize information from single analyses
- Integration of analytical operations and automation reduces intermediate steps
- Reagent and material quantities should be minimized where possible
- Safe, renewable, and biodegradable reagents should replace hazardous chemicals
- Waste generation should be minimized with clear management protocols
- Multi-parameter procedures providing maximum information are preferred
- Operator safety must be prioritized through containment and hazard reduction [79]
These principles collectively address the three pillars of sustainability—environmental impact, economic viability, and social responsibility—within the specific context of analytical methodology.
The AGREE (Analytical Greenness) Metric
The AGREE metric represents a significant advancement in greenness assessment by translating the 12 principles of GAC into a comprehensive, quantitative evaluation tool [74]. This metric employs a user-friendly software calculator that generates both a numerical score between 0 and 1 (with 1 representing ideal greenness) and a circular pictogram that visually represents performance across all 12 principles [74] [79]. The pictogram uses a color gradient from red (poor performance) to green (excellent performance) for each principle segment, providing immediate visual feedback on method strengths and weaknesses [74].
AGREE's calculation algorithm incorporates weighted assessments of multiple factors including energy consumption, reagent toxicity, waste generation, and operator safety [79]. The metric evaluates the complete analytical procedure rather than isolated components, enabling direct comparisons between different methods [74]. A key advantage of AGREE is its ability to highlight specific areas for improvement by clearly identifying which GAC principles are not adequately addressed [74]. However, AGREE has limitations regarding pre-analytical processes such as reagent synthesis or probe preparation, and involves some subjectivity in weighting evaluation criteria [74].
The GAPI (Green Analytical Procedure Index) Metric
The Green Analytical Procedure Index (GAPI) provides a detailed visual assessment of method greenness across the entire analytical process through a five-part pictogram [74] [79]. Each section of the GAPI pictogram represents a different stage of analysis: sample collection, preservation, transportation, and storage; sample preparation; reagents and solvents used; instrumentation; and method type [79]. The pictogram employs a three-level color code (green, yellow, red) to indicate the environmental impact at each stage, allowing rapid identification of problematic areas within the analytical workflow [74].
GAPI's primary strength lies in its comprehensive coverage of the analytical lifecycle and its intuitive visual representation that is easily interpretable even by non-specialists [74] [79]. Unlike AGREE, GAPI does not generate an overall numerical score, which can limit direct comparability between methods [74]. Additionally, GAPI color assignments can involve subjective interpretation, particularly for complex analytical procedures [74]. Recent modifications have led to MoGAPI (Modified GAPI) and ComplexGAPI, which introduce cumulative scoring systems and extend assessment to pre-analytical processes, respectively [74] [79].
Comparative Analysis of Metric Features
Table 1: Comparison of Key Characteristics of AGREE and GAPI Metrics
| Feature | AGREE | GAPI |
|---|---|---|
| Theoretical Basis | 12 principles of Green Analytical Chemistry | Comprehensive analytical procedure stages |
| Output Format | Numerical score (0-1) + circular pictogram | Color-coded rectangular pictogram (no overall score) |
| Visualization | Circular diagram with 12 colored sections | Five-part diagram with three-color scale |
| Assessment Scope | Entire analytical method | Sample collection through final detection |
| Quantitative Capability | Yes (numerical score enables direct comparison) | Semi-quantitative (color coding only) |
| Pre-Analytical Phase | Limited coverage | More comprehensive inclusion |
| Ease of Interpretation | Requires understanding of 12 principles | Intuitive visual representation |
| Software Requirements | Dedicated calculator available | No specialized software needed |
Practical Application to Metoprolol Analysis
Analytical Challenges in Metoprolol Extraction
Metoprolol extraction from tablet matrices presents specific challenges that impact greenness assessment. Tablet formulations typically contain excipients such as microcrystalline cellulose, hypromellose (HPMC), colloidal silicon dioxide, and magnesium stearate, which can interfere with analysis [7] [77]. Conventional extraction methods often require multiple steps including grinding, dissolution, filtration, and purification before chromatographic analysis [7]. These procedures frequently involve significant quantities of organic solvents such as methanol, acetonitrile, or chloroform, which generate hazardous waste and pose environmental concerns [75] [78].
The chemical properties of metoprolol further complicate green extraction. As a weak base with pKa values favoring ionization at typical analytical pH levels, metoprolol may require pH adjustment for optimal extraction efficiency [75]. Additionally, sample preparation for biological matrices (plasma, urine) or environmental samples often necessitates preconcentration steps to achieve adequate sensitivity for detection at low concentrations (typically ng/mL to μg/mL) [75] [71]. These factors collectively increase the environmental footprint of metoprolol analysis, making greenness evaluation particularly relevant for methodology development and optimization.
Case Study: Greenness Assessment of Spectrofluorimetric Method
A recently published spectrofluorimetric method for quantifying metoprolol in spiked human plasma provides an illustrative case study for AGREE and GAPI application [71]. The method simultaneously analyzes metoprolol with aspirin and olmesartan using native fluorescence, synchronous fluorescence, and second-order derivative spectrofluorimetry without chromatographic separation [71]. Key green features include the elimination of hazardous solvents for separation, minimal sample preparation (protein precipitation with acetonitrile), and direct analysis without derivatization [71].
When evaluated using AGREE, this method achieved a high greenness score [71]. Strengths included minimal energy consumption (significantly lower than LC-MS methods), reduced reagent volumes, and avoidance of toxic solvents. The method's ability to analyze multiple compounds simultaneously addressed the multi-analyte principle of GAC [71]. GAPI assessment similarly demonstrated favorable performance, with green ratings in sample preparation, instrumentation, and method type categories [71]. The primary limitations identified through both metrics related to waste management and the use of acetonitrile in sample preparation, highlighting specific areas for potential improvement [71].
Experimental Protocol for Green Method Development
Developing green analytical methods for metoprolol extraction requires systematic implementation of GAC principles throughout the methodological design:
Sample Preparation Phase
- Implement microextraction techniques such as sugaring-out liquid-liquid microextraction (SULLME) to reduce solvent consumption to less than 10 mL per sample [74]
- Explore alternative solvents including natural deep eutectic solvents (NADESs) or supramolecular solvents to replace traditional toxic organic solvents [76]
- Consider direct analysis approaches where feasible to eliminate extraction steps entirely [71]
Instrumentation and Analysis Phase
- Select energy-efficient instrumentation with lower power requirements per analysis
- Optimize methods for high sample throughput to reduce energy consumption per sample
- Implement miniaturized detection systems where appropriate to reduce resource consumption [74] [79]
Waste Management Phase
- Incorporate waste treatment procedures for hazardous byproducts
- Design methods for solvent recovery and reuse where feasible
- Select biodegradable reagents to reduce environmental persistence of waste streams [74]
Table 2: Research Reagent Solutions for Green Metoprolol Analysis
| Reagent Category | Specific Examples | Function in Analysis | Greenness Advantages |
|---|---|---|---|
| Extraction Solvents | Natural deep eutectic solvents (NADESs) | Metoprolol extraction from matrices | Biodegradable, low toxicity, renewable sourcing |
| Solid-Phase Sorbents | Molecularly imprinted polymers (MIPs) | Selective metoprolol extraction | Reusable, high selectivity reduces clean-up needs |
| Chromatographic Mobile Phases | Ethanol-water mixtures | HPLC separation of metoprolol | Reduced toxicity compared to acetonitrile or methanol |
| Protein Precipitation Reagents | Bio-based acetonitrile alternatives | Plasma sample preparation | Lower environmental impact, reduced hazardous waste |
| Derivatization Agents | Avoidance where possible | Not applicable | Elimination reduces reagent use and waste generation |
Implementation Guide for AGREE and GAPI Assessment
Step-by-Step AGREE Evaluation Protocol
Data Collection: Compile complete methodological details including sample preparation, reagent types and quantities, instrumentation specifications, energy consumption, waste generation, and operator safety requirements [74] [79]
Principle Evaluation: Assess the method against each of the 12 GAC principles, assigning scores based on specific criteria for reagent toxicity, energy usage, waste production, and other factors [79]
Software Utilization: Input assessment data into the dedicated AGREE calculator (freely available online) to generate the numerical score and pictogram [74] [79]
Interpretation and Optimization: Analyze results to identify poorly performing areas (represented by red pictogram segments) and modify methods to address these specific deficiencies [74]
The following diagram illustrates the workflow for comprehensive greenness assessment using AGREE and GAPI:
Step-by-Step GAPI Evaluation Protocol
Stage Identification: Divide the analytical method into the five GAPI categories: sample handling, sample preparation, reagents and solvents, instrumentation, and method type [74] [79]
Color Coding: Assign green, yellow, or red to each subcategory based on specific criteria for that stage:
Pictogram Construction: Complete the five-section GAPI diagram using the assigned colors to create a visual representation of method greenness [74]
Comparative Analysis: Use the completed GAPI pictogram to compare different methodological approaches and identify stages with the highest environmental impact [74]
Advanced Integration of Multiple Metrics
For comprehensive assessment, researchers should consider integrating multiple greenness metrics to leverage their complementary strengths:
AGREE + GAPI: Combine AGREE's quantitative scoring with GAPI's detailed stage-by-stage evaluation for both overall comparison and specific improvement targeting [74]
Specialized Tools: Incorporate AGREEprep for focused assessment of sample preparation steps, which are often particularly impactful in metoprolol analysis [74]
Emerging Metrics: Consider newer tools like Analytical Green Star Analysis (AGSA) for star-shaped visualization or Carbon Footprint Reduction Index (CaFRI) for climate-specific impact assessment [74]
The integrated use of multiple metrics provides a multidimensional perspective on method sustainability, enabling more informed decision-making in method development and optimization [74].
Emerging Trends in Greenness Assessment
The field of greenness evaluation continues to evolve with several emerging trends shaping future development. There is growing emphasis on lifecycle assessment approaches that consider environmental impacts from reagent production through waste disposal, moving beyond the analytical process itself [74]. Tools like ComplexGAPI now explicitly incorporate preliminary steps including reagent synthesis and probe preparation, recognizing that these upstream processes contribute significantly to overall environmental footprint [74]. Additionally, climate-specific metrics like the Carbon Footprint Reduction Index (CaFRI) align analytical chemistry with broader climate goals by focusing specifically on carbon emissions [74].
The integration of greenness assessment with other methodological evaluation frameworks represents another significant trend. The concept of White Analytical Chemistry (WAC) has emerged as a holistic model that balances the green (environmental) component with blue (methodological practicality) and red (analytical performance) dimensions [74]. This triadic approach acknowledges that sustainable method development must address all three aspects simultaneously rather than prioritizing environmental concerns alone [74]. For metoprolol analysis specifically, this might involve balancing green solvent selection with maintaining adequate extraction efficiency and detection sensitivity for low concentrations in complex matrices.
The application of AGREE and GAPI metrics provides a systematic framework for evaluating and improving the environmental sustainability of analytical methods for metoprolol extraction from tablet matrices. These complementary tools enable researchers to quantify environmental impact, identify methodological weaknesses, and implement targeted improvements while maintaining analytical performance. As pharmaceutical analysis faces increasing pressure to adopt sustainable practices, the integration of greenness assessment into method development and validation becomes essential. By implementing the protocols and guidelines presented in this technical review, researchers and drug development professionals can significantly reduce the environmental footprint of metoprolol analysis while advancing the broader goals of Green Analytical Chemistry.
Conclusion
The accurate extraction and analysis of metoprolol from tablet matrices demand a holistic approach that addresses foundational challenges with sophisticated methodological solutions. The integration of modern microextraction techniques like HF-LPME and DLLME significantly improves selectivity and minimizes solvent use, aligning with green analytical chemistry principles. Successful method development hinges on systematic optimization of physical and chemical parameters, while rigorous validation ensures data reliability for quality control. Future directions point toward increased automation, the development of even greener solvents, and the application of these robust, miniaturized methods to support therapeutic drug monitoring and the analysis of complex biological samples, thereby bridging pharmaceutical quality control with clinical research needs.
References
- 1. Metoprolol - StatPearls - NCBI Bookshelf [https://www.ncbi.nlm.nih.gov/books/NBK532923/]
- 2. Metoprolol tartrate vs. succinate: Differences in uses and ... [https://www.medicalnewstoday.com/articles/324175]
- 3. A Design and Evaluation of Layered Matrix Tablet ... [https://pmc.ncbi.nlm.nih.gov/articles/PMC2902323/]
- 4. Preparation and Evaluation of Sustained-Release Matrix ... [https://pmc.ncbi.nlm.nih.gov/articles/PMC3513464/]
- 5. Differential Impact of Metoprolol Formulations on Heart ... [https://www.sciencedirect.com/science/article/pii/S3050661125000802]
- 6. Robustness of barrier membrane coated metoprolol tartrate ... [https://www.sciencedirect.com/science/article/abs/pii/S0378517318302163]
- 7. Development of Extended-Release Mini-Tablets ... [https://www.mdpi.com/1999-4923/14/5/892]
- 8. A Review on Sustainable Approaches in Pharmaceutical ... [https://pubmed.ncbi.nlm.nih.gov/40990286/]
- 9. Effect of Excipients on the Quality of Drug Formulation and ... [https://pmc.ncbi.nlm.nih.gov/articles/PMC10146418/]
- 10. Expert Perspectives on Enhancing Analytical Methods for ... [https://pmc.ncbi.nlm.nih.gov/articles/PMC12607475/]
- 11. Simultaneous Quantitative Determination of Metoprolol ... [https://pmc.ncbi.nlm.nih.gov/articles/PMC3007609/]
- 12. A cross-sectional study on metoprolol concentrations in ... [https://pmc.ncbi.nlm.nih.gov/articles/PMC11311911/]
- 13. Gas chromatography–mass spectrometry method for ... [https://www.sciencedirect.com/science/article/abs/pii/S0039914009005438]
- 14. High-performance liquid chromatographic determination of ... [https://pubmed.ncbi.nlm.nih.gov/7057362/]
- 15. Tablet splitting: Product quality assessment of metoprolol ... [https://www.sciencedirect.com/science/article/abs/pii/S0378517310006812]
- 16. Sample Preparation of Drug Substances and Products in ... [https://www.chromatographyonline.com/view/sample-preparation-of-drug-substances-and-products-in-regulated-testing-a-primer]
- 17. Development of a hollow fiber–liquid phase ... [https://www.sciencedirect.com/science/article/abs/pii/S1570023224000977]
- 18. The Effectiveness of Liquid-Phase Microextraction of Beta ... [https://pmc.ncbi.nlm.nih.gov/articles/PMC11901778/]
- 19. Determination of metoprolol and its two metabolites in ... [https://www.sciencedirect.com/science/article/abs/pii/S1570023213004388]
- 20. HPLC quantification of metoprolol with solid-phase ... [https://pubmed.ncbi.nlm.nih.gov/15484221/]
- 21. Application of Hollow Fibre-Liquid Phase Microextraction ... [https://pmc.ncbi.nlm.nih.gov/articles/PMC7693864/]
- 22. Trends in hollow fibre liquid phase microextraction for the ... [https://www.sciencedirect.com/science/article/abs/pii/S0304389422003612]
- 23. Green and Emerging Microextraction Strategies for ... [https://www.mdpi.com/1420-3049/30/22/4471]
- 24. The Use of Hollow Fibers in Liquid-Phase Microextraction [https://www.chromatographyonline.com/view/use-hollow-fibers-liquid-phase-microextraction]
- 25. Advancements in overcoming challenges in dispersive ... [https://www.sciencedirect.com/science/article/pii/S0165993623005162]
- 26. Dispersive Liquid-Liquid Microextraction: A Review and ... [https://www.chromatographyonline.com/view/dispersive-liquid-liquid-microextraction-review-roundup-green-sample-prep-advancements]
- 27. UHPLC, Ramipril, Metoprolol Succinate ... [https://jchr.org/index.php/JCHR/article/view/10109]
- 28. Comparison Techniques for HPLC Column Performance [https://www.chromatographyonline.com/view/comparison-techniques-hplc-column-performance]
- 29. Optimization and establishment of a validated stability- ... [https://pubmed.ncbi.nlm.nih.gov/20629394/]
- 30. Development of a RP-HPLC method for simultaneous ... [https://pubmed.ncbi.nlm.nih.gov/38781808/]
- 31. A randomized, cross‐over trial of metoprolol succinate ... [https://pmc.ncbi.nlm.nih.gov/articles/PMC9283731/]
- 32. Evaluation of in vitro dissolution profiles of modified ... [https://www.sciencedirect.com/science/article/pii/S0928098724000058]
- 33. Green synchronous spectrofluorimetric method for the ... [https://www.nature.com/articles/s41598-022-26827-2]
- 34. Excitation, emission, and synchronous fluorescence for ... [https://www.sciencedirect.com/science/article/abs/pii/S0019103521003456]
- 35. Development and validation of a sustainable ... - BMC Chemistry [https://bmcchem.biomedcentral.com/articles/10.1186/s13065-025-01624-w]
- 36. Second Derivative Synchronous Fluorescence Spectroscopy ... [https://pmc.ncbi.nlm.nih.gov/articles/PMC3614762/]
- 37. Green first derivative synchronous spectrofluorimetric ... [https://pmc.ncbi.nlm.nih.gov/articles/PMC12267493/]
- 38. Selective Spectrofluorimetric Approach for the Assessment ... [https://www.mdpi.com/1424-8247/15/10/1174]
- 39. Development of a highly sensitive and green first-derivative ... [https://www.sciencedirect.com/science/article/abs/pii/S1386142524003305]
- 40. Modern Trends and Best Practices in Mobile-Phase ... [https://www.chromatographyonline.com/view/modern-trends-and-best-practices-mobile-phase-selection-reversed-phase-chromatography-0]
- 41. Experimental Design: Approaches and Applications in ... [https://jddtonline.info/index.php/jddt/article/view/4908]
- 42. A design to improve pharmaceutical research - PubMed Central [https://pmc.ncbi.nlm.nih.gov/articles/PMC10026327/]
- 43. Box–Behnken design [https://en.wikipedia.org/wiki/Box%E2%80%93Behnken_design]
- 44. Box-Behnken design: An alternative for the optimization of ... [https://www.sciencedirect.com/science/article/pii/S0003267007011671]
- 45. Box-Behnken Designs | Statistics Knowledge Portal [https://www.jmp.com/en/statistics-knowledge-portal/design-of-experiments/response-surface-methodology/box-behnken-designs]
- 46. Integrating In Vitro BE Checker with In Silico Physiologically ... [https://pmc.ncbi.nlm.nih.gov/articles/PMC12473486/]
- 47. Extraction and Analytical Techniques for Pharmaceuticals ... [https://www.mdpi.com/2071-1050/17/22/10025]
- 48. Spectrophotometric Determination of Metoprolol Tartrate in ... [https://www.mdpi.com/1424-8247/4/7/964]
- 49. Biofunctional Excipients: Their Emerging Role in Overcoming ... [https://pmc.ncbi.nlm.nih.gov/articles/PMC12114886/]
- 50. Green chemistry metrics: Insights from case studies in fine ... [https://www.sciencedirect.com/science/article/pii/S2352554125001603]
- 51. Handbook of Solid Phase Microextraction [https://www.sciencedirect.com/book/9780124160170/handbook-of-solid-phase-microextraction]
- 52. Development of a homogeneous liquid–liquid microextraction ... [https://pubs.rsc.org/en/content/articlehtml/2025/ra/d5ra07135f]
- 53. Comparison of the analysis of beta-blockers by different ... [https://pubmed.ncbi.nlm.nih.gov/19879818/]
- 54. Handbook of Solid Phase Microextraction|eBook [https://www.barnesandnoble.com/w/handbook-of-solid-phase-microextraction-janusz-pawliszyn/1107968809]
- 55. Development of Extended-Release Mini-Tablets Containing ... [https://pmc.ncbi.nlm.nih.gov/articles/PMC9146084/]
- 56. Custom-dosed metoprolol tartrate tablets via semisolid ... [https://pmc.ncbi.nlm.nih.gov/articles/PMC11388020/]
- 57. ICH Q2(R2) Validation of analytical procedures [https://www.ema.europa.eu/en/ich-q2r2-validation-analytical-procedures-scientific-guideline]
- 58. Development and in-vitro evaluation of multilayer ... [https://japsonline.com/abstract.php?article_id=4458&sts=2]
- 59. Q2(R2) Validation of Analytical Procedures March 2024 [https://www.fda.gov/regulatory-information/search-fda-guidance-documents/q2r2-validation-analytical-procedures]
- 60. A linear validation method of analytical procedures based ... [https://www.sciencedirect.com/science/article/abs/pii/S0003267024004963]
- 61. Analytical Methods: A Statistical Perspective on the ICH ... [https://www.biopharminternational.com/view/analytical-methods-statistical-perspective-ich-q2a-and-q2b-guidelines-validation-analytical-methods]
- 62. Real-world research on beta-blocker usage trends in China ... [https://pmc.ncbi.nlm.nih.gov/articles/PMC11566443/]
- 63. Development of a hollow fiber-liquid phase microextraction ... [https://pubmed.ncbi.nlm.nih.gov/38547699/]
- 64. Spectrophotometric Determination of Metoprolol Tartrate in ... [https://pmc.ncbi.nlm.nih.gov/articles/PMC4058672/]
- 65. The Effectiveness of Liquid-Phase Microextraction of Beta ... [https://www.mdpi.com/1420-3049/30/5/1016]
- 66. Development of a Scalable Process of Film-Coated bi ... [https://www.mdpi.com/1999-4923/13/11/1797]
- 67. Development of a RP-HPLC method for simultaneous ... [https://www.sciencedirect.com/science/article/pii/S1570023224001685]
- 68. Analytical Method for the Simultaneous Estimation of ... [https://pmc.ncbi.nlm.nih.gov/articles/PMC3267308/]
- 69. AAS and spectrophotometric methods for the determination ... [https://www.sciencedirect.com/science/article/pii/S1386142599001213]
- 70. Synchronous fluorescence spectrofluorimetric method for the ... [https://pmc.ncbi.nlm.nih.gov/articles/PMC3223136/]
- 71. Green spectrofluorimetric quantification of aspirin, ... [https://www.nature.com/articles/s41598-023-46042-x]
- 72. Inhibition of photoinduced electron transfer for sensitive ... [https://www.sciencedirect.com/science/article/abs/pii/S101060302500303X]
- 73. Comparison of UV spectrophotometry and high ... [https://pmc.ncbi.nlm.nih.gov/articles/PMC3658086/]
- 74. Assessing the Environmental Impact of Analytical Methods [https://www.chromatographyonline.com/view/the-green-component-assessing-the-environmental-impact-of-analytical-methods]
- 75. Analysis of Beta-Blockers in Environment - A Review [https://www.jscimedcentral.com/jounal-article-info/JSM-Environmental-Science-and-Ecology/Analysis-of-Beta-Blockers-in-Environment-A-Review-12203]
- 76. Greenness metrics for analytical methodologies linked to ... [https://www.sciencedirect.com/science/article/pii/S2772577424000491]
- 77. Development and In-Vitro Assessment of Sustained ... - Sciety [https://sciety.org/articles/activity/10.21203/rs.3.rs-8014851/v1?utm_source=sciety_labs_article_page]
- 78. An Update on the Use of Molecularly Imprinted Polymers in ... [https://pmc.ncbi.nlm.nih.gov/articles/PMC9104958/]
- 79. Greenness evaluation metric for analytical methods and ... [https://pmc.ncbi.nlm.nih.gov/articles/PMC12318332/]