UV-Vis Light Sources and Detectors: A 2025 Technology Overview for Biomedical Research
This article provides a comprehensive overview of the fundamental principles, current technologies, and practical applications of UV-Vis light sources and detectors, tailored for researchers and drug development professionals.
UV-Vis Light Sources and Detectors: A 2025 Technology Overview for Biomedical Research
Abstract
This article provides a comprehensive overview of the fundamental principles, current technologies, and practical applications of UV-Vis light sources and detectors, tailored for researchers and drug development professionals. It explores the core mechanisms of light-matter interaction and electronic transitions, details the latest advancements in instrumentation for 2025, and presents established and emerging methodological applications in pharmaceutical analysis and environmental monitoring. The content further offers systematic troubleshooting guidance for common instrument and methodology issues and validates the technology's performance through comparative analysis with other spectroscopic techniques. By synthesizing foundational knowledge with cutting-edge applications and validation data, this guide serves as an essential resource for optimizing the use of UV-Vis spectroscopy in research and quality control environments.
The Principles of Light-Matter Interaction: From Electronic Transitions to Modern Instrument Design
Ultraviolet-Visible (UV-Vis) spectroscopy stands as a fundamental analytical technique in modern laboratories, providing critical insights into molecular structure and concentration. When molecules interact with light in the ultraviolet (200-400 nm) and visible (400-700 nm) regions of the electromagnetic spectrum, they undergo electronic transitions that form the basis for quantitative and qualitative analysis [1]. The Beer-Lambert Law provides the mathematical framework that links this light absorption to chemical properties, establishing a direct relationship between absorbance and analyte concentration [2] [3]. This technical guide explores these core principles within the context of contemporary UV-Vis light source and detector technology, with particular emphasis on applications relevant to researchers, scientists, and drug development professionals.
Fundamental Principles of Electronic Transitions
When molecules absorb UV or visible light energy, electrons are promoted from ground-state molecular orbitals to higher-energy excited states. This process differs fundamentally from infrared spectroscopy, where energy absorption causes molecular vibrations rather than electronic transitions [1]. The energy of the absorbed photons must precisely match the energy gap between the involved molecular orbitals for the transition to occur.
The specific wavelengths absorbed reveal crucial information about molecular structure. For example, molecules with conjugated π systems absorb at longer wavelengths with higher intensity than those with isolated double bonds due to smaller HOMO-LUMO energy gaps [1].
Types of Electronic Transitions
Several distinct electronic transitions can occur depending on molecular structure and orbital types:
σ → σ* Transitions: These require the highest energy, typically occurring in the far UV region below 150 nm. For molecular hydrogen (H₂), this transition occurs at 111 nm, corresponding to an energy of 258 kcal/mol [1].
π → π* Transitions: These transitions occur in molecules with double bonds or conjugated systems. While ethene absorbs at 165 nm, extended conjugation significantly reduces the energy requirement, with 1,3-butadiene absorbing at 217 nm and 1,3,5-hexatriene at 258 nm [1].
n → π* Transitions: These involve the promotion of a non-bonding electron (often from oxygen, nitrogen, or sulfur atoms) to a π* antibonding orbital. These transitions are typically weaker and occur at longer wavelengths than π→π* transitions. In 4-methyl-3-penten-2-one, the n→π* transition appears as a weaker absorbance at 314 nm alongside the stronger π→π* transition at 236 nm [1].
Table 1: Characteristic Electronic Transitions in Organic Molecules
| Transition Type | Energy Requirement | Example Compound | Absorption Wavelength | Molar Absorptivity |
|---|---|---|---|---|
| σ → σ* | Very High | Molecular Hydrogen (H₂) | 111 nm | High |
| π → π* | Moderate | Ethene | 165 nm | High |
| π → π* (Conjugated) | Lower | 1,3-Butadiene | 217 nm | High (~20,000) |
| n → π* | Lowest | 4-methyl-3-penten-2-one | 314 nm | Low (~100) |
Chromophores and Molecular Structure
Chromophores are molecular regions responsible for light absorption, typically consisting of π-electron systems or atoms with non-bonding electrons. The degree of conjugation dramatically affects absorption properties, with extended conjugation leading to absorption at longer wavelengths. Beta-carotene, with its system of 11 conjugated double bonds, absorbs blue light (around 470 nm) while transmitting red-yellow wavelengths, accounting for the characteristic orange color of carrots [1].
The Beer-Lambert Law: Foundation and Formulations
Historical Development
The relationship between light absorption and material properties has evolved through centuries of scientific inquiry:
1729: Pierre Bouguer discovered that light intensity decreases exponentially with path length through a medium, establishing the foundation for quantitative photometry [2] [4].
1760: Johann Heinrich Lambert formalized Bouguer's observations mathematically, expressing the exponential relationship between transmission and path length [2] [4].
1852: August Beer extended the law to incorporate concentration dependence, recognizing that absorbance in solutions relates directly to solute concentration [2] [4].
1913: Robert Luther and Andreas Nikolopulos provided the modern mathematical formulation emphasizing the logarithmic relationship between intensity and concentration/path length [2].
Mathematical Formulations
The Beer-Lambert Law establishes that absorbance is directly proportional to the concentration of the absorbing species and the path length through the medium. The fundamental equation is:
Where:
- A = Absorbance (unitless)
- ε = Molar absorptivity or extinction coefficient (M⁻¹cm⁻¹)
- c = Concentration (M)
- l = Path length (cm)
This relationship derives from the logarithmic dependence of absorbance on transmittance:
Where:
- I₀ = Incident light intensity
- I = Transmitted light intensity
Transmittance (T) is defined as T = I/I₀, with absorbance relating to transmittance as A = -log₁₀(T) [3] [5].
Table 2: Relationship Between Absorbance and Transmittance
| Absorbance (A) | Transmittance (T) | % Transmittance | Light Transmitted |
|---|---|---|---|
| 0 | 1 | 100% | All light transmitted |
| 0.3 | 0.5 | 50% | Half of incident light |
| 1 | 0.1 | 10% | One-tenth of incident light |
| 2 | 0.01 | 1% | One-hundredth of incident light |
| 3 | 0.001 | 0.1% | One-thousandth of incident light |
Limitations and Practical Considerations
The linear relationship described by the Beer-Lambert Law holds true only under specific conditions [4] [5]:
- Monochromatic Light: The law assumes measurements with single-wavelength light.
- Low Concentrations: At high concentrations (typically A > 1), molecular interactions can cause deviations from linearity.
- Chemical Independence: Absorbing species must not interact chemically.
- No Scattering: The sample should not scatter significant radiation.
- Homogeneous Solutions: Samples must be uniformly distributed.
For reliable quantitative measurements, absorbance values between 0.1 and 1.0 are recommended, corresponding to 80-10% light transmission [5]. Measurements with absorbance greater than 3.0 may be subject to significant error due to insufficient light reaching the detector [5].
Experimental Protocols and Methodologies
Quantitative Concentration Determination
Protocol 1: Standard Curve Method for Solution Concentration
Preparation of Standard Solutions: Create a series of standard solutions with known concentrations spanning the expected range of the unknown samples.
Spectrometer Setup: Allow the UV-Vis spectrometer to warm up for appropriate stabilization time (typically 30 minutes). Set the optimal wavelength based on the compound's absorption maximum (λmax).
Blank Measurement: Fill a cuvette with solvent alone and measure the baseline absorbance to zero the instrument.
Standard Measurement: Measure the absorbance of each standard solution using consistent instrument parameters (bandwidth, integration time) and path length (typically 1 cm).
Calibration Curve: Plot absorbance versus concentration for the standard solutions and perform linear regression analysis.
Unknown Sample Measurement: Measure the absorbance of the unknown sample under identical conditions and determine concentration from the calibration curve.
Data Analysis: The slope of the calibration curve equals ε·l, allowing determination of the molar absorptivity if path length is known [3].
Molar Absorptivity Determination
Protocol 2: Direct Measurement of Extinction Coefficient
Accurate Weighing: Precisely weigh a pure, dry sample of the compound of interest.
Solution Preparation: Dissolve in a suitable solvent to create a stock solution of known concentration.
Dilution Series: Prepare appropriate dilutions to ensure absorbance measurements fall within the linear range (0.1-1.0 AU).
Absorbance Measurement: Measure absorbance at the compound's λmax using a spectrophotometer with calibrated wavelength accuracy.
Calculation: Apply the Beer-Lambert Law rearranged as ε = A/(c·l), using the known concentration and path length.
Validation: Repeat with multiple concentrations to confirm consistency of the calculated ε values, indicating adherence to the Beer-Lambert Law.
Spectral Acquisition for Compound Identification
Protocol 3: Full Spectrum Analysis for Compound Characterization
Sample Preparation: Prepare a solution with appropriate concentration to yield absorbance values between 0.5-1.0 at the strongest absorption band.
Instrument Parameters: Set the spectrophotometer to scan across the UV-Vis range (typically 190-800 nm) with appropriate resolution (1-2 nm).
Data Collection: Record the full absorption spectrum, identifying all local maxima and minima.
Spectral Analysis: Note the wavelength of maximum absorption (λmax) and corresponding molar absorptivity (ε) for each peak, which serve as characteristic identifiers for the compound.
Advanced Applications and Modifications
Modified Beer-Lambert Law for Biological Tissues
In scattering media like biological tissues, the traditional Beer-Lambert Law requires modification to account for photon path lengthening due to scattering [4]. The Modified Beer-Lambert Law (MBLL) incorporates a Differential Pathlength Factor (DPF):
OD = -log(I/I₀) = DPF · μₐ · d + G [4]
Where:
- OD = Optical density
- DPF = Differential pathlength factor (typically 3-6 for biological tissues)
- μₐ = Absorption coefficient
- d = Inter-optode distance
- G = Geometry-dependent factor
This approach enables quantitative spectroscopy in highly scattering media such as living tissues, with applications in determining blood oxygen saturation and chromophore concentrations [4].
Multicomponent Analysis
For mixtures containing multiple absorbing species, the Beer-Lambert Law becomes:
A(λ) = l · Σ(εᵢ(λ) · cᵢ)
Where the total absorbance at each wavelength equals the sum of contributions from all chromophores. By measuring absorbance at multiple wavelengths and solving simultaneous equations, concentrations of individual components can be determined [2].
The Scientist's Toolkit: Essential Research Reagents and Materials
Table 3: Key Research Reagents and Materials for UV-Vis Spectroscopy
| Item | Function/Specification | Application Notes |
|---|---|---|
| Quartz Cuvettes | Path length typically 1 cm; transparent down to 190 nm | Required for UV measurements below 350 nm; handle by edges only |
| Methanol/UHPLC Grade | High-purity solvent with low UV absorbance | Suitable for background measurements; check purity at low wavelengths |
| Deuterium Lamp | UV light source (190-380 nm) | Standard in UV-Vis spectrometers; limited visible range output [6] |
| Tungsten Lamp | Visible light source (380-800 nm) | Often combined with D₂ lamp for full UV-Vis capability [6] |
| NIST-Traceable Standards | Reference materials for wavelength and absorbance calibration | Essential for method validation and regulatory compliance |
| Buffer Salts (e.g., PBS) | Maintain physiological pH for biological samples | Check UV transparency at desired wavelengths |
| Protein Assay Dyes | Bind proteins for enhanced detection (e.g., Bradford) | Enable protein quantification at visible wavelengths [5] |
| NADH/NAD+ Cofactors | Monitor enzyme kinetics at 340 nm | NADH absorbs at 340 nm while NAD+ does not [5] |
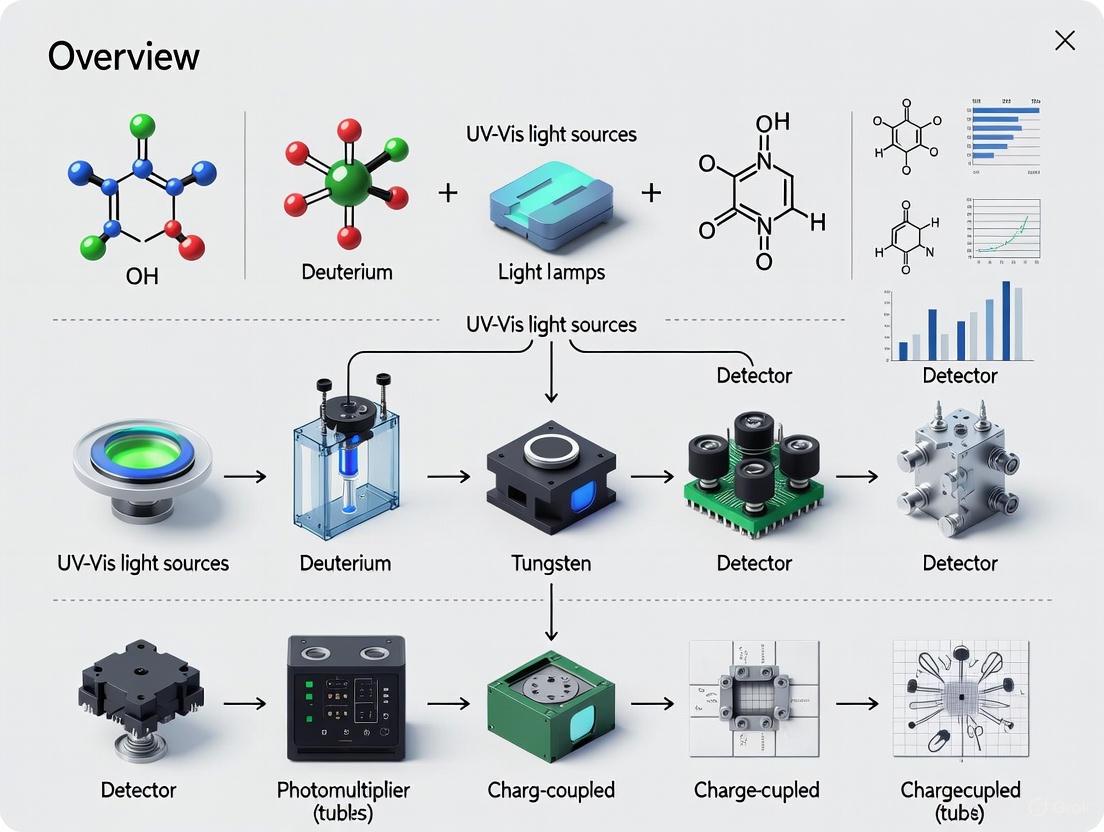
Visualization of Core Concepts
Electronic Transitions and Molecular Orbital Theory
UV-Vis Spectrometer Optical Configuration
Beer-Lambert Law Experimental Workflow
Contemporary Instrumentation and Technological Advances
Current UV-Vis Detector Technologies
Modern HPLC systems typically employ two primary types of UV-Vis detection systems:
Variable Wavelength Detectors (VWD): These instruments use a monochromator with movable diffraction grating to select specific wavelengths before the light passes through the flow cell. This design provides high sensitivity with minimal noise [7] [6].
Diode Array Detectors (DAD/PDA): These detectors pass broad-spectrum light through the flow cell, then disperse it onto an array of photodiodes (typically 512-1024 elements). This enables simultaneous capture of the entire spectrum, facilitating peak purity assessment and spectral comparison for compound identification [7] [6].
Recent market analyses indicate rapid growth in UV-Visible spectrometer technologies, with increasing integration of miniaturized and portable systems for field applications and automated workflow solutions for high-throughput laboratories [8]. The global UV-Visible spectrometers market is projected to grow from USD 1.5 billion in 2024 to USD 2.8 billion by 2033, at a compound annual growth rate of 7.5% [8].
Emerging Trends and Future Directions
The field of UV-Vis spectroscopy continues to evolve with several significant trends:
Integration of Artificial Intelligence: Machine learning algorithms are increasingly employed for spectral interpretation, calibration model development, and predictive maintenance of instrumentation [8].
Hybrid Spectrometer Systems: Combining UV-Vis with other analytical techniques provides comprehensive analytical solutions for complex sample matrices [9] [8].
Portable and Field-Deployable Instruments: Miniaturization technologies enable on-site analysis in environmental monitoring, pharmaceutical manufacturing, and food safety applications [8].
Enhanced Data Management Systems: Cloud-based platforms facilitate remote monitoring, data sharing, and collaborative research efforts across multiple sites [8].
Recent instrumentation reviews highlight novel products such as the Bruker Vertex NEO platform with vacuum FT-IR technology that removes atmospheric interference, and specialized systems like the ProteinMentor from Protein Dynamic Solutions designed specifically for protein analysis in biopharmaceutical applications [9].
The fundamental principles of electronic transitions and the Beer-Lambert Law remain cornerstones of modern analytical chemistry, providing the theoretical foundation for UV-Vis spectroscopy. While these core concepts have endured for centuries, their implementation continues to evolve through technological advancements in light sources, detector designs, and data analysis methodologies. For researchers and drug development professionals, understanding these principles enables proper experimental design, accurate data interpretation, and informed selection of analytical instrumentation. As UV-Vis technology progresses toward greater automation, miniaturization, and intelligence, the integration of these fundamental principles with advanced instrumentation will continue to drive scientific discovery and innovation across pharmaceutical, biotechnology, and materials science domains.
Ultraviolet-Visible (UV-Vis) spectroscopy stands as a cornerstone analytical technique in modern laboratories, providing critical insights for researchers, scientists, and drug development professionals. This technology measures the absorption of ultraviolet and visible light by molecules, yielding essential information about their composition, structure, and concentration [10]. The reliability and accuracy of any UV-Vis spectroscopic analysis are fundamentally dependent on two core components: the light source, which generates the incident electromagnetic radiation, and the detector, which captures the resulting signal after sample interaction [10] [11]. Understanding the intricate roles, operating principles, and technological variations of these components is paramount for optimizing analytical methods, particularly in highly regulated sectors like pharmaceuticals where method validation and data integrity are crucial. This guide provides a detailed technical examination of UV-Vis light sources and detector technology, framing this discussion within the context of their application in advanced research and drug development environments.
Fundamental Principles of UV-Vis Spectroscopy
UV-Vis spectroscopy operates on the principle that molecules absorb light in the ultraviolet (typically 190-400 nm) and visible (400-800 nm) regions of the electromagnetic spectrum [12] [10]. When a molecule absorbs this energy, its electrons are promoted from a ground state to a higher energy excited state. The wavelength at which this absorption occurs and the intensity of the absorption provide a characteristic profile, or spectrum, that can be used for both qualitative identification and quantitative analysis [13].
The relationship between light absorption and sample concentration is quantitatively described by the Beer-Lambert Law, which states that absorbance (A) is directly proportional to the concentration (c) of the absorbing species, the path length (L) of the sample container, and the molar absorptivity (ε) of the species [10]. This relationship is expressed mathematically as:
A = ε × c × L
This fundamental equation forms the basis for most quantitative applications of UV-Vis spectroscopy, from determining active pharmaceutical ingredient (API) concentrations in drug formulations to monitoring reaction kinetics in chemical research. The technique's remarkable sensitivity allows for the detection of components at concentrations as low as 10⁻⁷ to 10⁻⁴ g/mL, with relative errors typically between 1% and 5%, making it indispensable for analytical applications where precision is critical [12].
The Light Source: Illuminating the Sample
Function and Operating Principles
The light source in a UV-Vis spectrophotometer serves the fundamental purpose of generating a stable and continuous beam of electromagnetic radiation across the entire ultraviolet and visible wavelength range. The quality of the source directly impacts the instrument's sensitivity, signal-to-noise ratio, and overall analytical performance. A perfect source would emit constant energy across all wavelengths, but in practice, all real light sources exhibit some wavelength-dependent intensity variations that must be accounted for during measurement and calibration [10].
The underlying physical principle governing light source operation is the inverse relationship between a photon's energy and its wavelength. Shorter wavelengths in the UV region carry more energy than longer wavelengths in the visible region [10]. This energy differential is significant because promoting electrons in different bonding environments within a molecule requires specific, quantized amounts of energy. Consequently, the light source must provide a broad, continuous spectrum to ensure that the appropriate wavelengths are available to interact with the electronic structure of the analyte molecules being examined [10].
No single lamp technology can optimally cover the entire UV-Vis spectral range with uniform intensity. Therefore, most modern UV-Vis spectrophotometers employ either a single broadband source or, more commonly, multiple specialized sources that are automatically switched or blended during operation to provide seamless coverage across the spectrum. The table below summarizes the key characteristics of the most prevalent light source technologies.
Table 1: Comparison of Common UV-Vis Spectrometer Light Sources
| Source Type | Spectral Range | Key Characteristics | Typical Applications |
|---|---|---|---|
| Deuterium Lamp [12] [10] | 165-360 nm (UV) | Intense continuum in UV region, lower output in visible; requires warm-up time for stability | Primary UV source in dual-lamp systems; pharmaceutical QC; nucleic acid analysis |
| Tungsten-Halogen Lamp [12] [10] | 360-2500 nm (Vis-NIR) | Stable, intense output across visible spectrum; relatively low cost; longer lifespan | Primary visible light source in dual-lamp systems; color measurement; quantitative colorimetric assays |
| Xenon Lamp [10] | 175-2000 nm (UV-Vis-NIR) | Continuous spectrum across UV-Vis; high intensity; no switching required; more expensive and less stable than tungsten/halogen | Single-lamp systems; fast scanning applications; fluorescence spectroscopy |
| LED [11] | Varies by diode (specific bands) | Long lifetime; low power consumption; instant on/off; limited to specific wavelength bands | Portable/handheld instruments; dedicated analyzers; process monitoring |
In instruments employing two lamps, the switch between the deuterium and tungsten-halogen sources typically occurs between 300 and 350 nm, a region where the light emission characteristics of both sources are sufficiently similar to allow for a smooth transition [10]. More advanced systems incorporate sophisticated optics and software algorithms to manage this transition seamlessly, ensuring consistent energy delivery throughout the entire spectral scan.
The Detector: Capturing the Signal
Function and Operating Principles
Following the interaction of light with the sample, the detector performs the critical function of converting the transmitted light energy into a measurable electronic signal. The detector's sensitivity, dynamic range, and response characteristics ultimately determine the instrument's ability to distinguish subtle absorbance differences and measure low-concentration analytes [10]. In essence, the detector quantifies the intensity of light that has passed through the sample (I), which is then compared to the intensity of the initial incident light (I₀) to calculate transmittance (T = I/I₀) and subsequently absorbance (A = log₁₀(I₀/I)) [10].
The performance of a detector is governed by several key parameters. Sensitivity refers to the detector's ability to respond to very low light levels, which is essential for detecting dilute samples or analytes with low molar absorptivity. Signal-to-noise ratio (SNR) determines the clarity of the signal against the background electronic and photonic noise, directly impacting detection limits and measurement precision. Dynamic range defines the span between the lowest and highest detectable light intensities, enabling the analysis of both concentrated and dilute samples without requiring dilution. Wavelength response specifies the range over which the detector maintains optimal sensitivity, which must align with the operational spectral range of the instrument [10] [11].
Types of Detectors
Detector technology has evolved significantly, with modern UV-Vis spectrophotometers employing various detection systems tailored to specific application requirements. The selection of an appropriate detector depends on factors such as the required sensitivity, scanning speed, spectral resolution, and cost considerations.
Table 2: Comparison of Common UV-Vis Spectrometer Detectors
| Detector Type | Operating Principle | Sensitivity & Speed | Common Applications |
|---|---|---|---|
| Photomultiplier Tube (PMT) [12] [10] [11] | Photoelectric effect followed by electron multiplication through dynodes | Very high sensitivity; moderate scan speed (sequential wavelength measurement) | Research-grade instruments; low-light applications; high-resolution spectroscopy |
| Photodiode [10] [11] | Semiconductor-based; photon absorption creates electron-hole pairs generating current | Good sensitivity; faster than PMT | Routine analytical instruments; educational systems |
| Photodiode Array (PDA) [11] | Array of individual photodiodes; all wavelengths measured simultaneously | Good sensitivity; very fast acquisition (simultaneous measurement) | Rapid scans; kinetic studies; HPLC detectors |
| Charge-Coupled Device (CCD) [10] [11] | Semiconductor chip with pixels that accumulate charge proportional to light intensity | High sensitivity in array configuration; very fast acquisition | Advanced spectroscopic applications; imaging spectroscopy |
In process analytical technology (PAT) and industrial settings, detectors are particularly crucial as they enable continuous, real-time measurements without requiring manual sampling or process interruption. As noted in a ColVisTec 2024 report highlighted in a market analysis, modern detectors can perform measurements at intervals as frequent as every 10 seconds or less, providing near-instantaneous feedback for process control in pharmaceutical manufacturing and other industries [14].
Instrument Configuration and Workflow
Understanding how the source and detector function within the complete optical system is essential for appreciating their integrated roles. The following diagram illustrates the typical arrangement of components in a conventional UV-Vis spectrophotometer.
Diagram 1: UV-Vis Spectrometer Component Workflow
The optical pathway begins with the light source, which emits polychromatic (broad spectrum) radiation. This light then passes through a wavelength selection device, typically a monochromator containing a diffraction grating that disperses the light into its constituent wavelengths [10] [11]. By rotating the grating, specific narrow wavelength bands can be sequentially directed toward the sample. The monochromator's resolution, determined largely by the number of grooves per millimeter on the grating (typically 1200 grooves/mm or more for research-grade instruments), defines the instrument's ability to distinguish between closely spaced absorption peaks [10].
After passing through the sample compartment, where a portion of the light is absorbed by the analyte, the transmitted light reaches the detector. The detector converts the photon energy into an electrical signal, which is then amplified, processed, and converted to digital format for analysis and display [10] [11]. Modern instruments automatically compare this sample signal to a reference measurement (typically of the pure solvent or buffer) to compute the true absorbance of the analyte at each wavelength, ultimately generating the characteristic absorption spectrum.
Advanced Applications in Pharmaceutical Research and Development
The precise interplay between sophisticated light sources and sensitive detectors enables a wide range of advanced applications in pharmaceutical research and development. These components are particularly crucial for meeting the increasingly stringent quality control standards in pharmaceutical manufacturing, where real-time monitoring and precise quantification are mandatory [14].
In-line UV-Vis spectroscopy has emerged as a powerful process analytical technology (PAT) for the pharmaceutical industry, allowing for real-time monitoring of critical process parameters without the need for manual sampling or process interruption [14]. For instance, a 2020 innovation demonstrated the development and validation of an online UV-Vis spectroscopy method for quantitative analysis of active pharmaceutical ingredient (API) concentration during continuous manufacturing [14]. This application relies on robust light sources that maintain stable output in production environments and detectors capable of precise, rapid measurements at controlled intervals—some modern systems can perform measurements as frequently as every 10 seconds [14].
The detection of formaldehyde and its analogs represents another application showcasing the sensitivity of modern UV-Vis systems. A 2022 methodology published in the Journal of Hazardous Materials described using O-(carboxymethyl) hydroxylamine as a derivatization agent that reacts with formaldehyde to form an oxime bond with strong UV absorption at 197 nm [15]. The experimental protocol for this sensitive detection method is outlined below:
Table 3: Research Reagent Solutions for Formaldehyde Detection via UV-Vis
| Reagent/Material | Specifications | Function in Experiment |
|---|---|---|
| O-(carboxymethyl) hydroxylamine | C₂H₅NO₃·0.5HCl, 1 mM in aqueous media | Derivatization agent; reacts specifically with aldehydes to form UV-absorbing oxime bonds |
| Formaldehyde standards | 1 μM to 0.2 mM in aqueous solution | Calibration and quantitative analysis; establishes linear range (1 μM to 0.2 mM) |
| Quartz cuvettes | 1 cm path length, high UV transparency | Sample holder; ensures minimal UV absorption by cell itself |
| UV-Vis Spectrophotometer | Equipped with deuterium lamp and photomultiplier tube (PMT) detection | Measurement system; provides high sensitivity in low UV range (197 nm) |
The methodology achieved an impressive detection limit of 0.03 ppm for formaldehyde, surpassing or comparable with many existing methods while offering advantages in simplicity, cost-effectiveness, and avoidance of secondary pollution [15]. This application exemplifies how advances in both source stability (particularly at lower UV wavelengths around 200 nm) and detector sensitivity enable the solution of challenging analytical problems with practical significance for environmental safety and public health.
Further expanding the utility of UV-Vis spectroscopy, recent innovations have integrated machine learning approaches with spectral analysis. A 2024 development introduced a molecular-feature-based machine learning model (ABOCH algorithm) that uses random forest regression to predict the UV-Vis absorption spectra of volatile compounds, achieving a prediction accuracy (R²) of 0.715 [14]. Such advancements demonstrate how the fundamental data generated by source-detector systems can be enhanced through computational approaches to provide even greater analytical insights.
Future Trends and Technological Advancements
The evolution of UV-Vis spectrometer components continues to drive the technique's capabilities and applications. Several emerging trends are particularly noteworthy for research scientists and drug development professionals.
Market analysis indicates sustained growth in the UV-Vis spectroscopy market, which was valued at approximately $1.6 billion in 2025 and is projected to reach $3.1 billion by 2035, growing at a compound annual growth rate (CAGR) of 7% [14]. This growth is fueled by several factors, including the expanding patient population requiring continuous pharmaceutical treatments, increasingly stringent quality control requirements in pharmaceutical manufacturing, and substantial investments in research and development [14].
Detector technology continues to advance, with developments focused on higher sensitivity, faster response times, and improved signal-to-noise ratios. The pharmaceutical industry's adoption of Industry 4.0 principles is driving demand for detectors that can interface seamlessly with digital systems for real-time process monitoring and control [14]. These "smart detectors" are becoming integral components in automated quality assurance systems, capable of performing continuous measurements without manual intervention.
Similarly, light source technology is evolving, with LEDs becoming increasingly prevalent in specialized applications due to their long lifetimes, low power requirements, and instant-on capability [11]. While currently limited in spectral breadth compared to traditional broadband sources, advances in LED technology are expanding their usable range, particularly for portable and dedicated analyzer applications where specific wavelength regions are targeted.
The integration of UV-Vis spectroscopy with other analytical techniques represents another significant trend. A 2025 innovation demonstrated a high-temperature modular optical cell that combined UV-Vis spectroscopy with laser-induced breakdown spectroscopy (LIBS), enabling gas phase monitoring at temperatures up to 450°C [14]. Such hybrid approaches leverage the complementary strengths of different techniques while sharing common optical components, including sources and detectors.
These technological advancements, combined with growing regulatory acceptance and the technique's inherent versatility, ensure that UV-Vis spectroscopy will remain an essential tool in the researcher's arsenal, with source and detector technology continuing to be at the forefront of the technique's ongoing development.
In the realm of analytical instrumentation, particularly ultraviolet-visible (UV-Vis) spectroscopy and High-Performance Liquid Chromatography (HPLC), light sources are critical components that define the capabilities and limitations of the system. These technologies convert electrical energy into electromagnetic radiation, enabling scientists to probe the molecular composition of samples by analyzing how they absorb light. Among the most prevalent sources are deuterium, tungsten-halogen, and xenon lamps, each possessing unique spectral characteristics and operational principles. The selection of an appropriate lamp is a strategic decision that directly influences the sensitivity, accuracy, and scope of analytical methods in fields ranging from pharmaceutical quality control to academic research.
This guide provides an in-depth examination of these three core light source technologies. Understanding their distinct emission profiles, inherent stability, lifetime considerations, and application-specific advantages is fundamental for researchers and drug development professionals who rely on precise and reliable spectroscopic data. This knowledge forms the foundation of a broader overview of UV-Vis and detector technology, ensuring that the illumination source is optimally matched to the analytical task.
Fundamental Principles of UV-Vis Spectroscopy
Ultraviolet-visible (UV-Vis) spectroscopy is a cornerstone analytical technique that measures the amount of discrete wavelengths of UV or visible light absorbed by or transmitted through a sample. The fundamental principle hinges on the interaction between light and matter: molecules can absorb light energy, promoting their electrons to higher energy states. The specific amount of energy required for this transition is characteristic of the molecular structure, leading to absorption at particular wavelengths. This provides a fingerprint for identifying substances and, via the Beer-Lambert Law, quantifying their concentration in a solution [10].
A UV-Vis spectrophotometer operates by guiding light from a source through a wavelength selector, through the sample, and onto a detector. The light source must provide a steady emission across a wide range of wavelengths. Instruments often employ a combination of lamps—such as a deuterium lamp for UV and a tungsten-halogen lamp for visible light—to cover the entire spectrum from approximately 190 nm to 1100 nm. The wavelength selector, typically a monochromator containing a diffraction grating with a groove frequency of 1200 grooves per mm or higher, isolates specific wavelengths for sample examination. After passing through the sample, the light is captured by a detector, such as a photomultiplier tube (PMT) or a photodiode, which converts the light intensity into an electronic signal for analysis [10]. The following diagram illustrates the core workflow of a UV-Vis spectrophotometer.
Deuterium Lamps (D₂ Lamps)
Deuterium lamps are a type of arc discharge lamp specifically engineered to provide a continuous and stable spectrum in the ultraviolet region. The lamp is filled with deuterium gas, and light is generated by creating an electric arc through the ionized gas. Unlike a typical light bulb, the filament (a heated cathode) is primarily used to initiate and maintain the arc discharge, which is the true source of illumination. This process emits light directionally from one side of the lamp [16]. Deuterium lamps are renowned for their high stability and low fluctuation, with some models achieving peak-to-peak noise levels as low as 0.005% [17].
The primary application of deuterium lamps is in UV-Vis spectrophotometry and HPLC-UV detection for absorption measurements in the UV range. Their stable output in this critical region makes them indispensable for high-precision analytical work. Key operational considerations include a required warm-up time to ensure a reliable arc and the need for a stable, complex power supply to maintain constant current [16]. The average operational lifespan of a deuterium lamp is approximately 2000 hours, but this can be significantly reduced by frequent ignition or continuous operation. Best practices involve turning the lamp off during extended idle periods but avoiding repeatedly switching it on and off in short intervals [16].
Tungsten-Halogen Lamps
Tungsten-halogen lamps are advanced incandescent sources that produce light by heating a tungsten filament to extremely high temperatures. Their key differentiator is the halogen regenerative cycle. Within a quartz envelope filled with an inert gas and a small amount of a halogen (e.g., hydrogen bromide), evaporated tungsten from the filament reacts with the halogen to form a gaseous compound. Thermal convection currents carry this compound back to the hot filament, where it dissociates and re-deposits tungsten. This cycle prevents the tungsten from blackening the envelope and allows the filament to operate at higher temperatures, resulting in a brighter light and a longer, more stable operational life compared to standard incandescent lamps [18].
These lamps are characterized by a continuous spectral output that spans the visible and near-infrared regions, with the majority of emitted energy being in the infrared as heat. They are the illumination source of choice for visible light measurements in spectroscopy and are also widely used in microscopy [16] [18]. A typical tungsten-halogen lamp for spectroscopy has a wavelength range of 320–1100 nm to 360–2700 nm, depending on the model [16] [19]. The average lifespan is around 1000 hours [19]. The following diagram illustrates the critical halogen regenerative cycle that defines this technology.
Xenon Lamps
Xenon lamps are high-intensity arc lamps that generate light by passing an electric current between two electrodes in a xenon gas-filled quartz envelope. These lamps produce a broad, continuous spectrum that covers the ultraviolet, visible, and infrared regions, effectively mimicking sunlight. A key characteristic of their output is the presence of sharp, high-intensity spectral lines superimposed on the continuous background, particularly in the 850–900 nm region [17] [20]. Xenon lamps have a high color temperature, typically around 5800 K, which contributes to their sun-like quality [20].
Due to their high intensity and broad spectrum, xenon lamps are suited for demanding applications such as fluorescence, absorbance spectral scanning, and solar simulation [21] [17]. A significant consideration is their output fluctuation, which can be around 1% peak-to-peak, making them less stable than deuterium lamps for precise UV measurements [17]. Furthermore, the intense UV emission below 242 nm can produce toxic ozone, requiring ventilation or the use of specially coated "ozone-free" lamps if deep UV is not needed [21]. The average lifespan of a 150 W xenon short-arc lamp is about 2000 hours [20].
Comparative Technical Analysis
Spectral Range and Performance
The core distinction between deuterium, tungsten-halogen, and xenon lamps lies in their spectral emission profiles, which directly dictate their application domains. The following table provides a structured comparison of their key quantitative and operational characteristics for easy reference.
Table 1: Comparative Technical Specifications of Deuterium, Tungsten-Halogen, and Xenon Lamps
| Parameter | Deuterium Lamp | Tungsten-Halogen Lamp | Xenon Arc Lamp |
|---|---|---|---|
| Wavelength Range | 165–400 nm (stable: 190–370 nm) [16] [17] | 320–1100 nm to 360–3800 nm [16] [19] | 185–2000 nm (typical: 240–2400 nm) [17] [20] |
| Spectrum Covered | Ultraviolet (UV) [16] | Visible (VIS) & Near-Infrared (NIR) [16] [18] | UV, VIS, & Infrared (IR) [17] |
| Output Stability (Peak-Peak) | ~0.005% [17] | ~0.05% (with stabilization) [19] | ~1% [17] |
| Average Lifespan | ~2000 hours [16] | ~1000 hours [19] | 750–2000 hours [21] [20] |
| Key Strengths | Excellent UV stability, continuous UV spectrum [16] [17] | Continuous VIS-NIR spectrum, cost-effective, robust [16] [18] | High-intensity, broad spectrum, sun-like [21] [17] |
| Common Applications | UV spectroscopy, HPLC, AAS [16] [17] | VIS spectroscopy, microscopy, routine QC [16] [18] | Fluorescence, solar simulation, wafer inspection [21] [17] |
Selection Guidelines for Specific Applications
Choosing the correct light source is paramount for method performance. The following guidelines aid in this selection:
- For Exclusive UV Absorption Measurements: A deuterium lamp is the preferred choice due to its superior stability and continuous output in the 190–370 nm range, which is critical for precise absorbance measurements in HPLC and UV spectroscopy [16].
- For Visible & NIR Absorption Measurements: A tungsten-halogen lamp is ideal. Its strong, continuous output across the visible and into the near-infrared makes it perfect for colorimetric analysis and routine quality control where UV stability is not a concern [16] [10].
- For Full-Spectrum Scanning & Demanding Applications: A xenon lamp is suitable when a single, high-intensity source is needed to cover a very broad range from UV to IR, such as in fluorescence spectroscopy or rapid scanning spectrophotometers [10] [17].
- Combined UV-Vis Systems: Many spectrophotometers use both a deuterium and a tungsten-halogen lamp together. This combination covers the entire UV-Vis range (e.g., ~190–1100 nm) by leveraging the strengths of each source, with an automated switchover typically occurring around 300–350 nm [16] [10].
The schematic below provides a logical workflow for selecting the most appropriate lamp technology based on primary application requirements.
Implementation in HPLC and Drug Development
In High-Performance Liquid Chromatography (HPLC), detectors function as the "eyes" of the system, and the light source is a fundamental component of optical detectors. The strategic choice of detector and its corresponding lamp directly impacts the sensitivity, selectivity, and regulatory compliance of analytical methods in pharmaceutical development [22].
UV-Vis and PDA Detectors are the most commonly used in pharmaceutical laboratories. These detectors measure the absorption of light by compounds as they elute from the chromatographic column. The concentration of the analyte is quantified based on the amount of light absorbed, following the Beer-Lambert Law [16] [22]. Within these detectors, the combination of deuterium and tungsten-halogen lamps enables the coverage of both UV and visible wavelengths, allowing for the analysis of a wide array of compounds with different chromophores [16]. The Photodiode Array (PDA) detector, which captures absorbance data across multiple wavelengths simultaneously, particularly benefits from a stable, broadband light source for advanced applications like peak purity assessment and impurity profiling [22].
Table 2: HPLC Detector Technologies and Light Source Implications
| Detector Type | Sensitivity | Selectivity | Role of Light Source | Typical Use Case in Pharma |
|---|---|---|---|---|
| UV-Vis [22] | Moderate | Moderate | Provides specific wavelength for absorption measurement; D2 & Tungsten combo covers UV-Vis. | Routine quality control of active ingredients. |
| PDA [22] | Moderate | High | Provides broad spectrum for simultaneous multi-wavelength capture; enables spectral fingerprinting. | Method development, impurity analysis. |
| Fluorescence [22] | High | Very High | Provides high-intensity excitation wavelength (often xenon lamp). | Bioanalysis, trace-level impurity detection. |
| Refractive Index (RID) [22] | Low | Low | Does not use a light source for absorption. Universal detector. | Analysis of sugars, polymers, non-UV absorbing compounds. |
The Scientist's Toolkit: Essential Research Reagents and Materials
The following table details key materials and reagents essential for working with and maintaining these light source technologies in a research setting.
Table 3: Essential Materials and Reagents for Light Source Operation and Maintenance
| Item | Function/Description | Application Context |
|---|---|---|
| Quartz Cuvettes [10] | Sample holders transparent to UV light (down to ~190 nm). Standard path length is 1 cm. | UV Spectroscopy: Essential for accurate UV absorption measurements, as glass and plastic absorb UV light. |
| UV Protective Eyewear [21] | Safety goggles designed to block ultraviolet radiation. | General Safety: Mandatory when operating UV-emitting lamps (Deuterium, Xenon) to protect eyes from damage. |
| Lint-Free Cloths & Alcohol [19] [20] | For cleaning optical components without scratching or leaving residue. | Lamp Maintenance: Critical for cleaning lamp envelopes. Dust and grease can cause hot spots and lamp failure. |
| Powder-Free Gloves [19] [20] | To handle lamps without depositing skin oils on the quartz envelope. | Lamp Handling: Prevents contamination during installation/replacement of all lamp types. |
| Stable Power Supply [16] | Provides constant current and voltage to the lamp for stable output. | System Operation: Especially critical for deuterium and xenon arc lamps to maintain arc discharge and spectral stability. |
| Liquid Light Guide [19] [20] | A flexible guide that transports light from the source to the sample using a liquid core. | Light Delivery: Useful for directing high-power light (e.g., from tungsten-halogen or xenon sources) to remote samples. |
Emerging Trends and Innovations
The field of light source technology continues to evolve, with trends focusing on increasing stability, longevity, and integration with data systems. Key developments include:
- Advanced Halogen Mixtures: Research into new fill gas and halogen mixtures for tungsten-halogen lamps aims to further improve life span and shift emission profiles for greater visible light output [18].
- Intelligent Systems: The integration of AI and machine learning for spectroscopic data interpretation is becoming more prevalent, supporting faster impurity profiling and predictive quality control, which relies on stable, high-quality light source data [22].
- Automation and Data Integrity: Stronger connections between HPLC systems and Laboratory Information Management Systems (LIMS) drive automation and ensure audit-ready data, making the consistent performance of light sources even more critical [22].
Deuterium, tungsten-halogen, and xenon lamps are foundational technologies in modern analytical science, each occupying a distinct and critical niche. Deuterium lamps offer unmatched stability in the ultraviolet region, tungsten-halogen lamps provide reliable and cost-effective coverage of the visible and near-infrared spectrum, and xenon lamps deliver high-intensity, broad-spectrum illumination for specialized applications. The strategic selection of a light source, based on a thorough understanding of its spectral output, stability, and operational requirements, is a decisive factor in developing robust, sensitive, and compliant analytical methods for drug development and quality control. As detection technologies advance, the synergistic use of these traditional light sources with new computational tools will continue to empower scientists in the pursuit of precise and reliable chemical analysis.
In the realm of ultraviolet-visible (UV-Vis) spectroscopy, the detector plays a pivotal role, serving as the critical component that converts a light signal into a quantifiable electrical output. The evolution from photomultiplier tubes (PMTs) to photodiode arrays (PDAs) represents a significant technological shift, each offering distinct advantages tailored to the demanding needs of modern laboratories. For researchers, scientists, and drug development professionals, the choice of detector directly impacts key performance metrics, including sensitivity, speed, and the ability to deconvolute complex samples. This guide provides an in-depth technical examination of these core detector technologies, framing them within the broader context of UV-Vis light sources and detection systems to inform instrument selection and methodological design.
The fundamental principle underlying all UV-Vis detectors is the conversion of light energy into an electrical current. When photons strike the detector's active material, they transfer their energy, liberating electrons and generating a measurable signal proportional to the light's intensity [10]. This signal, after processing, produces the absorbance or transmittance spectra used for qualitative and quantitative analysis. The specific mechanism of this conversion and the subsequent amplification of the signal are where PMT and PDA technologies fundamentally diverge, leading to their unique performance characteristics and ideal application spaces.
Photomultiplier Tube (PMT) Technology
Operating Principle and Structure
The photomultiplier tube is a highly sensitive vacuum tube detector that excels in measuring low-intensity light. Its operation is based on a combination of the photoelectric effect and secondary emission [23]. The process begins when incident photons strike a photocathode material, which is typically a thin, vapor-deposited conducting layer on the inside of the device's entry window. Upon absorbing a photon, the photocathode ejects a primary electron via the photoelectric effect [10] [23].
These primary electrons are then focused and accelerated by an electric field towards a series of electrodes known as dynodes. Each dynode is held at a successively more positive potential (approximately 100 volts higher than the last). When a primary electron strikes the first dynode, its kinetic energy causes the emission of several secondary electrons. This electron cascade is repeated at each subsequent dynode, resulting in a geometric multiplication of the signal. A typical PMT with 10-12 dynode stages can achieve amplification factors as high as 100 million (10⁸), enabling the detection of single photons [23]. The final, greatly multiplied swarm of electrons is collected at the anode, producing a sharp, easily measurable current pulse.
Key Performance Characteristics
The unique design of the PMT grants it several notable performance characteristics:
- Extremely High Sensitivity and Low Noise: The multi-stage amplification process allows PMTs to detect extremely low light levels, making them ideal for applications like low-light-level spectroscopy and fluorescence spectroscopy [23].
- Fast Response Time: PMTs have ultra-fast response characteristics, making them suitable for time-resolved measurements and high-frequency applications [23].
- Large Area of Collection: This feature, combined with high gain, makes PMTs essential in applications requiring the detection of imperfectly collimated light [23].
However, PMTs are also susceptible to damage if exposed to high-intensity light and generally require high operating voltages (on the order of 1000 V) [24] [23].
Photodiode Array (PDA) Technology
Operating Principle and Structure
The photodiode array detector represents a solid-state approach to light detection. A PDA is a multichannel detector consisting of a linear array of hundreds to thousands of individual light-sensing silicon photodiodes—typically ranging from 128 to 1024, and even up to 4096—fabricated on a single silicon chip [25] [24]. Each diode acts as an independent detector for a specific wavelength.
A key differentiator of PDA-based spectrophotometers is their reverse optics design. In this configuration, polychromatic (white) light first passes through the sample. The transmitted light is then dispersed into its constituent wavelengths by a fixed diffraction grating before being projected simultaneously onto the entire photodiode array [25] [26]. Each diode measures the intensity of a specific, narrow band of wavelengths concurrently. This allows the entire spectrum to be captured in under one second, as there is no need for a mechanical scanning mechanism to cycle through wavelengths [27].
Key Performance Characteristics
The solid-state, multi-channel design of PDAs confers distinct advantages:
- Simultaneous Multi-Wavelength Acquisition: The ability to measure all wavelengths at once drastically reduces analysis time and is ideal for monitoring reaction kinetics and capturing transient intermediates [26].
- High Ruggedness and Reliability: With no moving parts, PDAs are less prone to misalignment and mechanical wear. This makes them robust and lowers maintenance requirements, allowing them to be moved between laboratories without recalibration [27] [26].
- Minimal Stray Light and Wavelength Precision: The reverse optics design minimizes stray light. Furthermore, because data is acquired at all wavelengths simultaneously without moving the grating, there is high wavelength precision and repeatability [26].
- Dynamic Range and Speed: While traditionally less sensitive than PMTs, PDAs offer sufficient sensitivity for a wide range of applications and provide unparalleled speed for capturing full spectra [27].
Comparative Analysis: PMT vs. PDA Detectors
The choice between a PMT and a PDA detector is application-dependent. The table below summarizes their core technical differences to guide this decision.
Table 1: Technical Comparison of PMT and PDA Detectors
| Feature | Photomultiplier Tube (PMT) | Photodiode Array (PDA) |
|---|---|---|
| Basic Principle | Photoelectric effect & secondary emission [23] | Semiconductor photon absorption [24] |
| Optical Design | Scanning (sample after monochromator) | Reverse optics (sample before polychromator) [26] |
| Sensitivity | Extremely high (single-photon detection) [23] | High, but generally lower than PMT [24] |
| Signal-to-Noise | Very high, due to internal gain | Good; can be improved by time-averaging [26] |
| Spectral Acquisition | Sequential (one wavelength at a time) | Simultaneous (all wavelengths at once) [26] |
| Acquisition Speed | Slower (limited by mechanical scanning) | Very fast (full spectrum in <1 second) [27] |
| Ruggedness | Moderate (vacuum tube, sensitive to overload) | High (solid-state, no moving parts) [27] [26] |
| Stray Light | More susceptible | Minimal due to reverse optics [26] |
| Key Advantage | Superior sensitivity for low-light applications | Speed and simultaneous wavelength detection |
Visualizing the Optical Pathways
The fundamental difference in how these detectors acquire a spectrum is best understood through their instrument geometries. The following diagrams illustrate the distinct optical paths of conventional PMT-based and PDA-based spectrophotometers.
Experimental Protocols and Applications
The selection of a detector is ultimately dictated by the requirements of the experimental protocol. The following section details methodologies where the choice of detector is critical to success, particularly in a pharmaceutical development context.
Protocol 1: Dissolution Testing of Solid Dosage Forms (PDA Application)
Dissolution testing is a critical quality control (QC) procedure for solid oral dosage forms (e.g., tablets, capsules) to ensure the drug dissolves appropriately [27].
- Objective: To measure the rate and extent of active pharmaceutical ingredient (API) release from a solid dosage form under standardized conditions.
- Detector Rationale: In high-volume QC laboratories, a single PDA instrument can analyze samples from multiple dissolution vessels rapidly. The speed of capturing the full UV-Vis spectrum simultaneously allows for efficient testing of a large number of samples without sacrificing data quality [27].
- Methodology:
- Apparatus Setup: Use a USP-compliant dissolution apparatus (basket or paddle type) filled with a suitable dissolution medium (e.g., buffer at pH 1.2-6.8) maintained at 37±0.5°C.
- Sample Introduction: Place the tablet or capsule into the vessel and start the apparatus at a specified rotational speed (e.g., 50-75 rpm).
- Automated Sampling: At predetermined time points (e.g., 10, 20, 30, 45, 60 minutes), an autosampler withdraws an aliquot from each vessel and transfers it to the flow-through cell of the PDA spectrophotometer.
- Spectral Acquisition: The PDA captures the full UV-Vis spectrum (e.g., 190-400 nm) of each sample in under a second. This allows for the verification of the API's identity based on its spectral profile and the quantification of its concentration using Beer-Lambert's law at the wavelength of maximum absorbance (λmax) [27] [10].
- Data Analysis: Software calculates the cumulative percentage of API dissolved at each time point, generating a dissolution profile for comparison with regulatory specifications.
Protocol 2: High-Sensitivity Quantification of Nucleic Acids (PMT Application)
Accurately quantifying low-concentration nucleic acid samples (DNA/RNA) is essential in molecular biology and biopharmaceutical research.
- Objective: To determine the concentration and purity of nucleic acid samples with high accuracy, especially when sample volume is limited.
- Detector Rationale: The extreme sensitivity of the PMT makes it ideal for measuring the low signal from highly diluted or micro-volume samples, a common scenario in nucleic acid work [27] [10].
- Methodology:
- Sample Preparation: Dilute the nucleic acid sample in the same buffer as the blank (e.g., TE buffer or nuclease-free water). For micro-volume systems, 1-2 µL of sample is directly pipetted onto the measurement surface [28].
- Blank Measurement: The instrument first measures the blank to establish a baseline.
- Spectrum Scanning: The PMT-based spectrophotometer sequentially scans across a wavelength range, typically 220-350 nm. The high gain of the PMT allows for precise measurement of the weak absorbance signals.
- Concentration & Purity Calculation:
- DNA Concentration: Calculated from the absorbance at 260 nm (A₂₆₀), where one A₂₆₀ unit corresponds to 50 µg/mL for double-stranded DNA.
- Purity Assessment: The ratios A₂₆₀/A₂₈₀ and A₂₆₀/A₂₃₀ are calculated. Pure DNA typically has an A₂₆₀/A₂₈₀ ratio of ~1.8 and an A₂₆₀/A₂₃₀ ratio >2.0. Deviations indicate contamination from protein or chaotropic salts, respectively [10].
Protocol 3: HPLC-Peak Purity and Deconvolution Analysis (PDA Application)
In High-Performance Liquid Chromatography (HPLC), a PDA detector provides an additional dimension of information beyond simple retention time, which is crucial for method development and impurity profiling in drug analysis [29].
- Objective: To confirm the identity of a chromatographic peak and assess its purity by verifying the homogeneity of its UV-Vis spectrum across the peak.
- Detector Rationale: The PDA's ability to collect the full spectrum in real-time for every data point in the chromatogram is indispensable. It enables spectral comparison for identity confirmation and software-based deconvolution of co-eluting peaks [29].
- Methodology:
- Chromatographic Separation: The sample mixture is separated using a suitable HPLC column and mobile phase gradient.
- On-the-Fly Spectral Acquisition: As each compound elutes from the column and passes through the HPLC-PDA flow cell, the detector captures its full UV-Vis spectrum (e.g., 190-800 nm) at a high frequency (e.g., 10-50 points per second).
- Peak Purity Analysis:
- The software compares the spectra from the upslope, apex, and downslope of the chromatographic peak.
- A peak purity index is generated. A high similarity between all spectra indicates a pure peak, while spectral differences suggest a co-eluting impurity [29].
- Peak Deconvolution (i-PDeA):
- For partially resolved or co-eluting peaks, the different spectral profiles of the components are used by advanced algorithms (e.g., Shimadzu's i-PDeA) to mathematically resolve the overlapping peaks.
- The technique relies on the fact that each compound has a unique absorbance spectrum, which serves as a fingerprint for deconvolution and individual quantification [29].
Table 2: Essential Research Reagent Solutions for Featured Protocols
| Reagent/Material | Function | Example Protocol |
|---|---|---|
| Phosphate Buffered Saline (PBS) | Dissolution medium; provides physiological ionic strength and pH for dissolution testing. | Dissolution Testing (5.1) |
| TE Buffer (Tris-EDTA) | Protects nucleic acids from degradation; standard diluent for accurate UV quantitation. | Nucleic Acid Quantification (5.2) |
| HPLC-Grade Solvents (e.g., Acetonitrile, Water) | Mobile phase components; high purity is critical to minimize baseline noise and ghost peaks. | HPLC-Peak Purity (5.3) |
| Nucleic Acid (DNA/RNA) Standard | Calibrant for verifying instrument response and accuracy of quantification measurements. | Nucleic Acid Quantification (5.2) |
| Certified Reference Material (CRM) | Pure API standard for constructing a calibration curve in dissolution method validation. | Dissolution Testing (5.1) |
The landscape of UV-Vis detection is characterized by two powerful technologies: the photomultiplier tube and the photodiode array. The PMT remains the undisputed champion for applications demanding the ultimate in sensitivity, such as detecting single photons or analyzing extremely dilute and micro-volume samples. Conversely, the PDA offers transformative advantages in speed, ruggedness, and simultaneous multi-wavelength data acquisition, making it a workhorse for high-throughput QC, kinetic studies, and hyphenated techniques like HPLC.
For the drug development professional, this choice is not merely technical but strategic. The trend is moving towards the integration of these technologies with artificial intelligence for enhanced data processing and the proliferation of miniaturized, portable systems for on-site analysis [8]. Understanding the core principles, strengths, and limitations of PMT and PDA detectors, as outlined in this guide, empowers scientists to make informed decisions that optimize analytical workflows, ensure data integrity, and ultimately accelerate the path from research to therapeutic product.
Ultraviolet-Visible (UV-Vis) spectrophotometry is a cornerstone analytical technique in scientific research and industrial laboratories, enabling the quantitative and qualitative analysis of substances by measuring their absorption of light. The core principle involves passing a beam of light through a sample and detecting the intensity of the transmitted light to determine absorbance, which relates to the sample's concentration and molecular structure [10]. Within this domain, the instrument's internal optical design—specifically, whether it is based on a single-beam or a double-beam configuration—is a critical determinant of its analytical performance, particularly concerning stability and accuracy [30]. This guide provides an in-depth technical comparison of these two designs, framing the discussion within the broader context of UV-Vis light source and detector technology. It is tailored for researchers, scientists, and drug development professionals who require a detailed understanding of these instruments to make informed decisions that ensure data integrity in critical applications such as pharmaceutical quality control and biochemical research [30] [9].
Fundamental Operational Principles
Single-Beam Spectrophotometer Design and Workflow
A single-beam spectrophotometer operates on a fundamentally simple optical principle: a single beam of light travels along one path from the source to the detector. The light source, which can be a tungsten, halogen, or xenon lamp, emits broadband light [10] [30]. This light is then passed through a monochromator, a key component typically based on a diffraction grating, which selects a specific, narrow wavelength band to illuminate the sample [10] [31]. The quasi-monochromatic light passes through the sample contained in a cuvette, and a detector, such as a photomultiplier tube (PMT) or photodiode, measures the intensity of the transmitted light [10].
The operational workflow for obtaining an absorbance measurement is sequential. First, the instrument must be zeroed or calibrated using a blank solution (typically the pure solvent) placed in the cuvette. This measures the reference intensity ((I0)). The blank is then manually replaced with the sample solution, and the intensity after passing through the sample ((I)) is measured. The absorbance (A) is calculated using the formula (A = \log{10}(I_0/I)) [30] [32]. This design's simplicity is its primary advantage, but the necessity for manual switching between reference and sample makes the measurement susceptible to fluctuations in the light source intensity and electronic drift between the two sequential measurements [30] [31].
Dual-Beam Spectrophotometer Design and Workflow
The dual-beam spectrophotometer addresses the inherent stability challenges of the single-beam design by incorporating a mechanism to simultaneously measure the sample and reference. In this configuration, the light beam exiting the monochromator is split into two separate, identical beams: the sample beam and the reference beam [30] [33].
This beam splitting is commonly achieved using a beam splitter or a rotating chopper that alternately directs light through the two paths at a high frequency [30] [31]. One beam passes through the sample cuvette, while the other passes through a reference cuvette containing the blank solvent. The two beams are then recombined and directed onto a single detector, or they are measured by two matched detectors. The instrument's microprocessor continuously calculates the ratio of the two intensities ((I{sample}) and (I{reference})), providing a real-time absorbance value (A = \log{10}(I{reference}/I_{sample})) [30] [31]. This ratiometric measurement is the key to the dual-beam instrument's enhanced stability, as any fluctuation in the light source intensity or detector sensitivity affects both beams equally and is therefore canceled out in the calculated absorbance ratio [30] [33].
The following diagram illustrates the core optical pathways and components of both systems, highlighting the key difference in their approaches to measurement.
Performance Comparison: Stability, Accuracy, and Application Suitability
The fundamental architectural differences between single-beam and dual-beam spectrophotometers lead directly to divergent performance characteristics in stability, accuracy, and suitability for specific laboratory applications. The following table provides a structured, quantitative comparison of these critical parameters.
Table 1: Comparative Analysis of Single-Beam vs. Dual-Beam Spectrophotometer Performance
| Performance Parameter | Single-Beam Spectrophotometer | Dual-Beam Spectrophotometer |
|---|---|---|
| Optical Path Design | Single light path through monochromator, sample, and detector [30]. | Single beam split into reference and sample beams; measured simultaneously [30]. |
| Measurement Principle | Sequential measurement of blank ((I0)) and sample ((I)); (A = \log{10}(I_0/I)) [30] [32]. | Simultaneous ratiometric measurement; (A = \log{10}(I{reference}/I_{sample})) [30]. |
| Compensation for Source Fluctuations | No; intensity fluctuations directly impact measured absorbance, adding noise [30]. | Yes; self-compensating. Intensity changes affect both beams equally, canceling out [30] [31]. |
| Baseline Stability | Subject to drift due to environment and instrument aging, affecting accuracy over time [30]. | High; baseline drift affects both beams proportionately, minimizing its influence [30] [33]. |
| Typical Analytical Accuracy | Limited, especially at high/low absorbance where noise and drift have greater impact [30]. | Superior; accuracy remains relatively constant across a wider absorbance range [30] [33]. |
| Typical Precision | Lower due to uncompensated baseline drift and source noise [30]. | Significantly higher due to reduced drift and ratiometric measurement [30]. |
| Dynamic Range | Limited, can lead to truncated spectra at high/low absorbance [30]. | Wider, allowing accurate analysis of samples with very high or low absorbance [30]. |
| Cost and Complexity | Simpler design, lower initial cost [30] [34]. | More complex design, typically more expensive [30]. |
| Ideal Application Scope | Routine quantitative analyses in stable environments, educational settings, high-throughput screening where cost and simplicity are key [30] [34]. | Research, method development, quality control, kinetic studies, and applications demanding high accuracy and precision [30] [33]. |
Analysis of Stability and Accuracy
The data in Table 1 underscores that the core advantage of the dual-beam design lies in its robust compensation for instrumental instabilities. In a single-beam instrument, any drift in the light source intensity (e.g., due to power fluctuations or lamp warming) or in the detector's response between the blank and sample measurements is misinterpreted as a change in sample absorbance, directly impacting accuracy and precision [30] [31]. This is particularly problematic for long-term studies or when measuring samples with very high or low absorbance, where the signal-to-noise ratio is already challenging [30].
The dual-beam instrument's ability to perform a simultaneous comparison renders it largely immune to these short-term fluctuations. This ratiometric approach provides inherent stability, leading to more reliable and reproducible data, which is non-negotiable in regulated environments like pharmaceutical quality control labs [30] [33]. Furthermore, the continuous baseline monitoring in a dual-beam system allows for more effective correction of background drift over time, ensuring higher photometric accuracy across a wider dynamic range [30].
Essential Methodologies and the Scientist's Toolkit
Experimental Protocol for Instrument Qualification and Verification
To ensure the accuracy of any UV-Vis spectrophotometer, regular performance verification is essential. The following protocol outlines key experiments for qualifying a dual-beam instrument, which can be adapted for single-beam use with additional care to account for drift.
Experiment 1: Wavelength Accuracy Verification
- Objective: To verify that the instrument's wavelength calibration is correct.
- Methodology:
- Use a holmium oxide or didymium glass filter, which has sharp, well-defined absorption peaks at known wavelengths [33].
- Place the filter in the sample compartment and acquire an absorbance spectrum over the appropriate range (e.g., 240-650 nm for holmium oxide).
- Record the wavelength values of the observed absorption peaks.
- Data Analysis: Compare the measured peak wavelengths to the certified values provided with the filter. The deviation should be within the manufacturer's specification (typically ±0.5 nm or better for a research-grade instrument) [33].
Experiment 2: Photometric Accuracy Verification
- Objective: To confirm the accuracy of the absorbance readings.
- Methodology:
- Prepare a solution of potassium dichromate (K₂Cr₂O₇) in dilute sulfuric acid (e.g., 0.001 M) or use a certified neutral density filter [33].
- For the solution, measure the absorbance at specific wavelengths (e.g., 235, 257, 313, and 350 nm) using a matched pair of high-quality quartz cuvettes.
- Ensure the absorbance values are within the linear range of the detector (preferably below 1.0 AU) [10].
- Data Analysis: Compare the measured absorbance values against the known standard values. The tolerance for photometric accuracy is typically within ±0.001 A or as specified by the manufacturer [33].
Experiment 3: Stray Light Detection
- Objective: To determine the level of stray light, which is light of unintended wavelengths reaching the detector and causing inaccurate absorbance readings, particularly at high absorbance.
- Methodology:
- Use a solution that completely absorbs light below a certain wavelength. A common standard for UV stray light is a concentrated potassium chloride (KCl) solution (e.g., 12 g/100 mL) [33].
- Measure the transmittance of this solution at a wavelength where it should be entirely opaque, such as 200 nm.
- Data Analysis: The measured transmittance at 200 nm is reported as the percent stray light. A value below 0.1% T is generally acceptable for a well-maintained instrument. High stray light can lead to a non-linear response at high absorbances and falsely low readings [33].
The Scientist's Toolkit: Key Research Reagent Solutions
The following table details essential consumables and reagents required for the operation, calibration, and maintenance of UV-Vis spectrophotometers.
Table 2: Essential Reagents and Materials for UV-Vis Spectrophotometry
| Item | Function and Application |
|---|---|
| High-Purity Solvents (HPLC Grade) | Used for sample preparation and as blank references. High purity is critical to avoid absorption interferences in the UV range [33]. |
| Matched Quartz Cuvettes | Standard sample holders for UV-Vis analysis. Quartz is transparent down to ~190 nm. Must be "matched" to ensure identical path lengths for accurate quantitative work, especially in dual-beam systems [10] [33]. |
| Holmium Oxide Filter | A solid-state wavelength accuracy standard with sharp absorption peaks. Used for routine verification of the instrument's wavelength calibration [33]. |
| Potassium Dichromate Solution | A primary standard for verifying photometric (absorbance) accuracy. Requires careful preparation and dilution [33]. |
| Potassium Chloride Solution | Used for assessing stray light levels in the UV region, a critical parameter for ensuring accuracy at high absorbance values [33]. |
| Cuvette Cleaning Solutions | Specialized, residue-free solutions (e.g., Hellmanex III) or solvents for cleaning cuvettes to prevent contamination and scratching, which can scatter light and affect results [32]. |
Future Trends: The Impact of Light Source and Detector Technology
The ongoing evolution of UV-Vis spectrophotometry is heavily influenced by advancements in its core components: light sources and detectors. A significant trend is the move toward light-emitting diodes (LEDs) as alternative light sources. UV-LEDs offer advantages such as compact size, high energy efficiency, instant on/off capability, tunable wavelength, and exceptional operational lifetime [35] [36]. Furthermore, global environmental policy, specifically the Minamata Convention on Mercury, is driving the phase-out of traditional mercury lamps, accelerating the adoption of these mercury-free, solid-state light sources [35].
These developments are blurring the traditional single/double-beam paradigm. The stability and long life of LEDs can mitigate one of the key weaknesses of single-beam designs—source fluctuation. This has led to the proliferation of robust, portable, and cost-effective LED-based spectrophotometers suitable for field and point-of-use analysis [36]. Concurrently, improvements in detector technology, such as the use of charge-coupled devices (CCDs), enable non-scanning instruments that capture entire spectra simultaneously [10] [31]. When combined with advanced optical designs, these detectors facilitate new instrument architectures that can offer performance previously associated only with traditional dual-beam systems, but in smaller, more automated, and more connected formats suitable for the modern laboratory [9].
The choice between a single-beam and dual-beam UV-Vis spectrophotometer is a fundamental decision that directly impacts the quality and reliability of analytical data. The single-beam design, with its simplicity and lower cost, is a capable tool for routine, high-throughput, or educational applications where the highest level of stability is not required. In contrast, the dual-beam design, through its ratiometric measurement principle, provides superior stability, accuracy, and precision, making it the instrument of choice for demanding research, method development, and quality control in regulated industries.
Understanding the operational principles, performance trade-offs, and necessary validation protocols detailed in this guide empowers scientists and drug development professionals to select the most appropriate instrument for their specific needs. As technology evolves with the integration of UV-LEDs and advanced detectors, the performance gap may narrow in specific applications, but the underlying principles of stability and accuracy will remain paramount in guiding instrument selection and ensuring data integrity.
Advanced Applications in 2025: From Drug Development to Machine Learning Integration
Ultraviolet-Visible (UV-Vis) spectroscopy stands as a cornerstone analytical technique in pharmaceutical laboratories worldwide, providing the foundational data required for regulatory compliance, quality assurance, and research and development. This technical guide examines the application of UV-Vis spectroscopy, with a specific focus on the critical role of light source and detector technologies, in ensuring drug purity, verifying formulation composition, and confirming accurate dosage. The reliability of pharmaceutical analysis depends fundamentally on the proper selection and understanding of these core instrumental components, which directly influence method sensitivity, accuracy, and reproducibility. The International Council for Harmonisation (ICH) guidelines mandate stringent requirements for pharmaceutical analysis, including sensitivity in the range of 0.05–0.10% for stability-indicating methods, a benchmark readily achievable with modern UV-Vis instrumentation when properly configured [7]. This whitepaper provides drug development professionals with a comprehensive technical resource on leveraging UV-Vis technology to meet these rigorous regulatory standards.
Fundamental Principles of UV-Vis Spectroscopy in Pharmaceuticals
UV-Vis spectroscopy measures the attenuation of light after it passes through a sample solution, quantifying the amount of discrete wavelengths of ultraviolet or visible light absorbed by chromophoric molecules. The fundamental relationship governing this technique is the Beer-Lambert Law:
A = ε × b × c
Where A is the measured absorbance, ε is the molar absorptivity (a compound-specific constant), b is the pathlength of the light through the sample (typically 1 cm), and c is the concentration of the analyte [10]. This linear relationship forms the basis for all quantitative pharmaceutical analysis, from active pharmaceutical ingredient (API) quantification in dosage forms to impurity profiling.
In pharmaceutical applications, molecules containing chromophores—structural moieties that absorb UV or visible light—are particularly amenable to this technique. Most drug substances, containing aromatic rings, conjugated systems, or other light-absorbing functional groups, exhibit characteristic absorption spectra with a λ_max (wavelength of maximum absorbance) that serves as a identifying fingerprint and optimal quantification wavelength [7] [37]. The technique's precision of less than 0.2% relative standard deviation (RSD) makes it indispensable for pharmaceutical quality control, where potency specifications for drug substances typically fall between 98.0% and 102.0% [7].
Critical Instrumentation Components
UV-Vis Light Source Technology
The light source is a fundamental component that dictates the wavelength range and stability of UV-Vis measurements. No single light source optimally covers the entire UV-Vis spectrum, which is why most modern instruments employ source-switching mechanisms or combination systems [38] [10].
Table 1: Comparison of Common Light Sources in UV-Vis Spectrophotometry
| Light Source Type | Spectral Range (nm) | Key Characteristics | Pharmaceutical Application Fit | Typical Lifetime (Hours) |
|---|---|---|---|---|
| Deuterium Lamp | 190 – 400 [38] | Continuous UV spectrum, requires 10-20 sec preheating [39] | API quantification at UV wavelengths, impurity profiling | ~1,000 [39] |
| Tungsten-Halogen Lamp | 350 – 3500 [38] | Stable, long-life, bright in visible/NIR [38] | Colored formulations, dissolution testing, visible-range assays | ~2,000 [39] |
| Xenon Arc Lamp | 190 – 1100 [39] | High intensity, broad spectrum, similar to sunlight [38] | Rapid scanning, kinetic studies, high-throughput screening | 200-3,000 (varies by design) [39] |
| Xenon Flash Lamp | 190 – 1100 [38] | Pulsed operation, low heat, compact [38] | Portable systems, stability-indicating methods | Longer than continuous arc lamps [39] |
| LEDs | 375 – 1000 (narrow bands) [39] | Long lifetime, energy-efficient, monochromatic [39] | Specific wavelength assays, detector calibration | >10,000 [39] |
Most analytical spectrophotometers for pharmaceutical quality control combine deuterium and tungsten-halogen lamps to cover the full UV-Vis range [10] [40]. The switching between sources typically occurs between 300-350 nm, where their emission intensities are comparable, ensuring a smooth transition [38] [10]. Modern instruments automatically optimize the alignment for both sources during initialization, eliminating the need for manual adjustment after lamp replacement [38].
Detector Technology for Pharmaceutical Applications
The detector converts transmitted light into an electronic signal for data processing. The choice of detector significantly impacts method sensitivity, linear dynamic range, and suitability for specific pharmaceutical applications.
Table 2: UV-Vis Detector Technologies for Pharmaceutical Analysis
| Detector Type | Principle of Operation | Advantages | Limitations | Best Uses in Pharma |
|---|---|---|---|---|
| Photomultiplier Tube (PMT) | Photoelectric effect with electron multiplication [10] | High sensitivity for low-light applications [10] | Larger size, requires high voltage | Trace impurity detection, low-concentration assays |
| Photodiode (e.g., in VWD) | Semiconductor generates current when exposed to light [10] | Robust, compact, low cost | Lower sensitivity than PMT | General QC, high-concentration API quantification |
| Photodiode Array (PDA/DAD) | Multiple diodes (512-1024) capture full spectrum simultaneously [7] [6] | Rapid full-spectrum acquisition, peak purity assessment [7] | Potentially higher noise due to smaller light intensity per diode [6] | Method development, forced degradation studies, identity confirmation |
| Charge-Coupled Device (CCD) | Semiconductor array with high pixel density [37] | High spatial resolution, excellent for spectral imaging | Higher cost, more complex electronics | Advanced research applications, hyperspectral imaging |
The photodiode array detector (PDA or DAD) has become particularly valuable in pharmaceutical analysis due to its ability to capture complete UV-Vis spectra throughout the chromatographic run [7]. This capability enables peak purity assessment by comparing spectra across the peak, a crucial requirement for stability-indicating methods [7]. Modern PDAs have largely addressed earlier limitations related to noise and stability through improved optical designs and electronics [6].
Experimental Protocols for Pharmaceutical Analysis
Drug Purity and Impurity Profiling
Objective: To quantify the main active pharmaceutical ingredient (API) and detect/quantify related substances or impurities in a drug substance.
Methodology:
- Sample Preparation: Accurately weigh the drug substance and dissolve in an appropriate solvent (e.g., pH-buffered mobile phase) to a concentration within the Beer-Lambert linear range (typically yielding absorbance <1.0 AU) [10]. For impurity analysis, prepare separate solutions at appropriate concentrations for both the API (for main component) and diluted solutions (for impurity detection).
- Spectral Scanning: Using a PDA detector or scanning spectrophotometer, acquire the full UV-Vis spectrum (e.g., 200-400 nm) of the API solution to identify λ_max for each analyte [6].
- Method Development:
- For HPLC-UV methods: Optimize chromatographic separation to resolve impurities from the API and from each other.
- Set monitoring wavelength(s) based on spectral data—typically at λ_max of the API for quantification, with additional wavelengths for impurity detection if they have different absorption maxima.
- For purity assessment, use PDA detection to collect full spectra throughout the chromatographic run [7].
- System Suitability: Following pharmacopeial guidelines, establish system suitability criteria including precision (%RSD), tailing factor, and theoretical plates [7].
- Data Analysis:
- Quantify API concentration using a validated calibration curve.
- Calculate impurity percentages by comparing normalized peak areas.
- Perform peak purity assessment by comparing spectra at peak start, apex, and end [7].
Dosage Form Uniformity and Assay
Objective: To verify the labeled claim of drug products and ensure uniformity of dosage units.
Methodology:
- Sample Preparation:
- For tablets/capsules: Accurately weigh and crush not less than 20 units individually (for content uniformity) or composite (for assay).
- Extract the API using appropriate solvent with sonication and filtration as needed.
- Prepare standard solutions of reference standard at known concentration.
- Instrumental Analysis:
- Use a validated UV-Vis method, typically at the λ_max of the API.
- For content uniformity, analyze each unit individually.
- For assay, analyze composite sample against reference standard.
- Quantification:
- Measure absorbance of sample and standard solutions.
- Calculate dosage unit content using the formula: % Label Claim = (Asample/Astandard) × (Cstandard/Clabel) × 100
- For content uniformity, apply pharmacopeial criteria (e.g., USP Chapter <905>).
- Validation Parameters: Demonstrate method specificity, accuracy, precision, linearity, and range according to ICH guidelines.
The Scientist's Toolkit: Essential Research Reagents and Materials
Table 3: Key Reagents and Materials for Pharmaceutical UV-Vis Analysis
| Item | Technical Specification | Pharmaceutical Application |
|---|---|---|
| HPLC-Grade Solvents | Low UV cutoff, high purity, minimal particulate matter | Mobile phase preparation to minimize background absorption [7] |
| Reference Standards | Certified purity, traceable to pharmacopeial standards | Calibration curve establishment, method validation [7] |
| Volumetric Glassware | Class A, certified tolerance | Precise solution preparation for accurate quantification |
| Syringe Filters | 0.45 μm or 0.22 μm, compatible with solvent | Sample clarification before injection [7] |
| UV Cuvettes/Cells | Quartz for UV range, 1 cm pathlength standard | Sample containment with minimal light scattering [10] |
| Buffer Salts | HPLC grade, prepared with high-purity water | Mobile phase modification to control pH and ionic strength [7] |
| Water Purification System | Type I (18.2 MΩ·cm) ultrapure water | Solvent preparation, sample dilution, mobile phase component [9] |
Advanced Applications and Emerging Technologies
Recent developments in UV-Vis instrumentation are creating new opportunities for pharmaceutical analysis. The 2025 Review of Spectroscopic Instrumentation highlights several trends, including the increasing importance of microspectroscopy for analyzing increasingly small samples, such as in drug polymorphism studies or single-particle analysis [9]. New quantum cascade laser (QCL)-based systems like the LUMOS II and Protein Mentor offer enhanced imaging capabilities specifically for protein-containing samples relevant to biopharmaceuticals [9].
The integration of UV detection with other analytical techniques represents another significant advancement. Hyphenated systems such as LC-UV-MS combine the quantitative precision of UV detection with the structural elucidation power of mass spectrometry [37]. Furthermore, solid phase spectroscopy techniques, where analytes are preconcentrated on solid supports before measurement, enhance sensitivity for trace impurity detection [37].
Emerging detector technologies also show promise for pharmaceutical applications. Paired emitter-detector diodes (PEDDs) offer compact, cost-effective detection for specific wavelength applications, while digital image-based colorimetry utilizes smartphone cameras and digital imaging as potential detection systems for field-based or point-of-care quality screening [37].
UV-Vis spectroscopy remains an indispensable analytical technique in pharmaceutical analysis due to its robust quantitative capabilities, regulatory acceptance, and continuous technological evolution. The appropriate selection of light sources—typically deuterium and tungsten-halogen combinations for full spectral coverage—and detectors—with PDA technology enabling sophisticated purity assessment—forms the foundation of reliable methods for drug purity, formulation analysis, and dosage verification. As pharmaceutical compounds become more complex and regulatory requirements more stringent, advances in UV-Vis instrumentation, particularly in microspectroscopy and hyphenated techniques, will continue to provide drug development professionals with the sophisticated tools needed to ensure product quality, safety, and efficacy. The fundamental principles outlined in this technical guide, coupled with emerging technologies, position UV-Vis spectroscopy as a continually evolving cornerstone of pharmaceutical analysis for the foreseeable future.
| Reagent/Instrument | Primary Function | Key Application in Characterization |
|---|---|---|
| UV-Vis Spectrophotometer [41] | Measures light absorption in UV and visible ranges | Quantification of proteins, nucleic acids; purity assessment (A260/A280) |
| Spectrofluorometer [9] | Measures fluorescence emission | Advanced analysis of protein conformation and folding (e.g., FS5 v2) |
| A-TEEM Biopharma Analyzer [9] | Simultaneously collects Absorbance, Transmittance, and Fluorescence EEM | Characterization of monoclonal antibodies and vaccine stability |
| High-Resolution Mass Spectrometer (HRMS) [42] | Precisely determines molecular mass and identifies PTMs | Batch-to-batch consistency analysis; identification of oxidation, deamidation |
| Hydrogen-Deuterium Exchange MS (HDX-MS) [42] | Probes protein structure and dynamics by measuring hydrogen exchange | Analysis of antibody-antigen complexes and conformational dynamics |
| Surface Plasmon Resonance (SPR) [43] | Measures real-time biomolecular interactions without labels | Determination of binding affinity (KD), kinetics (ka, kd), and active concentration |
| Enzyme-Linked Immunosorbent Assay (ELISA) [43] [44] | Detects and quantifies proteins using antibody-antigen binding | Quantification of mAbs and Anti-Drug Antibodies (ADAs) in biological samples |
| Circular Dichroism (CD) Microspectrometer [9] | Measures differential absorption of left- and right-handed circularly polarized light | Assessment of secondary structure and stability of chiral molecules (proteins) |
Quantitative Data for mAb and Vaccine Analysis Techniques
| Analytical Technique | Typical Measured Parameters | Reportable Range & Sensitivity | Key Quantitative Outputs |
|---|---|---|---|
| UV-Vis Spectroscopy [10] | Absorbance at specific wavelengths (e.g., 280 nm) | Concentration range: Varies with path length; Absorbance should generally be <1 for accurate quantitation [10] | Protein concentration (via Beer-Lambert law); Purity ratios (A260/A280) |
| Surface Plasmon Resonance (SPR) [44] | Binding kinetics (association/dissociation) | Infliximab quantification: 0.10 to 8 μg/mL [44] | Equilibrium dissociation constant (KD); Association (ka) and dissociation (kd) rate constants |
| ELISA [44] | Colorimetric signal proportional to target concentration | Rituximab quantification: 5–250 μg/mL [44] | Concentration of mAbs or Anti-Drug Antibodies (ADAs) in serum/sample |
| Liquid Chromatography-Mass Spectrometry (LC-MS) [42] | Mass-to-charge ratio (m/z) of ionized analytes | High sensitivity for low-abundance variants and post-translational modifications [42] | Molecular weight confirmation; Identification and quantification of PTMs (e.g., deamidation, oxidation) |
Experimental Protocols for Key Characterization Assays
Protocol for mAb Concentration and Purity Assessment Using UV-Vis Spectroscopy
This method is used for the rapid quantification of monoclonal antibodies and assessment of sample purity, as commonly applied in quality control and research stages [41].
- Principle: The concentration of protein in a solution is determined by measuring its absorbance at 280 nm, primarily due to its tryptophan and tyrosine content. The ratio of absorbance at 260 nm and 280 nm provides an estimate of nucleic acid contamination [10].
- Materials:
- Procedure:
- Power on the spectrophotometer and allow the lamp to warm up as per manufacturer's instructions.
- Set the instrument to measure absorbance at 280 nm and 260 nm.
- Pipette the appropriate volume of buffer into the quartz cuvette and place it in the sample holder. This is your blank.
- Perform a blank measurement to zero the instrument.
- Replace the buffer with your purified mAb sample. Ensure the sample is free of air bubbles.
- Measure and record the absorbance of the sample at 280 nm (A280) and 260 nm (A260).
- Calculate the mAb concentration using the Beer-Lambert law: Concentration (mg/mL) = (A280 / ε) * Dilution Factor, where ε is the extinction coefficient for the specific antibody. Alternatively, a general factor of 1.4 can be used for a 1 mg/mL IgG solution measured in a 1 cm cuvette, giving: Concentration (mg/mL) ≈ A280 / 1.4.
- Calculate the purity ratio: A260/A280. A ratio of ~0.6 is generally accepted for pure protein, while a higher ratio indicates potential nucleic acid contamination [10].
Protocol for Binding Affinity Determination Using Surface Plasmon Resonance (SPR)
SPR is a powerful label-free technique for characterizing the real-time binding kinetics and affinity of a monoclonal antibody for its antigen, which is critical for understanding its therapeutic potential [43] [44].
- Principle: One interactant (the ligand, e.g., an antigen) is immobilized on a sensor chip. The other (the analyte, e.g., the mAb) flows over the surface. Binding causes a change in the refractive index at the chip surface, measured in Resonance Units (RU), allowing for the calculation of association and dissociation rate constants [44].
- Materials:
- SPR instrument (e.g., Biacore series)
- CMS sensor chip
- Coupling reagents (e.g., EDC/NHS for amine coupling)
- Purified antigen and mAb samples in running buffer
- HBS-EP or similar running buffer
- Regeneration solution (e.g., Glycine-HCl, pH 2.0)
- Procedure:
- System Setup: Prime the instrument with a degassed running buffer.
- Ligand Immobilization:
- Activate the carboxymethylated dextran matrix on the CMS chip with a mixture of EDC and NHS.
- Inject the purified antigen in a sodium acetate buffer (pH ~4.5-5.5) over the activated surface to covalently couple it.
- Deactivate the remaining active esters by injecting ethanolamine.
- A reference flow cell should be activated and deactivated without antigen to serve as a control.
- Kinetic Analysis:
- Dilute the mAb (analyte) to a series of concentrations (e.g., 5 concentrations in a 2- or 3-fold series).
- Inject each mAb concentration over the antigen and reference surfaces at a constant flow rate for a set time (association phase).
- Switch back to running buffer and monitor the dissociation of the complex for a set time (dissociation phase).
- Regenerate the surface with a short pulse of regeneration solution to remove all bound mAb without damaging the immobilized antigen.
- Data Analysis:
- Subtract the reference flow cell sensorgram from the antigen flow cell sensorgram.
- Fit the corrected binding data to a suitable interaction model (e.g., 1:1 Langmuir binding) using the instrument's software.
- The software will report the association rate constant (ka, 1/Ms), the dissociation rate constant (kd, 1/s), and the calculated equilibrium dissociation constant (KD = kd/ka, M).
Protocol for Post-Translational Modification (PTM) Analysis Using High-Resolution Mass Spectrometry (HRMS)
HRMS is essential for identifying and quantifying critical quality attributes of mAbs, such as glycosylation patterns, oxidation, and deamidation, which can affect stability, efficacy, and immunogenicity [44] [42].
- Principle: Intact or enzymatically digested mAbs are ionized and their mass-to-charge ratios are measured with high accuracy. The precise molecular weight reveals the presence and, with digestion, the location of PTMs [42].
- Materials:
- High-Resolution Mass Spectrometer (e.g., Q-TOF or Orbitrap)
- LC system with C4 or C8 reverse-phase column (for intact analysis) or C18 column (for peptide analysis)
- Digestion reagents: Trypsin/Lys-C, reduction agent (e.g., DTT), alkylation agent (e.g., iodoacetamide)
- Mobile phases: Water and acetonitrile with 0.1% formic acid
- Procedure:
- Sample Preparation:
- For Intact Mass Analysis: Desalt the mAb using a spin column or dialysis into a volatile buffer like ammonium bicarbonate. This provides a profile of the main glycoforms and other major variants.
- For Peptide Mapping: Denature, reduce, and alkylate the mAb. Digest the protein overnight with an enzyme like trypsin. This allows for site-specific localization of PTMs.
- LC-MS Analysis:
- Inject the prepared sample onto the LC column.
- Separate the (intact mAb or peptides) using a gradient of increasing organic solvent.
- Eluting species are introduced into the mass spectrometer via an electrospray ionization (ESI) source.
- Data Acquisition and Processing:
- Acquire mass spectra in high-resolution mode.
- For intact analysis, deconvolute the raw m/z spectrum to generate a zero-charge mass spectrum.
- For peptide mapping, use database search software (e.g., Mascot, MaxQuant) to match the acquired tandem MS (MS/MS) spectra to the theoretical digest of the mAb sequence, specifying variable modifications like deamidation (N, Q), oxidation (M), and glycosylation.
- Data Interpretation:
- Compare the observed mass(es) with the theoretical mass of the amino acid sequence.
- Identify mass shifts corresponding to specific modifications (e.g., +1 Da for deamidation, +16 Da for oxidation).
- For peptide mapping, identify the specific peptides and amino acid residues bearing the modifications.
- Sample Preparation:
Characterization Workflow and Technology Integration
UV-Vis Spectrophotometer Components and Data Pathway
Harnessing Machine Learning with UV-Vis for Automated Contamination Detection
Ultraviolet-Visible (UV-Vis) spectroscopy serves as a powerful analytical technique that measures the absorption of light in the ultraviolet and visible regions of the electromagnetic spectrum, typically from 200 to 800 nanometers [45]. This method relies on the principle that molecules containing chromophores—functional groups with conjugated pi-electron systems—can absorb light energy, promoting electrons to higher energy orbitals. The resulting absorption spectrum provides a unique fingerprint that can identify compounds, measure concentrations, and analyze molecular interactions [45] [46]. The integration of machine learning (ML) with UV-Vis spectroscopy represents a transformative advancement in analytical science, particularly for contamination detection in biological manufacturing. This synergy enables the development of automated, real-time monitoring systems that can identify subtle spectral changes indicative of microbial contamination with minimal human intervention [47] [48].
The combination addresses critical limitations in traditional contamination monitoring methods, which often rely on labor-intensive techniques requiring specialized expertise and extended incubation periods [47] [48]. By leveraging ML algorithms to decode the complex spectral signatures captured by UV-Vis instruments, this integrated approach achieves unprecedented speed, accuracy, and automation in contamination detection. This technical guide explores the fundamental principles, methodological frameworks, and practical implementations of this cutting-edge technology within the broader context of UV-Vis light sources and detector systems, providing researchers and drug development professionals with comprehensive insights into its capabilities and applications.
Fundamental Principles of UV-Vis Spectroscopy
Electronic Transitions and Chromophores
UV-Vis spectroscopy operates on the principle of electronic transitions, where molecules absorb photons of specific energies corresponding to the ultraviolet and visible regions of the electromagnetic spectrum. When sample molecules encounter light with energy matching possible electronic transitions, electrons are promoted from ground states to excited states, resulting in characteristic absorption patterns [45]. The probability and intensity of these transitions depend on the molecular structure, particularly the presence of chromophores—light-absorbing groups with conjugated pi-electron systems or heteroatoms containing non-bonding valence-shell electron pairs [45].
Common chromophores include carbon-carbon double bonds, carbonyl groups, and aromatic rings, with their absorption characteristics influenced by the extent of conjugation. Isolated chromophores typically absorb at shorter wavelengths (higher energy), while conjugated systems display absorption at longer wavelengths (lower energy) due to decreased energy separation between molecular orbitals [45]. For instance, while an isolated carbonyl group may absorb at approximately 180-190 nm for the π→π* transition and 290 nm for the n→π* transition, extended conjugation significantly redshifts these absorption maxima while increasing absorption intensity [45]. This relationship between molecular structure and absorption characteristics forms the foundational principle enabling UV-Vis spectroscopy to detect and identify chemical and biological compounds.
Instrumentation Components and Specifications
Modern UV-Vis spectroscopy systems integrate several key components that work in concert to generate precise absorption measurements. The instrumentation typically includes: (1) a stable light source such as deuterium or xenon arc lamps for the UV region and tungsten-halogen lamps for the visible region; (2) a monochromator or optical filters to select specific wavelengths; (3) a sample holder or cuvette; (4) a detector such as photodiode arrays (PDA), charge-coupled devices (CCD), or photomultiplier tubes to measure light intensity; and (5) a data acquisition system for processing and recording spectral data [49] [46].
Recent advancements in miniaturization and materials science have led to the development of portable, rugged devices suitable for field use and inline monitoring [49] [50]. Modern detectors offer enhanced sensitivity across specific wavelength ranges crucial for biological applications, with some photodiode families featuring specialized filters targeting pathogen-relevant wavelengths at 220 nm, 254 nm, and 275 nm [50]. These technological improvements, coupled with cloud integration and IoT capabilities, have transformed UV-Vis spectroscopy from a primarily laboratory-based technique to a versatile tool for real-time, on-site analysis without compromising sample integrity [49] [50].
Diagram 1: Fundamental working principle of a UV-Vis spectrometer and electronic transitions involved when photons interact with chromophores.
Machine Learning-Enhanced Contamination Detection: Methodological Framework
Data Acquisition and Preprocessing
The implementation of machine learning-aided UV-Vis spectroscopy for contamination detection begins with rigorous data acquisition and preprocessing. In typical experimental setups, researchers employ a UV-Vis light source covering wavelengths from 200 to 1000 nm, a sample holder such as a 10-mm cuvette, and a spectrometer for data collection [48]. Sample preparation varies by application but generally involves minimal processing, with methods requiring less than 1 mL of sample volume [47]. For microbial contamination detection in cell therapy products, for instance, supernatant aliquots are directly measured without complex preparation steps [47].
Spectral data preprocessing is crucial for ensuring robust machine learning performance. This phase typically includes noise reduction through smoothing algorithms, baseline correction to account for instrumental drift or scattering effects, and normalization to correct for variations in sample concentration or path length [47] [48]. For microalgae contamination analysis, researchers must also account for environmental factors such as salt stress in growth media, which alters pigment balance and causes spectral changes that could potentially obscure detection if not properly normalized [48]. The preprocessed spectral data then serve as input features for machine learning algorithms, with specific wavelength regions often selected based on their known relevance to the target analytes.
Machine Learning Algorithms and Training Approaches
The selection of appropriate machine learning algorithms is paramount for effective contamination detection. Research demonstrates that both supervised and unsupervised methods can successfully interpret UV-Vis spectral data for this purpose. One-class Support Vector Machines (SVM) have proven particularly effective for anomaly detection in sterile products, where the model is trained exclusively on spectra from sterile samples and learns to identify deviations indicating contamination [47]. This approach is especially valuable when contaminated samples are rare or difficult to obtain for training.
For applications with balanced datasets containing both contaminated and sterile samples, supervised classification algorithms such as Principal Component Analysis (PCA) combined with classifiers have shown excellent performance [48]. In microalgae contamination detection, PCA successfully classified spectral differences between uncontaminated cultures and those contaminated with flagellates or rotifers, even under challenging conditions like salt-stressed media [48]. The training process typically involves dividing the spectral dataset into training, validation, and test sets, with cross-validation employed to optimize model parameters and prevent overfitting. The resulting models can then distinguish between sterile and contaminated samples based on subtle spectral patterns that may be imperceptible to human analysts.
Experimental Protocols for Contamination Detection
Microbial Contamination Detection in Cell Therapy Products
The detection of microbial contamination in cell therapy products (CTPs) using ML-enhanced UV-Vis spectroscopy follows a meticulously designed experimental protocol. A representative study involved spiking mesenchymal stromal cell (MSC) supernatant aliquots from multiple commercial donors with seven different microbial organisms at low inoculums of 10 colony-forming units (CFUs) [47]. The experimental workflow comprised the following key steps:
Sample Preparation: MSC culture supernatants were aliquoted into sterile containers. Test samples were spiked with microbial suspensions calibrated to 10 CFUs, while control samples received sterile phosphate-buffered solution (PBS). Positive controls consisted of fresh culture medium spiked with higher microbial concentrations (1000 CFUs) [47].
Spectral Acquisition: Samples were transferred to appropriate cuvettes, and absorbance spectra were measured using a commercial spectrometer across the UV-Vis range. Each sample was typically measured in triplicate to ensure technical reproducibility [47].
Model Training and Validation: A one-class SVM model was trained exclusively on spectra from sterile samples (PBS-spiked controls). This anomaly detection approach allowed the model to learn the spectral characteristics of sterile samples and flag deviations as potential contamination [47].
Performance Evaluation: The trained model predicted contamination status in test samples, with results compared to reference methods to calculate true positive rates (sensitivity) and true negative rates (specificity). For MSC cultures spiked with 10 CFUs of E. coli, the method detected contamination at approximately 21 hours, with mean true positive and negative rates of 92.7% and 77.7% respectively across different donors [47].
This protocol demonstrated that spectral differences between microbial metabolites, particularly nicotinic acid and nicotinamide in the UV region, provided the underlying mechanism for contamination detection [47]. The method achieved comparable sensitivity to the compendial USP <71> test while providing results more rapidly and with minimal manual intervention.
Biological Contamination Monitoring in Microalgae Cultures
For microalgae cultures, researchers have developed specialized protocols to detect contamination by biological agents such as flagellates (Poterioochromonas malhamensis) and rotifers (Brachionus plicatilis) in Chlorella vulgaris and Tetradesmus obliquus cultures [48] [51]. The experimental methodology encompasses:
Culture Establishment: Axenic microalgae cultures are established under controlled conditions, with contamination introduced at known levels for method validation. Cultures are typically maintained in appropriate growth media with standardized light, temperature, and aeration conditions [48].
Spectral Monitoring: UV-Vis spectra (200-1000 nm) are collected at regular intervals using a spectrometer equipped with a suitable light source and detector. The natural pigment chemistry of microalgae (chlorophylls, carotenoids, and lipids) produces distinct spectral fingerprints that change upon contamination [48].
Machine Learning Analysis: Spectral data from contaminated and uncontaminated cultures are analyzed using machine learning algorithms, with PCA demonstrating particular efficacy for classifying spectral differences and identifying contamination even in salt-stressed media that alter normal pigment profiles [48].
Validation Against Traditional Methods: Results are compared with conventional contamination detection techniques such as microscopy and cytometry to establish correlation and determine sensitivity and specificity metrics [48] [51].
This approach capitalizes on the rich biochemical composition of microalgae, which creates distinctive spectral signatures that machine learning algorithms can parse to identify even subtle contamination. The method offers significant advantages over traditional techniques by enabling real-time, automated monitoring without the need for labor-intensive sample processing or expert interpretation [48].
Table 1: Performance Comparison of ML-Enhanced UV-Vis Contamination Detection Across Applications
| Application Domain | Target Contaminants | Detection Sensitivity | Time to Detection | Accuracy Metrics |
|---|---|---|---|---|
| Cell Therapy Products [47] | 7 microbial organisms including E. coli | 10 CFUs | ~21 hours | True Positive: 92.7%True Negative: 77.7-92% |
| Microalgae Cultures [48] [51] | Flagellates, Rotifers | Not specified | Real-time capability | Successful classification even under salt-stress conditions |
| Water Quality Monitoring [50] | Pathogens, Organic compounds | Varies by analyte | Real-time continuous | Compatible with IoT and cloud-based monitoring |
Diagram 2: Generalized experimental workflow for ML-enhanced UV-Vis contamination detection, highlighting key stages from sample preparation to result interpretation.
Essential Research Reagents and Materials
Successful implementation of ML-enhanced UV-Vis spectroscopy for contamination detection requires specific instrumentation, reagents, and computational resources. The following table details essential components for establishing this analytical capability in research and quality control settings.
Table 2: Essential Research Reagent Solutions and Materials for ML-Enhanced UV-Vis Contamination Detection
| Category | Specific Items | Technical Specifications | Primary Function |
|---|---|---|---|
| Instrumentation [47] [49] [46] | UV-Vis Spectrometer | Wavelength range: 200-1000 nm; Detector: Photodiode array (PDA) or CCD | Measures absorbance across UV-Vis spectrum |
| Light Source | Deuterium or Xenon arc lamp (UV), Tungsten-halogen (Vis) | Provides stable, broad-spectrum illumination | |
| Sample Holder | 10-mm pathlength cuvette (quartz or UV-transparent) | Contains liquid samples for measurement | |
| Consumables [47] | Cell Culture Media | DMEM for mammalian cells; Specific media for microalgae | Supports growth of biological samples |
| Reference Standards | Nicotinic acid, Nicotinamide solutions | Method validation and calibration | |
| Sterile Buffers | Phosphate Buffered Saline (PBS) | Sample dilution and negative controls | |
| Computational Resources [47] [48] | Machine Learning Platform | Python with scikit-learn, TensorFlow, or PyTorch | Implements SVM, PCA, and other ML algorithms |
| Data Processing Tools | Spectral preprocessing algorithms | Noise reduction, baseline correction, normalization |
Performance Analysis and Comparative Assessment
Quantitative Performance Metrics
Rigorous validation studies have generated comprehensive performance data for ML-enhanced UV-Vis contamination detection systems. In assessments using mesenchymal stromal cell cultures spiked with seven microbial organisms at low inoculums of 10 CFUs, the method demonstrated a mean true positive rate of 92.7% and true negative rate of 77.7% across multiple donors [47]. Performance variability was observed between different biological donors, with one donor (Donor A) achieving superior true negative rates of 92% after excluding samples with anomalously high nicotinic acid content [47]. This donor-specific performance highlights the importance of considering biological variability when implementing these methods.
Time-to-detection represents another critical performance metric. For E. coli contamination at 10 CFUs in MSC cultures, the method detected contamination at approximately 21 hours, inclusive of sample extraction, UV absorbance measurements, and SVM analysis [47]. This detection timeframe compares favorably with the compendial USP <71> test, which requires approximately 24 hours to observe turbidity, though it was slower than the BACT/ALERT 3D system, which detected contamination in 16 hours [47]. The significantly reduced sample processing requirements and potential for continuous monitoring nonetheless position the ML-enhanced UV-Vis method as a valuable complementary approach for rapid contamination screening.
Advantages Over Traditional Methods
The integration of machine learning with UV-Vis spectroscopy offers distinct advantages compared to traditional contamination detection methods. Conventional techniques such as compendial USP <71> tests involve laborious preprocessing steps, require subculturing into multiple growth media, and depend on subjective visual inspection for turbidity, which can be misleading due to light scattering from culture media components [47]. Similarly, microscopy and cytometry—common methods for microalgae contamination monitoring—demand specialized expertise for microorganism identification and lack automation capabilities [48] [51].
In contrast, the ML-enhanced UV-Vis approach provides a label-free technique requiring minimal sample preparation and volume (typically <1 mL), delivers rapid outputs (often <30 minutes after sample acquisition), enables real-time continuous monitoring, and eliminates subjective interpretation through automated algorithmic decision-making [47] [48]. The method's non-destructive nature also preserves samples for additional testing if required. Furthermore, the approach detects contamination through specific biochemical signatures rather than indirect indicators like turbidity, potentially reducing false positives from non-microbial particles or media components [47].
The integration of machine learning with UV-Vis spectroscopy represents a paradigm shift in contamination detection methodologies for pharmaceutical development, biomanufacturing, and environmental monitoring. This synergistic combination leverages the rich chemical information contained in UV-Vis spectral data while employing sophisticated algorithms to identify subtle patterns indicative of contamination that would elude conventional analysis. The documented success of this approach across diverse applications—from cell therapy products to microalgae cultures—demonstrates its versatility, robustness, and potential for transformation across multiple industries.
Future developments in this field will likely focus on several key areas: enhanced detector technologies with improved sensitivity across specific wavelength regions relevant to microbial metabolites [50]; advanced machine learning algorithms capable of identifying contamination sources and predicting contamination progression; increased integration with IoT platforms for decentralized monitoring and real-time data analytics [49] [50]; and expanded validation across broader contaminant types and biological matrices. As regulatory frameworks evolve to embrace modern analytical approaches and industries increasingly prioritize rapid quality assessment, ML-enhanced UV-Vis spectroscopy is poised to become an indispensable tool for assuring product safety, optimizing manufacturing processes, and protecting valuable biological resources.
Ultraviolet-Visible (UV-Vis) spectroscopy serves as a cornerstone technique in modern environmental monitoring, providing a rapid, non-destructive, and cost-effective method for quantifying pollutants in water matrices. This technical guide explores the application of UV-Vis spectroscopy for detecting and quantifying challenging environmental contaminants, with particular focus on nanoplastics and traditional water quality parameters. The analysis of these substances is framed within the broader context of advancements in UV-Vis light source and detector technology, which have significantly enhanced the capabilities of this established analytical method. For environmental researchers and drug development professionals who require precise quantification of contaminants, understanding these technological foundations is essential for developing robust monitoring protocols and assessing potential impacts on biological systems and pharmaceutical safety.
The fundamental principle underlying UV-Vis spectroscopy is the Lambert-Beer Law, which states that the absorbance (A) of a solution is directly proportional to the concentration (c) of the absorbing species and the path length (l) of the light through the sample: A = εcl, where ε is the molar absorptivity coefficient [52] [45]. This relationship enables quantitative analysis of diverse pollutants, from organic compounds to emerging contaminants like nanoplastics. Modern UV-Vis systems have evolved from bulky laboratory instruments to include portable, field-deployable units that maintain analytical precision while expanding application possibilities [9] [53].
Theoretical Foundations of UV-Vis Spectroscopy for Environmental Analysis
Spectroscopic Basis for Pollutant Detection
UV-Vis spectroscopy operates on the principle that pollutant molecules absorb light in the ultraviolet (typically 200-400 nm) and visible (400-800 nm) regions of the electromagnetic spectrum due to electronic transitions within their molecular structures [45]. When photons with energy matching the energy gap between molecular orbitals interact with a compound, electrons are promoted from ground states to excited states, resulting in measurable absorption of light. The specific wavelengths absorbed and the intensity of absorption provide characteristic fingerprints for identifying and quantifying substances in water samples [52].
The probability and intensity of these electronic transitions depend heavily on molecular structure. Chromophores—functional groups with electrons capable of undergoing these transitions—determine the absorption characteristics of molecules. Conjugated systems, where chromophores are connected by single bonds, exhibit enhanced absorption at longer wavelengths with greater intensity due to decreased energy gaps between molecular orbitals [45]. This principle is particularly relevant for detecting organic pollutants with aromatic or conjugated structures, which are common in agricultural and industrial contaminants.
The performance of UV-Vis spectroscopy in environmental monitoring is fundamentally tied to its instrumental components, particularly the light sources and detectors that have evolved significantly in recent years.
Light Sources: Modern UV-Vis systems employ various light sources depending on application requirements. Deuterium or xenon arc lamps provide continuous spectra across UV and visible regions, making them suitable for full-spectrum analysis [46]. Mercury vapor lamps offer intense emission at specific wavelengths, while increasingly, lasers provide monochromatic, high-intensity light for specialized applications requiring exceptional sensitivity [46]. The 2025 Review of Spectroscopic Instrumentation highlights that recent advancements have focused on improving source stability and lifetime while reducing power requirements, facilitating field deployment [9].
Detector Technology: Detectors convert transmitted light into quantifiable electrical signals, with selection depending on required sensitivity, resolution, and application context:
- Photodiode Array (PDA) Detectors: These solid-state devices measure multiple wavelengths simultaneously using an array of photodiodes, enabling rapid spectral acquisition and making them ideal for kinetic studies and chromatographic detection [46].
- Scanning Monochromator Detectors (SMD): These systems use a rotating prism to measure light intensity at different wavelengths sequentially, typically providing higher resolution than PDA detectors [46].
- Charge-Coupled Devices (CCD): CCD detectors offer high sensitivity across wide wavelength ranges and are particularly valuable for low-light applications and emission spectroscopy [46].
Recent market analyses indicate a trend toward miniaturization and enhanced performance of these detector technologies, with improved signal-to-noise ratios even in compact, field-portable instruments [9] [46].
Table 1: UV-Vis Detector Types and Environmental Applications
| Detector Type | Technology Principle | Key Advantages | Environmental Application Examples |
|---|---|---|---|
| Photodiode Array (PDA) | Simultaneous measurement via diode array | Rapid full-spectrum acquisition, high throughput | Real-time monitoring of changing pollutant levels, effluent screening |
| Scanning Monochromator (SMD) | Sequential wavelength measurement via rotating prism | Higher spectral resolution, lower stray light | Precise quantification of specific contaminants with overlapping spectra |
| Charge-Coupled Device (CCD) | High-sensitivity semiconductor array | Excellent low-light performance, wide dynamic range | Low-concentration detection, fluorescence spectroscopy applications |
UV-Vis Spectroscopy for Nanoplastic Quantification
Analytical Challenges and Methodological Approach
Nanoplastics, typically defined as plastic particles smaller than 1 μm, present significant analytical challenges due to their small size, high surface area-to-volume ratio, and complex environmental interactions [54] [55]. Their detection in environmental matrices has been limited by the lack of realistic reference materials that accurately mimic the properties of environmentally weathered particles. A 2025 study addressed this limitation by generating polystyrene-based nanoplastics from fragmented plastic items, creating controlled test materials that better represent real-world conditions [54].
The research demonstrated that microvolume UV-Vis spectroscopy provides a practical, non-destructive technique for quantifying nanoplastic concentrations in stock suspensions, expanding the analytical toolkit for environmental nanoplastic research [54]. While the technique showed some underestimation of concentrations compared to mass-based methods like pyrolysis gas chromatography-mass spectrometry and thermogravimetric analysis, it provided consistent results in terms of order of magnitude and reliably tracked trends across different samples [54]. This makes UV-Vis spectroscopy particularly valuable for rapid screening and comparative studies, especially when sample volumes are limited.
Experimental Protocol for Nanoplastic Quantification
Sample Preparation:
- Generate nanoplastics from fragmented plastic items using cryo-milling to create environmentally relevant test materials [54] [55].
- Prepare stock suspensions in purified water, using sonication to minimize aggregation.
- For method validation, consider synthesizing metal-tagged nanoplastics by incorporating 1% w/w of an organometallic additive during plastic manufacturing to enable cross-validation using single-particle inductively coupled plasma mass spectrometry (spICP-MS) [55].
Instrumentation and Measurement:
- Utilize a microvolume UV-Vis spectrophotometer to minimize sample requirements.
- Measure absorbance across the 200-800 nm range, with particular attention to characteristic absorption profiles of the specific polymer type.
- Establish a calibration curve using serial dilutions of nanoplastic standards of known concentration.
- For quantitative analysis, select wavelengths that provide optimal linear response while avoiding regions with interference from co-contaminants.
Data Analysis:
- Correct absorbance measurements for background interference using blank solutions.
- Calculate nanoplastic concentrations using the established calibration curve.
- Apply appropriate data processing algorithms (e.g., wavelet transforms, Savitzky-Golay smoothing) to enhance signal-to-noise ratio while preserving spectral features [52].
The following workflow diagram illustrates the complete experimental procedure for nanoplastic quantification using UV-Vis spectroscopy:
Comparison with Complementary Techniques
While UV-Vis spectroscopy offers advantages for rapid screening of nanoplastics, it is most powerful when used in conjunction with complementary techniques. Mass-based methods like pyrolysis gas chromatography-mass spectrometry (Py-GC/MS) provide absolute quantification but require destructive sampling and extensive sample preparation [54]. Nanoparticle tracking analysis (NTA) offers number-based concentration measurements and size distribution data but has limitations in distinguishing plastic particles from other environmental nanoparticles [54]. The comparative analysis demonstrates that UV-Vis spectroscopy provides a valuable balance between speed, accessibility, and reliability for nanoplastic quantification, particularly in method development and screening applications [54].
Table 2: Comparison of Analytical Techniques for Nanoplastic Quantification
| Technique | Principle | Detection Limits | Key Advantages | Key Limitations |
|---|---|---|---|---|
| UV-Vis Spectroscopy | Light absorption by particles in suspension | Moderate (μg/mL range) | Rapid, non-destructive, minimal sample prep, cost-effective | Limited specificity without validation, size detection limits |
| Pyrolysis GC-MS | Thermal decomposition with mass spectrometry | High (ng range) | Polymer identification, absolute quantification, high sensitivity | Destructive, complex sample prep, requires expertise |
| Thermogravimetric Analysis (TGA) | Mass change with temperature | High (ng range) | Mass-based quantification, information on polymer composition | Destructive, cannot analyze mixed polymers simultaneously |
| Nanoparticle Tracking Analysis (NTA) | Light scattering and Brownian motion | Moderate (particles/mL) | Size distribution, particle concentration | Difficulty distinguishing plastics from other particles |
Advanced Applications for Water Pollutant Detection
Conventional Water Quality Parameters
UV-Vis spectroscopy has been extensively applied to monitor traditional water quality parameters, with well-established methodologies for each:
Chemical Oxygen Demand (COD): COD estimation via UV-Vis spectroscopy relies on the correlation between absorbance at 254-280 nm and the concentration of organic matter in water [52]. This approach offers significant advantages over traditional chemical oxidation methods by eliminating the need for hazardous reagents like potassium dichromate and reducing analysis time from hours to minutes. Multivariate calibration models using full-spectrum data rather than single wavelengths have improved the accuracy of COD predictions, especially in wastewater with varying organic compositions [52].
Nitrate Nitrogen (NO₃-N): Nitrate detection utilizes its strong absorption peak at approximately 220 nm, with a secondary peak around 275-280 nm [52]. Accurate quantification requires correction for potential interference from dissolved organic matter, typically achieved by measuring absorbance at 275 nm and applying a correction factor (subtracting 2-3 times the absorbance at 275 nm from that at 220 nm) [52]. Second-derivative spectroscopy has been successfully employed to minimize background interference from other organic constituents, enhancing measurement precision.
Heavy Metals: While many metal ions lack strong chromophores, they can be quantified indirectly through complexation with colorimetric reagents that produce UV-Vis active compounds [52]. For example, heavy metals like cadmium, lead, and arsenic can form complexes with specific ligands that exhibit characteristic absorption bands, enabling quantification at environmentally relevant concentrations [55]. The development of novel chromogenic reagents with higher specificity and molar absorptivity continues to expand the capabilities of UV-Vis spectroscopy for metal detection.
Disinfection Byproduct Monitoring
In water treatment applications, UV-Vis spectroscopy provides a rapid method for monitoring disinfectant levels and related byproducts. Residual chlorine exists in two main forms—free chlorine (hypochlorous acid and hypochlorite ion) and combined chlorine (chloramines)—which exhibit different UV absorption characteristics [53]. Spectroscopy can differentiate between these forms, providing valuable information for disinfection process control. Similarly, fluoride levels can be monitored through complexation with specific reagents that produce measurable color changes, offering a non-destructive, chemical-free alternative to ion-selective electrodes for routine monitoring [53].
Data Processing and Model Development
The accuracy of UV-Vis spectroscopy for water quality assessment heavily depends on appropriate data processing and modeling techniques. The analytical workflow typically involves four critical stages:
Data Preprocessing: Raw spectral data often contain noise from instrument variability, light scattering, and environmental factors. Common preprocessing techniques include Savitzky-Golay smoothing filters to enhance signal-to-noise ratio, standard normal variate (SNV) transformation to correct for scattering effects, and derivative spectroscopy (first- and second-order) to resolve overlapping peaks and eliminate baseline drift [52].
Feature Selection: Rather than using full-spectrum data, identification of characteristic wavelengths specific to target analytes improves model robustness and reduces computational requirements. Algorithms like principal component analysis (PCA) identify wavelengths that contribute most significantly to spectral variance, while successive projections algorithms (SPA) select variables with minimal collinearity [52].
Model Development: Multivariate calibration models establish mathematical relationships between spectral data and reference analyte concentrations. Partial least squares (PLS) regression is widely employed as it effectively handles collinear spectral data. More recently, machine learning approaches including support vector machines (SVM) and artificial neural networks (ANN) have demonstrated improved prediction accuracy for complex water matrices with multiple interfering substances [52].
Model Validation: Rigorous validation using independent sample sets not included in model calibration is essential to assess predictive performance and prevent overfitting. Key validation metrics include root mean square error of prediction (RMSEP), coefficient of determination (R²), and residual prediction deviation (RPD) [52].
The following diagram illustrates the spectral data processing workflow for water quality quantification:
The Scientist's Toolkit: Essential Research Reagent Solutions
Successful implementation of UV-Vis spectroscopy for environmental monitoring requires careful selection of reagents and materials. The following table details essential research solutions for quantifying nanoplastics and water pollutants:
Table 3: Essential Research Reagents and Materials for Environmental UV-Vis Analysis
| Reagent/Material | Specification/Grade | Primary Function | Application Notes |
|---|---|---|---|
| Polystyrene Reference Nanoplastics | Certified size distribution (50-500 nm) | Method calibration and validation | Use environmentally relevant, fragmented particles rather than pristine spheres [54] |
| Deuterium or Xenon Arc Lamp | UV-Vis compatible, >1000 hours lifetime | Light source for spectral measurements | Ensure stable output across 200-800 nm range [46] |
| High-Purity Water System | 18.2 MΩ·cm resistance | Sample preparation, dilution, blanks | Critical for minimizing background absorption [9] |
| Quartz Cuvettes | Spectrosil grade, 10 mm path length | Sample containment for measurement | Required for UV range below 350 nm [52] |
| Potassium Hydrogen Phthalate (KHP) | Analytical standard grade | COD method validation | Reference material for organic carbon quantification [52] |
| Nitrate Standard Solution | Certified reference material | Calibration for NO₃-N detection | Enables quantitative correlation of 220 nm absorption [52] |
| Chromogenic Complexation Reagents | Spectroscopy grade | Heavy metal detection and quantification | Specific ligands for target metals (e.g., dithizone for Pb) [52] |
| Savitzky-Golay Smoothing Algorithms | MATLAB, Python, or specialized software | Spectral data preprocessing | Reduces high-frequency noise while preserving spectral features [52] |
Technological Advances and Future Perspectives
The field of UV-Vis spectroscopy continues to evolve, with several technological advances enhancing its applicability for environmental monitoring:
Miniaturization and Portability: The development of compact, rugged spectrophotometers has enabled field-based analysis, reducing the need for sample preservation and transportation [9] [53]. Recent Pittcon exhibitions highlighted handheld UV-Vis systems with capabilities approaching those of benchtop instruments, featuring integrated GPS and video documentation for field studies [9].
Enhanced Detector Technology: Improvements in detector sensitivity, particularly with CCD and PDA technologies, have lowered detection limits, allowing quantification of contaminants at environmentally relevant concentrations [9] [46]. The integration of advanced cooling systems has reduced dark noise, enabling longer integration times and improved signal-to-noise ratios for trace analysis [9].
Hyperspectral Imaging: Combining UV-Vis spectroscopy with imaging technologies creates hyperspectral systems that provide both spatial and spectral information, particularly valuable for analyzing heterogeneous environmental samples like sediments and biological tissues [55].
Data Processing Advancements: Implementation of machine learning algorithms for spectral analysis continues to improve the accuracy of quantification in complex matrices, enabling better discrimination between target analytes and background interference [52]. The development of specialized software with embedded protocols facilitates method transfer between laboratories and improves reproducibility [9].
As environmental monitoring requirements become more stringent and the need for rapid contamination assessment grows, UV-Vis spectroscopy maintains its relevance through continuous technological innovation. Its integration with complementary techniques and adaptation to emerging challenges like nanoplastic pollution ensures its continued importance in the environmental analytical toolkit.
DNA/RNA Analysis and Protein Studies in Clinical Research
Ultraviolet-Visible (UV-Vis) spectroscopy stands as a foundational analytical technique in clinical research, providing critical capabilities for quantifying biomolecules through their innate light absorption properties. This method leverages the principle that proteins, DNA, and RNA in solution absorb light in the ultraviolet range, enabling researchers to determine concentration without additional reagents [56]. The technique operates on Beer-Lambert's Law, which establishes a direct relationship between the absorbance of light at a specific wavelength and the concentration of the absorbing species [57]. In modern clinical settings and drug development pipelines, UV-Vis spectroscopy serves as an indispensable tool for characterizing therapeutic proteins, quantifying nucleic acids, and ensuring quality control across diverse biomedical applications.
The versatility of UV-Vis spectroscopy extends from basic concentration measurements to sophisticated analysis of complex nucleoprotein complexes like viruses, providing insights into both composition and structural integrity [58]. Technological advancements have transformed traditional spectrophotometers into highly sophisticated instruments featuring miniaturized designs, enhanced optics, automated workflows, and integrated data analytics [59]. These innovations have expanded the technique's utility across diverse clinical research applications, from pharmaceutical development to environmental monitoring and diagnostic applications [60] [61].
Fundamental Principles and Quantitative Analysis
Theoretical Foundation
UV-Vis spectroscopy measures the absorption of ultraviolet or visible light by a sample, typically spanning wavelengths from 200 to 800 nanometers [62]. When molecules encounter this light energy, electrons transition from ground states to excited states, producing characteristic absorption spectra. The fundamental relationship governing quantitative analysis is the Beer-Lambert Law:
[A = \epsilon l c]
Where (A) represents absorbance (unitless), (\epsilon) is the molar absorptivity (M⁻¹cm⁻¹), (l) is the pathlength through the sample (cm), and (c) is the concentration (M) [57]. This linear relationship enables direct concentration calculations from measured absorbance values, provided the extinction coefficient is known and working within the method's linear range.
Biomolecular Absorption Characteristics
Proteins and nucleic acids exhibit distinct UV absorption profiles due to their specific chromophores. Proteins absorb primarily at 280 nm due to aromatic amino acids (tryptophan, tyrosine, and phenylalanine), with disulfide bonds contributing marginally. Nucleic acids (DNA and RNA) display maximum absorption at 260 nm because of their purine and pyrimidine bases [56]. These characteristic absorption patterns enable differentiation and individual quantification in mixed samples.
Table 1: Spectral Properties of Key Biomolecules
| Biomolecule | Absorption Maximum (nm) | 260/280 Ratio (Pure) | Extinction Coefficient Examples |
|---|---|---|---|
| Protein | 280 nm | ~0.6 | Varies by aromatic amino acid content |
| DNA/RNA | 260 nm | ~2.0 | 8,000 M⁻¹cm⁻¹ per nucleotide (average) [58] |
| Tryptophan | 280 nm | - | 5,500 M⁻¹cm⁻¹ |
| Tyrosine | 274 nm | - | 1,400 M⁻¹cm⁻¹ |
| Phenylalanine | 257 nm | - | 200 M⁻¹cm⁻¹ |
For accurate quantification, the contribution of light scattering to apparent absorption must be considered, particularly for large complexes like viruses or aggregated proteins. Light scattering follows approximately a λ⁻⁴ dependence according to Rayleigh scattering principles, which can be corrected using absorbance measurements at wavelengths where biomolecules don't absorb (typically 340 nm and 360 nm) [58]:
[ ALS,\lambda = c1(\lambda)^{-4} + c2 ]
Where (c1) and (c2) are constants determined from the 340 nm and 360 nm measurements, enabling calculation of the true absorbance after scatter subtraction [58].
Experimental Methodologies
Basic Protein and Nucleic Acid Quantification
Standard protocols for biomolecule quantification require minimal sample preparation and can be completed rapidly with modern instrumentation. The following workflow outlines a typical procedure for determining protein and nucleic acid concentrations using UV-Vis spectroscopy.
Diagram 1: Basic quantification workflow
For protein quantification, measure absorbance at 280 nm (A₂₈₀) using the appropriate extinction coefficient for your protein. If unknown, average coefficients of 5,500 M⁻¹cm⁻¹ (tryptophan), 1,400 M⁻¹cm⁻¹ (tyrosine), and 200 M⁻¹cm⁻¹ (phenylalanine) can provide estimates. For nucleic acids, measure absorbance at 260 nm (A₂₆₀) using an average extinction coefficient of 8,000 M⁻¹cm⁻¹ per nucleotide [58]. The ratio A₂₆₀/A₂₈₀ provides purity assessment—expected ratios are approximately 1.8 for pure DNA and 2.0 for pure RNA [58].
Advanced Analysis of Nucleoprotein Complexes
For complex biological assemblies like viruses or virus-like particles, where both protein and nucleic acid contribute to the absorption spectrum, a more sophisticated approach is required. The following methodology enables accurate determination of both protein and nucleic acid concentrations in such complexes, accounting for spectral overlap and light scattering contributions [58].
Diagram 2: Complex sample analysis workflow
The advanced protocol involves collecting full spectra from 230 nm to 360 nm, then applying light scattering correction using the two-point approximation with measurements at 340 nm and 360 nm where biomolecular absorption is negligible [58]. The correction uses the equation:
[ A{\text{corrected},\lambda} = A{\lambda} - \left( \frac{A{340} - A{360}}{(340\text{nm})^{-4} - (360\text{nm})^{-4}} \right) \lambda^{-4} - A{340} + \left( \frac{A{340} - A_{360}}{(340\text{nm})^{-4} - (360\text{nm})^{-4}} \right) (340\text{nm})^{-4} ]
After correction, protein and nucleic acid concentrations are determined by solving simultaneous equations using the corrected A₂₆₀ and A₂₈₀ values with known extinction coefficients for both components [58]. This method was validated using National Institute of Standards and Technology Reference Materials (NISTmAb), achieving accuracy within 2% of certified values [56].
Calibration Curve Method
For highest accuracy, particularly with unknown samples or when exact extinction coefficients are unavailable, the calibration curve method is preferred. This approach involves preparing a series of standard solutions with accurately known concentrations, measuring their absorbances, and constructing a standard curve of absorbance versus concentration [57]. The curve should be linear in the working range, and unknown sample concentrations are determined by interpolation. This method accounts for instrument-specific variations and potential matrix effects.
Instrumentation and Technology Advancements
Current Market Landscape and Instrument Types
The global UV-Vis spectrometer market is projected to reach $1.33 billion in 2025, growing at a CAGR of 5.91% to $1.99 billion by 2032 [62]. This growth is driven by increasing demand across pharmaceutical, biotechnology, environmental monitoring, and academic research sectors [60]. Instrumentation ranges from traditional benchtop systems to portable and handheld devices, with double-beam instruments dominating approximately 70% of the market share due to superior accuracy and reproducibility [60].
Table 2: UV-Vis Spectrometer Types and Characteristics
| Instrument Type | Key Features | Typical Applications | Advantages |
|---|---|---|---|
| Single-Beam | Simple optics, lower cost | Educational settings, routine quantification | Cost-effective, compact design |
| Double-Beam | Reference beam, enhanced stability | Pharmaceutical QC, research applications | Superior baseline stability, reduced noise [60] |
| Array-Based | Simultaneous multi-wavelength detection | Kinetic studies, spectral scanning | Rapid data acquisition, enhanced workflow efficiency |
| Portable/Handheld | Battery-powered, compact design | Field testing, point-of-care applications | Portability, minimal sample requirements [62] |
| Microvolume | Minimal sample requirements (0.5-2 µL) | Precious samples, high-throughput screening | No dilution required, wide dynamic range [56] |
Key Technological Innovations
Recent advancements in UV-Vis spectrometer design have significantly enhanced their capabilities for clinical research applications. These innovations span multiple aspects of instrument performance and usability.
Miniaturization and Portability: Traditional benchtop instruments have evolved into compact, portable devices enabling field-based analysis and point-of-care testing without sacrificing performance [59]. Modern microvolume systems require only 2 μL of sample while maintaining accuracy within 2% and precision within 1% [56].
Enhanced Optics and Detection Systems: Improved optical components including light sources, monochromators, and detectors have increased sensitivity, resolution, and dynamic range. Advanced systems now offer wavelength ranges from 230-750 nm with optical density detection from 0.03-275 OD [56]. Diode array detectors enable simultaneous multi-wavelength measurement, facilitating rapid spectral acquisition and kinetic studies [62].
Automation and Software Integration: Modern instruments feature sophisticated software with automated calibration, data analysis, and compliance-ready documentation features. Integration with laboratory information management systems (LIMS) and cloud-based data management enhances workflow efficiency and data integrity [62] [59]. Automated sample handling interfaces with robotic systems for high-throughput applications.
Multimodal Spectroscopy: Combining UV-Vis spectroscopy with complementary techniques like fluorescence or dynamic light scattering in single platforms provides comprehensive sample characterization. For example, systems integrating UV-Vis quantification with dynamic light scattering enable simultaneous concentration, size, and aggregation measurements [56].
Research Reagent Solutions and Essential Materials
Table 3: Essential Research Reagents and Materials for UV-Vis Analysis
| Item | Function/Application | Technical Considerations |
|---|---|---|
| High-Purity Cuvettes | Sample containment for measurement | Material (quartz/glass/plastic), pathlength (typically 1 cm), volume requirements |
| Microvolume Plates | High-throughput analysis with minimal sample | Fixed pathlength (e.g., 0.1 mm and 0.7 mm), compatibility with automation [56] |
| Buffer Solutions | Sample dilution and blank preparation | UV-transparent at wavelengths of interest, appropriate pH and ionic strength |
| Protein Standards | Calibration curve preparation | BSA or other purified proteins of known concentration and extinction coefficient |
| Nucleic Acid Standards | Calibration and method validation | DNA/RNA samples with known concentrations and sequences |
| NIST Reference Materials | Method validation and quality control | Certified reference materials (e.g., NISTmAb) for accuracy verification [56] |
| Cleaning Solutions | Cuvette and instrument maintenance | Compatible with sample materials, non-interfering with measurements |
Applications in Clinical Research and Drug Development
Biomolecular Quantification and Quality Assessment
In clinical research settings, UV-Vis spectroscopy provides rapid, reproducible quantification of proteins and nucleic acids across diverse sample types. Applications include measuring antibody concentrations in biopharmaceutical development [56], quantifying DNA/RNA in diagnostic samples, and assessing biomolecule purity through 260/280 ratios [58]. Modern systems can quantify IgG across a remarkable dynamic range from 0.02-200 mg/mL and nucleic acids from 1.5-13,750 ng/μL without dilution [56].
Virus and Vaccine Characterization
The advanced methodologies for analyzing nucleoprotein complexes enable detailed characterization of viruses and virus-like particles used in vaccine development and gene therapy. Researchers can determine exact stoichiometries of packaged nucleic acids within capsids, monitor assembly efficiency, and assess product consistency [58]. This approach confirmed brome mosaic virus packages approximately 3100 nucleotides per capsid, consistent with its genome size [58].
Kinetic Studies and Process Monitoring
Real-time monitoring capabilities enable researchers to study reaction kinetics, monitor enzyme activities, and optimize reaction conditions in bioprocessing [59]. Rapid-scanning instruments facilitate dynamic measurements of reaction progress, substrate utilization, and product formation, providing valuable insights for process development and optimization in pharmaceutical manufacturing.
UV-Vis spectroscopy remains an essential analytical technique in clinical research, offering robust, reproducible biomolecule quantification with evolving capabilities through technological advancements. The methodology provides critical support across the drug development pipeline, from basic research to quality control of final products. Future directions include increased integration with artificial intelligence for data analysis, continued miniaturization for point-of-care applications, and further development of multimodal systems for comprehensive sample characterization. By leveraging both fundamental principles and advanced applications, researchers can fully exploit this versatile technique to advance clinical research and therapeutic development.
Maximizing Performance: A Practical Guide to Troubleshooting and System Optimization
Ultraviolet-Visible (UV-Vis) spectroscopy is a fundamental analytical technique in research and drug development, used for identifying and quantifying compounds by measuring their absorption of light in the ultraviolet and visible ranges [46]. The reliability of these measurements is paramount, yet the instrumentation is susceptible to specific, recurring errors related to its core components: the light source and the detector. This guide provides an in-depth technical examination of these common errors, framing them within the context of a broader overview of UV-Vis light source and detector technology. Aimed at researchers and scientists, this document offers detailed diagnostic procedures and practical solutions to ensure data integrity, supported by structured data tables and experimental workflows.
Understanding Light Source Errors
The light source is the origin of the electromagnetic radiation used to probe the sample. Degradation or instability in the source directly compromises the entire measurement.
Common Symptoms and Underlying Causes
A primary symptom of light source failure is a red lamp indicator on the detector console, often accompanied by initialization or wavelength verification failures [63]. This can be linked to several underlying causes:
- Lamp Age and Degradation: Over time, the intensity output of deuterium and xenon arc lamps decreases, particularly in the UV region, leading to a poor signal-to-noise ratio [64].
- Electrical Failures and Faulty Output: For LED-based sources, faults can manifest as a decrease in light efficiency or flicker, which are often undetectable through simple electrical parameter measurements and require analysis of the light output's time-frequency characteristics [65].
- Systematic and Environmental Errors: External factors can induce significant error. These include stray light, where unwanted wavelengths reach the detector, causing deviations from the Beer-Lambert law, and environmental factors like temperature fluctuations or surface contamination on optical components, which can introduce errors as high as 7-8% [66] [67].
Diagnostic and Experimental Protocols
A systematic approach is required to diagnose light source issues.
Protocol 1: Comprehensive Lamp Diagnostics
Objective: To determine if a red lamp indicator is due to a flow cell issue or a failing lamp [63]. Materials: HPLC-grade solvent (e.g., 100% methanol), syringe, appropriate tubing. Method: 1. Before powering on the detector, establish a solvent flow of 1.0 mL/min through the system. Ensure backpressure does not exceed 1000 psi if no column is installed. 2. Allow the flow to continue for at least 15 minutes to ensure the flow cell is primed and free of air bubbles. 3. Power on the detector and observe the initialization sequence. 4. If the light remains red, reboot the detector while maintaining the solvent flow. Interpretation: Successful initialization after this procedure confirms a dry flow cell was the issue. Persistent failure indicates a potential lamp or electronics fault requiring replacement or service.
Protocol 2: Stray Light Measurement
Objective: To quantify the level of stray light in a spectrophotometer [67]. Materials: Stray light reference standard (e.g., a solution with absorbance >2 at the test wavelength). Method: 1. Place the reference standard in the sample holder. This standard should have certified, very high absorbance at specific wavelengths, effectively blocking all correct-wavelength light. 2. Measure the apparent absorbance at the specified wavelength (e.g., 220 nm for KCl solution testing for UV stray light, or 340 nm for NaNO₂ for visible stray light). 3. Record the measured value. Interpretation: Any measured absorbance value significantly less than the known high absorbance of the standard indicates the presence of stray light. The measured value is the instrument's stray light level. High levels necessitate cleaning of optical components or servicing.
Figure 1: Lamp and Flow Cell Diagnostic Workflow. This flowchart outlines the step-by-step procedure for diagnosing a red lamp indicator, distinguishing between a dry flow cell and a more serious hardware failure [63].
Understanding Detector Errors
The detector converts transmitted light into an electrical signal, and its imperfections are a key source of quantitative error.
Types of Errors and Their Signatures
Detector errors can be systematic and vary with the signal level.
- Statistical Noise and Digitization Error: Instrumental variance in absorbance (σA²) is a function of both the wavelength (λ) and the absorbance (A) itself. At high absorbance levels, precision can be limited by the digitization error of the analog-to-digital converter [68].
- Photometric Non-Linearity: A fundamental assumption in UV-Vis is the linear relationship between absorbance and concentration (Beer-Lambert Law). Detector response may become non-linear, especially at high absorbances, leading to inaccurate concentration calculations [67].
- Wavelength Inaccuracy: If the detector's wavelength calibration is incorrect, the instrument will assign absorbance peaks to the wrong wavelengths, leading to misidentification of compounds [67].
Diagnostic and Experimental Protocols
Rigorous calibration is the primary method for characterizing detector performance.
Protocol 3: Statistical Error Calibration
Objective: To characterize the statistical variance (noise) of the detector as a function of absorbance and wavelength [68]. Materials: Set of certified neutral-density filters covering a range of absorbances up to 2.0. Method: 1. Acquire spectra for each neutral-density filter over the desired wavelength range (e.g., 200-850 nm). 2. For each wavelength segment, perform a piecewise least-squares fit of the absorbance readings from the different filters to a low-order polynomial. 3. The variances derived from these fits serve as estimates of the instrumental variance (σ²) for that specific λ and A. 4. Express these variance values as a function of λ and A using a compact parametric model (e.g., a function of A and the effective source intensity, I₀). Interpretation: The resulting model quantifies the detector's inherent noise floor. This information is critical for high-precision measurements and can be used as least-squares weights in spectral fitting algorithms to improve accuracy.
Protocol 4: Verifying Photometric Linearity and Wavelength Accuracy
Objective: To validate the accuracy of the detector's absorbance and wavelength readings [67]. Materials: Certified set of reference standards, including: - Holmium oxide or didymium filters (for wavelength calibration), which have sharp, well-defined absorption peaks at known wavelengths. - Neutral-density filters or metal-on-quartz filters (for absorbance calibration), with certified absorbance values at specific wavelengths. Method: 1. Wavelength Calibration: Measure the reference standard with known sharp peaks. Record the wavelength values of the peak maxima as reported by the instrument. 2. Absorbance Calibration: Measure the absorbance standards across the relevant wavelength and absorbance range. Record the absorbance values reported by the instrument. 3. Linearity Check: Using a series of standards of varying known concentrations (or absorbances), create a calibration curve. Interpretation: - Wavelength: Calculate the correction (Certified λ - Measured λ) for each peak. The corrections, along with their associated uncertainties, should fall within the instrument's specified tolerance. - Absorbance: Calculate the correction (Certified A - Measured A) for each standard. - Linearity: Perform a linear regression on the calibration curve. The coefficient of determination (R²) indicates the degree of linearity. An R² value >0.999 is typically expected for a high-quality instrument.
Table 1: Summary of Common Errors, Symptoms, and Initial Diagnostics
| Component | Common Error | Observed Symptoms | Quick Diagnostic Check |
|---|---|---|---|
| Light Source | Lamp failure/degradation | Red lamp light, initialization failure, poor S/N [63] [64] | Follow dry flow cell protocol; check lamp hours. |
| Stray light | Deviation from Beer-Lambert law, especially at high absorbance [67] | Measure a high-absorbance standard; value <2 indicates stray light. | |
| Detector | Wavelength inaccuracy | Peaks shifted in recorded spectra, misidentification [67] | Measure a holmium oxide filter; compare peak positions to certified values. |
| Photometric non-linearity | Non-linear calibration curves, inaccurate quantification [67] | Run a series of absorbance standards; check R² of calibration curve. | |
| Statistical noise (high A) | Poor precision and high variance at high absorbances [68] | Perform repeated scans of an absorbance standard; calculate variance. |
The Scientist's Toolkit: Calibration and Maintenance
Proper calibration transforms a spectrophotometer from a simple measuring device into a traceable scientific instrument.
Interpreting Calibration Certificates
After professional calibration, a certificate is issued. Understanding its contents is critical for making informed decisions about the equipment's validity [67]. Key elements include:
- Correction/Error: The difference between the value measured by the instrument and the certified value of the reference standard. This value can be used to adjust future measurements.
- Expanded Uncertainty (U): A quantitative measure of the reliability of the calibration, calculated by multiplying the standard uncertainty by a coverage factor (typically k=2, for a 95% confidence level). All measurements have an associated uncertainty.
- Acceptance Criteria: A company should define an allowable tolerance based on its specific measurement requirements. A common acceptance criterion is: |Correction| + U ≤ Allowable Tolerance.
Table 2: Key Items in a Researcher's Toolkit for UV-Vis Error Diagnosis
| Tool/Reagent | Function and Application | Technical Notes |
|---|---|---|
| Holmium Oxide Filter | Wavelength calibration; verifies the instrument assigns correct wavelengths via sharp emission peaks. | Certified standards provide traceable peak positions (e.g., 241.5 nm, 287.5 nm). [67] |
| Neutral Density Filters | Absorbance calibration and photometric linearity check; provides known, stable attenuation. | Used in statistical error calibration to model variance as a function of A and λ. [68] [67] |
| Stray Light Solution | Quantifies stray light level; a solution with absorbance >2 at a specific wavelength (e.g., KCl for 220 nm). | Any measured signal at this condition is unwanted stray light. [67] |
| HPLC-grade Solvent | System priming and flushing; resolves issues caused by a dry flow cell or air bubbles. | Methanol, isopropanol, or acetonitrile at 1-2 mL/min. [63] |
| Ultrapure Water | Sample preparation, mobile phases, and dilution; prevents contamination that can scatter or absorb light. | Purification systems (e.g., Milli-Q) are essential. [9] |
Figure 2: Calibration Certificate Acceptance Workflow. This process guides the evaluation of a calibration certificate to make a data-driven decision on equipment acceptance or rejection [67].
Proactive diagnosis and regular, traceable calibration are not merely maintenance tasks but fundamental scientific practices that underpin the reliability of UV-Vis spectroscopy. By understanding the common failure modes of light sources and detectors—from lamp degradation and stray light to photometric non-linearity and statistical noise—researchers and drug development professionals can move beyond simply operating an instrument to truly validating its output. The protocols and toolkit provided in this guide offer a pathway to robust, defensible data, ensuring that this foundational analytical technique continues to provide accurate and precise results critical for research and quality control.
Sample preparation is a critical foundation for reliable UV-Vis spectroscopy, with errors at this stage accounting for a significant portion of analytical inaccuracies [69]. Proper technique ensures that the advanced capabilities of modern light sources and detectors are not undermined by preventable flaws in the initial steps. This guide details the core pitfalls and protocols to ensure data integrity from the very start.
Contamination Control
Contamination introduces foreign material that generates spurious spectral signals, compromising data and rendering results worthless [69]. Its control is paramount for analytical fidelity.
- Cross-Contamination: Inadequate cleaning between samples transfers analytes, leading to false positives and concentration errors [69].
- Particulate Contamination: Dust or impurities from reagents scatter light, increasing baseline noise and reducing signal-to-noise ratio [69].
- Cuvette Contamination: Fingerprint oils on optical surfaces absorb light in the 270–300 nm range, directly interfering with critical measurements for biomolecules [70].
Experimental Protocol: Cuvette Cleaning
A standardized cleaning procedure is essential for reproducible results [70].
- Immediate Rinsing: Rinse the cuvette immediately after measurement with the solvent used for the sample to prevent residue drying and surface etching [70].
- Mechanical Cleaning: Use lint-free microfiber or foam-tip swabs. Avoid cotton, as fibers can scratch optical surfaces [70].
- Solvent Selection: For stubborn residues, use a series of solvents ending with a final rinse of a high-purity, volatile solvent like HPLC-grade methanol or acetone to facilitate rapid drying.
- Drying and Storage: Allow cuvettes to air-dry in a dust-free environment. Store them in their original cases or a clean, dry container to prevent contamination [70].
Cuvette Selection
The cuvette is not merely a container; it defines the optical path and directly influences the light's interaction with the sample [70]. Selecting the wrong type can invalidate an experiment.
Material Compatibility
The choice of material dictates the usable wavelength range and chemical resistance. Table 1 summarizes the key properties of common cuvette materials.
Table 1: Comparative Properties of Cuvette Materials
| Feature | Quartz (Fused Silica) | Optical Glass | Plastic (PS/PMMA) |
|---|---|---|---|
| UV Transmission | Excellent (190–2500 nm) [71] | Limited (>320 nm) [71] | Not supported [71] |
| Visible Transmission | Excellent | Excellent | Good [71] |
| Autofluorescence | Low | Moderate | High [71] |
| Chemical Resistance | High (Except to HF) [71] | Moderate | Low [71] |
| Max Temperature | 150–1200 °C [71] | ≤90 °C [71] | ≤60 °C [71] |
| Lifespan | Years (with care) | Months–Years | Disposable [71] |
| Best Use | UV-Vis, Fluorescence, Solvents [71] [70] | Visible-only assays [70] | Teaching, Colorimetric assays [71] |
Selection Guide:
- Deep UV (<300 nm) and fluorescence measurements require quartz cuvettes due to their UV transparency and low autofluorescence [71] [72].
- For visible-only assays, optical glass is a cost-effective alternative [70].
- Disposable plastic cuvettes are suitable for teaching labs or non-critical colorimetric tests where UV sensitivity is not needed [72].
Path Length and Geometry
The path length is a direct variable in the Beer-Lambert law (A = εbc) and governs sensitivity and dynamic range [70].
Path Length Selection Workflow: The following diagram outlines the decision process for selecting the appropriate cuvette path length and type.
Z-Height Consideration: The cuvette's z-height (the height from its base to the center of the light beam) must match the spectrometer's beam height, which varies by manufacturer (e.g., 15 mm for JASCO V-700 series) [72]. Mismatch can cause light to pass through the cell wall, introducing significant stray light errors [72].
Solvent and Matrix Effects
The solvent forms the matrix in which the analyte resides, and its properties are as critical as the analyte itself for obtaining a quality spectrum.
Solvent Selection Criteria
- UV Cutoff Wavelength: The solvent must be transparent in the spectral region of interest. Below its cutoff wavelength, solvent absorbance becomes prohibitively high, leading to detector saturation and loss of analyte signal [72]. Common cutoffs are: Water (~190 nm), Methanol (~205 nm), Acetonitrile (~190 nm), Hexane (~195 nm) [69].
- Polarity and Solubility: The solvent must fully dissolve the sample to prevent light scattering from particulates and ensure a stable, homogeneous solution [72].
- Purity: Always use high-purity, "spectroscopic-grade" or "HPLC-grade" solvents to minimize background absorbance from impurities [69].
Baseline Correction Protocol
A proper baseline measurement accounts for absorbance from the solvent and cuvette, which is essential for accurate quantitative analysis [72]. The following workflow details the correct procedure for a double-beam spectrophotometer.
Note on Reference Beam: For highly absorbing samples (Abs > 3), placing a solvent blank in the reference beam with a neutral density filter (Rear Beam Attenuation) can balance the light intensity on the detector, extending the photometric range and improving signal-to-noise ratio [72].
The Scientist's Toolkit: Essential Research Reagents and Materials
Table 2: Key Materials for UV-Vis Sample Preparation
| Item | Function & Rationale |
|---|---|
| Quartz Cuvettes (4-window) | Essential for fluorescence measurements; all four polished windows allow for 90° detection of emitted light [71]. |
| Microvolume Cuvettes | Enable analysis of sample volumes as low as 1-2 µL while maintaining a standard path length, crucial for precious or scarce samples [70]. |
| Spectroscopic-Grade Solvents | High-purity solvents (e.g., water, acetonitrile) with low UV cutoff wavelengths and minimal impurities to reduce background noise [69] [72]. |
| Lint-Free Swabs | For safe cuvette cleaning without introducing scratches or fibers that scatter light [70]. |
| Nitrile Gloves | Prevent contamination of optical surfaces by fingerprint oils, which absorb significantly in the UV range [70]. |
Meticulous sample preparation is the unacknowledged pillar of robust UV-Vis spectroscopy. By systematically addressing the pitfalls of contamination, cuvette selection, and solvent effects, researchers can ensure that their data accurately reflects the sample's properties rather than the preparation artifacts. Mastering these foundational techniques is a prerequisite for leveraging the full potential of advanced UV-Vis instrumentation and detector technology.
In ultraviolet-visible (UV-Vis) spectroscopy, the signal-to-noise ratio (SNR) is a critical determinant for the reliability, sensitivity, and accuracy of analytical results. For researchers and drug development professionals, optimizing SNR is not merely a procedural step but a fundamental requirement for obtaining high-quality data that meets stringent regulatory standards. This guide details three core, controllable factors—instrument warm-up time, optical alignment, and sample path length—that directly influence SNR. A systematic approach to these parameters enables scientists to significantly lower detection limits, enhance measurement precision, and ensure data integrity in pharmaceutical applications from quality control (QC) to process analytical technology (PAT) [73] [74].
The Critical Role of Source Warm-Up Time
The stability of the light source in a UV-Vis spectrophotometer is a primary factor affecting baseline drift and signal noise. When first powered on, the output intensity of lamps can fluctuate until operating temperature is stabilized.
Recommended Warm-Up Durations
Adhering to prescribed warm-up times is a simple yet effective first step in SNR optimization. The required duration varies significantly by light source technology [75]:
| Light Source Type | Typical Warm-Up Time | Impact of Insufficient Warm-Up |
|---|---|---|
| Tungsten Halogen or Arc Lamps | ~20 minutes | Variable illumination, baseline drift, reduced photometric accuracy [75]. |
| LEDs or Lasers | A few minutes | Faster stabilization, but consistent output required before measurement [75]. |
Experimental Protocol: Verifying Source Stability
Objective: To empirically determine the time required for a specific UV-Vis instrument's source to achieve stable output. Method: A Single-Beam Instrument Setup [76] [75]
- Baseline Setup: Turn on the spectrophotometer. With the shutter closed or no sample in the path, calibrate the instrument to 0% T. Immediately after, using a blank reference cuvette, calibrate to 100% T.
- Stability Monitoring: Without altering the configuration, continuously monitor the transmittance or absorbance reading of the blank at a fixed wavelength (e.g., 500 nm).
- Data Recording: Record the value at 30-second intervals immediately after power-on.
- Stability Determination: Plot the recorded values against time. The warm-up time is the point at which the signal variation falls within the instrument's specified photometric noise tolerance (e.g., ±0.001 AU). For instruments used in regulated environments, this verification should be part of the initial Operational Qualification (OQ) [74].
Optimizing Optical Alignment and Sample Presentation
In a modular or single-beam system, the alignment of the optical path and the positioning of the sample are crucial for maximizing signal strength and minimizing stray light or signal loss.
Key Alignment Principles
- Beam Path: Ensure a clear, uninterrupted path between the light source and the detector. All modular components must be firmly secured [75].
- Sample Orientation: For thin film measurements, the sample must be positioned perpendicular to the light source and spectrometer to ensure the beam passes through a uniform area [75].
- Fiber Optics: Use optical fibers with compatible connectors (e.g., SMA) to guide light. Check cables for damage, as bending or twisting can cause signal attenuation and light leakage [75].
Methodology: Alignment Verification for Thin Films
Objective: To ensure optimal alignment for maximum signal collection in a transmission measurement. Materials: UV-Vis spectrophotometer, thin film sample, optical breadboard (if modular), compatible optical fibers. Procedure:
- Mount the Sample: Place the thin film sample in a holder that fixes it at a 90° orientation relative to the intended beam path.
- Connect Fibers: Use optical fibers to connect the light source and the spectrometer detector to the sample holder. Ensure all connections are finger-tight.
- Optimize Position: If using a modular setup without fixed fibers, carefully adjust the position of the light source and detector relative to the sample until the detected signal is maximized. All components should then be fixed in place.
- Verify Consistency: Between measurements, ensure the positioning of all modular elements remains identical to avoid introducing variability [75].
The following workflow outlines the systematic procedure for aligning a UV-Vis spectrometer to optimize signal-to-noise ratio:
Strategic Selection of Path Length and Sample Concentration
The interaction between sample path length and concentration is governed by the Beer-Lambert law. Strategic manipulation of these factors is key to obtaining an absorbance value within the ideal quantitative range (typically 0.1-1.0 AU), thereby optimizing the SNR.
The Path Length and Concentration Relationship
According to the Beer-Lambert law, Absorbance (A) = ε * c * l, where ε is the molar absorptivity, c is the concentration, and l is the path length. For highly concentrated samples that yield over-range absorbance, reducing the path length is an effective solution. Using a cuvette with a shorter path length reduces the probability of light scattering, allowing more light to reach the detector and improving the SNR [75]. Conversely, for very dilute samples, increasing the path length can enhance the absorbance signal.
Experimental Protocol: Path Length Optimization
Objective: To bring the absorbance of an over-range sample into the optimal reading range by selecting an appropriate cuvette path length. Materials: Opaque (over-absorbing) sample, UV-Vis spectrophotometer, set of matched quartz cuvettes of varying path lengths (e.g., 10 mm, 4 mm, 2 mm, 1 mm). Procedure:
- Initial Measurement: Using a standard 10 mm path length cuvette, measure the absorbance spectrum of the sample. Note the peak absorbance value.
- Evaluate and Select: If the peak absorbance exceeds 1.0 AU, switch to a cuvette with a shorter path length (e.g., 2 mm).
- Re-measure and Calculate: Record the new absorbance value. The relationship is linear; a fivefold reduction in path length (from 10 mm to 2 mm) should result in approximately a fivefold reduction in absorbance.
- Iterate if Necessary: If the absorbance is still too high, select an even shorter path length cuvette until the maximum absorbance falls below 1.0 AU. This method is particularly valuable in pharmaceutical QC for accurately measuring concentrated active pharmaceutical ingredient (API) solutions without dilution, which can introduce error [73] [75] [77].
The Scientist's Toolkit: Essential Research Reagent Solutions
The following reagents and materials are fundamental for preparing samples and standards to ensure the accuracy and reproducibility of UV-Vis spectroscopy in a research or QC environment.
| Item | Function & Importance |
|---|---|
| High-Purity Solvents | Low UV-cutoff, spectral-grade solvents (e.g., water, acetonitrile, methanol) minimize background absorption and prevent false signals [77]. |
| Quartz Cuvettes | Reusable quartz cells are essential for UV-range measurements due to high transmission from UV to visible light. Ensure cleanliness and integrity [75]. |
| Certified Reference Materials | Holmium oxide or other certified wavelength filters are critical for instrument calibration and performance verification per pharmacopoeial standards [74] [77]. |
| Technical-Grade Chemicals | High-purity chemicals from reputable suppliers (e.g., Allan Chemical Corp.) reduce impurities that can cause background absorption and contamination, ensuring reliable and reproducible results [77]. |
Optimizing the signal-to-noise ratio in UV-Vis spectroscopy is a systematic process that demands attention to fundamental operational parameters. By rigorously adhering to source warm-up protocols, ensuring precise optical alignment, and strategically selecting sample path length, scientists and researchers can significantly enhance the quality of their analytical data. Mastering these techniques is indispensable in the pharmaceutical industry, where the demand for precise, compliant, and reliable data is paramount for drug development, quality control, and ultimately, patient safety [74] [73].
Addressing Baseline Drift and Inconsistent Readings
In ultraviolet-visible (UV-Vis) spectroscopy, the integrity of analytical data is paramount. Baseline drift and inconsistent readings represent two of the most common yet challenging phenomena that can compromise data accuracy, particularly in regulated environments like pharmaceutical development where results directly impact product quality and patient safety. These issues manifest as gradual shifts or fluctuations in the baseline signal during measurement, introducing systematic errors that affect both qualitative identification and quantitative analysis.
The root causes of these instabilities are multifaceted, often stemming from the complex interplay between instrumental components, environmental conditions, and sample properties. Within the context of UV-Vis light sources and detector technology, understanding these relationships becomes crucial for effective troubleshooting. Modern spectrophotometers represent precisely engineered systems where the light source, wavelength selection device, sample compartment, and detector function as an integrated unit. Degradation or suboptimal performance in any single component—particularly the light source—can propagate through the entire system, manifesting as baseline anomalies and measurement inconsistencies that challenge even experienced analysts.
This technical guide provides a systematic framework for diagnosing and addressing these issues, with particular emphasis on the role of illumination and detection subsystems. By integrating theoretical principles with practical protocols, we aim to equip researchers and drug development professionals with methodologies to identify root causes, implement corrective actions, and establish preventive maintenance routines that ensure data reliability throughout the instrument lifecycle.
Root Cause Analysis: Instrumental and Environmental Factors
Baseline irregularities in UV-Vis spectroscopy typically originate from specific subsystems within the instrument or from external environmental factors. A methodical approach to identifying these sources begins with understanding the characteristic signatures of different failure modes and their impact on spectral quality.
Light Source Degradation and Performance
The illumination subsystem represents the most frequent source of instability in UV-Vis systems. Different lamp types have distinct performance characteristics and failure modes that directly impact baseline stability:
Table: Light Source Characteristics and Failure Modes
| Lamp Type | Typical Lifespan | Primary Spectral Range | Common Failure Indicators |
|---|---|---|---|
| Deuterium | 1,000–3,000 hours [78] | Ultraviolet (190–400 nm) [79] | Output fluctuation, difficulty igniting, reduced intensity at UV wavelengths [78] |
| Tungsten-Halogen | ~2,000 hours [79] | Visible (350–800 nm) [79] | Darkening of bulb, black deposits, reduced visible light intensity [79] |
| Xenon | ~500 hours (xenon arc) [78] | UV-Visible (continuous) [79] | Intensity fluctuations, electrode degradation, color temperature shift [79] |
Light source instability often manifests as inconsistent absorbance readings and baseline drift, particularly when lamps approach or exceed their rated operational lifetimes [78]. The transition point where instruments switch between deuterium and halogen lamps (typically 300–350 nm) often reveals instability through pronounced baseline shifts when either source is degraded [79]. For instruments employing a single xenon lamp, the broader spectral coverage comes with a compromise of shorter lifespan and potentially higher costs [10].
Detector and Optical Path Issues
Following the light source, the detection subsystem and optical path represent critical points where performance degradation can introduce significant noise and drift:
- Detector fatigue: Photomultiplier tubes (PMTs) and semiconductor-based detectors (photodiodes, CCDs) can experience reduced sensitivity over time, increasing noise levels and compromising signal-to-noise ratio, particularly at low light levels [10].
- Optical component contamination: Dust, residues, or chemical films accumulating on mirrors, lenses, or the monochromator diffraction grating scatter light and reduce throughput, contributing to baseline artifacts and reduced overall sensitivity [78].
- Stray light effects: Compromised monochromator performance or internal reflections introduce stray light, which causes deviation from the Beer-Lambert law, particularly at high absorbance values, and elevates the baseline [79]. Stray light contamination can cause UV transmittance values to be higher than actual, skewing final results [80].
Environmental and Operational Factors
External conditions and operator techniques significantly influence measurement stability:
- Temperature and humidity fluctuations: Environmental instability causes dimensional changes in optical components and alters electronic performance. High humidity specifically can reduce detector stability and promote component degradation [80].
- Electrical interference: Noise from adjacent equipment or unstable power supplies introduces random fluctuations that manifest as increased baseline noise [81].
- Sample-related issues: Light scattering from particulates or soluble aggregates in samples leads to baseline artifacts and inaccurate concentration measurements [82]. Improper sample preparation remains a prevalent yet often overlooked contributor to measurement variance [83].
Systematic Troubleshooting Framework
A structured diagnostic approach efficiently isolates the root cause of instability, minimizing instrument downtime and ensuring data quality. The following workflow provides a logical progression from simple verifications to complex instrumental evaluations.
Diagnostic Workflow and Protocol
The systematic troubleshooting pathway methodically eliminates potential causes through verification and testing:
Diagram: Systematic troubleshooting workflow for identifying root causes of baseline issues
Experimental Verification Protocols
Lamp Performance Assessment Protocol
Purpose: To quantitatively evaluate light source stability and output characteristics as a potential source of baseline drift.
Materials:
- UV-Vis spectrophotometer with lamp hour counter
- Appropriate solvent-matched blank
- NIST-traceable wavelength standard (e.g., holmium oxide filter)
- Power meter compatible with UV-Vis wavelengths (optional)
Methodology:
- Access the instrument's system menu to record current usage hours for both deuterium and tungsten-halogen lamps.
- Perform an instrument baseline correction with an empty compartment or appropriate blank.
- Acquire a spectral scan from 200 nm to 800 nm using the appropriate solvent blank.
- Examine the baseline profile for instability, particularly noting:
- Noise magnitude at characteristic wavelengths (e.g., 220 nm, 340 nm, 550 nm)
- Absence of expected lamp transition smoothness (300–350 nm)
- Unusual spectral features or intensity drops
- For quantitative assessment, measure the time-dependent baseline stability at 250 nm (UV) and 500 nm (Vis) over 30 minutes.
Interpretation: Lamp replacement is indicated if: (1) usage exceeds manufacturer's recommended lifespan [78]; (2) baseline noise exceeds 0.001 AU in UV region; (3) significant intensity loss (>50%) is observed at lamp-specific wavelengths; or (4) the baseline drift exceeds 0.005 AU over 30 minutes.
Stray Light Contamination Test
Purpose: To verify monochromator performance and detect optical compartment compromises that contribute to baseline anomalies.
Materials:
- High-purity potassium chloride (KCl)
- Sodium nitrite (NaNO₂)
- Ultrapure water
- Quartz cuvettes (1 cm pathlength)
Methodology:
- Prepare 12 g/L KCl solution for 200 nm testing and 50 g/L NaNO₂ for 340 nm testing [81].
- Using water as blank, measure absorbance of KCl at 200 nm and NaNO₂ at 340 nm.
- Record absorbance values and compare against expected results (typically >2 AU for both solutions).
Interpretation: Significantly lower than expected absorbance values indicate stray light contamination, potentially from grating damage, excessive slit width, or optical component misalignment.
Blank Comparison Methodology for Issue Localization
Purpose: To determine whether observed instability originates from instrumental factors or sample-specific properties.
Materials:
- High-purity solvent matching sample matrix
- Identical matched cuvettes
- Clarified sample solution (0.2 µm filtered)
Methodology:
- Prepare sample solution using standardized protocol.
- Prepare reference blank using identical solvent and processing without analyte.
- Acquire sequential spectra of blank only over expected measurement timeframe.
- If blank remains stable, acquire spectra of sample solution over same duration.
Interpretation: Drift present in blank measurements indicates instrument-related issues, while stable blank with drifting sample suggests sample degradation, precipitation, or matrix interference effects [81].
Research Reagent Solutions and Materials
Proper selection of reagents and materials is fundamental for minimizing measurement artifacts and maintaining baseline stability.
Table: Essential Materials for Reliable UV-Vis Measurements
| Material/Reagent | Specification | Function | Considerations |
|---|---|---|---|
| Spectroscopic Solvents | HPLC/spectrophotometric grade, low UV absorbance | Sample dissolution and blank preparation | Avoid solvents with aromatic contaminants or UV-absorbing stabilizers [83] |
| Quartz Cuvettes | Spectrosil-grade quartz, matched pathlength | Sample containment for UV measurements | Ensure cleanliness; avoid plastic for UV work [10] |
| Buffer Salts | High-purity, low UV background | Maintain sample stability and pH | Phosphate preferred for low-UV; avoid acetate <220 nm [84] |
| Flow-Through Cells | Minimal dead volume, chemical resistant | Process analytical applications | Ensure compatibility with pressure and flow rates |
| Certified Reference Materials | NIST-traceable (e.g., holmium oxide) | Wavelength validation | Verify calibration at multiple points across spectrum |
| Stray Light Standards | KCl (200 nm), NaNO₂ (340 nm) [81] | Stray light verification | Prepare fresh solutions; ensure adequate concentration |
| Filter Membranes | 0.2 µm pore size, low extractables | Sample clarification | Pre-rinse with solvent to remove potential contaminants |
Corrective and Preventive Strategies
Immediate Corrective Actions
Upon identifying the likely source of instability through the diagnostic workflow, targeted interventions can restore instrument performance:
- Lamp replacement protocol: When lamp degradation is confirmed, install new lamp following manufacturer guidelines, then allow appropriate warm-up time (typically 10-30 minutes for deuterium lamps) before performing required alignment procedures [78] [79].
- Optical cleaning procedures: Using compressed air or nitrogen, carefully remove dust from optical surfaces. For more persistent contamination, use spectroscopic-grade methanol and lint-free wipes for external optics only—internal components require professional service.
- Environmental stabilization: Implement vibration damping platforms, temperature control systems (±1°C), and humidity control (maintaining 40-60% RH) to minimize external contributions to baseline drift [80].
Preventive Maintenance Framework
Proactive maintenance strategies significantly reduce unexpected instrument downtime and maintain data quality:
- Lamp usage logging: Maintain rigorous records of lamp operating hours with scheduled replacement at 80% of expected lifetime [78].
- Regular performance validation: Implement daily wavelength and absorbance checks using certified reference materials, with full quarterly performance qualification following ASTM or pharmacopeial standards.
- Preventive cleaning schedule: Establish monthly external optical cleaning and annual professional internal maintenance contracts.
- Standardized operational protocols: Develop instrument-specific SOPs for routine measurements to minimize operator-induced variability, including specified warm-up times, quality control checks, and data acceptance criteria [80] [83].
Advanced Baseline Correction Techniques
For irreducable baseline artifacts, computational approaches can salvage data quality:
- Rayleigh-Mie scattering correction: For samples containing particulates or aggregates, implement fitting algorithms based on fundamental scattering equations to correct spectral baselines, particularly useful in protein and nanoparticle applications [82].
- Multi-point baseline subtraction: For complex matrices, employ baseline correction at multiple wavelength points rather than single-point subtraction to better account for sloping baselines.
- Derivative spectroscopy: Utilize second-derivative or higher-order transformations to minimize broad baseline effects and enhance resolution of overlapping peaks in complex samples.
Baseline drift and inconsistent readings in UV-Vis spectroscopy represent multifactorial challenges requiring systematic investigation and comprehensive solution strategies. Through methodical troubleshooting focused on light source characteristics, detector performance, and environmental conditions, researchers can effectively identify and address the root causes of instrumental instability. Implementation of robust preventive maintenance protocols, combined with appropriate experimental design and sample handling techniques, ensures the generation of reliable, high-quality spectroscopic data essential for pharmaceutical development and research applications. The frameworks presented in this guide provide actionable methodologies for diagnosing instability sources, implementing corrective measures, and establishing preventive practices that maintain instrument performance and data integrity throughout the analytical workflow.
Software and Connectivity Issues in Modern Digital Systems
In the landscape of modern scientific research, digital systems have become indispensable, particularly in advanced analytical fields like UV-Visible (UV-Vis) spectroscopy. For researchers, scientists, and drug development professionals, these systems are critical for data acquisition, processing, and analysis. However, the increasing reliance on digital tools and connectivity has introduced a spectrum of technical challenges that can impede research progress and compromise data integrity. This guide provides an in-depth examination of the core software and connectivity issues affecting digital systems within scientific environments, offering detailed methodologies for diagnosis and resolution, with a specific focus on applications in UV-Vis spectroscopy.
The Current Digital Landscape in Scientific Research
Scientific laboratories are experiencing rapid digital transformation. Recent industry data indicates that 70% of business leaders reported stepped-up use of digital tools and data sources over the past year [85]. In UV-Vis spectroscopy, this trend manifests through the integration of miniaturized and portable spectrometers, advanced software for data processing, and cloud-based data management systems that facilitate remote monitoring and collaborative research [8].
However, this digital expansion has not been without its complications. A significant 56% of leaders in a recent survey indicated that their digital transformation efforts have not yet returned the expected value [85]. The fundamental issue often lies not with the tools themselves, but with their integration and connectivity. When digital tools lack interoperability, they create data silos that complicate rather than streamline scientific workflows, ultimately affecting critical research outcomes in areas like pharmaceutical analysis and materials characterization.
Core Software and Connectivity Challenges: Identification and Analysis
Prevalent Network Issues
Network instability represents a primary obstacle to reliable data transmission in laboratory environments. The following table summarizes the most common network issues and their specific impacts on spectroscopic workflows:
Table 1: Common Network Issues and Their Impact on Scientific Operations
| Network Issue | Primary Causes | Impact on Scientific Workflows |
|---|---|---|
| Slow Internet Connection | Insufficient bandwidth, network congestion, ISP problems [86] | Delays in data upload/download to cloud platforms, disrupted remote instrument monitoring, sluggish access to spectral databases |
| Intermittent Connectivity | Wireless interference, overloaded networks, IP address conflicts, DNS issues [86] | Corrupted data files during transfer, aborted analytical runs, loss of real-time monitoring data for time-sensitive experiments |
| Packet Loss | Network congestion, faulty hardware, suboptimal configurations [86] | Degraded quality in remote spectroscopic analysis, artifacts in spectral data streams, errors in collaborative data analysis sessions |
| VPN Connection Issues | ISP blocking, outdated client software, insufficient bandwidth allocation [86] | Inability to securely access laboratory instruments or data repositories from remote locations, compromising research continuity |
Data Connectivity and Integration Challenges
Beyond basic network connectivity, the integration of data across multiple digital platforms presents significant hurdles. The proliferation of digital tools frequently creates more complexity rather than reducing it [85]. This complexity arises because various instruments and software suites often operate on incompatible platforms, requiring manual data transfer that introduces both inefficiency and the risk of human error.
The consequences are quantifiable: 75% of organizations that increased digital tool usage reported that missed project milestones had a 'detrimental impact' on their organization [85]. For drug development professionals, this can translate directly into delayed research cycles and increased time-to-market for new pharmaceutical products.
Security Vulnerabilities in Connected Systems
The expansion of connected digital tools inevitably increases the attack surface for potential cybersecurity threats. Research indicates that 66% of leaders who increased digital tool usage over the past year raised cybersecurity as a concern [85]. In environments handling sensitive research data, such as spectroscopic analysis of proprietary drug formulations, security breaches could compromise intellectual property or violate regulatory requirements for data integrity.
Experimental Protocols for Diagnosing Connectivity Issues
Methodology for Comprehensive Network Assessment
A systematic approach to diagnosing network issues is fundamental to maintaining uninterrupted research operations. The following workflow provides a structured methodology for identification and resolution:
Figure 1: Diagnostic workflow for identifying and resolving common network issues in research environments.
Protocol for Instrument Connectivity Testing
For spectroscopic applications, maintaining stable connections between instruments and data systems is paramount. The following procedure should be implemented regularly:
- Baseline Performance Measurement: Establish baseline network performance metrics (latency, jitter, packet loss) using tools like
pingandtracerouteduring periods of normal operation. - Instrument Communication Verification: Confirm bidirectional communication between the UV-Vis spectrometer and connected data systems by transmitting calibration data and verifying integrity.
- Data Transfer Validation: Execute controlled transfers of spectral data files of varying sizes, measuring transfer times and verifying data integrity through checksum validation.
- Concurrent Usage Simulation: Simulate realistic network loads by running multiple instruments and data transfers simultaneously to identify bandwidth contention issues.
- Failover Testing: Intentionally disrupt primary network connections to verify backup systems (e.g., secondary internet connections) activate seamlessly.
Software and Data Integration Assessment Method
Evaluate the interoperability of digital tools in your research ecosystem through this structured protocol:
- Data Flow Mapping: Document all data movement between instruments (e.g., UV-Vis spectrometers), processing software, and storage systems.
- API Connectivity Verification: For systems with application programming interfaces (APIs), validate authentication mechanisms and test data request/response cycles.
- Format Compatibility Testing: Transfer data between different analytical software platforms, checking for fidelity loss in spectral data or metadata.
- Manual Intervention Audit: Identify all process steps requiring manual data transfer or reformatting, quantifying the time investment and error rates associated with these tasks.
Strategic Solutions and Implementation Framework
Network Infrastructure Optimization
Addressing the network issues identified in Section 3 requires a multi-layered approach:
- Bandwidth Management: Implement Quality of Service (QoS) policies to prioritize instrumental data traffic over less critical network usage, ensuring reliable data streaming from spectrometers [86].
- Network Segmentation: Create separate virtual LANs (VLANs) for instrumental systems, user devices, and guest access to reduce congestion and improve security [86].
- Hardware Maintenance: Establish a regular schedule for updating router firmware and replacing aging network hardware to prevent failures [86].
- Redundant Connections: Maintain backup internet connections with automatic failover capabilities to preserve data continuity during primary connection outages [86].
Data Integration Architecture
To overcome data siloing and integration challenges, laboratories should adopt platform-based architectures that provide a 'single pane of glass' reflecting contextualized data from many sources [85]. This approach enables:
- Centralized Data Repository: Implementation of unified data lakes that aggregate spectral data, experimental parameters, and results from multiple instrumental sources.
- Standardized Data Formats: Adoption of common data standards (like AnIML for analytical data) to facilitate seamless exchange between different software platforms.
- Middleware Solutions: Deployment of integration platforms that translate and route data between disparate systems, reducing manual intervention.
Cybersecurity Framework for Research Environments
A proactive security posture is essential for protecting valuable research data:
- Multi-Factor Authentication (MFA): Enforce MFA for all systems accessing spectroscopic data, adding an extra layer of security beyond passwords [86].
- Regular Patching: Establish a rigorous schedule for applying security updates to operating systems, instrumental control software, and data analysis applications [86].
- Network Monitoring: Deploy intrusion detection systems specifically configured to monitor instrumental network segments for anomalous data flows.
- Data Encryption: Implement end-to-end encryption for all spectral data transfers, both within the laboratory and to external collaborators.
The Scientist's Toolkit: Essential Research Reagents and Digital Solutions
Successful navigation of software and connectivity challenges requires both technical solutions and strategic approaches. The following table details key components of a robust digital infrastructure for modern research environments:
Table 2: Essential Digital Research Reagents and Solutions
| Tool/Category | Function/Purpose | Implementation Examples |
|---|---|---|
| Network Diagnostic Tools | Identify and resolve connectivity issues | Ping, Traceroute, network protocol analyzers, bandwidth monitoring software |
| QoS-Enabled Network Hardware | Prioritize instrumental data traffic to prevent loss | Routers and switches supporting bandwidth allocation policies |
| API Integration Platforms | Connect disparate software systems | Custom middleware, commercial integration platforms (e.g., MuleSoft, Zapier) |
| Centralized Data Platforms | Unify data access and visualization | Laboratory Information Management Systems (LIMS), Electronic Lab Notebooks (ELN) |
| Cybersecurity Suite | Protect sensitive research data from threats | Firewalls, intrusion detection systems, multi-factor authentication, encryption tools |
| Automated Backup Solutions | Ensure research data continuity and recovery | Cloud backup services, local network-attached storage with versioning capabilities |
| Virtual Private Network (VPN) | Secure remote access to laboratory resources | Enterprise-grade VPN solutions with robust authentication |
| Uninterruptible Power Supply (UPS) | Maintain system operation during power fluctuations | Battery backups for critical network infrastructure and instrumental systems |
Software and connectivity issues present significant but manageable challenges in modern scientific research, particularly in data-intensive fields like UV-Vis spectroscopy. By understanding these challenges through a systematic diagnostic approach and implementing the strategic solutions outlined in this guide, research organizations can transform their digital infrastructure from a source of friction into a competitive advantage. The path forward requires not only adopting new technologies but also developing a digitally mature organization that prioritizes data connectivity, integration, and security as fundamental components of research excellence.
Benchmarking UV-Vis: Validation Protocols and Comparative Analysis with Other Techniques
The International Council for Harmonisation (ICH) provides a harmonized framework for analytical method validation, ensuring that data generated in one region is recognized and trusted worldwide, which is fundamental for global drug development and regulatory submissions [87]. The recent simultaneous release of ICH Q2(R2) on the "Validation of Analytical Procedures" and ICH Q14 on "Analytical Procedure Development" marks a significant modernization of analytical method guidelines [87]. This evolution represents a strategic shift from a prescriptive, "check-the-box" approach to a more scientific, risk-based, and lifecycle-oriented model [88]. For researchers utilizing Ultraviolet-Visible (UV-Vis) spectroscopy and other analytical techniques, this modernized framework emphasizes building quality into a method from the very beginning, guided by an Analytical Target Profile (ATP) that prospectively defines the method's required performance characteristics [87] [88].
This technical guide explores the core validation parameters of specificity, linearity, and repeatability within this updated framework. It places particular emphasis on their critical role and practical application in the context of UV-Vis light source and detector technology, providing researchers and drug development professionals with the detailed methodologies and structured data evaluation strategies needed to ensure regulatory compliance and generate reliable, reproducible results.
Core Principles and Regulatory Framework
The Interplay of ICH Q2(R2) and ICH Q14
ICH Q2(R2) serves as the global reference for what constitutes a valid analytical procedure, outlining the fundamental performance characteristics that must be evaluated to demonstrate a method is fit-for-purpose [87] [89]. The guideline applies to new or revised analytical procedures used for the release and stability testing of commercial drug substances and products, both chemical and biological [89]. ICH Q14 complements Q2(R2) by introducing a systematic, risk-based approach to analytical procedure development, formalizing concepts like the ATP and a lifecycle management approach [87] [88]. For laboratories, this means validation is no longer a one-time event but a continuous process that begins at method development and continues throughout the method's entire operational life [87].
The Role of the Analytical Target Profile (ATP)
The ATP is a prospective summary of the intended purpose of an analytical procedure and its required performance criteria [88]. It is a foundational element introduced in ICH Q14. Before method development or validation begins, the ATP clearly defines what the method needs to achieve: what is the analyte, what are its expected concentrations, and what degree of accuracy, precision, and specificity is required for its intended use [87]. This ATP then directly informs the validation plan and the setting of appropriate acceptance criteria, ensuring the method is designed and validated to be fit-for-purpose from the outset [88].
Deep Dive into Core Validation Parameters
For a UV-Vis spectrometer—an instrument that measures how substances absorb light in the UV and visible spectrum to provide insights into composition, purity, and concentration—demonstrating method validity is paramount [90]. The following sections provide an in-depth analysis of the three key parameters.
Specificity
Definition and Importance: Specificity is the ability of an analytical procedure to assess the analyte unequivocally in the presence of components that may be expected to be present, such as impurities, degradation products, or matrix components [87] [88]. In UV-Vis spectroscopy, this ensures that the absorption signal measured at a specific wavelength can be reliably attributed to the analyte of interest and is free from interference.
Experimental Protocol for Specificity in UV-Vis Spectroscopy:
- Preparation of Solutions: Prepare a minimum of five separate solutions [88]:
- Analyte Standard: The target substance at the target concentration.
- Placebo/Blank Matrix: The sample matrix without the analyte.
- Forced Degradation Samples: The analyte sample subjected to stress conditions (e.g., acid/base hydrolysis, oxidative, thermal, photolytic stress).
- Known Impurities/Related Substances: Individual solutions of potential interferents.
- Spiked Sample: The placebo spiked with the analyte at the target concentration.
- Instrumental Analysis: Scan all solutions across the relevant UV-Vis wavelength range (e.g., 200-400 nm for UV, up to 800 nm for visible light) using a validated spectrophotometer [46]. The instrument typically consists of a light source (e.g., deuterium or xenon arc lamp), a monochromator to select wavelengths, a sample holder, and a detector (e.g., photodiode array) [46].
- Data Analysis and Acceptance Criteria: Overlay the resulting spectra. The method is considered specific if:
- The analyte spectrum shows a clear, unambiguous absorption maximum at the chosen wavelength for quantification.
- The placebo and impurity spectra show no significant absorption (> %T > 99%) at the analyte's quantification wavelength.
- The spectrum of the spiked sample matches the analyte standard, and any degradation products are baseline separated or show no interference.
- For identity tests (e.g., using a diode array detector), the sample spectrum should be an exact match to the reference standard spectrum, often evaluated via software-based library matching [9].
Table 1: Experimental Design for Assessing Specificity in a UV-Vis Assay
| Solution Type | Purpose | Acceptance Criteria |
|---|---|---|
| Analyte Standard | To establish the reference absorption spectrum. | Well-defined absorption maximum. |
| Placebo/Blank | To detect interference from the sample matrix. | No significant absorption at the analyte's λ~max~. |
| Forced Degradation | To demonstrate stability-indicating power. | Degradation products do not interfere with analyte measurement. |
| Known Impurities | To confirm separation from the analyte. | No absorption overlap at the analyte's λ~max~. |
| Spiked Sample | To verify accuracy in the presence of the matrix. | Recovery of 98-102%. |
Linearity
Definition and Importance: Linearity is the ability of an analytical procedure to elicit test results that are directly, or by a well-defined mathematical transformation, proportional to the concentration of analyte in samples within a given range [87] [88]. In UV-Vis spectroscopy, this confirms adherence to the Beer-Lambert law, which states that absorbance is proportional to concentration, forming the basis for accurate quantification.
Experimental Protocol for Linearity in UV-Vis Spectroscopy:
- Preparation of Calibration Standards: Prepare a minimum of five concentration levels across the specified range [88]. A typical range for a UV-Vis assay might be 50% to 150% of the target assay concentration. For example, for a 100 μg/mL assay, prepare standards at 50, 75, 100, 125, and 150 μg/mL.
- Instrumental Analysis: Measure the absorbance of each standard at the predetermined wavelength. It is recommended to analyze each concentration in triplicate to assess repeatability concurrently.
- Data Analysis and Acceptance Criteria:
- Plot the mean absorbance (y-axis) against the concentration (x-axis).
- Perform a linear regression analysis on the data to determine the correlation coefficient (r), slope, and y-intercept.
- The correlation coefficient (r) should be not less than 0.999 for assay methods, demonstrating a strong linear relationship.
- The y-intercept should be statistically indistinguishable from zero, which can be evaluated via a t-test.
Table 2: Summary of Linearity and Range Parameters for a Hypothetical API UV-Vis Assay
| Parameter | Result | Acceptance Criteria |
|---|---|---|
| Concentration Range | 50 - 150 μg/mL | Defined based on the Analytical Target Profile. |
| Correlation Coefficient (r) | 0.9998 | r ≥ 0.999 |
| Slope | 0.0102 | -- |
| Y-Intercept | 0.0021 | Not statistically significant from zero (p > 0.05). |
| Regression Equation | y = 0.0102x + 0.0021 | -- |
Repeatability
Definition and Importance: Repeatability (also referred to as intra-assay precision) expresses the precision under the same operating conditions over a short interval of time [87] [88]. It represents the simplest form of precision, demonstrating the method's inherent reliability when performed by a single analyst using the same equipment and reagents in one session.
Experimental Protocol for Repeatability in UV-Vis Spectroscopy:
- Sample Preparation: Prepare a minimum of six independent samples of a homogeneous sample at 100% of the test concentration. These should be prepared from the same stock solution but through separate, complete weighing and dilution procedures to capture the variability of the entire sample preparation process.
- Instrumental Analysis: Analyze all six samples in a single sequence using the same instrument and a freshly prepared calibration curve.
- Data Analysis and Acceptance Criteria:
- Calculate the mean (average) concentration and the standard deviation (SD) of the six results.
- Calculate the percent relative standard deviation (%RSD), also known as the coefficient of variation (CV): %RSD = (Standard Deviation / Mean) x 100%.
- For a well-controlled UV-Vis assay method, the %RSD should typically be ≤ 1.0%, though the acceptance criteria must be justified based on the method's ATP and the nature of the analyte [88].
Table 3: Example Repeatability (Intra-Assay Precision) Data for a Drug Substance Assay
| Replicate Number | Measured Concentration (μg/mL) | Statistical Summary |
|---|---|---|
| 1 | 100.1 | Mean = 100.2 μg/mL |
| 2 | 99.8 | Standard Deviation (SD) = 0.21 |
| 3 | 100.4 | %RSD = 0.21% |
| 4 | 100.3 | |
| 5 | 99.9 | |
| 6 | 100.4 |
The Scientist's Toolkit: Essential Materials and Reagents
A robust validation study relies on high-quality materials and instrumentation. The following table details key resources for validating a UV-Vis spectroscopic method.
Table 4: Key Research Reagent Solutions and Materials for UV-Vis Method Validation
| Item | Function & Importance in Validation |
|---|---|
| Certified Reference Standard | High-purity analyte material with a certified Certificate of Analysis (CoA). Serves as the primary benchmark for accuracy, linearity, and specificity studies. |
| Qualified Impurity Standards | Chemically defined impurity and degradation product standards. Absolutely critical for conducting a meaningful specificity study and proving the method is stability-indicating. |
| HPLC/Spectroscopic Grade Solvents | High-purity solvents (e.g., methanol, acetonitrile, water) that exhibit low UV absorbance in the spectral range of interest. Minimize background noise and baseline drift, ensuring data integrity. |
| Volumetric Glassware & Micropipettes | Certified Class A volumetric flasks and pipettes. Ensure accuracy and precision in sample and standard preparation, directly impacting results for linearity and repeatability. |
| Validated UV-Vis Spectrophotometer | An instrument with demonstrated performance for parameters like wavelength accuracy, photometric accuracy, and stray light. The foundation for all reliable quantitative measurements. Requires regular calibration [46]. |
| Stable, Flicker-Free Light Source | A consistent light source (e.g., deuterium lamp, pulsed xenon lamp, or modern UV-LED) is critical for signal stability and low noise, which directly affects the precision (repeatability) of measurements [91] [46]. |
Workflow and Data Interpretation
The following diagram illustrates the logical workflow and decision-making process for validating the three core parameters, from experimental setup to final assessment.
Validation Parameter Assessment Workflow
The modernized ICH Q2(R2) and Q14 guidelines provide a science- and risk-based framework that is essential for developing and validating robust, reliable analytical methods. For techniques like UV-Vis spectroscopy, a rigorous assessment of specificity, linearity, and repeatability forms the foundational pillar of this validation process. By adhering to the structured experimental protocols and data interpretation strategies outlined in this guide—and by integrating these parameters within a holistic lifecycle approach that begins with a well-defined Analytical Target Profile—researchers and drug development professionals can ensure their methods are not only compliant with global regulatory standards but also truly fit-for-purpose, thereby guaranteeing the integrity, safety, and quality of pharmaceutical products.
UV-Vis vs. Mass-Based Techniques (Py-GC/MS, TGA) for Nanoplastic Quantification
The accurate quantification of nanoplastics in environmental and laboratory samples represents a significant analytical challenge in modern environmental science. The small size, high surface-to-volume ratio, and dynamic nature of nanoplastics complicate their detection and characterization [54] [92]. While numerous analytical techniques have been developed, each presents distinct advantages and limitations, creating a critical need for comparative evaluation of their performance characteristics. This technical guide provides an in-depth examination of UV-Visible (UV-Vis) spectroscopy alongside established mass-based techniques—pyrolysis gas chromatography-mass spectrometry (Py-GC/MS) and thermogravimetric analysis (TGA)—for nanoplastic quantification. Framed within broader research on UV-Vis light sources and detector technologies, this analysis aims to equip researchers and drug development professionals with the necessary information to select appropriate quantification strategies based on their specific research objectives, sample availability, and instrumentation constraints.
UV-Visible Spectroscopy
UV-Vis spectroscopy operates on the principle of measuring the attenuation of ultraviolet and visible light as it passes through a sample. The technique quantifies nanoplastics based on their light absorption and scattering properties, which correlate with particle concentration [54] [92]. Modern microvolume UV-Vis spectrophotometers offer significant advantages for nanoplastic research, including minimal sample consumption (often 1-2 µL), non-destructive analysis, and rapid measurement times, allowing for sample recovery and subsequent analysis [92]. This makes the technique particularly valuable when sample volumes are limited or when comprehensive characterization using multiple analytical techniques is required. The instrumentation typically consists of a stable light source (deuterium or tungsten lamps for UV and visible regions, respectively), a monochromator for wavelength selection, and a photodiode or photomultiplier tube detector [49]. Advanced systems incorporate microvolume measurement technology that eliminates the need for cuvettes and facilitates highly reproducible measurements of scarce samples.
Mass-Based Techniques
Mass-based techniques provide direct quantification of nanoplastic mass concentration, offering a fundamentally different approach from light-based methods.
Pyrolysis Gas Chromatography-Mass Spectrometry (Py-GC/MS) combines thermal decomposition of polymers at high temperatures (typically 500-800°C) in an inert atmosphere with subsequent separation and identification of the resulting pyrolysis products [93] [94]. The polymer-specific degradation products are separated by gas chromatography and detected by mass spectrometry, providing both identification and quantification capabilities based on characteristic fragment patterns. This technique offers exceptional sensitivity with mass concentration limits of detection reported in the range of 0.04-0.44 µg/L, making it suitable for detecting nanoplastics at environmentally relevant concentrations [95].
Thermogravimetric Analysis (TGA) measures the mass loss of a sample as a function of temperature or time under a controlled atmosphere. For nanoplastic analysis, TGA provides thermal degradation profiles and quantitative information based on the distinctive temperature ranges at which different polymers decompose [94]. When hyphenated with Fourier Transform Infrared spectroscopy (FTIR) and GC/MS (TGA-FTIR-GC/MS), the technique enables comprehensive characterization of polymer composition, functional group analysis of volatile products, and mass spectral profiling of evolved gases, providing a powerful multimodal approach for complex environmental samples [94].
Comparative Performance Analysis
Sensitivity and Detection Limits
The sensitivity of analytical techniques for nanoplastic quantification varies significantly across methods, with each exhibiting distinct limits of detection (LOD) dependent on particle size, polymer type, and sample matrix.
Table 1: Detection Limits of Nanoplastic Quantification Techniques
| Technique | Detection Principle | Limit of Detection (Particles/mL) | Limit of Detection (Mass Concentration) | Key Size Limitations |
|---|---|---|---|---|
| UV-Vis Spectroscopy | Light absorption/scattering | ~6×10⁸ particles/mL (for 100 nm PS) [95] | Not specifically reported | Limited by diffraction and sensitivity for particles <100 nm |
| Py-GC/MS | Mass spectrometry of pyrolysis products | Not specifically reported | 0.04-0.44 µg/L [95] | Essentially none; size-agnostic |
| TGA | Mass loss during thermal decomposition | Not specifically reported | Varies by polymer; generally low µg range | Essentially none; size-agnostic |
| Nanoparticle Tracking Analysis (NTA) | Light scattering and Brownian motion | ~2×10⁷ particles/mL [95] | Not applicable | Limited to >50 nm for polystyrene beads |
| Laser-Induced Breakdown Detection (LIBD) | Plasma formation from laser excitation | 10⁴-10⁶ particles/mL [95] | Not specifically reported | Effective across nanoplastic size range |
Advantages and Limitations
Each quantification technique offers a unique profile of strengths and limitations that must be considered when designing experimental approaches for nanoplastic research.
Table 2: Comparative Advantages and Limitations of Nanoplastic Quantification Techniques
| Technique | Key Advantages | Major Limitations |
|---|---|---|
| UV-Vis Spectroscopy | Rapid analysis; minimal sample requirement; non-destructive; cost-effective; accessible instrumentation [54] [92] | Moderate sensitivity; underestimates concentration vs. mass methods; interference from pigments/additives; limited size discrimination [54] [92] |
| Py-GC/MS | High sensitivity; polymer identification capability; handles complex mixtures; provides additive information [93] [94] | Destructive; complex data interpretation; requires expertise; limited size/shape information [94] |
| TGA | Direct mass measurement; quantitative; minimal sample prep; hyphenation capability [94] | Destructive; no size/shape information; limited to thermally stable polymers; requires reference materials [94] |
Experimental Protocols and Methodologies
UV-Vis Spectroscopy Protocol for Nanoplastics
The following protocol outlines the standardized methodology for quantifying nanoplastics using microvolume UV-Vis spectroscopy, adapted from Ducoli et al. (2025) [92]:
Sample Preparation:
- Generate true-to-life nanoplastics through mechanical fragmentation of source plastics (e.g., polystyrene objects) using an ultracentrifugal mill operating under cryogenic conditions [92].
- Separate nanoplastics from microplastics through sequential centrifugation: suspend plastic powder in MilliQ water (0.1 g:30 mL ratio) and perform differential centrifugation cycles [92].
- Use unpigmented white plastics to avoid interference from pigments in UV-Vis extinction spectra [92].
- For calibration, use monodisperse polystyrene nanobeads of known sizes (100, 300, 600, 800, 1100 nm) as reference materials [92].
Instrumentation and Measurement:
- Utilize a microvolume UV-Vis spectrophotometer with capability for small-volume measurements (typically 1-2 µL) [92].
- Measure absorbance across the UV-Vis spectrum (200-800 nm), noting the characteristic absorption peak for polystyrene at approximately 260 nm [92].
- Perform triplicate measurements for each sample to ensure reproducibility.
- Employ appropriate blank measurements (MilliQ water) for background subtraction.
Data Analysis:
- Establish calibration curves using serial dilutions of reference nanoplastic materials.
- Correlate absorbance measurements at characteristic wavelengths with particle concentration.
- Account for potential scattering contributions, particularly for larger nanoplastic particles.
Py-GC/MS Protocol for Nanoplastics
Sample Preparation:
- Concentrate nanoplastic samples through filtration or evaporation if dealing with environmental waters [93].
- Transfer precise aliquots (typically 1-100 µg) to pyrolysis cups or tubes.
- For complex environmental matrices, implement pre-cleaning steps to remove organic matter if necessary.
Instrumentation Parameters:
- Pyrolysis temperature: 500-800°C (polymer-specific) in an inert atmosphere [94].
- GC separation using appropriate capillary columns (e.g., 5% phenyl polysiloxane) with temperature programming.
- MS detection in electron impact (EI) mode with characteristic ion monitoring for target polymers.
- Quantification based on polymer-specific pyrolysis markers (e.g., styrene monomer for polystyrene) [94].
TGA Protocol for Nanoplastics
Sample Preparation:
- Precisely weigh nanoplastic samples (typically 5-20 mg) into TGA crucibles.
- Ensure homogeneous distribution for representative analysis.
Instrumentation Parameters:
- Temperature range: 25-900°C with controlled heating rate (typically 10-20°C/min) [94].
- Inert atmosphere (nitrogen or argon) for pyrolytic conditions.
- Record mass loss as a function of temperature.
- For hyphenated TGA-FTIR-GC/MS, transfer evolved gases to coupled instruments for simultaneous analysis [94].
Advanced Technical Considerations
Method Selection Workflow
The following diagram illustrates a systematic approach for selecting the appropriate nanoplastic quantification technique based on research objectives and sample characteristics:
Integrated Workflow for Comprehensive Characterization
For comprehensive nanoplastic analysis, an integrated approach combining multiple techniques provides the most complete characterization:
Research Reagent Solutions and Essential Materials
Successful nanoplastic quantification requires specific research reagents and materials tailored to each analytical technique.
Table 3: Essential Research Reagents and Materials for Nanoplastic Quantification
| Category | Specific Items | Function/Application | Technical Notes |
|---|---|---|---|
| Reference Materials | Polystyrene nanobeads (100, 300, 600, 800, 1100 nm) [92] | Calibration standards for UV-Vis and NTA | Aqueous suspensions (10% w/v); monodisperse |
| Sample Preparation | MilliQ water [92] | Suspension medium for nanoplastics | High purity to minimize interference |
| Ultracentrifugal mill [92] | Mechanical fragmentation of plastics | Cryogenic operation for efficient size reduction | |
| Solvents & Carriers | High-purity gases (N₂, He, Ar) [94] | Carrier gases for Py-GC/MS and TGA | Oxygen-free for pyrolysis applications |
| Consumables | Pyrolysis cups/tubes [94] | Sample holders for Py-GC/MS | Inert materials to prevent contamination |
| TGA crucibles [94] | Sample holders for TGA | Chemically inert, high-temperature stable |
The quantification of nanoplastics remains a challenging yet essential endeavor for environmental monitoring and toxicological assessment. UV-Vis spectroscopy offers a rapid, accessible, and non-destructive approach particularly valuable for initial screening and when sample volumes are limited, despite its moderate sensitivity and tendency to underestimate concentrations compared to mass-based techniques [54] [92]. In contrast, mass-based methods including Py-GC/MS and TGA provide superior sensitivity, polymer-specific identification, and direct mass quantification, albeit with destructive analysis and more complex operational requirements [93] [94]. The optimal quantification strategy often involves a complementary approach that leverages the strengths of multiple techniques, with UV-Vis serving as an efficient screening tool followed by more specific mass-based analysis for definitive quantification and characterization. As detection technologies continue to advance, particularly in UV light sources and detector sensitivity, the performance and applicability of these techniques for nanoplastic research will further improve, enabling more accurate risk assessments and environmental monitoring in the future.
Comparative Analysis with FT-IR and Raman Spectroscopy
Fourier Transform-Infrared (FT-IR) and Raman spectroscopy are two pivotal analytical techniques in the molecular scientist's toolkit. Both methods probe the vibrational energies of chemical bonds, providing unique "fingerprints" for compound identification and characterization [96]. Despite this common goal, they operate on fundamentally different physical principles, leading to complementary strengths and applications across diverse fields from pharmaceutical development to forensic science [97] [98]. This guide provides an in-depth technical comparison of these techniques, framed within the broader context of spectroscopic analysis that includes UV-Vis light sources and detector technologies.
The core distinction lies in their underlying mechanisms: FT-IR spectroscopy measures the absorption of infrared light by molecular bonds, while Raman spectroscopy relies on the inelastic scattering of monochromatic light [96] [99]. For researchers and drug development professionals, understanding this distinction is crucial for selecting the optimal method for specific analytical challenges, whether it involves quantifying active pharmaceutical ingredients (APIs), characterizing polymer structures, or identifying unknown compounds in forensic evidence [98] [100].
Fundamental Principles and Instrumentation
Core Physical Principles
The selection rules governing vibrational spectroscopy dictate that molecular vibrations that are strong in IR are often weak in Raman, and vice versa. This complementarity arises from different excitation mechanisms: FT-IR requires a change in dipole moment during vibration, whereas Raman scattering depends on a change in polarizability of the electron cloud [97] [101].
FT-IR Spectroscopy utilizes an interferometer that splits an infrared beam, creating an interferogram that is subsequently Fourier-transformed into a frequency-domain spectrum [96]. Modern FT-IR instruments often incorporate Attenuated Total Reflectance (ATR) accessories featuring diamond hemispheres, enabling direct sample contact measurement without extensive preparation while effectively overcoming challenges from specular or diffuse scattering [97].
Raman Spectroscopy employs monochromatic laser sources (commonly 532 nm, 785 nm, or 1064 nm) to excite samples. When photons interact with molecules, most scatter elastically (Rayleigh scattering), but approximately 1 in 10⁷ photons undergo inelastic (Raman) scattering, shifting in energy by an amount equal to molecular vibrational frequencies [96] [100]. Modern Raman systems utilize charge-coupled devices (CCDs) and holographic notch filters for efficient signal collection, making the technique increasingly accessible and effective for problem-solving [97].
Key Instrumentation Components
The integration of FT-IR and Raman with microscopy platforms enables microscopic vibrational characterization of solid and liquid materials without destruction or modification [97]. Combination instruments controlled by unified software can record both Raman and IR maps from identical sample regions, providing correlated vibrational characterization [97].
Advanced detector technologies include mercury-cadmium-telluride (MCT) detectors for FT-IR, which offer high sensitivity across the infrared region [97]. For Raman systems, the choice of laser wavelength significantly impacts results: near-infrared lasers (785 nm, 1064 nm) minimize fluorescence, while visible lasers (532 nm, 633 nm) may benefit from resonance enhancement effects in colored compounds but risk sample heating or fluorescence interference [100].
Figure 1: Instrumentation workflows for FT-IR and Raman spectroscopy
Technical Comparison and Complementary Applications
Comparative Analysis of Techniques
Table 1: Fundamental comparison between FT-IR and Raman spectroscopy
| Parameter | FT-IR Spectroscopy | Raman Spectroscopy |
|---|---|---|
| Physical Principle | Absorption of infrared radiation | Inelastic scattering of monochromatic light |
| Selection Rule | Change in dipole moment | Change in polarizability |
| Spectral Range | Typically 4000-400 cm⁻¹ | Typically 4000-50 cm⁻¹ |
| Water Compatibility | Strong interference due to water absorption | Minimal water interference; ideal for aqueous solutions |
| Spatial Resolution | ~5-20 µm with microscopy | <1 µm with confocal microscopy |
| Sample Preparation | Minimal with ATR; may require pressing pellets for transmission | Minimal; can analyze through transparent containers |
| Key Strengths | Excellent for polar functional groups (C=O, O-H, N-H); identification of organic compounds | Sensitive to symmetric bonds & non-polar structures (C-C, S-S); ideal for inorganic materials & aqueous samples |
Complementary Spectral Information
The complementary nature of FT-IR and Raman is exemplified in polymer analysis. Figure 2 shows spectra of silicone (polydimethylsiloxane) where strong IR absorptions correspond to weak Raman bands, and vice versa [97]. This complementarity enables more complete molecular characterization than either technique alone.
In catalysis research, this combination proves particularly powerful. IR spectroscopy effectively monitors organic reactants and products, while Raman provides superior information about the state of catalytic surfaces, especially metal oxides [97]. This dual approach enables Operando measurements under realistic process conditions, simultaneously tracking reaction pathways and catalyst structural changes [97].
Figure 2: Decision pathway for technique selection based on sample properties and analytical requirements
Experimental Protocols and Methodologies
Analysis of Chlorogenic Acid in Protein Matrices
The quantification of chlorogenic acid in sunflower meal demonstrates a practical application combining both techniques [102]. This protocol enables rapid, non-destructive monitoring of phenolic compounds in plant-based protein sources without extensive sample preparation.
Materials and Reagents:
- Chlorogenic acid standard (≥98% purity)
- Bovine Serum Albumin (BSA) (≥98% purity)
- Sunflower meal (cold-pressed)
- Potassium bromide (KBr) (≥99%) for FT-IR pellets
- Hydraulic press for tablet formation
Raman Spectroscopy Protocol:
- Prepare calibration standards by mixing 2-20 mg chlorogenic acid with 198-180 mg BSA to create concentrations of 1-10% w/w
- Compact mixtures into tablets using hydraulic press (~200 kPa pressure for 90 seconds)
- Perform Raman mapping using 532 nm laser on 10×10 grid with 555 µm step size
- Set acquisition parameters: 10-second accumulation time, 2 accumulations per spectrum
- For sunflower meal samples, mix 20 mg chlorogenic acid standard with 180 mg sunflower meal to create 10% w/w model system
- Record spectra identical to calibration standards
FT-IR Spectroscopy Protocol:
- Mix 2 mg of sample with 148 mg KBr
- Compact mixture using hydraulic press at ~200 kPa pressure
- Acquire transmission FT-IR spectra in range 4000-400 cm⁻¹
- Use 4 cm⁻¹ resolution for optimal signal-to-noise ratio
Results Interpretation: The FT-IR method achieved a limit of detection (LOD) of 0.75 wt% for chlorogenic acid in sunflower meal, while Raman spectroscopy achieved 1 wt% LOD [102]. The measured chlorogenic acid content in sunflower meal (5.6 wt%) was confirmed by reference methods (UV-spectroscopy and HPLC), validating the vibrational spectroscopy approaches [102].
Forensic Analysis of Pigmented Fibers
The characterization of colored fibers demonstrates the complementary strengths of FT-IR and Raman for trace evidence analysis [100].
Sample Preparation:
- Produce fibers several hundred micrometers in diameter from glue stick base material
- Disperse pigments (Graphtol Blue, Graphtol Bordeaux, PV Fast Blue, etc.) at 1-10% concentration levels
- Mount fibers on microscope slides for analysis
FT-IR Analysis:
- Use FT-IR microscope with ATR diamond objective
- Set acquisition parameters: 128 scans at 4 cm⁻¹ resolution
- Collect spectra in the range 4000-650 cm⁻¹
- Focus on fingerprint region (1500-500 cm⁻¹) for pigment identification
Raman Analysis:
- Compare multiple excitation wavelengths (532 nm, 633 nm, 785 nm, 1064 nm)
- Adjust laser power (0.25-0.5 W) to avoid sample damage
- For dispersive Raman: use 100× LWD objective (NA=0.8)
- Set acquisition times between 30 seconds to 3 minutes depending on signal intensity
- Apply fluorescence background subtraction when necessary
Results Interpretation: FT-IR spectra primarily revealed the fiber composition with minor pigment contributions, while Raman spectra (particularly with 785 nm excitation) strongly highlighted pigment signatures due to preresonance effects [100]. The study demonstrated that Raman bands remained consistent across excitation wavelengths, enabling reliable pigment identification regardless of laser source [100].
Essential Research Reagent Solutions
Table 2: Key reagents and materials for FT-IR and Raman spectroscopy experiments
| Reagent/Material | Function/Application | Technical Specifications |
|---|---|---|
| Potassium Bromide (KBr) | FT-IR sample preparation for transmission measurements | FT-IR grade, ≥99% purity, transparent in mid-IR region |
| Diamond ATR Crystals | FT-IR sampling by attenuated total reflectance | Type IIa diamond, high refractive index, chemical inertness |
| Chlorogenic Acid Standard | Calibration standard for phenolic compound analysis | ≥98% purity, for quantitative analysis |
| Bovine Serum Albumin (BSA) | Protein matrix for model systems in biomolecular analysis | ≥98% purity, low fluorescence background for Raman |
| Pigment References | Forensic standards for fiber analysis | Graphtol series, PV Fast series at various concentrations (1-10%) |
| Calibration Standards | Instrument performance verification | Polystyrene, sulfur, rare earth oxides for wavelength calibration |
Advanced Applications and Future Perspectives
Pharmaceutical and Biomedical Applications
The combination of FT-IR and Raman spectroscopy has revolutionized pharmaceutical analysis, particularly in controlled substance testing and personalized medicine. Handheld Raman instruments like the TruNarc Delta enable non-contact identification of narcotics and fentanyl analogs through sealed containers, protecting officers from exposure to potent substances [98]. These field-based presumptive tests are complemented by laboratory FT-IR confirmation, creating an integrated workflow from crime scene to courtroom [98].
In pharmaceutical manufacturing, Transmission Raman Spectroscopy (TRS) combined with partial least squares regression (PLSR) enables non-destructive, volumetric drug quantification in 3D-printed extended-release tablets (printlets) [103]. This approach supports quality control in decentralized manufacturing of personalized medicines, accurately predicting drug content across different printlet sizes (R² = 0.9948, RMSEP = 0.5611% w/w) without destroying samples [103].
FT-IR spectroscopic imaging advances include microfluidic channels for in-line monitoring of protein formulations during bioprocessing [104]. Multi-channel designs enable high-throughput comparison of protein formulations under different conditions, reducing experimental variability [104]. This technology shows particular promise for monitoring therapeutic antibodies during protein A chromatography, the key isolation step for monoclonal antibodies [104].
Emerging Trends and Technological Frontiers
Future developments in vibrational spectroscopy focus on integrating advanced light sources and detector technologies. Quantum Cascade Lasers (QCL) offer powerful alternative infrared sources for FT-IR imaging, potentially enhancing signal-to-noise ratios and spatial resolution [104]. The combination of machine learning with spectroscopic imaging will further expand capabilities for process analytical technologies (PAT) in biopharmaceutical manufacturing [104].
The frontier of spectroscopic imaging includes correcting for chromatic aberration, reducing light scattering, and improving spatial resolution through innovative optical designs [104]. As these technologies mature, FT-IR and Raman spectroscopic imaging will become increasingly prevalent for routine online monitoring in purification processes and inline analysis using specialized fiber optics [104].
For drug development professionals, these advancements translate to more robust analytical tools for characterizing complex biologics, monitoring reaction pathways in catalysis, and ensuring product quality throughout manufacturing. The complementary information provided by FT-IR and Raman spectroscopy, especially when integrated with computational analysis and machine learning, provides a comprehensive platform for understanding molecular structure and behavior across the research and development pipeline.
Hemagglutination assays are foundational techniques in virology, serology, and blood typing that leverage the natural ability of viruses and antibodies to cross-link red blood cells (RBCs). For decades, these assays have been read visually by trained technicians, introducing subjectivity and limiting quantitative analysis. The integration of UV-Vis spectroscopy and advanced optical detection methods represents a paradigm shift, enabling researchers to transform this qualitative biological phenomenon into robust, quantitative data.
This technical guide explores the correlation between optical measurements—specifically absorbance (optical density, OD)—and the biological events in hemagglutination. Framed within a broader overview of UV-Vis light sources and detector technology, we detail how modern instrumentation provides researchers and drug development professionals with powerful tools to quantify antibody titers, assess vaccine efficacy, and develop novel diagnostics with unprecedented precision and throughput.
Fundamentals of Hemagglutination Biology and Optics
The Biological Basis of Hemagglutination
Hemagglutination is an aggregation event triggered by the specific interaction between surface antigens on red blood cells and complementary binding agents. The primary biological events can be categorized as follows:
- Viral Hemagglutination: Many viruses, such as influenza, Newcastle Disease Virus (NDV), and SARS-CoV-2, possess surface proteins (e.g., hemagglutinin or hemagglutinin-neuraminidase, HN) that bind to sialic acid receptors on the surface of RBCs. A single virus can bind to multiple RBCs, forming a visible lattice structure [105] [106].
- Antibody-Mediated Hemagglutination: In blood typing and serological assays, antibodies (e.g., Anti-A, Anti-B) cross-link RBCs by binding to specific surface antigens (A, B, RhD) [107] [108]. This same principle is exploited in serology to detect patient antibodies against a target virus, as seen in a quantitative Haemagglutination test (HAT) for SARS-CoV-2 antibodies [109].
The fundamental readout is binary: a positive result (agglutination) forms a diffuse mat of cells, while a negative result (no agglutination) allows RBCs to settle into a compact "button" at the bottom of a well [106].
Optical Principles of Absorbance Measurement
Ultraviolet-Visible (UV-Vis) spectroscopy measures the attenuation of light as it passes through a sample. The primary measured value is Absorbance (Optical Density, OD), which is quantitatively related to the properties of the sample via the Beer-Lambert law.
In the context of hemagglutination assays, the critical optical property being measured is light scattering by particles in suspension—namely, red blood cells and their aggregates. The size and distribution of these particles directly influence the measured OD signal:
- Non-Agglutinated State: In a negative sample, RBCs settle rapidly out of suspension. The supernatant becomes relatively clear, resulting in low absorbance/low light scattering. The settled cell button contributes minimally to the path-length OD measurement [107].
- Agglutinated State: The cross-linked lattice of RBCs forms larger aggregates that remain suspended in the solution column. These larger structures scatter significantly more light, leading to a higher measured absorbance value [107] [108].
This correlation between the biological state of the RBCs and the optical signal forms the basis for quantitative hemagglutination assays. Advanced optical systems can be fine-tuned to maximize this signal-to-noise ratio, for instance, by using 3D-printed apertures to eliminate background scatter from microfluidic chip materials [107].
Diagram 1: Optical principle of hemagglutination assays. The agglutination state of red blood cells (RBCs) directly affects light scattering, which is quantified as absorbance by a detector.
Quantitative Correlation Between Absorbance and Agglutination
The transition from qualitative visual reading to quantitative optical measurement allows for precise determination of antibody titers and viral concentrations. The relationship between absorbance and the biological event is not linear but rather follows a characteristic sigmoidal trend that reflects the underlying logistics of the aggregation process.
Key Quantitative Relationships
Table 1: Correlation of Absorbance with Hemagglutination Assay Parameters
| Assay Parameter | Correlation with Absorbance (OD) | Experimental Significance |
|---|---|---|
| Antibody Concentration | OD decreases with increasing inhibitory antibody concentration [106]. | Used to determine the HI titer, defined as the highest serum dilution that completely inhibits agglutination [105] [106]. |
| Viral Antigen Load | OD increases with higher viral/antigen concentration until a saturation point is reached [107]. | Used in HA Titration to standardize antigen amount for HI assays (e.g., 4-8 HA units/25 µL) [106]. |
| Red Blood Cell Concentration | Higher RBC % (v/v) increases the baseline OD and the dynamic range of the signal [109]. | Must be standardized; typically 0.5-1.0% v/v is used in microtiter plates [109] [106]. |
| Degree of Agglutination | A diffuse mat of cells (positive) yields high OD; a tight button (negative) yields low OD [107] [108]. | Enables detection of weak agglutination invisible to the human eye [108]. |
The critical threshold for a positive result is determined by establishing a cutoff OD value that distinguishes agglutinated from non-agglutinated samples with high statistical confidence. This is often calculated as the mean OD of negative controls plus a multiple (e.g., 2 or 3) of the standard deviation. Research has demonstrated that this method can achieve high sensitivity (90%) and specificity (99%) for detecting antibodies, as shown in a HAT for SARS-CoV-2 [109].
Advanced Experimental Protocols
This section provides detailed methodologies for implementing absorbance-based hemagglutination detection, from standard plate-based assays to cutting-edge microfluidic applications.
Protocol 1: Microplate-Based Hemagglutination Inhibition (HI) Assay with OD Readout
This protocol is adapted from established WHO methods and recent research for quantifying influenza-specific antibody titers [106] [105].
Workflow Overview:
Diagram 2: HI Assay workflow for antibody titer determination.
Detailed Methodology:
Step 1: Serum Sample Preparation
Step 2: Hemagglutination (HA) Antigen Titration
- Objective: Determine the concentration of viral antigen to use in the HI assay.
- Serially dilute the antigen in a V-bottom microtiter plate. Add an equal volume of standardized RBC suspension (e.g., 0.75% chicken RBCs for influenza A/H1N1).
- Incubate for 30-60 minutes at room temperature until negative control cells form a tight button.
- The HA Unit is defined as the highest dilution causing complete hemagglutination. Use 4-8 HA Units per 25 µL in the subsequent HI assay [106].
Step 3: Hemagglutination Inhibition (HI) Assay Setup
- Perform serial twofold dilutions of the pre-treated serum sample across a V-bottom microtiter plate using a phosphate-buffered saline (PBS) diluent.
- Add a standardized volume of antigen (containing 4-8 HA Units) to each well. Include serum-only (negative) and antigen-only (positive agglutination control) wells.
- Incubate for a fixed period (e.g., 30-60 min) to allow antibody-antigen binding.
Step 4: Red Blood Cell Addition and Incubation
- Add an equal volume of the appropriate RBC suspension to all wells.
- Gently tap the plate to mix and incubate undisturbed at room temperature until the RBCs in the negative control wells have fully settled into a compact button (30-90 minutes, depending on RBC species and plate type) [106].
Step 5: Absorbance Measurement
- Read the plate using a microplate reader capable of absorbance measurements.
- A wavelength of 540-600 nm is typically used, as hemoglobin has significant absorption in this green region.
- Do not tilt the plate prior to reading, as this would disrupt the settled cell patterns.
Step 6: Data Analysis and Titer Determination
- The HI titer is the reciprocal of the highest serum dilution that causes complete inhibition of hemagglutination, corresponding to a low OD value similar to the negative control.
- Seroprotection is often defined as an HI titer of ≥1:40 [106].
Protocol 2: On-Chip Hemagglutination Detection via Optical Density
Recent advances have miniaturized hemagglutination assays into microfluidic devices, enabling low-volume, rapid analysis ideal for point-of-care diagnostics [107].
Workflow Overview:
Diagram 3: On-chip hemagglutination detection workflow.
Detailed Methodology:
Step 1: Microfluidic Chip Fabrication
- Fabricate a 3D microtrap chip using high-resolution Digital Light Processing (DLP) 3D printing to create a mold.
- Use PDMS casting on the 3D-printed mold to create a chip with embedded microchannels and microwells designed to trap RBCs and promote efficient mixing with antibodies [107].
Step 2: Sample Loading and Reaction
- Load 50 µL of whole blood into the microchannel by slowly pushing the pipette plunger. From the outlet, quickly pull the plunger to snap back, inducing a fast flow rate that traps whole blood droplets in the microwell regions.
- Load 50 µL of antibody reagent (e.g., Anti-A, Anti-B for blood typing) by slowly pushing the plunger, allowing it to interact with the trapped RBCs and induce hemagglutination [107].
Step 3: Optical Density Measurement Setup
- Align a 3D-printed aperture between the light source and the detector to isolate the optical signal from the microchannel, effectively eliminating the background brightness of the chip material itself.
- This pure absorbance signal is critical for obtaining a high signal-to-noise ratio [107].
Step 4: Data Acquisition and Interpretation
- Measure the OD signal from the microchannels. A significant OD difference will be observed between channels where agglutination has occurred (high OD) and those where it has not (low OD).
- This system can be fully automated and integrated into portable diagnostic devices [107].
The Scientist's Toolkit: Essential Reagents and Materials
Table 2: Key Research Reagent Solutions for Hemagglutination Assays
| Reagent/Material | Function & Role in Assay | Specification Notes |
|---|---|---|
| Red Blood Cells (RBCs) | The primary indicator particle; their agglutination is the measured event. | Species-dependent (Chicken, Turkey, Guinea Pig, Human O−). Use at 0.5-1.0% v/v in PBS [106]. |
| Viral Antigen | The agglutinating agent for HI assays or the target for vaccine evaluation. | Must be titrated to define Hemagglutinating Units (HU) prior to HI assay use [105] [106]. |
| Receptor Destroying Enzyme (RDE) | Removes non-specific inhibitors from mammalian serum to prevent false positives. | Derived from Vibrio cholerae filtrate. Critical for human serum pre-treatment [105] [106]. |
| Reference Sera | Positive and negative controls for assay validation and titer calculation. | Positive control should have a known HI titer. Negative control should be from a pathogen-free source [105]. |
| Fusion Proteins (e.g., IH4-RBD) | Engineered reagents that coat RBCs with a target antigen for antibody detection. | Enables serological HATs. e.g., IH4-RBD for SARS-CoV-2 antibody detection [109]. |
| Microfluidic Chips | Miniaturized platforms for low-volume, high-throughput, or point-of-care testing. | 3D-printed microtrap chips with microwells can enhance mixing and reaction efficiency [107]. |
Integration with Modern UV-Vis Detector Technology
The transition from visual interpretation to quantitative absorbance measurement is enabled by advancements in UV-Vis spectrometer technology, which are increasingly suited for high-throughput and point-of-care applications.
- Detector Types: Modern microplate readers and dedicated instruments utilize Photodiode Array (PDA) Detectors for simultaneous multi-wavelength measurement, which is ideal for kinetic studies and endpoint determination in 96-well or 384-well plates [46] [64]. Scanning Monochromator Detectors offer high spectral resolution for method development [46].
- Light Sources: Stable deuterium or xenon arc lamps provide consistent output across the UV-Vis spectrum, which is critical for obtaining reproducible OD measurements over time and across instrument platforms [46] [64].
- Trends and Innovations: The field is moving toward miniaturization and portability, with handheld and portable spectrometers becoming more powerful. Furthermore, integration with AI-driven data analysis and automation is streamlining workflow from data acquisition to titer interpretation, a trend expected to accelerate through 2025 and beyond [9] [64].
The correlation between absorbance and biological events in hemagglutination assays has moved this classic technique from the realm of subjective visual assessment to the world of precise quantitative analysis. By leveraging the principles of UV-Vis spectroscopy and modern detector technology, researchers can now obtain robust, numerical data on antibody titers and viral presence.
This technical guide outlines the fundamental principles, provides actionable protocols, and highlights the essential tools required to successfully implement these methods. As optical technology continues to advance, becoming more integrated, automated, and accessible, absorbance-based hemagglutination assays will undoubtedly play an increasingly critical role in accelerating vaccine development, serological surveillance, and clinical diagnostics.
Assessing Sensitivity and Limits of Detection for Complex Matrices
Ultraviolet-visible (UV-Vis) spectroscopy is an analytical technique that measures the amount of discrete wavelengths of UV or visible light absorbed by or transmitted through a sample. The technique relies on the principle that molecules undergo electronic transitions when they absorb light energy, promoting electrons to higher energy states. The wavelength of absorption provides qualitative information about molecular structure, while the intensity of absorption enables quantitative determination of concentration via the Beer-Lambert law [10].
For researchers dealing with complex matrices—such as environmental samples, biological fluids, or pharmaceutical formulations—understanding and optimizing the sensitivity and limits of detection (LOD) is paramount. The fundamental relationship between absorbance (A), molar absorptivity (ε), pathlength (L), and concentration (c) is defined by Beer-Lambert's law: A = εcL [10]. This relationship forms the theoretical foundation for all detection limit calculations in UV-Vis spectroscopy.
The practical limit of detection in UV-Vis is fundamentally constrained by the instrument's signal-to-noise ratio (S/N). As sample concentration decreases, the measured signal represents an increasingly small difference between two large values (the sample and blank intensities), making the measurement vulnerable to instrumental noise [110]. This noise becomes a progressively larger proportion of the measured difference as concentrations decrease, ultimately establishing the practical detection limit.
Key Factors Influencing Sensitivity and Detection Limits
Instrumental Parameters
Table 1: Instrumental Factors Affecting UV-Vis Detection Limits
| Factor | Impact on Sensitivity | Optimization Strategy |
|---|---|---|
| Spectral Bandwidth | Narrower bandwidth provides higher resolution and accuracy but reduces energy to detector [111] | Match bandwidth to absorption peak width; typically 5-8 nm for most applications [7] |
| Path Length | Longer pathlength increases absorbance proportionally [10] | Use 10 mm standard cells; micro-cells for scarce samples; longer pathlength cells for dilute samples |
| Stray Light | Causes negative deviations from Beer-Lambert law, especially at high absorbances [111] | Use double monochromator for high absorbance work; ensure proper instrument maintenance |
| Detector Noise | Directly impacts minimum detectable signal [110] | Modern detectors achieve noise specifications of <±1×10⁻⁵ AU [7] |
| Light Source Stability | Affects baseline stability and noise [10] | Allow sufficient warm-up time; replace aging deuterium or tungsten lamps |
The optical components and electronic systems of a spectrophotometer collectively determine its fundamental detection capabilities. Modern UV-Vis detectors employ various technologies including photomultiplier tubes (PMT), photodiodes, and charge-coupled devices (CCD), each with distinct advantages for specific sensitivity requirements [10]. The flow cell design is particularly critical in HPLC-UV applications, where typical cell volumes range from 8-18 µL for conventional HPLC to 0.5-1 µL for UHPLC applications [7].
Sample-Specific Considerations
Table 2: Sample-Related Factors Affecting Detection Limits
| Factor | Effect on Detection | Mitigation Approach |
|---|---|---|
| Molar Absorptivity (ε) | Higher ε provides stronger absorbance signal [10] | Select wavelength at absorption maximum (λmax); consider derivatization for weak chromophores |
| Matrix Effects | Complex matrices can cause scattering or background absorption [112] | Implement sample cleanup; use matrix-matched blanks; standard addition methods |
| Solvent Transparency | Solvent must be transparent at measurement wavelength [111] | Use high-quality solvents with appropriate UV cutoffs; water, acetonitrile, hexane for low UV |
| Interfering Substances | Co-eluting compounds with overlapping spectra [113] | Improve separation; use multi-wavelength monitoring; derivative spectroscopy |
For complex matrices, the sample preparation and cleanup procedures often become the limiting factor in achieving theoretical detection limits. The presence of interfering substances, particulate matter, or background absorption from the matrix can significantly elevate practical detection limits compared to ideal solvent-based standards [112].
Methodological Approaches for Enhanced Detection
Sample Preparation and Derivatization
In complex matrices, selective chromogenic reagents can dramatically improve both sensitivity and selectivity. These reagents form highly absorbing complexes with target analytes, simultaneously increasing the molar absorptivity and providing selective recognition. Examples include:
- Cyanide detection: Using (E)-N′-((2-hydroxynaphthalen-1-yl)methylene)picolinohydrazide (HL) probe in semi-aqueous solution, achieving detection limits of 7.08 μM [113]
- Lead detection: Employing dibromo-p-methyl-carboxyazo (DBMCA) in 0.25 M phosphoric acid medium, forming a 1:2 blue complex with sensitivity absorption peak at 646 nm and detection limit of 2.12 μg/mL [112]
- Gold nanoparticle probes: Utilizing tunable Localized Surface Plasmon Resonance (LSPR) properties and enzyme-like activity for colorimetric sensing [114]
The derivatization process typically involves optimizing pH, solvent composition, reagent concentration, reaction time, and temperature to maximize complex formation while minimizing side reactions.
Advanced Detection Strategies
Table 3: Comparison of Detection Techniques for Complex Matrices
| Technique | Detection Principle | Typical LOD Advantage | Applications |
|---|---|---|---|
| Conventional UV-Vis | Direct absorption measurement | Baseline for comparison | General quantitative analysis |
| Fluorescence Spectroscopy | Measurement of emitted light perpendicular to excitation beam | Up to 1000x lower than UV-Vis [110] | Tagged molecules; native fluorophores |
| Diode Array Detection (DAD) | Full spectrum acquisition with multiple diodes | Similar to VWD but with peak purity assessment [7] | HPLC detection; peak purity assessment |
| Gold Nanoparticle Probes | LSPR shifts or enzyme-mimetic catalysis [114] | nM to pM range for specific analytes | Environmental monitoring, biomedicine |
Fluorescence spectrophotometry offers significantly lower detection limits than UV-Vis absorption because the fluorescence signal is measured directly against a dark background, rather than as a small difference between two large signals [110]. This fundamental difference in measurement approach reduces noise contribution and enables detection limits up to three orders of magnitude lower than conventional UV-Vis.
Diagram 1: Experimental workflow for complex matrices (53 characters)
Experimental Protocols for Sensitivity Optimization
Protocol for Trace Metal Detection in Vegetable Matrices
Based on the method for lead detection in vegetables using chromogenic reagent DBMCA [112]:
Sample Digestion:
- Accurately weigh 2.0 g of homogenized vegetable leaves into a digestion flask
- Add 10 mL concentrated HNO₃ and reflux for 2 hours at 120°C
- Cool, add 5 mL HClO₄, continue heating until clear digest obtained
- Evaporate nearly to dryness, dissolve residue in 0.25 M phosphoric acid
Interference Elimination:
- For samples containing Ca(II) and Ba(II), extract with potassium iodide-methylisobutylketone prior to analysis
- Adjust phosphoric acid concentration to 0.25 M to enhance selectivity
Complex Formation and Measurement:
- Transfer sample solution to 25 mL volumetric flask
- Add 2.0 mL of 0.05% DBMCA solution in ethanol
- Dilute to mark with 0.25 M phosphoric acid and mix thoroughly
- Allow 10 minutes for color development at room temperature
- Measure absorbance at 646 nm against reagent blank
- Use 1 cm matched quartz cuvettes for all measurements
Calibration:
- Prepare lead standards in range 0.09-0.8 μg/mL in 0.25 M phosphoric acid
- Process standards identically to samples for calibration curve
- The method shows linear response with apparent molar absorptivity of 1.03×10⁵ L·mol⁻¹·cm⁻¹
Protocol for Cyanide Detection Using Chromogenic Probe
Based on the method using (E)-N′-((2-hydroxynaphthalen-1-yl)methylene)picolinohydrazide (HL) probe [113]:
Probe Synthesis:
- Dissolve 2-hydroxy-1-naphthaldehyde (1.72 g, 10 mmol) in 20 mL ethanol
- Add picolinohydrazide (1.37 g, 10 mmol) dissolved in 20 mL ethanol
- Reflux mixture for 4 hours with continuous stirring
- Cool to room temperature, collect yellow precipitate by filtration
- Wash with cold ethanol and dry under vacuum
Sample Preparation:
- Prepare cyanide standards in DMSO-water (4:1 v/v) solution
- Adjust pH to 7.4 using phosphate buffer
- For real samples, employ preliminary distillation or microdiffusion for cyanide separation
Detection Procedure:
- Add 2.0 mL probe solution (50 μM in DMSO) to 2.0 mL sample solution
- Mix thoroughly and incubate for 5 minutes at 25°C
- Observe color change from yellow to colorless (naked eye detection)
- Measure absorbance decrease at 450 nm using UV-Vis spectrophotometer
- Alternative: Use test paper strips impregnated with probe solution for field screening
Quantification:
- Monitor decrease in characteristic absorption peak at 450 nm
- Linear range: 5-100 μM CN⁻ with detection limit of 7.08 μM
- Verify specificity against common interfering anions (F⁻, Cl⁻, Br⁻, I⁻, NO₃⁻, SO₄²⁻)
Research Reagent Solutions for Enhanced Detection
Table 4: Essential Research Reagents for Sensitivity Enhancement
| Reagent/Category | Function | Application Example |
|---|---|---|
| DBMCA (Dibromo-p-methyl-carboxyazo) | Chromogenic reagent for lead forming 1:2 blue complex | Lead detection in vegetables at 646 nm [112] |
| Hydrazide Schiff Base Probes | Selective binding site for cyanide with color change | CN⁻ detection via deprotonation and binding [113] |
| Gold Nanoparticles | Tunable LSPR properties and enzyme-like activity | Colorimetric sensors via aggregation, surface modification [114] |
| Tetramethylbenzidine (TMB) | Chromogenic substrate for peroxidase-like nanozymes | Oxidized to colored product with absorption at 650 nm [114] |
| o-Phenylenediamine (OPD) | Fluorogenic and chromogenic substrate | Oxidized to yellow 2,3-diaminophenazine (450 nm) [114] |
Diagram 2: UV Vis detection principle (36 characters)
Optimizing sensitivity and detection limits in complex matrices requires a systematic approach addressing both instrumental parameters and chemical enhancement strategies. While fundamental instrumental limitations exist based on optical design and detector technology, significant improvements can be achieved through appropriate sample preparation, chemical derivatization, and selection of advanced detection schemes. The protocols and reagents detailed in this guide provide researchers with practical tools for extending the capabilities of UV-Vis spectroscopy to meet challenging analytical requirements in pharmaceutical development, environmental monitoring, and clinical diagnostics.
Future directions in this field continue to explore nanomaterial-based signal amplification, miniaturized detection systems, and computational approaches for spectral deconvolution, promising even greater sensitivity for analyzing trace components in increasingly complex sample matrices.
Conclusion
UV-Vis spectroscopy remains a cornerstone analytical technique, whose utility is continuously expanded through innovations in light source and detector technology. The foundational principles of electronic transitions provide a reliable basis for a wide range of applications, from rigorous pharmaceutical quality control to cutting-edge environmental monitoring of nanoplastics. As evidenced by robust validation protocols and favorable comparisons with other techniques, UV-Vis offers a unique blend of accessibility, speed, and quantitative precision. The integration of machine learning for data analysis and the development of more stable, user-friendly instruments point toward a future of increased automation and application in point-of-care diagnostics. For biomedical and clinical research, these advancements promise enhanced capabilities in high-throughput drug screening, real-time bioprocess monitoring, and the development of novel, spectroscopy-based diagnostic tools, solidifying the technique's critical role in scientific advancement and public health.
References
- 1. 13.18: The Beer-Lambert Law [https://chem.libretexts.org/Bookshelves/Organic_Chemistry/Map%3A_Organic_Chemistry_(Bruice)/13%3A_Mass_Spectrometry_Infrared_Spectroscopy_and_Ultraviolet_Visible_Spectroscopy/13.18%3A_The_Beer-Lambert_Law]
- 2. Beer–Lambert law [https://en.wikipedia.org/wiki/Beer%E2%80%93Lambert_law]
- 3. Beer-Lambert Law | Transmittance & Absorbance [https://www.edinst.com/resource/the-beer-lambert-law/]
- 4. Beer–Lambert law for optical tissue diagnostics [https://pmc.ncbi.nlm.nih.gov/articles/PMC8553265/]
- 5. Optical density and absorbance measurements [https://www.bmglabtech.com/en/blog/optical-density-for-absorbance-assays/]
- 6. 7. Principle and Feature of Various Detection Methods (1) [https://www.hitachi-hightech.com/global/en/knowledge/analytical-systems/hplc/hplc-basics/course7.html]
- 7. Ultraviolet Detectors: Perspectives, Principles, and Practices [https://www.chromatographyonline.com/view/ultraviolet-detectors-perspectives-principles-and-practices]
- 8. UV-Visible Spectrometers Market Review [https://www.linkedin.com/pulse/uv-visible-spectrometers-market-review-technology-landscape-eql2c/]
- 9. 2025 Review of Spectroscopic Instrumentation [https://www.spectroscopyonline.com/view/2025-review-of-spectroscopic-instrumentation]
- 10. UV-Vis Spectroscopy: Principle, Strengths and Limitations ... [https://www.technologynetworks.com/analysis/articles/uv-vis-spectroscopy-principle-strengths-and-limitations-and-applications-349865]
- 11. 什么是光谱仪? 紫外、可见光和红外光谱仪解释 [https://wavelength-oe.com/zh-CN/what-is-a-spectrometer/]
- 12. 紫外可见分光光度计的工作原理和用途 [https://m.sousepad.com/h-nd-2763.html]
- 13. 紫外分光光谱UV仪器原理-材料测试 [https://shiyanjia.com/knowledge/articleinfo-777.html]
- 14. 在线紫外-可见光谱市场规模及增长趋势(2035年) [https://www.researchnester.com/cn/reports/in-line-uv-vis-spectroscopy-market/7986]
- 15. UV–vis spectroscopic detection of formaldehyde and its ... [https://www.sciencedirect.com/science/article/abs/pii/S030438942201250X]
- 16. Deuterium lamps v tungsten lamps [https://www.awe.international/article/1841466/deuterium-lamps-v-tungsten-lamps]
- 17. Deuterium Lamp vs Xenon Lamp [The Ultimate Comparison ... [https://www.hitentechno.in/deuterium-lamp-xenon-lamp]
- 18. Tungsten-Halogen Lamps - ZEISS Microscopy Online Campus [https://zeiss-campus.magnet.fsu.edu/articles/lightsources/tungstenhalogen.html]
- 19. Tungsten-Halogen Light Sources [https://www.thorlabs.com/newgrouppage9.cfm?objectgroup_id=9301]
- 20. Xenon Arc Light Sources [https://www.thorlabs.com/newgrouppage9.cfm?objectgroup_id=13016]
- 21. 6252 Xenon Arc Lamp [https://www.newport.com/p/6252]
- 22. The Eyes of HPLC: Strategic Use of Detectors [https://www.qbdgroup.com/en/blog/hplc-detectors-drug-development-quality-control]
- 23. Photomultiplier tube [https://en.wikipedia.org/wiki/Photomultiplier_tube]
- 24. Characteristics of UV-VIS Spectrophotometric detectors [https://lab-training.com/characteristics-of-uv-vis-spectrophotometric-detectors/]
- 25. Photodiode Array Detection in Clinical Applications [https://www.intechopen.com/chapters/18835]
- 26. Benefits of Photodiode Array Detection over conventional ... [https://lab-training.com/benefits-of-photodiode-array-detection-over-conventional-scanning-detection/]
- 27. Spectroscopy Market Profile: Photodiode Array UV-Vis ... [https://www.spectroscopyonline.com/view/spectroscopy-market-profile-photodiode-array-uv-vis-spectrophotometers]
- 28. UV-Vis-NIR Spectrophotometers Comparison [https://www.shimadzu.com/an/products/uv-vis/uv-vis-nir-spectroscopy/comparison/index.html]
- 29. UV vs Diode-Array (PDA) Detectors for (U)HPLC [https://www.ssi.shimadzu.com/service-support/faq/liquid-chromatography/knowledge-base/uv-vs-pda-detectors/index.html]
- 30. single and double-beam UV-Visible spectrophotometers. ... [https://www.drawellanalytical.com/the-difference-between-single-and-double-beam-uv-visible-spectrophotometers/]
- 31. Spectrophotometers – scanning, single-beam, dual- ... [https://www.rp-photonics.com/spectrophotometers.html]
- 32. Spectroscopy Applications Selection Guide [https://www.coleparmer.com/tech-article/spectroscopy-selection-guide]
- 33. Analysis Accuracy Of Double Beam UV Visible ... [https://www.metashcorp.com/Analysis-Accuracy-of-Double-Beam-UV-Visible-Spectrophotometer.html]
- 34. Single Beam vs. Double Beam Spectrophotometer [https://www.hunterlab.com/blog/single-beam-vs-double-beam-spectrophotometer/]
- 35. UV-LEDs: Next-Generation Ultraviolet Light Sources [https://www.intechopen.com/online-first/1237394]
- 36. Light-emitting diode-based absorbance detectors for flow ... [https://www.sciencedirect.com/science/article/pii/S2772391724000781]
- 37. Detection in UV-visible spectrophotometry: Detectors, ... [https://www.sciencedirect.com/science/article/pii/S0263224118311904]
- 38. Light Sources for Spectrophotometers [https://www.shimadzu.com/an/service-support/technical-support/uv/essential_knowledge/lightsources.html]
- 39. Buyer's Guide: Light Sources for UV/Vis Spectrophotometry [https://www.labcompare.com/10-Featured-Articles/581180-Buyer-s-Guide-Light-Sources-for-UV-Vis-Spectrophotometry/]
- 40. What Is a Light Source within UV-Vis Spectroscopy? [https://knowledge.cphnano.com/en/pages/what-is-a-light-source-within-uv-vis-spectroscopy]
- 41. UV-Vis Spectrophotometer Applications [https://www.thermofisher.com/us/en/home/industrial/spectroscopy-elemental-isotope-analysis/molecular-spectroscopy/uv-vis-spectrophotometry/applications.html]
- 42. 5 Critical Insights You Need to Know About Antibody ... [https://precisionantibody.com/insights-about-antibody-characterization/]
- 43. Analytical Techniques for the Characterization and ... [https://pmc.ncbi.nlm.nih.gov/articles/PMC9967501/]
- 44. Characterization and quantification of therapeutic ... [https://www.sciencedirect.com/science/article/abs/pii/S0165993625002535]
- 45. UV-Visible Spectroscopy [https://www2.chemistry.msu.edu/faculty/reusch/virttxtjml/spectrpy/uv-vis/spectrum.htm]
- 46. Exploring the Growing UV Visible Spectroscopy Market by 2025 [https://www.marketsandmarketsblog.com/exploring-the-growing-uv-visible-spectroscopy-market-by-2025.html]
- 47. Machine learning aided UV absorbance spectroscopy for ... [https://www.nature.com/articles/s41598-024-83114-y]
- 48. New UV–Visible Spectroscopy Method Harnesses ... [https://www.spectroscopyonline.com/view/new-uv-visible-spectroscopy-method-harnesses-machine-learning-to-detect-contamination-in-microalgae-cultures]
- 49. How UV Detector Works — In One Simple Flow (2025) [https://www.linkedin.com/pulse/how-uv-detector-works-one-simple-flow-2025-quantum-tide-collective-skqaf/]
- 50. Real-Time Water Quality Monitoring through UV-Vis ... [https://www.hamamatsu.com/eu/en/news/featured-products_and_technologies/2025/real-time-water-quality-monitoring-through-uv-vis-spectroscopy.html]
- 51. Biological contaminants analysis in microalgae culture by ... [https://pubmed.ncbi.nlm.nih.gov/39778393/]
- 52. Advances on Water Quality Detection by UV-Vis ... [https://www.mdpi.com/2076-3417/10/19/6874]
- 53. UV-VIS Spectroscopy for Water Analysis and ... [https://www.hunterlab.com/blog/uv-vis-spectroscopy-for-water-analysis-and-environmental-applications/]
- 54. Quantitative evaluation of true-to-life nanoplastics using UV ... [https://pubs.rsc.org/en/content/articlelanding/2025/en/d5en00502g]
- 55. A Review of Spectroscopic Techniques used for the ... [https://www.spectroscopyonline.com/view/a-review-of-spectroscopic-techniques-used-for-the-quantification-and-classification-of-microplastics-and-nanoplastics-in-the-environment]
- 56. UV/Vis Spectroscopy for DNA & Protein Analysis [https://www.unchainedlabs.com/uv-vis-spectroscopy/]
- 57. Using UV-visible Absorption Spectroscopy [https://chem.libretexts.org/Bookshelves/Physical_and_Theoretical_Chemistry_Textbook_Maps/Supplemental_Modules_(Physical_and_Theoretical_Chemistry)/Spectroscopy/Electronic_Spectroscopy/Electronic_Spectroscopy_Basics/Using_UV-visible_Absorption_Spectroscopy]
- 58. A Simple and General Method for Determining the Protein ... [https://pmc.ncbi.nlm.nih.gov/articles/PMC2964155/]
- 59. Advancements in UV-VIS Spectrophotometer Design and Technology - Drawell [https://www.drawellanalytical.com/advancements-in-uv-vis-spectrophotometer-design-and-technology/]
- 60. UV-Vis Spectrometer 2025-2033 Overview: Trends, Competitor Dynamics, and Opportunities [https://www.archivemarketresearch.com/reports/uv-vis-spectrometer-184406]
- 61. Ultraviolet-Visible Spectrometer 2025-2033 Overview: Trends, Competitor Dynamics, and Opportunities [https://www.archivemarketresearch.com/reports/ultraviolet-visible-spectrometer-266366]
- 62. UV/Visible Spectroscopy Market Size & Share 2025-2030 [https://www.360iresearch.com/library/intelligence/uv-visible-spectroscopy]
- 63. The lamp light is red on a PDA Detector with initialization ... [https://support.waters.com/KB_Inst/Chromatography/WKB16226_The_lamp_light_is_red_on_a_2998_PDA_Detector]
- 64. What is UV-Vis Spectrometer? Uses, How It Works & Top ... [https://www.linkedin.com/pulse/what-uv-vis-spectrometer-uses-how-works-top-companies-1hwnc]
- 65. A novel fault diagnosis strategy for LED lamps via light ... [https://www.sciencedirect.com/science/article/pii/S2405844023069451]
- 66. Reasons of errors for LED Lamp Testing [https://www.lisungroup.com/news/technology-news/reasons-of-error-for-led-lamp-testing.html?srsltid=AfmBOoris9TBGNxWdcpklthczBClp6icfcGTfTVTqey0_lTv4LYEZALC]
- 67. UV-Visible Spectrophotometers: Interpretation of ... [https://www.laboratorioseyco.com/en/UV-visible-spectrophotometers%3A-interpretation-of-calibration-certificates/]
- 68. Statistical Error Calibration in UV-Visible Spectrophotometry [https://opg.optica.org/abstract.cfm?uri=as-54-3-431]
- 69. Spectroscopic Sample Preparation: Techniques for ... [https://www.metkon.com/spectroscopic-sample-preparation/]
- 70. Choosing the Right Cuvettes for UV-VIS Experiments [https://whitebearphotonics.com/blogs/measurement-techniques/uv-vis-cuvette-guide?srsltid=AfmBOoqHmQV4sXtfI0_8-ncuZeXMeoIUnhKtf1uhdthsfen4gVTCWauK]
- 71. Quartz Cuvette: Complete & Essential Guide for ... [https://qvarz.com/quartz-cuvette/?srsltid=AfmBOop967dZYk-T5-D5b6MsaPsk8KEohjfYy_mEWYUd9Dz2eqJN00cp]
- 72. Tips and Tricks for - JASCO [https://jascoinc.com/learning-center/best-practices/tips-and-tricks-for-uv-visible-spectroscopy/]
- 73. The Role of Spectroscopy in Modern Pharmaceutical Industry [https://www.simsonpharma.com/us/blog-details/the-role-of-spectroscopy-in-modern-pharmaceutical-industry]
- 74. Pharma-Compliant Analysis with Flexible UV-Vis [https://www.spectroscopyonline.com/view/pharma-compliant-analysis-with-flexible-uv-vis]
- 75. UV-Vis Spectroscopy Troubleshooting Made Easy [https://www.ossila.com/pages/troubleshooting-uv-vis-spectroscopy]
- 76. 10.3: UV/Vis and IR Spectroscopy [https://chem.libretexts.org/Bookshelves/Analytical_Chemistry/Analytical_Chemistry_2.1_(Harvey)/10%3A_Spectroscopic_Methods/10.03%3A_UV_Vis_and_IR_Spectroscopy]
- 77. 5 Steps to Calculate Bandgap Using UV-Vis Spectroscopy [https://allanchem.com/calculate-bandgap-uv-vis-spectroscopy/]
- 78. Fluctuations in readings when using the UV-Vis Calibration ... [https://www.mtc-usa.com/kb-article/aa-01360]
- 79. Light Sources for Spectrophotometers [https://www.ssi.shimadzu.com/service-support/technical-support/analysis-basics/fundamentals-uv/lightsources.html]
- 80. FAQ: Five “Traps” That Affect UPF Testing Accuracy and ... [https://www.chnspec.net/Five-Traps-That-Affect-UPF-Testing-Accuracy.html]
- 81. How to Troubleshoot a Spectrum That Looks Wrong [https://www.azooptics.com/Article.aspx?ArticleID=2811]
- 82. Correcting Ultraviolet-Visible Spectra for Baseline Artifacts [https://www.sciencedirect.com/science/article/pii/S0022354923003350]
- 83. Spectroscopic Methods in Pharma QA/QC: UV-Vis, IR, and ... [https://www.labmanager.com/spectroscopic-methods-in-pharma-qa-qc-uv-vis-ir-and-nmr-applications-34005]
- 84. Gradient Elution, Part V: Baseline Problems | LCGC International Drift [https://www.chromatographyonline.com/view/gradient-elution-part-v-baseline-drift-problems]
- 85. Latest Research Report: Digital Tools Themselves Do Not ... [https://aliresources.hexagon.com/articles-blogs/latest-research-report-digital-tools-themselves-do-not-resolve-data-connectivity-issues]
- 86. Top 10 Network Issues and Solutions - Leading ICT Services [https://www.soma.com.au/blog/10-common-network-issues-and-solutions-for-modern-business]
- 87. ICH and FDA Guidelines for Analytical Method Validation [https://www.labmanager.com/ich-and-fda-guidelines-for-analytical-method-validation-34252]
- 88. ICH Guidelines for Analytical Method Validation Explained [https://amsbiopharma.com/ich-guidelines-analytical-method/]
- 89. ICH Q2(R2) Validation of analytical procedures [https://www.ema.europa.eu/en/ich-q2r2-validation-analytical-procedures-scientific-guideline]
- 90. Uv Vis Spectrometer in the Real World: 5 Uses You'll ... [https://www.linkedin.com/pulse/uv-vis-spectrometer-real-world-5-uses-youll-actually-n9nwf]
- 91. Light Source Control in Machine Vision Systems in 2025 [https://www.unitxlabs.com/resources/light-source-control-machine-vision-system-2025-guide/]
- 92. Quantitative evaluation of true-to-life nanoplastics using UV ... [https://pubs.rsc.org/en/content/articlehtml/2025/en/d5en00502g]
- 93. Quantitative analysis of nanoplastics in environmental and ... [https://www.sciencedirect.com/science/article/pii/S0304389423022975]
- 94. Comprehensive analysis of common polymers using ... [https://www.sciencedirect.com/science/article/pii/S2452074823000186]
- 95. Quantification of Nanoplastics and Inorganic Nanoparticles ... [https://pmc.ncbi.nlm.nih.gov/articles/PMC12464807/]
- 96. Fourier Transform Infrared (FTIR) vs. Raman ... Spectroscopy [https://www.labx.com/resources/fourier-transform-infrared-ftir-versus-raman-spectroscopy/177]
- 97. FT-IR–Raman Combination: The Perfect Analytical ... [https://www.spectroscopyonline.com/view/ft-ir-raman-combination-perfect-analytical-solution-vibrational-spectroscopists]
- 98. Controlled Substance Testing with Handheld Raman and ... [https://www.news-medical.net/news/20251014/From-street-to-lab-Advancing-controlled-substance-testing-with-handheld-Raman-and-FTIR.aspx]
- 99. FTIR vs. Raman : Selecting the Right Analytical... Spectroscopy [https://sfr.ca/blogs/news/ftir-vs-raman-spectroscopy-selecting-the-right-analytical-technique]
- 100. Characterizing Colored Fibers by FT-IR and Raman ... [https://www.spectroscopyonline.com/view/characterizing-colored-fibers-ft-ir-and-raman-spectroscopy]
- 101. Material analysis demystified: A comparison of Raman and infrared ... [https://www.news-medical.net/whitepaper/20240821/Material-analysis-demystified-A-comparison-of-Raman-and-infrared-spectroscopy.aspx]
- 102. Frontiers | Raman and IR as a promising approach to... spectroscopy [https://www.frontiersin.org/journals/chemistry/articles/10.3389/fchem.2025.1543663/full]
- 103. Enabling Personalised 3D Printed Extended-Release Oral ... [https://www.sciencedirect.com/science/article/pii/S0928098725003392]
- 104. The Future of FT-IR Imaging [https://www.spectroscopyonline.com/view/the-future-of-ft-ir-imaging]
- 105. The Validation of a Hemagglutination Inhibition Assay That ... [https://www.mdpi.com/2076-393X/13/4/342]
- 106. An Optimized Hemagglutination Inhibition (HI) Assay to ... [https://pmc.ncbi.nlm.nih.gov/articles/PMC5755515/]
- 107. Hemagglutination Assay via Optical Density ... [https://pmc.ncbi.nlm.nih.gov/articles/PMC10377501/]
- 108. Hemagglutination detection for blood typing based on ... [https://www.sciencedirect.com/science/article/pii/S2214180414000440]
- 109. A haemagglutination test for rapid detection of antibodies ... [https://www.nature.com/articles/s41467-021-22045-y]
- 110. Why fluorescence spectrophotometry offers lower detection limits than UV-Vis spectrophotometry [https://www.lambda-at.com/why_fluorescence_spectrophotometry_offers_lower_detection_limits_than_UV-Vis_spectrophotometry.html]
- 111. Ultraviolet–visible spectroscopy - Wikipedia [https://en.wikipedia.org/wiki/Ultraviolet%E2%80%93visible_spectroscopy]
- 112. Detection of Lead in Vegetables with New Chromogenic ... [https://link.springer.com/article/10.1023/B:EMAS.0000038186.97063.ba]
- 113. Spectrophotometric determination of CN− ion [https://www.sciencedirect.com/science/article/abs/pii/S1386142519308613]
- 114. Chromogenic Mechanisms of Colorimetric Sensors Based on ... [https://pmc.ncbi.nlm.nih.gov/articles/PMC10452725/]