Validating Analytical Methods for Drug Substance Assay: A 2025 Guide to ICH Q2(R2) Compliance and Advanced Strategies
This article provides a comprehensive guide for researchers and drug development professionals on validating analytical methods for drug substance assays, aligned with the latest 2025 regulatory and technological trends.
Validating Analytical Methods for Drug Substance Assay: A 2025 Guide to ICH Q2(R2) Compliance and Advanced Strategies
Abstract
This article provides a comprehensive guide for researchers and drug development professionals on validating analytical methods for drug substance assays, aligned with the latest 2025 regulatory and technological trends. It covers foundational principles from ICH Q2(R2) and Q14 guidelines, explores modern methodological approaches incorporating Quality-by-Design (QbD) and Artificial Intelligence (AI), offers troubleshooting strategies for common challenges like data integrity and complex modalities, and details comparative validation paradigms for biosimilars and advanced therapies. The content synthesizes current FDA guidance, technological innovations, and practical applications to ensure robust, compliant, and efficient analytical method lifecycle management.
Foundations of Analytical Validation: Understanding ICH Q2(R2), Q14, and the 2025 Regulatory Landscape
Analytical method validation provides documented evidence that a laboratory procedure is robust, reliable, and reproducible for its intended purpose, forming a critical pillar of quality assurance in pharmaceutical development [1]. This application note details the core principles and experimental protocols for validating methods used in drug substance quality control, aligning with modern International Council for Harmonisation (ICH) guidelines Q2(R2) and ICH Q14 [2]. We outline a systematic approach—from defining the Analytical Target Profile (ATP) to establishing a full validation protocol—ensuring methods consistently produce reliable results that confirm the identity, purity, potency, and safety of drug substances [3] [2].
The Regulatory Imperative and Analytical Lifecycle
Regulatory bodies like the U.S. Food and Drug Administration (FDA) mandate method validation to safeguard public health, requiring proof that analytical procedures are fit-for-purpose before approving new drugs [1] [2]. The ICH provides the harmonized technical guidelines that achieve global consistency, with ICH Q2(R2), "Validation of Analytical Procedures," serving as the primary reference [2].
Modern regulations emphasize an analytical procedure lifecycle model [2]. This model begins with proactive planning using an ATP, followed by method development, validation, and continuous monitoring in routine use. This represents a significant shift from a one-time "check-the-box" validation event to a science- and risk-based framework that builds quality into the method from the outset [2].
Core Validation Parameters for Drug Substance Assay
For a quantitative method like a drug substance assay, specific performance characteristics must be evaluated and documented. The table below summarizes these core parameters, their definitions, and typical experimental approaches [2].
Table 1: Core Validation Parameters for a Quantitative Drug Substance Assay
| Parameter | Definition | Experimental Protocol Summary |
|---|---|---|
| Accuracy | Closeness of test results to the true value [2]. | Analyze a minimum of 3 concentration levels (e.g., 80%, 100%, 120% of target), each in triplicate, using a drug substance standard of known purity. Calculate percent recovery. |
| Precision | Degree of scatter among a series of measurements [2]. | Repeatability: Analyze 6 independent preparations at 100% of test concentration. Intermediate Precision: Repeat the procedure on a different day, with a different analyst, or using different equipment. |
| Specificity | Ability to assess the analyte unequivocally in the presence of potential interferents [2]. | Analyze the drug substance alone and in the presence of impurities, degradation products (from forced degradation studies), and matrix components. Demonstrate peak purity and separation. |
| Linearity | Ability to obtain test results proportional to analyte concentration [2]. | Prepare and analyze a minimum of 5 concentration levels (e.g., 50-150% of target). Plot response vs. concentration and calculate correlation coefficient, slope, and y-intercept. |
| Range | The interval between upper and lower analyte concentrations for which linearity, accuracy, and precision are demonstrated [2]. | Established based on the linearity and accuracy data, typically encompassing the concentrations from the intended application (e.g., 80-120% for an assay). |
| LOD/LOQ | LOD (Limit of Detection): Lowest amount of analyte that can be detected. LOQ (Limit of Quantitation): Lowest amount that can be quantified with acceptable accuracy and precision [2]. | Based on signal-to-noise ratio (e.g., 3:1 for LOD, 10:1 for LOQ) or standard deviation of the response and the slope of the calibration curve. |
Detailed Experimental Protocol: Accuracy and Precision
This protocol provides a detailed methodology for establishing the accuracy and precision of a chromatographic assay for a drug substance, in accordance with the principles of ICH Q2(R2) [2].
Objective
To demonstrate that the analytical method provides accurate and precise results for the quantification of [Drug Substance Name] within the specified range.
Materials and Reagents
- Drug Substance Standard: Certified Reference Material of known high purity (e.g., >99.0%).
- Placebo/Matrix: Components of the drug product formulation excluding the active ingredient.
- Mobile Phase, Diluent: Prepared as per the analytical method specification.
- Instrumentation: High-Performance Liquid Chromatography (HPLC) system with [specify detector, e.g., UV/VIS].
Experimental Procedure
- Preparation of Standard Solution: Accurately weigh and dissolve the drug substance standard in diluent to obtain a stock solution at the target concentration (100%).
- Preparation of Accuracy/Precision Solutions:
- Accuracy (Recovery): Prepare solutions at 80%, 100%, and 120% of the target concentration by spiking known amounts of the drug substance standard into a placebo matrix. Prepare three independent samples for each level.
- Precision (Repeatability): Prepare six independent samples at the 100% level without placebo.
- Analysis: Inject each solution in triplicate into the HPLC system following the established method conditions ([specify column, flow rate, wavelength, etc.]).
- Intermediate Precision: Repeat the entire procedure for the 100% level (with and without placebo) on a different day using a different analyst and/or a different HPLC system.
Data Analysis and Acceptance Criteria
- Accuracy: Calculate the mean percent recovery for each level. The mean recovery at each level should be within 98.0-102.0%, with a relative standard deviation (RSD) of ≤2.0%.
- Precision (Repeatability): Calculate the RSD of the six 100% measurements. The RSD should be ≤2.0%.
- Intermediate Precision: Compare the results from the original and repeat studies. The combined RSD should be ≤2.0%, demonstrating that the method is robust under varied conditions.
The Analytical Method Validation Workflow
The following diagram illustrates the key stages of the analytical method lifecycle, from initial planning to ongoing monitoring.
The Scientist's Toolkit: Essential Research Reagents and Materials
A robust analytical method relies on high-quality, well-characterized materials. The following table lists essential items for developing and validating a drug substance assay.
Table 2: Key Research Reagent Solutions and Materials for Analytical Method Validation
| Item | Function / Purpose |
|---|---|
| Certified Reference Standard | Serves as the benchmark for quantifying the drug substance; its certified purity and identity are essential for accurate and precise results [2]. |
| Pharmaceutical Grade Placebo | Used in specificity and accuracy experiments to confirm the method can distinguish the active ingredient from non-active components without interference [2]. |
| Forced Degradation Samples | Samples of the drug substance intentionally exposed to stress conditions (heat, light, acid, base, oxidation) to generate impurities and demonstrate method specificity and stability-indicating properties [2]. |
| System Suitability Solutions | A reference preparation used to verify that the chromatographic system is performing adequately at the start of the analysis (e.g., for resolution, tailing factor, and repeatability) [4]. |
| High-Purity Solvents & Reagents | Critical for preparing mobile phases and diluents to ensure low background noise, consistent chromatographic performance, and accurate detection. |
A rigorous, well-documented approach to analytical method validation is non-negotiable for ensuring drug substance quality, regulatory compliance, and ultimately, patient safety [1]. By adopting the modern, lifecycle approach outlined in ICH Q2(R2) and ICH Q14—beginning with a clear ATP and following structured protocols for key parameters like accuracy, precision, and specificity—developers can build quality and reliability directly into their analytical procedures [2]. This foundational work provides the critical data needed to support Chemistry, Manufacturing, and Controls (CMC) activities and smooths the path to successful regulatory submission and market approval.
The International Council for Harmonisation (ICH) guidelines Q2(R2) Validation of Analytical Procedures and Q14 Analytical Procedure Development represent a harmonized framework for the lifecycle of analytical procedures used in the assessment of drug substance and drug product quality [5]. These documents provide critical guidance for researchers and drug development professionals, establishing a science- and risk-based foundation for ensuring that analytical methods are consistently fit for their intended purpose [6].
ICH Q2(R2) provides a comprehensive discussion of the elements required to establish objective evidence that an analytical procedure is suitable for detecting or quantifying a quality attribute, delivering validation principles for techniques ranging from classical methods to advanced spectroscopic analyses [7] [6]. ICH Q14 complements this by outlining systematic approaches for developing and maintaining analytical procedures, describing both traditional and enhanced scientific methodologies [8]. Together, these guidelines facilitate more efficient regulatory evaluations and science-based post-approval change management, ultimately supporting the availability, safety, and efficacy of pharmaceutical products [6].
The scope of these guidelines encompasses new or revised analytical procedures used for release and stability testing of commercial drug substances and products, including both chemical and biological/biotechnological entities [7] [8]. While focused on commercial applications, the principles can be applied in a phase-appropriate manner throughout the product lifecycle, including clinical development stages [5].
Core Principles and Regulatory Framework
ICH Q2(R2): Validation of Analytical Procedures
ICH Q2(R2) establishes a general framework for validating analytical procedures, serving as a collection of standardized terms and their definitions to ensure consistent interpretation across regulatory regions [7]. The guideline addresses the most common purposes of analytical procedures, including assay/potency, purity, impurities, identity, and other quantitative or qualitative measurements [7]. A significant enhancement in the revised version is the inclusion of specific examples and illustrative approaches for advanced analytical techniques, providing much-needed clarity for methods such as mass spectrometry and qPCR that are essential for modern biopharmaceutical analysis [9].
The validation process according to Q2(R2) focuses on establishing documented evidence that the analytical procedure consistently delivers results that are scientifically valid for their intended use. The guidance emphasizes that the extent of validation should be justified based on the purpose of the procedure and its place in the overall control strategy [7]. For biological products specifically, the guidance helps clarify analytical methods that can best support development, particularly at critical phases where methodological uncertainty could lead to significant delays or additional costs [9].
ICH Q14: Analytical Procedure Development
ICH Q14 introduces a structured framework for developing analytical procedures using science- and risk-based approaches [8]. A foundational concept in this guideline is the Analytical Procedure Lifecycle, which encompasses all stages from initial development through routine use and eventual retirement or replacement of the method [5]. This lifecycle approach ensures that procedures remain suitable for their intended purpose despite changes in manufacturing processes, raw materials, or technological advancements.
The guideline describes two distinct approaches to analytical procedure development:
- Minimal Approach: A traditional methodology focusing on identifying procedure attributes, selecting appropriate technology, conducting development studies, and providing a procedural description [5]
- Enhanced Approach: Incorporates Quality by Design (QbD) principles, including defining an Analytical Target Profile (ATP), conducting risk assessments, performing multivariate experiments when appropriate, and establishing a comprehensive control strategy with defined lifecycle change management plans [5]
While application of the enhanced approach is not mandatory, regulators encourage applying its individual elements to improve analytical understanding and facilitate more efficient change management [5].
Integrated Lifecycle Management
The integration of Q2(R2) and Q14 establishes a complete framework for the analytical procedure lifecycle, connecting development activities with validation requirements and post-approval change management [5] [9]. This integrated approach aligns with existing ICH quality guidelines (Q8, Q9, Q10) that emphasize understanding processes, maintaining a state of control, and pursuing continuous improvement [5].
The FDA has issued both Q2(R2) and Q14 as final guidances in March 2024, replacing the previous draft versions and providing regulatory certainty for implementation [6]. Furthermore, in July 2025, ICH published comprehensive training materials developed by the Q2(R2)/Q14 Implementation Working Group to support harmonized global understanding and consistent application of these guidelines [10].
Analytical Procedure Validation: ICH Q2(R2) Requirements
Key Validation Characteristics
ICH Q2(R2) defines specific validation characteristics that must be evaluated to demonstrate an analytical procedure is suitable for its intended purpose. The selection of which characteristics to validate depends on the nature of the analytical procedure (identification, testing for impurities, assay, etc.). The table below summarizes the core validation characteristics and their applicability to different types of analytical procedures.
Table 1: Analytical Procedure Validation Characteristics per ICH Q2(R2)
| Validation Characteristic | Identification | Testing for Impurities | Assay/Potency |
|---|---|---|---|
| Accuracy | Not required | Required | Required |
| Precision | |||
| - Repeatability | Not required | Required | Required |
| - Intermediate Precision | Not required | May be required | May be required |
| Specificity | Required | Required | Required |
| Detection Limit (LOD) | Not required | Required | Not required |
| Quantitation Limit (LOQ) | Not required | Required | Not required |
| Linearity | Not required | Required | Required |
| Range | Not required | Required | Required |
Detailed Validation Protocols
Accuracy Validation Protocol
Purpose: To demonstrate the closeness of agreement between the value accepted as a true value or reference value and the value found [7].
Experimental Methodology:
- Prepare a minimum of 9 determinations over a minimum of 3 concentration levels covering the specified range (e.g., 3 concentrations, 3 replicates each)
- For drug substance analysis using comparison to a reference standard:
- Prepare homogeneous samples of the drug substance with known purity
- Spike with known quantities of reference standard at levels representing 80%, 100%, and 120% of target concentration
- Analyze samples using the validated method
- Calculate recovery: %Recovery = (Measured Concentration/Added Concentration) × 100
- Acceptance criteria typically require mean recovery between 98-102% with RSD ≤2% for assay methods
Data Analysis:
- Calculate mean value, standard deviation, and relative standard deviation (RSD)
- Perform statistical t-test to evaluate if there is significant difference between measured and true values
- Report confidence intervals for the mean recovery
Precision Validation Protocol
Purpose: To demonstrate the degree of scatter between a series of measurements obtained from multiple sampling of the same homogeneous sample under prescribed conditions [7].
Experimental Methodology for Repeatability:
- Prepare a minimum of 6 determinations at 100% of test concentration
- Analyze samples independently by the same analyst using the same equipment on the same day
- Alternatively, prepare a minimum of 9 determinations over a minimum of 3 concentration levels (e.g., 3 concentrations, 3 replicates each)
Experimental Methodology for Intermediate Precision:
- Demonstrate the influence of random events on the analytical procedure
- Vary factors such as different days, different analysts, different equipment
- Use experimental design (DOE) approaches to efficiently evaluate multiple factors
- Design study to include a minimum of 6 independent preparations at 100% test concentration
Data Analysis:
- Calculate variance, standard deviation, and relative standard deviation (RSD)
- For intermediate precision, perform ANOVA to separate contributions from different factors
- Acceptance criteria for assay methods typically require RSD ≤2% for repeatability and ≤3% for intermediate precision
Specificity Validation Protocol
Purpose: To demonstrate the ability to assess unequivocally the analyte in the presence of components that may be expected to be present, such as impurities, degradation products, and matrix components [7].
Experimental Methodology for Drug Substance Assay:
- Prepare individual samples of drug substance containing:
- Drug substance alone (positive control)
- Placebo or matrix components (blank)
- Drug substance with intentionally added impurities or degradation products
- Stressed samples (forced degradation studies)
- Analyze all samples using the proposed procedure
- For chromatographic methods, demonstrate resolution between the analyte peak and the closest eluting potential impurity
- Verify that the blank does not produce interfering peaks at the retention time of the analyte
Acceptance Criteria:
- Resolution factor ≥2.0 between analyte and closest eluting potential impurity
- Peak purity tests (e.g., DAD or MS) confirm analyte peak homogeneity
- No interference from blank at analyte retention time
Analytical Procedure Development: ICH Q14 Requirements
Analytical Target Profile (ATP)
The Analytical Target Profile (ATP) is a foundational element of the enhanced approach in ICH Q14, defined as a "summary of the expected characteristics of the analytical procedure" [5]. The ATP outlines the performance requirements necessary for the procedure to be fit for its intended purpose, serving as the foundation for design, development, and lifecycle management.
Key Elements of an ATP:
- Measurand (what is being measured)
- Required performance criteria (accuracy, precision, etc.)
- Conditions under which the measurement is performed
- The purpose of the measurement and its decision rules
- Required level of confidence in the results
Example ATP for Drug Substance Assay: "The procedure must be capable of quantifying the drug substance in the presence of process impurities and degradation products with an accuracy of 98-102% and precision of ≤2% RSD, providing results with 95% confidence that the true value lies within ±2% of the reported value."
Minimal vs. Enhanced Approach
ICH Q14 describes two complementary approaches to analytical procedure development, as summarized in the table below:
Table 2: Comparison of Minimal and Enhanced Approaches to Analytical Procedure Development
| Aspect | Minimal Approach | Enhanced Approach |
|---|---|---|
| Philosophy | Traditional, empirical | Science-based, risk-managed |
| ATP Definition | Not required | Recommended foundation |
| Risk Assessment | Informal | Structured and documented |
| Experimental Design | Univariate experimentation | Uni- or multi-variate experiments |
| Knowledge Management | Limited documentation | Systematic knowledge capture |
| Control Strategy | Fixed operating parameters | Proven Acceptable Ranges (PARs) |
| Change Management | Case-by-case assessment | Pre-defined based on knowledge |
Risk Management in Analytical Procedure Development
ICH Q14 emphasizes the application of formal risk management principles (aligning with ICH Q9) to identify and prioritize factors that may impact analytical procedure performance [5].
Risk Assessment Protocol:
- Define the ATP: Establish target measurement uncertainty and performance requirements
- Identify Potential Risk Factors: Brainstorm factors that may impact the procedure's ability to meet the ATP
- Material attributes (sample composition, stability)
- Instrument parameters (detector sensitivity, precision)
- Method parameters (mobile phase composition, pH, temperature)
- Environmental factors (temperature, humidity)
- Analyst technique
- Risk Analysis: Evaluate and prioritize risks based on severity, probability, and detectability
- Risk Evaluation: Determine which risks require experimental investigation
- Design of Experiments (DOE): Develop structured experiments to study high-priority risk factors
- Define Control Strategy: Establish proven acceptable ranges for critical parameters
Practical Application and Case Studies
Implementation Workflow
The following workflow diagram illustrates the integrated application of ICH Q14 and ICH Q2(R2) throughout the analytical procedure lifecycle:
Method Validation Experimental Design
For the validation of a drug substance assay method, the following experimental design ensures comprehensive evaluation of all relevant validation characteristics:
Case Study: HPLC Assay Method for Small Molecule Drug Substance
Background: Development and validation of a stability-indicating HPLC method for a small molecule drug substance assay.
Application of ICH Q14 Enhanced Approach:
- ATP Definition: "The method must quantify the drug substance in the presence of known and unknown impurities with accuracy of 98-102%, precision of ≤2% RSD, and demonstrate specificity to separate all potential degradants with resolution ≥2.0."
- Risk Assessment: Identified critical method parameters including mobile phase pH, column temperature, gradient profile, and detection wavelength
- DoE Implementation: Used a fractional factorial design to evaluate the effect of 5 method parameters on 3 critical quality attributes (resolution, tailing factor, runtime)
- Establishment of PARs: Defined proven acceptable ranges for critical parameters:
- Mobile phase pH: ±0.2 units
- Column temperature: ±3°C
- Gradient slope: ±2%
ICH Q2(R2) Validation Results: Table 3: HPLC Method Validation Results for Drug Substance Assay
| Validation Characteristic | Protocol | Results | Acceptance Criteria |
|---|---|---|---|
| Accuracy | 9 determinations at 80%, 100%, 120% | Mean recovery: 99.8% RSD: 0.7% | 98-102% RSD ≤2% |
| Precision - Repeatability | 6 determinations at 100% | RSD: 0.5% | RSD ≤2% |
| Precision - Intermediate Precision | Different analyst, instrument, day | Overall RSD: 0.8% | RSD ≤3% |
| Specificity | Forced degradation (heat, light, acid, base, oxidation) | Resolution from closest impurity: 2.5 Peak purity: Pass | Resolution ≥2.0 |
| Linearity | 5 concentrations (50-150%) | R² = 0.9998 | R² ≥0.998 |
| Range | 80-120% of target concentration | Demonstrated suitable accuracy, precision, linearity | Meets accuracy, precision, linearity requirements |
The Scientist's Toolkit: Essential Research Reagent Solutions
Successful implementation of ICH Q2(R2) and ICH Q14 requires carefully selected reagents and materials that ensure analytical method reliability and reproducibility. The following table details essential research reagent solutions for drug substance assay development and validation.
Table 4: Essential Research Reagent Solutions for Analytical Development
| Reagent/Material | Function | Critical Quality Attributes |
|---|---|---|
| Reference Standards | Quantitation and method calibration | Certified purity, stability, well-characterized impurities |
| HPLC/UPLC Grade Solvents | Mobile phase preparation | Low UV cutoff, low particulate content, controlled water content |
| Chromatography Columns | Analyte separation | Column efficiency (N), retention reproducibility, peak symmetry |
| Buffer Salts | Mobile phase modification | pH accuracy, low UV absorbance, high purity |
| Stable Isotope-labeled Internal Standards | Mass spectrometry quantification | Isotopic purity, chemical stability, absence of interference |
| System Suitability Standards | Daily performance verification | Well-characterized resolution, tailing factor, and retention time |
Advanced Applications: Biologics and Multivariate Methods
Special Considerations for Biological Products
The application of ICH Q2(R2) and ICH Q14 to biological products requires special considerations due to their inherent complexity and the nature of the analytical methods employed [9].
Key Challenges and Solutions:
- Potency Assays: Often biologically-based with higher variability
- Solution: Implement parallel line analysis with wider acceptance criteria
- Focus on intermediate precision rather than just repeatability
- Product-Related Impurity Methods: Impurities may not be fully characterized
- Solution: Focus on validation of what can be controlled
- Implement orthogonal methods for comprehensive characterization
- Platform Procedures: Common for monoclonal antibodies and novel modalities
- Solution: Leverage prior knowledge while demonstrating suitability for specific product
- Use modular validation approaches where appropriate
Multivariate Analytical Procedures
ICH Q14 includes specific guidance on developing multivariate analytical procedures, such as Near Infrared (NIR) and Raman spectroscopy [5] [9]. These methods require different validation approaches compared to univariate methods.
Validation Considerations for Multivariate Methods:
- Model Robustness: Evaluate the effect of variations in sample presentation, environmental conditions, and instrument response
- Specificity: Demonstrate the model's ability to identify and quantify the analyte in the presence of expected variations in the sample matrix
- Accuracy: Validate using primary reference methods, accounting for the total error of the multivariate prediction
- Precision: Include both repeatability of sample measurements and reproducibility of model predictions
Lifecycle Management and Post-Approval Changes
ICH Q14 provides principles for managing analytical procedures throughout their lifecycle, including post-approval changes [5]. A well-documented enhanced approach facilitates more efficient regulatory reporting of changes, as the understanding built during development provides scientific justification for the proposed changes.
Change Management Protocol:
- Change Identification: Document proposed change and its potential impact
- Risk Assessment: Evaluate potential impact on method performance relative to ATP
- Bridging Studies: Design experiments to demonstrate comparable performance
- Reporting Categorization: Determine regulatory reporting category based on risk assessment
- Implementation: Deploy change with appropriate documentation and training
The enhanced approach with proper knowledge management enables some changes to be implemented under the company's pharmaceutical quality system without prior approval, as the existing knowledge provides sufficient evidence that the change does not impact method performance [5].
Within drug substance assay research, the validation of analytical methods is a fundamental prerequisite for generating reliable and meaningful data. It provides documented evidence that a specific analytical procedure is fit for its intended purpose, ensuring the identity, potency, purity, and quality of drug substances. This document, framed within a broader thesis on analytical method validation, details the application notes and experimental protocols for five core validation parameters: Accuracy, Precision, Specificity, Linearity, and Range. These parameters, as defined in the ICH Q2(R2) guideline, form the foundation for demonstrating that an analytical method is suitable for providing trustworthy results to support drug development and regulatory compliance [7].
Core Parameters: Application Notes & Protocols
The following sections provide a detailed examination of each core validation parameter, including its definition, regulatory basis, and a standardized experimental protocol.
Accuracy
Application Notes: Accuracy measures the closeness of agreement between the value found by the analytical method and the value accepted as either a conventional true value or an accepted reference value. It is sometimes termed "trueness" and is established across the specified range of the method [11]. For drug substance assays, accuracy is typically assessed by applying the method to a drug substance that has been spiked with known quantities of impurities, or by comparison to a well-characterized reference method [11].
Experimental Protocol:
- Sample Preparation: Prepare a minimum of nine determinations at a minimum of three concentration levels (e.g., 80%, 100%, 120% of the target concentration) covering the specified range. Each concentration level should be prepared in triplicate [11].
- Reference Standard: Use a certified reference standard of the drug substance with known purity for preparation of the accuracy samples.
- Analysis: Analyze the prepared samples using the method under validation.
- Data Analysis: Calculate the recovery (%) for each measurement using the formula: (Measured Concentration / Known Concentration) × 100. Report the mean recovery and the relative standard deviation (RSD) or confidence interval for each concentration level [11].
Table 1: Example Acceptance Criteria for Accuracy
| Analytical Procedure | Concentration Level | Typical Acceptance Criteria (Mean Recovery %) |
|---|---|---|
| Drug Substance Assay | 100% (Target) | 98.0 - 102.0% |
| 80% - 120% of Target | 98.0 - 102.0% | |
| Impurity Quantification | Reporting Threshold | Varies based on impurity level and relevance |
Precision
Application Notes: Precision expresses the closeness of agreement (degree of scatter) between a series of measurements obtained from multiple sampling of the same homogeneous sample under the prescribed conditions [11]. It is investigated at three levels:
- Repeatability (Intra-assay Precision): Precision under the same operating conditions over a short interval of time [12] [11].
- Intermediate Precision: Precision within the same laboratory, including variations such as different days, different analysts, or different equipment [11].
- Reproducibility (Ruggedness): Precision between different laboratories, typically assessed during method transfer studies [11].
Experimental Protocol:
- Repeatability: Analyze a minimum of six determinations at 100% of the test concentration, or a minimum of nine determinations covering the specified range (e.g., three concentrations/three replicates each) [11].
- Intermediate Precision: Perform the same procedure as for repeatability, but using a different analyst on a different day with different equipment (e.g., HPLC system and column). A collaborative experimental design between two analysts is recommended [11].
- Data Analysis: For all precision measurements, report the standard deviation (SD) and the relative standard deviation (%RSD) of the results. For intermediate precision, the % difference in the mean values between the two analysts' results can be subjected to statistical tests (e.g., Student's t-test) [11].
Table 2: Example Acceptance Criteria for Precision
| Type of Precision | Sample Type | Typical Acceptance Criteria (%RSD) |
|---|---|---|
| Repeatability | Drug Substance (Assay) | Not more than (NMT) 1.0% |
| Intermediate Precision | Drug Substance (Assay) | NMT 1.5% (and no significant difference between analysts based on t-test) |
Specificity
Application Notes: Specificity is the ability to assess unequivocally the analyte of interest in the presence of other components that may be expected to be present, such as impurities, degradants, or matrix components [13] [14]. A specific method ensures that a peak's response is due to a single component, with no co-elutions. For chromatographic methods, specificity is commonly demonstrated by the resolution of the two most closely eluted compounds and can be confirmed using peak purity tests based on photodiode-array (PDA) or mass spectrometry (MS) detection [11].
Experimental Protocol:
- For Identification: Demonstrate the ability of the method to discriminate between compounds of closely related structure which are likely to be present.
- For Assay and Impurity Tests: Inject individual solutions of the drug substance and potential interfering components (e.g., impurities, degradants, excipients) to demonstrate that they do not interfere with the analyte peak.
- Forced Degradation Studies: Stress the drug substance sample (e.g., with acid, base, oxidation, heat, and light) and analyze the samples to demonstrate that the assay is unaffected by the presence of degradants and that the analyte peak is pure and free from co-eluting peaks.
- Data Analysis: Report the resolution between the analyte peak and the closest eluting potential interfering peak. For PDA, report the peak purity index, confirming that the analyte peak is spectrally homogeneous [11].
Linearity and Range
Application Notes: Linearity is the ability of the method to obtain test results that are directly proportional to the concentration of the analyte in a given range. Range is the interval between the upper and lower concentrations of the analyte for which it has been demonstrated that the analytical procedure has a suitable level of precision, accuracy, and linearity [13] [14]. The range is normally expressed in the same units as the test results.
Experimental Protocol:
- Sample Preparation: Prepare a minimum of five concentration levels of the analyte spanning the specified range. A typical range for a drug substance assay is from 80% to 120% of the target concentration [11].
- Analysis: Analyze each concentration level in a randomized order.
- Data Analysis: Plot the analyte response against the known concentration. Perform a linear regression analysis on the data. Report the regression line equation, the coefficient of determination (r²), and the y-intercept. Evaluate the residuals (the difference between the observed and the predicted values) to check for any systematic non-linear patterns [11].
Table 3: Example Acceptance Criteria for Linearity
| Parameter | Typical Acceptance Criteria |
|---|---|
| Correlation Coefficient (r) | Not less than (NLT) 0.997 |
| Coefficient of Determination (r²) | NLT 0.995 |
| Y-Intercept | Should be not significantly different from zero (e.g., p > 0.05) |
| Residuals | Randomly distributed around zero |
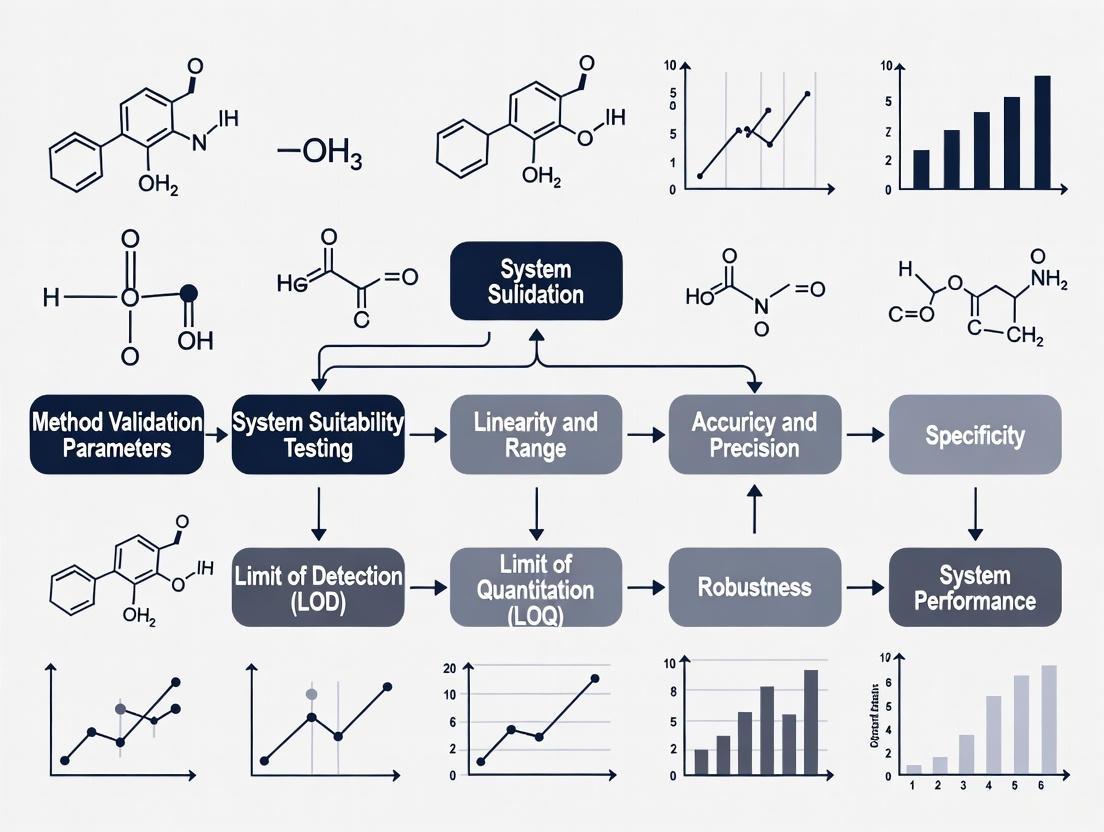
Visualizing the Validation Workflow and Relationships
The core validation parameters are not isolated; they are interconnected components of a comprehensive validation strategy. The following diagrams illustrate the logical workflow for method validation and the relationships between the key parameters.
Diagram 1: Sequential Validation Workflow
Diagram 2: Interrelationship of Core Parameters
The Scientist's Toolkit: Essential Research Reagents and Materials
The successful execution of validation protocols relies on a set of essential materials and reagents. The following table details key items required for experiments, particularly those involving chromatographic techniques for drug substance assay.
Table 4: Essential Research Reagents and Materials for Validation Studies
| Item | Function in Validation |
|---|---|
| Certified Reference Standard | Provides an accepted reference value with known purity and identity, essential for assessing Accuracy and Linearity [11]. |
| High-Purity Solvents & Reagents | Ensure the analytical signal is specific to the analyte and prevent interference or baseline noise that affects LOD/LOQ and Specificity. |
| Chromatographic Column | The stationary phase for separation; critical for achieving Specificity by resolving the analyte from impurities [11]. |
| Mass Spectrometry (MS) Detector | Provides unequivocal confirmation of peak identity and purity, offering orthogonal data for Specificity validation [11]. |
| Photodiode-Array (PDA) Detector | Enables collection of UV spectra across a peak, used for confirming peak homogeneity and purity for Specificity [11]. |
| Stable Isotope-Labeled Internal Standard | Used in complex matrices to improve the Precision and Accuracy of quantitation by correcting for sample preparation variability. |
The Impact of Data Integrity and ALCOA+ Principles on Method Validation
The validation of analytical methods is a critical pillar in pharmaceutical research and development, ensuring that the methods used to quantify drug substances are reliable, reproducible, and fit for their intended purpose. In the context of drug substance assay research, the integrity of the data generated throughout the method validation lifecycle is paramount. The ALCOA+ framework provides a foundational set of principles that, when embedded into validation activities, safeguards data quality and regulatory compliance. These principles—Attributable, Legible, Contemporaneous, Original, and Accurate, expanded with Complete, Consistent, Enduring, and Available—have evolved from a regulatory concept into a practical toolkit for ensuring data trustworthiness from initial method development through to routine use [15].
Global regulatory authorities, including the U.S. Food and Drug Administration (FDA) and the European Medicines Agency (EMA), intensely focus on data integrity during inspections. Analyses indicate that a significant majority of FDA warning letters cite data integrity lapses, often linked to inadequate controls over electronic records and audit trails [16] [15]. For analytical scientists, this translates to a non-negotiable requirement: method validation must be planned and executed with ALCOA+ as a core design feature, not as a retrospective add-on. This approach is especially crucial for drug substance assays, where the accuracy of results directly impacts decisions about product safety, efficacy, and quality [17].
The ALCOA+ Framework in the Context of Method Validation
The ALCOA+ principles provide a clear and actionable roadmap for maintaining data integrity at every stage of an analytical method's lifecycle. The table below defines each principle and illustrates its specific application in drug substance assay validation.
Table 1: Application of ALCOA+ Principles in Analytical Method Validation for Drug Substance Assay
| ALCOA+ Principle | Core Definition | Application in Method Validation & Drug Substance Assay |
|---|---|---|
| Attributable | Who acquired the data or performed an action, and when? | Linking all data (e.g., chromatograms, sample weights, results) to the specific analyst and instrument used. Using unique user logins for computerized systems like HPLC to track all actions [18] [19]. |
| Legible | Can the data be read and understood permanently? | Ensuring all records, including electronic raw data files, notebook entries, and printouts, remain readable and accessible for the entire required retention period [18] [20]. |
| Contemporaneous | Was the data recorded at the time the activity was performed? | Documenting sample preparation, instrument analysis, and observations in real-time, not retrospectively. Using system-generated, synchronized timestamps for all electronic records [16] [21]. |
| Original | Is this the first capture or a certified copy of the data? | Preserving the source data file from the instrument (e.g., the raw chromatographic data sequence) as the definitive record, not a processed printout or transcribed result [16] [19]. |
| Accurate | Is the data error-free and truthful? | Implementing controls such as calibrated balances and pipettes, validated calculations within software, and scientifically sound procedures to prevent and detect errors [16] [20]. |
| Complete | Is all data present, including repeats and rejects? | Retaining all data generated during validation, including all replicate injections, failed runs, and out-of-specification (OOS) results, with associated metadata and audit trails [18] [22]. |
| Consistent | Is the data sequenced logically with aligned timestamps? | Sequencing all steps chronologically with consistent date/time formats. Ensuring system clocks are synchronized across all devices (e.g., HPLC, balance, PC) to avoid contradictions [16] [18]. |
| Enduring | Is the data preserved for the required retention period? | Storing all validation data and records in a durable, validated format (e.g., secure electronic archives with regular backups) to prevent loss or degradation [18] [23]. |
| Available | Can the data be retrieved and reviewed when needed? | Ensuring that all data, metadata, and audit trails are readily accessible for the lifetime of the record for review, audit, or inspection purposes [16] [18]. |
The progression from the original five ALCOA principles to the expanded ALCOA+ reflects the industry's and regulators' response to the complexities of modern, digital data systems. The "+" attributes ensure that data is not only created reliably but also remains reliable, reconstructible, and trustworthy throughout the method's entire lifecycle [15] [22]. Some regulatory frameworks, such as the draft EU GMP Chapter 4, are now further formalizing ALCOA++, which explicitly adds Traceable to the list, emphasizing the need for a fully reconstructible data history [15].
Application Notes: Integrating ALCOA+ into the Method Validation Lifecycle
Embedding data integrity by design, guided by ALCOA+, is the most effective strategy for ensuring the credibility of an analytical method. The following workflow visualizes how these principles are integrated into the key stages of the method validation lifecycle for a drug substance assay.
Diagram 1: ALCOA+ in the Method Validation Lifecycle (LCM: Lifecycle Management)
Method Development and Validation Planning
The foundation of data integrity is laid during the planning and development stages. A risk-based approach should be employed to identify and control potential data integrity vulnerabilities.
- Risk Assessment and Controls: Identify critical data and processes within the method where errors or manipulation could occur. For a drug substance assay, this includes steps like standard/ sample weighing, solution preparation, dilution, and chromatographic integration. Mitigating controls include using calibrated and connected balances that log weights electronically, validated titration instruments, and integrated chromatography data systems (CDS) with enabled and secured audit trails [19] [17].
- Validation Protocol Design: The validation protocol itself must be a Complete and Consistent document. It should predefine all acceptance criteria for validation parameters (specificity, accuracy, precision, linearity, range, robustness) and explicitly state the procedures for data recording, including the types of raw data to be collected and the review processes for data and audit trails [17].
Execution of Validation Studies
During the hands-on phase of validation, the core ALCOA principles are put into practice to ensure the trustworthiness of the generated data.
- Attributable and Contemporaneous Data Capture: Analysts must use unique login credentials for all computerized systems, such as the CDS and Electronic Lab Notebook (ELN). All data entries must be made at the time of the activity. System clocks must be synchronized to a network time protocol (NTP) server to ensure Contemporaneous and Consistent timestamps across all instruments and records [16] [21].
- Accuracy and Originality of Data: All equipment (e.g., HPLC systems, balances, pH meters) must be within their calibration due dates. The Original raw data files from instruments must be saved to a secure, managed location immediately upon acquisition. Any manual transcription of data (e.g., from a balance to an ELN) should be verified by a second person, though automated data capture is strongly preferred [20] [23].
Data Management, Reporting, and Lifecycle Management
Once data is generated, the "plus" attributes of ALCOA+ ensure its long-term reliability and utility.
- Complete and Enduring Data Retention: All data generated during the validation must be retained, including chromatograms for all replicates, sample preparation records, and instrument qualification logs. This includes metadata and audit trails that track any reprocessing or changes. Data must be backed up and archived in a validated system to ensure it is Enduring and Available throughout the record retention period [18] [22].
- Traceable Reporting and Lifecycle Management: The final validation report must be Accurate and Complete, allowing for the clear Traceability of all results back to the Original source data. Any changes to the method after its implementation, or performance issues identified during routine use, should be managed through a formal change control process, triggering method re-validation or improvement, thus closing the lifecycle loop [15] [17].
Experimental Protocols for ALCOA+-Compliant Method Validation
Protocol: Determination of Accuracy for a Drug Substance Assay
1.0 Objective To demonstrate the accuracy of the analytical method by spiking a drug substance into a placebo (if applicable) or sample matrix at known concentrations and determining the recovery of the assay.
2.0 ALCOA+ Considerations & Pre-Execution Checks
- Attributable: Confirm unique user logins for the CDS and LIMS/ELN.
- Original & Accurate: Verify HPLC system calibration and performance qualification (e.g., system suitability test). Use certified reference standards.
- Complete: Plan for three concentration levels (e.g., 80%, 100%, 120% of target), each with three replicates. The protocol must include all these samples.
3.0 Procedure
- Sample Preparation: Precisely weigh and prepare the drug substance to produce solutions at 80%, 100%, and 120% of the target test concentration. Perform each preparation independently three times.
- Data Acquisition: Inject each preparation into the HPLC system following the validated method. The CDS sequence file, which links the sample to the specific vial position and analyst, is the Original record.
- Data Recording: Record all sample weights, dilution volumes, and preparation dates Contemporaneously in an ELN or controlled worksheet. The CDS automatically captures the injection timestamp and raw data file.
4.0 Data Analysis and Acceptance Criteria
- Calculate the percentage recovery for each preparation and the mean recovery at each concentration level.
- The method is considered accurate if the mean recovery at each level is within 98.0–102.0%, and the Relative Standard Deviation (RSD) for the replicates is ≤2.0%.
5.0 Data Integrity & Documentation Requirements
- Retain: The complete CDS sequence and raw data files for all injections, including any failed or invalid runs.
- Retain: Electronic lab notebook pages or controlled worksheets with all calculations.
- Review: The audit trail for the CDS sequence file to verify there were no unauthorized or unexplained changes post-acquisition [16] [21].
Protocol: Determination of Precision for a Drug Substance Assay
1.0 Objective To demonstrate the precision of the analytical method, expressed as repeatability (intra-assay precision) by analyzing multiple preparations of a homogeneous sample.
2.0 ALCOA+ Considerations
- Consistent: Ensure all preparations and analyses are performed by the same analyst, using the same instrument, in a single session to qualify as repeatability.
- Complete: The dataset must include all replicate results without exclusion.
3.0 Procedure
- Prepare six independent sample solutions from a single, homogeneous batch of the drug substance at 100% of the test concentration.
- Inject each solution once into the HPLC system under the same analytical conditions.
4.0 Data Analysis and Acceptance Criteria
- Calculate the %RSD of the assay results obtained from the six injections.
- The method is considered precise if the %RSD is ≤2.0%.
5.0 Data Integrity & Documentation Requirements
- Retain: The raw data files for all six injections and the system suitability injections.
- Document: Justification for any outlier removal, which must be pre-defined in the protocol and involve statistical analysis. The original result must still be retained [18] [22].
Table 2: Key Research Reagent Solutions and Materials for Drug Substance Assay Validation
| Material/Reagent | Function in Validation | ALCOA+ Integrity Consideration |
|---|---|---|
| Certified Reference Standard | Provides the known, high-purity substance against which the method's Accuracy and Linearity are calibrated. | Must be traceable to a primary standard (e.g., USP) with a valid certificate of analysis (Attributable, Accurate). Log usage and weight to ensure data Completeness [17]. |
| HPLC-Grade Solvents & Buffers | Used in mobile phase and sample preparation. Purity is critical for baseline stability, specificity, and preventing false peaks. | Prepare with calibrated pH meters and record batch numbers of solvents. Document preparation dates and expiration times to ensure Accuracy and Consistency [23]. |
| Chromatography Data System (CDS) | Software for controlling the HPLC, acquiring data, and processing results (e.g., peak integration). | Must be validated [21 CFR Part 11/Annex 11 compliant]. Requires unique user logins (Attributable), an enabled audit trail (Complete, Traceable), and secure, backed-up data storage (Enduring, Available) [19] [24]. |
| Electronic Lab Notebook (ELN) | Digital system for recording sample prep details, observations, and results. | Promotes Contemporaneous recording and structured data capture. Configurable workflows and e-signatures ensure Attributability and Completeness versus paper [21] [23]. |
Adherence to ALCOA+ principles is no longer a best practice but a regulatory mandate. The FDA, EMA, and other global authorities explicitly reference these principles in their guidance documents [15] [23]. Failure to demonstrate robust data integrity controls during method validation can lead to serious regulatory consequences, including FDA Form 483 observations, warning letters, and rejection of regulatory submissions, ultimately compromising drug approval [16] [22].
In conclusion, the impact of data integrity and ALCOA+ principles on analytical method validation is profound and all-encompassing. For a drug substance assay, which forms the bedrock of quality control for a pharmaceutical product, a method is only scientifically valid if the data proving its validity is itself trustworthy. By integrating ALCOA+ into every stage of the validation lifecycle—from initial risk assessment and protocol design through to data acquisition, management, and reporting—organizations can ensure the generation of reliable, defensible, and inspection-ready data. This not only fulfills regulatory expectations but also builds a solid foundation of quality and safety for the patient.
Exploring the Shift from Traditional to Lifecycle Management Approaches
The foundation of pharmaceutical quality control is undergoing a fundamental transformation, moving from static, compliance-focused validation exercises toward dynamic, science-based lifecycle management of analytical procedures. This paradigm shift is driven by updated international regulatory guidelines, particularly ICH Q2(R2) on analytical procedure validation and ICH Q14 on analytical procedure development, which were finalized in 2023 and implemented in 2024 [25]. These guidelines, together with the United States Pharmacopeia's revised general chapter <1225> on Validation of Compendial Procedures, form an interconnected framework that demands the industry abandon the comfortable fiction that validation is a discrete event rather than an ongoing commitment to analytical quality [26].
The traditional approach to analytical method validation has followed a familiar script: conduct studies demonstrating acceptable performance for specific parameters, generate validation reports showing data meets predetermined acceptance criteria, and file these reports for regulatory submissions [26]. This "check-the-box" methodology often created what has been described as "compliance theater"—a performance of rigor that may not reflect the method's actual capability to generate reliable results under routine conditions [26]. In contrast, the lifecycle management perspective championed by ICH Q14 and USP <1220> treats validation as just one stage in a continuous process of ensuring analytical fitness for purpose [26]. This modern framework consists of three interconnected stages: Stage 1 (Procedure Design), which generates understanding of how method parameters affect performance; Stage 2 (Procedure Performance Qualification), which confirms the method performs as intended under specified conditions; and Stage 3 (Continued Procedure Performance Verification), which treats method capability as dynamic rather than static [26] [2].
This application note examines the practical implementation of this paradigm shift within the specific context of validating analytical methods for drug substance assay research. It provides detailed protocols, visualization tools, and comparative frameworks to enable researchers, scientists, and drug development professionals to successfully navigate this transition and build genuinely robust analytical systems rather than just impressive validation packages.
Comparative Analysis: Traditional vs. Lifecycle Approaches
Foundational Principles and Regulatory Basis
Table 1: Core Differences Between Traditional and Lifecycle Validation Approaches
| Aspect | Traditional Validation Approach | Lifecycle Management Approach |
|---|---|---|
| Regulatory Foundation | ICH Q2(R1) [2] | ICH Q2(R2), ICH Q14, USP <1220>, ICH Q12 [26] [2] [27] |
| Underlying Philosophy | "Check-the-box" compliance [26] | Science- and risk-based understanding [2] |
| Temporal Nature | One-time event at method completion [26] | Continuous process throughout method lifespan [26] [2] |
| Primary Focus | Demonstrating acceptance criteria are met [26] | Ensuring ongoing fitness for purpose [26] |
| Key Planning Tool | Validation protocol [2] | Analytical Target Profile (ATP) [2] |
| Knowledge Management | Limited connection between development and validation [26] | Enhanced approach leveraging prior knowledge [2] [27] |
| Change Management | Complex, often requiring prior approval [27] | Facilitated through established conditions (ECs) and PACMPs [27] |
Impact on Drug Substance Assay Validation
For drug substance assay research, the lifecycle approach introduces several transformative concepts that fundamentally change how methods are developed, validated, and maintained. The Analytical Target Profile (ATP) serves as the cornerstone of this approach—a prospective summary that describes the intended purpose of an analytical procedure and its required performance characteristics [2]. By defining the ATP at the start of method development, researchers can ensure the method is designed to be fit-for-purpose from the very beginning [2].
The concept of "reportable result" represents another significant shift, forcing scientists to validate what they actually use for quality decisions, not just individual measurements [26]. For a drug substance assay, this means validating the precision and accuracy of the final reported value (e.g., the mean of duplicate sample preparations), rather than just demonstrating acceptable performance for individual injections [26]. This distinction is crucial because a method might show excellent repeatability for individual injections while exhibiting problematic variability when the full analytical procedure is executed under intermediate precision conditions.
The replication strategy concept further enhances this approach by ensuring that validation studies employ the same replication scheme that will be used for routine sample analysis to generate reportable results [26]. This alignment brings validation studies closer to "work-as-done" rather than "work-as-imagined," creating a more realistic assessment of method performance under actual operating conditions.
Implementation Framework and Experimental Protocols
Stage 1: Analytical Procedure Design with Enhanced Approaches
The initial stage of the analytical procedure lifecycle focuses on designing a robust method based on a clearly defined ATP and enhanced understanding of method parameters. The following protocol outlines the systematic approach for drug substance assay development.
Table 2: Analytical Target Profile for a Small Molecule Drug Substance Assay
| ATP Element | Specification | Justification |
|---|---|---|
| Intended Purpose | Quantification of active pharmaceutical ingredient (API) in drug substance release testing | Required for batch release specification |
| Measurement Type | % (w/w) of labeled claim | Consistent with regulatory filing requirements |
| Accuracy | Mean recovery 98.0-102.0% | Based on product quality requirements |
| Precision | RSD ≤ 1.0% for repeatability; RSD ≤ 2.0% for intermediate precision | Justified by manufacturing process capability |
| Specificity | No interference from known impurities, degradation products, or excipients | Ensures selective measurement of API |
| Linearity Range | 70-130% of target assay concentration | Covers from QL to well above expected range |
| Quantitation Limit | ≤ 0.5% of target concentration | Ensures adequate control of potential impurities |
Protocol 1: Enhanced Analytical Procedure Development for Drug Substance Assay
Objective: To develop a stability-indicating HPLC method for drug substance assay using enhanced, science-based approaches that facilitate lifecycle management.
Materials and Reagents:
- Drug substance reference standard (characterized for purity)
- Known impurities and degradation products (if available)
- HPLC-grade solvents (acetonitrile, methanol, water)
- Buffer salts (e.g., potassium phosphate, ammonium acetate)
- pH adjustment solutions (e.g., phosphoric acid, sodium hydroxide)
Equipment:
- HPLC system with photodiode array (PDA) or equivalent detector
- Analytical balance (calibrated)
- pH meter (calibrated)
- Ultrasonic bath for degassing and dissolution
Experimental Design:
- Risk Assessment: Conduct initial risk assessment using methodology aligned with ICH Q9 to identify high-risk method parameters that may impact method performance (e.g., column temperature, mobile phase pH, gradient profile).
- Design of Experiments (DoE): Implement a structured DoE to evaluate the effect of critical method parameters on key performance responses (e.g., resolution, peak asymmetry, runtime). A central composite design is often appropriate for this purpose.
- Forced Degradation Studies: Subject the drug substance to stress conditions (acid, base, oxidation, thermal, photolytic) to generate degradation products and validate the stability-indicating capability of the method.
- Method Optimization: Based on DoE results, establish the method operational design range (MODR) for each critical parameter that ensures robust method performance.
Data Analysis:
- Construct mathematical models describing the relationship between method parameters and performance attributes.
- Identify the MODR where the method meets all ATP requirements.
- Document all development data and decisions in a method development report.
Stage 2: Procedure Performance Qualification (Validation)
The second stage of the lifecycle involves formal validation of the analytical procedure to demonstrate it is fit for its intended purpose as defined in the ATP.
Protocol 2: Lifecycle-Based Validation for Drug Substance Assay
Objective: To qualify the performance of the developed HPLC method for drug substance assay according to the ATP requirements and ICH Q2(R2) recommendations.
Validation Parameters and Experiments:
- Specificity: Inject individually solutions of the drug substance, known impurities, degradation products from forced degradation studies, and mobile phase blanks. Demonstrate baseline separation between the analyte and potential interferants, and establish that the method is stability-indicating.
- Linearity and Range: Prepare and analyze standard solutions at a minimum of five concentration levels spanning the range of 70-130% of the target assay concentration. Plot peak response versus concentration and calculate correlation coefficient, y-intercept, and slope of the regression line.
- Accuracy: Prepare recovery samples at three concentration levels (80%, 100%, 120%) in triplicate by spiking known amounts of drug substance reference standard into placebo (if applicable) or diluent. Calculate percentage recovery for each level and overall mean recovery.
- Precision:
- Repeatability: Analyze six independent preparations at 100% of test concentration by the same analyst on the same day. Calculate %RSD of assay results.
- Intermediate Precision: Perform the same analysis on different days, by different analysts, or using different instruments. Incorporate the same replication strategy that will be used for routine reportable results [26].
- Quantitation Limit (QL): Determine the lowest amount of analyte that can be quantified with acceptable accuracy and precision, typically using signal-to-noise ratio of 10:1 or based on the standard deviation of the response and the slope.
- Robustness: Deliberately introduce small, deliberate variations in critical method parameters (e.g., mobile phase composition ±2%, temperature ±5°C, flow rate ±10%) to evaluate method resilience.
Data Analysis and Acceptance Criteria: All validation data should be evaluated against pre-defined acceptance criteria derived from the ATP. For a drug substance assay, typical acceptance criteria include:
- Specificity: Resolution > 2.0 between analyte and closest eluting peak
- Linearity: Correlation coefficient (r) ≥ 0.999
- Accuracy: Mean recovery 98.0-102.0%
- Precision: RSD ≤ 1.0% for repeatability; RSD ≤ 2.0% for intermediate precision
Table 3: Validation Report Summary for Drug Substance Assay
| Validation Parameter | Results Obtained | Acceptance Criteria | Status |
|---|---|---|---|
| Specificity | Resolution > 2.5 from all known impurities; No interference at retention time | Resolution > 2.0; No interference | Pass |
| Linearity | r = 0.9998; y-intercept not significantly different from zero (p > 0.05) | r ≥ 0.999 | Pass |
| Range | 70-130% of test concentration | 70-130% | Pass |
| Accuracy | Mean recovery 99.8% (Range 99.2-100.5%) | 98.0-102.0% | Pass |
| Repeatability | RSD = 0.45% (n=6) | RSD ≤ 1.0% | Pass |
| Intermediate Precision | RSD = 0.78% (n=12, across two analysts/two days) | RSD ≤ 2.0% | Pass |
| Robustness | All variations met system suitability; Method robust within established MODR | Meet system suitability under all conditions | Pass |
Stage 3: Continued Procedure Performance Verification
The third stage of the lifecycle ensures the method remains in a state of control throughout its operational use and accommodates necessary improvements or technology updates.
Protocol 3: Ongoing Monitoring and Change Management
Objective: To ensure the continued fitness for purpose of the drug substance assay method throughout its lifecycle and facilitate science-based change management.
System Suitability Testing (SST):
- Establish SST parameters based on the ATP and validation knowledge (e.g., tailing factor, theoretical plates, %RSD for replicate injections)
- Require SST execution before each analytical run
- Implement trending of SST parameters to detect potential performance drift
Ongoing Data Collection and Trend Analysis:
- Monitor assay results for the drug substance over time using control charts
- Periodically assess precision through duplicate or replicate testing
- Document all deviations and investigations
Change Management Process:
- Risk Assessment: Evaluate proposed changes based on potential impact to the ATP and product quality
- Bridging Studies: Design appropriate comparative studies to demonstrate equivalence between original and modified methods
- Regulatory Assessment: Determine reporting category based on established conditions (ECs) and product lifecycle management (PLCM) documents [27]
- Implementation: Execute change following approved protocols and documentation requirements
The Scientist's Toolkit: Essential Research Reagent Solutions
Table 4: Key Research Reagent Solutions for Lifecycle-Based Method Validation
| Reagent/Material | Function in Validation | Lifecycle Considerations |
|---|---|---|
| Well-Characterized Reference Standard | Primary standard for quantification; basis for accuracy determination | Requires ongoing monitoring of stability and qualification of new lots; critical for long-term method consistency |
| System Suitability Test Mixtures | Verification of method performance before each use | Should contain key analytes and critical separations; may need updates based on knowledge gained during lifecycle |
| Known Impurity Standards | Specificity demonstration and quantification of impurities | Portfolio should expand as new impurities are identified; establishes method selectivity |
| Stability-Indicating Stress Samples | Specificity verification under forced degradation conditions | Confirms method remains stability-indicating; may be used for tech transfer and troubleshooting |
| Quality Control Check Samples | Ongoing verification of method performance | Monitors method precision and accuracy over time; establishes historical performance baselines |
The transition from traditional validation to analytical procedure lifecycle management represents a fundamental evolution in how the pharmaceutical industry ensures analytical quality. This shift from a "check-the-box" compliance exercise to a science-based, holistic approach enhances method robustness, facilitates continuous improvement, and ultimately provides greater assurance of product quality and patient safety. By implementing the frameworks, protocols, and tools outlined in this application note, researchers and drug development professionals can successfully navigate this paradigm shift and build analytical methods that remain fit-for-purpose throughout their entire operational lifespan.
The successful adoption of lifecycle approaches requires organizational commitment to enhanced method development, robust knowledge management, and science-based change management practices. As regulatory frameworks continue to evolve toward these principles, organizations that embrace these concepts early will benefit from more efficient method maintenance, more flexible post-approval changes, and ultimately, more reliable analytical data for critical quality decisions.
Modern Method Development and Application: Implementing QbD, AI, and Advanced Technologies
Adopting a Quality-by-Design (QbD) Framework for Robust Analytical Procedure Development
Analytical Quality by Design (AQbD) represents a paradigm shift in the development of analytical methods, moving away from traditional, empirical approaches toward a systematic, proactive, and risk-based framework. Rooted in the principles of Quality by Design (QbD), which was formally introduced to the pharmaceutical industry through ICH Q8-Q11 guidelines, AQbD aims to ensure the quality of analytical methods through deliberate design rather than relying solely on end-product testing [28] [29]. This approach begins with predefined objectives and emphasizes method understanding and control based on sound science and quality risk management [30] [31].
The traditional trial-and-error approach to analytical method development often proves time-consuming, resource-intensive, and may lack reproducibility, potentially leading to out-of-trend (OOT) and out-of-specification (OOS) results during routine application [31]. In contrast, AQbD provides a structured framework for building quality into the analytical method from the outset, focusing on understanding the relationship between Critical Method Parameters (CMPs) and Critical Method Attributes (CMAs) [31]. This enhanced understanding leads to more robust methods that remain reliable throughout their lifecycle, ultimately supporting the broader product development lifecycle and ensuring consistent drug quality [30] [32].
For drug substance assay research, implementing AQbD is particularly valuable as it directly impacts the reliability of critical quality attribute (CQA) data used to make decisions about drug safety and efficacy. Regulatory agencies, including the FDA and EMA, actively encourage the implementation of QbD principles, recognizing their potential to enhance product quality and facilitate continuous improvement [33] [29].
Core Principles and Workflow of AQbD
The AQbD Workflow
The implementation of AQbD follows a systematic workflow that parallels the QbD approach for pharmaceutical products but is tailored to analytical method development. This workflow ensures that method performance requirements are clearly defined, potential risks are identified and mitigated, and method conditions are optimized to produce reliable, high-quality data [30] [31].
The following diagram illustrates the comprehensive AQbD workflow, from defining measurement requirements to establishing a control strategy for ongoing method verification:
Key Principles of AQbD
Several key principles distinguish AQbD from traditional method development approaches:
- Proactive Design: Quality is built into the analytical method during the design phase rather than verified solely through retrospective testing [29] [31].
- Risk-Based Approach: Systematic risk assessment tools are employed to identify and prioritize factors that may impact method performance, allowing resources to be focused on the most critical variables [30] [31].
- Scientific Understanding: The functional relationships between method inputs (parameters) and outputs (performance characteristics) are established through structured experimentation [28] [30].
- Lifecycle Management: Method performance is continuously monitored and verified throughout its operational life, with provisions for continuous improvement [30] [31].
These principles collectively ensure that analytical methods developed under the AQbD framework are robust, reproducible, and capable of providing reliable data to support decision-making in drug development [30].
Implementation Protocol for AQbD in Drug Substance Assay
Stage 1: Method Design and Development
Define the Analytical Target Profile (ATP)
The Analytical Target Profile serves as the foundation for all AQbD activities. It is a prospective summary of the analytical method's requirements, defining the characteristics that the method must demonstrate to be fit for its intended purpose [30] [31]. The ATP should directly align with the Quality Target Product Profile (QTPP) of the drug product and specify the required quality of the measurement needed to evaluate Critical Quality Attributes (CQAs) of the drug substance [31].
Protocol for ATP Definition:
- Identify the Analyte: Clearly define the drug substance and any potential impurities, degradation products, or related substances that require quantification [31].
- Establish Performance Criteria: Define the required performance characteristics for the method, including:
- Accuracy: Typically ±10% of the true value for drug substance assay [30]
- Precision: Relative standard deviation (RSD) not more than 2% for repeatability [30]
- Specificity: Ability to unequivocally quantify the analyte in the presence of impurities, degradation products, and matrix components [30] [31]
- Linearity and Range: Typically a correlation coefficient (r²) > 0.998 over specified range (e.g., 50-150% of target concentration) [30]
- Detection and Quantitation Limits: Based on signal-to-noise ratio or standard deviation of response [30]
- Document the ATP: Create a comprehensive ATP document that will guide all subsequent development activities and serve as a reference for method validation [30].
Identify Critical Quality Attributes (CQAs)
CQAs for analytical methods are physical, chemical, biological, or microbiological properties or characteristics that should be within an appropriate limit, range, or distribution to ensure the desired product quality [31]. For drug substance assay methods, CQAs typically include parameters such as accuracy, precision, specificity, and robustness [31].
Protocol for CQA Identification:
- Link to Product CQAs: Identify how analytical method attributes relate to the drug substance CQAs [28] [31].
- Prioritize Method CQAs: Use risk assessment to prioritize which method attributes are truly critical to ensuring the method meets its ATP [30] [31].
Risk Assessment
Risk assessment is a fundamental component of AQbD that systematically identifies and evaluates potential sources of variability in analytical method performance [31]. This process enables developers to focus experimental efforts on the most critical factors.
Protocol for Risk Assessment:
- Identify Potential Risk Factors: Brainstorm all potential factors that could impact method performance using tools such as Ishikawa (fishbone) diagrams [31]. For a typical HPLC method for drug substance assay, consider:
- Instrument Parameters: Detector wavelength, column temperature, flow rate, injection volume
- Mobile Phase Factors: pH, buffer concentration, organic modifier ratio
- Sample Preparation Factors: Extraction time, solvent composition, dilution volume
- Environmental Factors: Temperature, humidity
- Operator Factors: Technique, experience level [31]
- Prioritize Risk Factors: Use a structured approach such as Failure Mode Effects Analysis (FMEA) to rank factors based on their severity, occurrence, and detectability [31]. The following table illustrates a typical risk prioritization matrix:
Table 1: Risk Prioritization Matrix for Analytical Method Development
| Risk Factor | Severity (1-10) | Occurrence (1-10) | Detectability (1-10) | Risk Priority Number | Priority Level |
|---|---|---|---|---|---|
| Mobile Phase pH | 8 | 6 | 4 | 192 | High |
| Column Temperature | 7 | 5 | 3 | 105 | High |
| Flow Rate | 6 | 4 | 3 | 72 | Medium |
| Detection Wavelength | 5 | 2 | 2 | 20 | Low |
| Injection Volume | 4 | 3 | 3 | 36 | Low |
- Document Risk Assessment: Maintain comprehensive documentation of the risk assessment process, including rationale for prioritization decisions [31].
Stage 2: Method Qualification and Design Space Establishment
Design of Experiments (DoE)
DoE is a critical tool in AQbD that enables efficient, systematic evaluation of multiple factors and their interactions simultaneously [28] [31]. By applying statistical principles to experimental design, DoE maximizes information gain while minimizing the number of experiments required.
Protocol for DoE Application:
- Select Factors and Ranges: Based on the risk assessment, select the high-priority factors to include in the DoE and establish appropriate ranges for evaluation [31].
- Choose Experimental Design: Select an appropriate experimental design based on the number of factors and the objectives of the study:
- Define Responses: Identify the CQAs that will serve as responses in the experimental design [31].
- Execute Experiments: Conduct experiments according to the designed matrix, randomizing run order to minimize bias [28] [31].
- Analyze Data: Use statistical analysis to model the relationship between factors and responses, identifying significant factors and interactions [31].
Table 2: Example Box-Behnken Design for HPLC Method Development
| Experiment | Factor A: pH | Factor B: %Organic | Factor C: Flow Rate | Response: Resolution | Response: Tailing Factor |
|---|---|---|---|---|---|
| 1 | -1 | -1 | 0 | 4.5 | 1.2 |
| 2 | 1 | -1 | 0 | 5.2 | 1.1 |
| 3 | -1 | 1 | 0 | 3.8 | 1.4 |
| 4 | 1 | 1 | 0 | 4.9 | 1.3 |
| 5 | -1 | 0 | -1 | 4.1 | 1.3 |
| 6 | 1 | 0 | -1 | 5.1 | 1.2 |
| 7 | -1 | 0 | 1 | 4.3 | 1.2 |
| 8 | 1 | 0 | 1 | 5.0 | 1.1 |
| 9 | 0 | -1 | -1 | 4.8 | 1.1 |
| 10 | 0 | 1 | -1 | 4.0 | 1.5 |
| 11 | 0 | -1 | 1 | 4.7 | 1.2 |
| 12 | 0 | 1 | 1 | 4.2 | 1.4 |
| 13 | 0 | 0 | 0 | 4.9 | 1.1 |
| 14 | 0 | 0 | 0 | 4.8 | 1.1 |
| 15 | 0 | 0 | 0 | 5.0 | 1.1 |
Establish the Design Space
The design space is the multidimensional combination and interaction of input variables (e.g., method parameters) that have been demonstrated to provide assurance of quality [28] [31]. For analytical methods, this is often referred to as the Method Operable Design Region (MODR) [31].
Protocol for Design Space Establishment:
- Develop Mathematical Models: Use the data from DoE studies to develop mathematical models describing the relationship between method parameters and CQAs [31].
- Define MODR Boundaries: Identify the region within the factor space where all CQAs meet the acceptance criteria defined in the ATP [31].
- Verify MODR: Conduct verification experiments at the edges of the MODR and at the center point to confirm method performance [31].
- Document Design Space: Create comprehensive documentation of the MODR, including all supporting data and statistical analyses [28] [31].
Stage 3: Control Strategy and Lifecycle Management
Develop Control Strategy
A control strategy for an analytical method is a planned set of controls derived from current product and process understanding that ensures method performance and data quality [30] [31]. These controls include procedural controls, system suitability tests, and ongoing monitoring activities.
Protocol for Control Strategy Development:
- Define System Suitability Tests (SST): Establish SST parameters based on the understanding gained during method development to ensure the method is functioning correctly at the time of analysis [30]. Typical SST parameters for chromatographic methods include:
- Establish Control Limits: Set appropriate acceptance criteria for SST parameters based on the MODR verification data [31].
- Document Procedures: Create detailed, unambiguous standard operating procedures (SOPs) for method execution [30].
Continued Method Verification
Continued method verification provides ongoing assurance that the method remains in a state of control during routine use [30]. This represents a shift from the traditional one-time validation approach to a lifecycle management perspective.
Protocol for Continued Method Verification:
- Monitor Method Performance: Implement a system for ongoing monitoring of method performance indicators, such as SST results, quality control sample data, and investigation reports [30].
- Trend Data: Regularly review and trend method performance data to identify potential method drift or emerging issues [30].
- Manage Changes: Establish a change control procedure for evaluating and implementing method modifications based on the understanding of the MODR [30] [31].
Essential Research Reagent Solutions and Materials
The successful implementation of AQbD for drug substance assay development requires appropriate selection of reagents, materials, and instrumentation. The following table details key research reagent solutions and their functions in AQbD-based analytical development:
Table 3: Essential Research Reagent Solutions for AQbD Implementation
| Category | Specific Examples | Function in AQbD | Critical Considerations |
|---|---|---|---|
| Chromatographic Columns | C18, C8, phenyl, HILIC | Separation mechanism for analyte and impurities | Select multiple column chemistries during screening to evaluate robustness [31] |
| Mobile Phase Components | Buffer salts (e.g., potassium phosphate), pH modifiers, organic modifiers | Create elution environment for separation | Control pH, buffer concentration, organic ratio as Critical Method Parameters [31] |
| Reference Standards | Drug substance reference standard, impurity standards | Quantification and identification of analytes | Purity, stability, and proper characterization are essential for method accuracy [30] |
| Sample Preparation Solvents | Methanol, acetonitrile, water, dilution solvents | Extract and dissolve analyte for analysis | Solvent composition, volume, and extraction time may be optimized as CMPs [31] |
| System Suitability Materials | Test mixtures, resolution mixtures | Verify method performance before use | Parameters must be representative of method critical quality attributes [30] [31] |
Quantitative Benefits and Regulatory Considerations
Quantitative Benefits of AQbD Implementation
The implementation of AQbD offers significant quantitative benefits throughout the analytical method lifecycle. Studies have demonstrated that systematic QbD approaches can reduce development time by up to 40% by optimizing parameters before full-scale implementation [29]. Additionally, the enhanced robustness of AQbD-developed methods significantly reduces the incidence of out-of-trend (OOT) and out-of-specification (OOS) results, with some reported cases showing material wastage reductions of up to 50% [29] [31].
The pharmaceutical industry has reported a 40% reduction in batch failures through QbD implementation, with corresponding improvements in process robustness through real-time monitoring and adaptive control strategies [28]. For analytical methods specifically, the AQbD approach minimizes method variability and increases robustness, leading to more dependable analytical results throughout the method lifecycle [31].
Regulatory Considerations
Regulatory agencies globally have embraced QbD principles for pharmaceutical development and manufacturing. The FDA and EMA have conducted joint pilot programs for parallel assessment of QbD-based applications and have demonstrated strong alignment on QbD implementation [33]. The International Council for Harmonisation (ICH) guidelines Q8, Q9, Q10, and Q11 provide the foundational framework for QbD implementation, with ICH Q12 facilitating post-approval change management [28] [33].
For analytical methods, AQbD aligns with the principles outlined in ICH Q14, ensuring that methods are robust, reproducible, and regulatory-compliant throughout the product lifecycle [29]. The AQbD approach provides regulatory flexibility through established design spaces, wherein changes within the approved design space do not require regulatory re-approval [28] [31]. This flexibility enables continuous improvement throughout the product lifecycle while maintaining regulatory compliance [31].
The adoption of an Analytical Quality by Design framework represents a transformative approach to analytical method development for drug substance assays. By systematically building quality into methods from the initial design stage, implementing risk-based approaches, establishing scientifically justified design spaces, and maintaining lifecycle management through continued verification, AQbD delivers robust, reliable, and reproducible analytical methods.
The structured protocols outlined in this document provide a comprehensive roadmap for implementing AQbD in drug substance assay development. The integration of risk assessment, Design of Experiments, and control strategy development ensures that methods remain fit-for-purpose throughout their lifecycle, supporting the broader objective of ensuring drug product quality, safety, and efficacy.
As regulatory agencies continue to emphasize science- and risk-based approaches, AQbD implementation positions pharmaceutical companies to not only meet current regulatory expectations but also to leverage the benefits of reduced method failures, enhanced operational efficiency, and continuous improvement throughout the product lifecycle.
Leveraging Design of Experiments (DoE) for Efficient Method Optimization
Within the framework of validating analytical methods for drug substance assay research, achieving robust, precise, and accurate methods is paramount. Pharmaceutical Quality by Design (QbD) is a systematic approach that begins with predefined objectives and emphasizes product and process understanding based on sound science and quality risk management [34]. The application of QbD principles to analytical method development, termed Analytical QbD (AQbD), utilizes Design of Experiments (DoE) as a central tool for method characterization and validation [35]. DoE moves beyond the inefficient one-factor-at-a-time (OFAT) approach, enabling developers to efficiently understand the influence of multiple method parameters and their interactions on critical method attributes. This protocol outlines a detailed AQbD approach, providing application notes for leveraging DoE to optimize analytical methods, thereby ensuring they are fit-for-purpose and ready for validation.
Application Notes
Core Principles of DoE in Method Development
The primary objective of analytical method development is to provide an optimized procedure ready for method validation [34]. DoE is a powerful, statistically based methodology used to achieve this by systematically investigating the effects of multiple factors on key method performance characteristics. A well-executed DoE study provides a deep understanding of the method's design space, which is the multidimensional combination and interaction of input variables demonstrated to provide assurance of quality [35]. This understanding allows for method flexibility within the characterized space, meaning future changes in formulation or concentration within this space may not require re-validation [35].
A sequential approach is often recommended, though a practical adaptation may be necessary to conserve resources [35]:
- Screening Studies: Identify which of many potential factors have a significant effect on the method's outcomes.
- Characterization Studies: Quantify the relationship between the significant factors and the method responses.
- Optimization: Determine the optimal parameter settings to achieve the best method performance.
For analytical methods, DoE is typically applied in three distinct but complementary types of studies, each with a unique objective [34]:
Table 1: Types of DoE Studies in Analytical Method Development
| Study Type | Primary Objective | Typical Factors | Study Design Examples |
|---|---|---|---|
| Method Optimization | To identify critical analytical parameters, establish their set points, and define operating ranges to minimize bias and improve precision [34]. | Controlled continuous variables (e.g., column temperature, pH, mobile phase composition). | Full factorial, D-optimal designs. |
| Robustness | To understand the impact of small, deliberate variations in test parameter settings around their nominal values on method performance [34]. | Controlled continuous variables with set points already established. | Full factorial (for <4 factors), fractional factorial, or Plackett-Burman designs (for ≥4 factors). |
| Ruggedness | To evaluate the impact of uncontrolled, normal variation from typically discrete variables on method performance [34]. | Random factors representing a larger population (e.g., different analysts, laboratories, equipment, reagent lots, days). | Studies focused on estimating the magnitude of variation (variance components) for each source. |
Defining the Method Objectives and Scope
Before designing an experiment, it is crucial to define the purpose and scope with absolute clarity. The purpose directly dictates the structure of the study, the sampling plan, and the factor ranges [35].
- Identify the Purpose: The purpose should be explicitly defined, for example: improving repeatability, establishing intermediate precision, assessing linearity, or optimizing resolution [35].
- Define the Operational Range: The range of concentrations and the solution matrix that the method will be used to measure must be defined, as this establishes the characterized design space. The International Conference of Harmonization (ICH) Q2(R1) guideline normally recommends evaluating five concentrations [35].
- Determine Critical Responses: The responses measured should be directly aligned with the purpose of the study. These can include raw data or statistical measures such as bias, accuracy, precision (standard deviation or %CV), signal-to-noise ratio, and limits of detection/quantification (LOD/LOQ) [35].
Experimental Protocol
AQbD Workflow for Method Optimization
The following diagram illustrates the systematic workflow for applying AQbD and DoE to analytical method development.
Step-by-Step Protocol
Step 1: Define the Purpose of the Method Experiment
- Clearly articulate the goal, such as "to optimize the HPLC method for Drug Substance X assay to achieve a precision of %RSD <2.0% and accuracy of 98-102%." The purpose drives the study design; for instance, precision evaluation requires replicates, while accuracy determination may not [35].
Step 2: Perform a Risk Assessment
- Conduct a risk assessment of all materials, equipment, analysts, and method components to identify factors that may influence precision, accuracy, linearity, or other key responses. The outcome is a risk-ranked set of 3 to 8 factors for further study [35].
- Categorize Factors:
- Controllable Factors: Continuous (e.g., temperature), discrete numeric (e.g., number of cycles), categorical (e.g., brand of column).
- Uncontrollable Factors: Covariates (e.g., ambient humidity) and uncontrolled factors (e.g., analyst).
- Error Control Factors: Blocking factors (e.g., different instrument lots) and constants [35].
Step 3: Design the Experimental Matrix and Sampling Plan
- For 2-3 factors, a full factorial design is often appropriate.
- For more than 3 factors, a D-optimal custom design is recommended for efficiency in exploring the design space [35].
- Sampling Plan: Incorporate replicates (complete repeats of the method) to quantify total method variation and duplicates (multiple measurements of a single preparation) to quantify instrumental/chemical variation [35].
Step 4: Identify the Error Control Plan
- Decide which factors will be held constant and which need to be blocked (e.g., by analyst or instrument). Measure and record uncontrolled factors (e.g., ambient temperature, hold times) during the study, as they may explain variation in the results [35].
Step 5: Analyze the Data and Determine the Design Space
- Use multiple regression or analysis of covariance (ANCOVA) to analyze the data.
- If using summary statistics (e.g., CV, mean), weight the analysis by the number of replicates for statistically valid confidence intervals.
- Identify factor settings that improve precision and minimize bias. Establish the design space—the proven acceptable ranges for key method parameters [35].
Step 6: Verify the Model and Determine Method Impact
- Run confirmation tests under the optimal settings to validate that the model predictions hold true.
- Evaluate the method's impact on product acceptance rates and process capability using tools like an Accuracy-to-Precision (ATP) model, which visualizes how precision and accuracy affect the probability of passing product specifications [35].
Key Research Reagent Solutions
Table 2: Essential Materials for DoE in Analytical Method Development
| Item | Function in DoE |
|---|---|
| Well-Characterized Reference Standards | Critical for determining method bias and accuracy. Requires careful selection, storage, and handling to ensure stability and reliability [35]. |
| Critical Reagents (e.g., specific buffer salts, organic modifiers) | Their quality, purity, and lot-to-lot consistency are often studied as factors in ruggedness testing to understand their influence on method performance [34]. |
| Chromatographic Columns | Different column brands, chemistries, or lots can be investigated as categorical factors to ensure method robustness and ruggedness across expected variations. |
| Instrumentation/Equipment | Different instruments of the same model can be used as blocking factors or in ruggedness studies to quantify and control for instrument-to-instrument variation [35]. |
Applying a structured AQbD approach with DoE at its core transforms analytical method development from an empirical exercise into a science-driven process. This protocol outlines a systematic pathway from defining method objectives through risk assessment, experimental design, and data analysis to establish a characterized design space. This methodology delivers optimized, robust, and rugged analytical methods that are fit-for-purpose, ensure patient safety, and provide predictable, consistent outcomes in drug substance assay research [35] [34]. By building quality into the method design, developers can avoid costly re-validation and accelerate the drug development timeline.
The analysis of modern drug substances demands analytical techniques that deliver exceptional sensitivity, specificity, and efficiency. Hyphenated techniques, which combine a separation method with a spectroscopic detection technique, have become indispensable in this field [36]. By linking separation technologies like chromatography directly with powerful detection systems such as mass spectrometry, these integrated systems unlock a new level of analytical power, allowing researchers to separate complex mixtures and unambiguously identify and quantify target analytes [37]. The remarkable improvements in these methodologies over recent decades have significantly broadened their applications in the analysis of complex biological and pharmaceutical matrices [36].
Within the context of drug substance assay research and validation, three techniques are particularly impactful: Ultra-High-Performance Liquid Chromatography (UHPLC), which utilizes very high system pressures and columns packed with sub-2-μm particles to achieve enhanced separation efficiency and speed [38]; High-Resolution Mass Spectrometry (HRMS), which provides accurate mass measurement for superior selectivity [39]; and hyphenated systems such as LC-MS/MS, which marry the physical separation of Liquid Chromatography with the definitive identification and quantification capabilities of Tandem Mass Spectrometry [40] [36]. This article details the application of these techniques within a rigorous method validation framework, providing specific protocols and data to exemplify their critical role in modern pharmaceutical analysis.
Application Notes: Validated Methods in Pharmaceutical Analysis
The following application notes showcase the implementation of UHPLC-MS/MS and LC-HRMS for quantitative bioanalysis, highlighting key validation parameters as per international guidelines [41].
Application Note 1: UHPLC-MS/MS for Ciprofol Quantification in Human Plasma
Objective: To develop and validate a UHPLC-MS/MS method for the quantification of the novel anesthetic ciprofol (HSK3486) in human plasma for application in pharmacokinetic studies [40].
Experimental Summary: The method employed a simple methanol-based protein precipitation for sample preparation, using ciprofol-d6 as a stable isotope-labeled internal standard. Chromatographic separation was achieved on a Shimadzu Shim-pack GIST-HP C18 column (3 µm, 2.1×150 mm) with a mobile phase consisting of 5 mmol·L⁻¹ ammonium acetate and methanol, using a gradient elution. Detection was performed using electrospray ionization (ESI) in negative ion mode with multiple reaction monitoring (MRM) [40].
Table 1: Key Validation Parameters for the Ciprofol UHPLC-MS/MS Assay
| Validation Parameter | Result | Acceptance Criteria |
|---|---|---|
| Linear Range | 5 – 5000 ng·mL⁻¹ | |
| Correlation Coefficient (r) | > 0.999 | > 0.99 |
| Intra-/Inter-batch Precision (RSD) | 4.30% – 8.28% | Typically < 15% |
| Accuracy (Relative Deviation) | -2.15% to 6.03% | Typically ±15% |
| Extraction Recovery | 87.24% – 97.77% | Consistent and high |
| Matrix Effect RSD | < 15% | < 15% |
| LLOQ | 5 ng·mL⁻¹ | Sufficient for PK study |
Conclusion: The developed UHPLC-MS/MS method was demonstrated to be simple, rapid, accurate, and highly specific, making it fully suitable for the determination of ciprofol plasma concentrations and subsequent pharmacokinetic studies [40].
Application Note 2: LC-HRMS for Cannabinoids in Human Plasma
Objective: To develop and validate a sensitive LC-HRMS method for the simultaneous quantitative analysis of cannabinoids and their metabolites in human plasma [39].
Experimental Summary: The method utilized a simple liquid-liquid extraction of the cannabinoids from plasma. An isocratic chromatographic separation was followed by detection on an ESI-HRMS Q-Exactive Plus platform in positive ion mode. The high resolution of the mass spectrometer provided the selectivity needed for reliable quantification in a complex biological matrix [39].
Table 2: Key Validation Parameters for the Cannabinoids LC-HRMS Assay
| Validation Parameter | Result | Acceptance Criteria |
|---|---|---|
| Linear Range | 0.2 – 100.0 ng/mL | |
| Average Correlation Coefficient | > 0.995 | > 0.99 |
| Intra-day Precision (CV%) | 2.90% – 10.80% | Typically < 15% |
| Inter-day Precision (CV%) | 2.90% – 10.80% | Typically < 15% |
| Accuracy | -0.9 to 7.0 from nominal | Typically ±15% |
| LLOQ | 0.2 ng/mL | Excellent sensitivity |
| Extraction Recovery | 60.4% – 85.4% | Consistent |
| Analyte Stability | Stable for 6-12h in autosampler | Meets study needs |
Conclusion: The LC-HRMS method was sufficiently sensitive and applicable to cannabinoids pharmacokinetics studies, demonstrating the utility of high-resolution mass spectrometry for targeted bioanalysis [39].
Experimental Protocols
Protocol: A Standard Workflow for UHPLC-MS/MS Bioanalytical Method Validation
This protocol outlines the generic steps for developing and validating a UHPLC-MS/MS method for the quantification of a drug substance in a biological matrix, based on regulatory guidelines [40] [41].
Materials and Reagents
Table 3: Research Reagent Solutions and Essential Materials
| Item | Function / Application | Example from Literature |
|---|---|---|
| Analyte Standard | Primary reference for quantification | Ciprofol standard [40] |
| Stable Isotope-Labeled IS | Corrects for variability in sample prep and ionization | Ciprofol-d6 [40] |
| HPLC-Grade Methanol/ACN | Protein precipitation; mobile phase component | Methanol for precipitation [40] |
| HPLC-Grade Water | Mobile phase component | Milli-Q water [40] |
| Ammonium Acetate/Formate | Mobile phase additive for controlling pH/ionization | 5 mmol·L⁻¹ Ammonium Acetate [40] |
| Blank Biological Matrix | Validation; creates calibration standards and QCs | Blank human plasma [40] |
| UHPLC C18 Column | Stationary phase for reverse-phase separation | Shim-pack GIST-HP C18 [40] |
Step-by-Step Procedure
Sample Preparation (Protein Precipitation):
- Pipette 135 µL of blank plasma (for calibration standards and quality control samples) into a 1.5 mL microcentrifuge tube.
- Add 15 µL of the appropriate standard working solution or quality control working solution. For the blank sample, add 15 µL of a 50% methanol-water solution.
- Add 10 µL of the internal standard working solution (e.g., 5000 ng·mL⁻¹). For the blank, add 10 µL of 50% methanol-water.
- Add 300 µL of methanol to precipitate proteins.
- Vortex mix vigorously for 3 minutes.
- Centrifuge at 4°C, 14,000 rpm for 10 minutes.
- Transfer the supernatant for UHPLC-MS/MS analysis [40].
Chromatographic Separation (UHPLC Conditions):
- Column: Shimadzu Shim-pack GIST-HP C18 (3 µm, 2.1×150 mm) or equivalent.
- Mobile Phase: (A) 5 mmol·L⁻¹ ammonium acetate in water; (B) Methanol.
- Gradient Elution:
- 0 – 0.1 min: 25% B
- 0.1 – 0.5 min: 25% → 95% B
- 0.5 – 2.9 min: 95% B
- 2.9 – 2.95 min: 95% → 25% B
- 2.95 – 4.0 min: 25% B (re-equilibration)
- Flow Rate: 0.4 mL·min⁻¹
- Column Temperature: 40°C
- Injection Volume: 5 µL [40].
Mass Spectrometric Detection (MS/MS Conditions):
- Ion Source: Electrospray Ionization (ESI)
- Ion Mode: Negative (as for ciprofol) or Positive, as suitable for the analyte.
- Operation Mode: Multiple Reaction Monitoring (MRM)
- Ion Source Parameters:
- Turbo Ion Spray Temperature: 450°C
- Nebulizer Gas: 50 psi
- Drying Gas Flow: 10 L·min⁻¹
- Capillary Voltage: 4500 V
- MRM Transitions: (Analyte-specific, e.g., for Ciprofol: 203.100 → 175.000) [40].
Data Analysis and Quantification:
- Process the acquired data using the instrument software.
- Plot a calibration curve of the peak area ratio (analyte/internal standard) versus the nominal concentration of the calibration standards.
- Use a linear regression model with a weighting factor (e.g., 1/x or 1/x²) to fit the curve.
- Calculate the concentration of the quality control samples and unknown study samples using the regression equation from the calibration curve.
Protocol: Method Validation as per Regulatory Guidelines
Once the method is developed, its suitability for the intended purpose must be demonstrated through validation. The following key characteristics must be evaluated, typically following FDA or ICH guidelines [41] [42].
Step-by-Step Validation Procedure
Specificity and Selectivity: Demonstrate that the method can unequivocally quantify the analyte in the presence of other components, such as metabolites, impurities, or the matrix itself. Analyze at least six independent sources of blank matrix to show no significant interference at the retention times of the analyte and internal standard [41].
Linearity and Calibration Curve: Establish a linear relationship between the response (peak area ratio) and the concentration of the analyte over the intended range. Prepare and analyze at least six non-zero calibration standards. The correlation coefficient (r) should typically be greater than 0.99, and the calibration standards should be back-calculated to within ±15% of the nominal value (±20% at the LLOQ) [40] [41].
Precision and Accuracy:
- Precision (the closeness of agreement between a series of measurements) is assessed at a minimum of three quality control (QC) concentration levels (Low, Medium, High) covering the calibration range.
- Accuracy (the closeness of the measured value to the true value) is assessed simultaneously.
- Intra-day (Repeatability): Analyze at least six replicates of each QC level in a single batch.
- Inter-day (Intermediate Precision): Analyze at least six replicates of each QC level over multiple batches, on different days, or by different analysts.
- The precision (Relative Standard Deviation, RSD) and accuracy (Relative Error, RE) should generally be within ±15% for all QCs [40] [41].
Sensitivity - LLOQ and LOD:
- Lower Limit of Quantification (LLOQ): The lowest concentration that can be measured with acceptable precision and accuracy (typically RSD <20% and RE ±20%). The LLOQ signal should be at least 5 times the signal of a blank sample [41] [42].
- Limit of Detection (LOD): The lowest concentration that can be detected but not necessarily quantified. It can be determined based on a signal-to-noise ratio of 2:1 or 3:1 [42].
Recovery and Matrix Effect:
- Extraction Recovery: Determine by comparing the analytical response of extracted QC samples with the response of post-extracted blank plasma spiked with the analyte at the same concentration. Recovery should be consistent and precise [40].
- Matrix Effect: Investigate by comparing the analytical response of the analyte spiked into post-extracted blank plasma from at least six different sources with the response of the analyte in a pure solution. The matrix effect, expressed as the relative standard deviation (RSD) of the matrix factor, should be less than 15% [40] [43].
Robustness: Evaluate the reliability of the method when small, deliberate changes are made to operational parameters (e.g., mobile phase pH ±0.2 units, column temperature ±2°C, flow rate ±10%). The method should remain unaffected by these variations [41].
Integrating Automation and Robotics for High-Throughput and Reproducible Method Development
The integration of automation and robotics represents a transformative advancement in analytical method development for pharmaceutical research and development. This application note provides a detailed examination of protocols and frameworks for implementing automated workflows to enhance throughput, reproducibility, and compliance in drug substance assay research. Within the context of analytical method validation per ICH Q2(R2) guidelines, we demonstrate how automated platforms address critical validation parameters including precision, accuracy, and robustness. Supported by quantitative performance data and detailed methodology, this document serves as a practical resource for researchers and drug development professionals seeking to standardize and accelerate method development workflows while maintaining regulatory compliance.
The validation of analytical procedures is a regulatory requirement for pharmaceutical marketing authorization applications, with ICH Q2(R2) providing the foundational framework for assessing method performance characteristics [7]. These methods are employed throughout the drug lifecycle for release testing, stability studies, and impurity profiling of commercial drug substances and products [44]. Traditional manual approaches to method development and validation are often time-consuming, variable, and ill-suited for the multi-parameter optimization required in modern analytical science.
Automation and robotics address these limitations by introducing standardized, reproducible handling of liquids, samples, and data [45]. In high-throughput screening (HTS) for drug discovery, automation has demonstrated the capacity to process massive compound libraries with improved accuracy and consistency, reducing human error and operational costs [45]. These same principles are now being applied to analytical method development with the goal of generating robust, validated methods faster and with greater reliability. The integration of automated platforms ensures that methods are inherently more reproducible across different analysts, instruments, and laboratories—a core requirement for successful technology transfer and regulatory submission [44].
Key Validation Parameters Enhanced by Automation
The following table summarizes how automation specifically addresses the core validation parameters defined in ICH Q2(R2) [7]:
Table 1: Automation's Impact on Key Method Validation Parameters
| Validation Parameter | Impact of Automation |
|---|---|
| Precision | Robotic systems eliminate manual pipetting variability, achieving median CVs of 5.3% in intra-day assays [46]. |
| Accuracy | Automated liquid handling ensures correct concentrations and volumes, directly improving recovery measurements [45]. |
| Specificity | Automated sample preparation (e.g., delipidation, digestion) reduces matrix interference, enhancing analyte detection [46]. |
| Robustness | Automated workflows minimize the impact of operator technique and environmental fluctuations during method development. |
| Linearity & Range | Robotic systems can prepare exact, serial dilutions across orders of magnitude with high consistency [45]. |
Automated Protocol for Sample Preparation and Analysis
This detailed protocol for the automated processing of plasma samples for targeted protein quantification via Selected Reaction Monitoring Mass Spectrometry (SRM-MS) demonstrates the practical integration of robotics for enhanced reproducibility [46]. The workflow was implemented on a Biomek NXp Workstation.
Reagent and Material Solutions
Table 2: Essential Research Reagent Solutions for Automated Sample Preparation
| Item | Function in Protocol |
|---|---|
| Biomek NXp Workstation | Robotic platform for executing all liquid handling, incubation, and plate management steps [46]. |
| RapiGest (0.1% w/v) | Surfactant for sample denaturation in 100 mM Tris-HCl buffer, facilitating protein unfolding [46]. |
| Dithiothreitol (DTT, 100 mM) | Reducing agent to break disulfide bonds in proteins during the 55°C incubation step [46]. |
| Iodoacetamide (100 mM) | Alkylating agent for cysteine side chain modification post-reduction, performed in the dark [46]. |
| Trypsin/LysC Mix | Proteolytic enzyme for protein digestion at 37°C for 18 hours (enzyme-to-substrate ratio of 1:50) [46]. |
| Heavy Isotope-Labeled Peptides (SISs) | Internal standards added post-digestion to correct for variability in LC-SRM-MS analysis [46]. |
| 96-well SPE Plate | Solid-phase extraction for post-digestion sample cleanup and desalting prior to analysis [46]. |
Detailed Workflow Steps
- Initial Sample Preparation: Manually thaw plasma samples and centrifuge at 14,000 × g for 15 minutes at 4°C. Transfer the cleared fraction to a new tube, discarding insoluble aggregates and lipids [46].
- Robotic Setup: Manually load the deck of the Biomek NXp station with reagent reservoirs, tip boxes, and a 96-well deep reaction plate. Manually transfer 5 µL of each delipidated plasma sample into assigned wells of the reaction plate using a reverse pipetting technique for accuracy [46].
- Automated Denaturation and Reduction: The robot adds 95 µL of RapiGest/DTT solution to each sample. The method then incubates the reaction plate at 55°C for 1 hour [46].
- Automated Alkylation: The robot adds iodoacetamide to a final concentration of 50 mM. The reaction proceeds for 30 minutes at room temperature in the dark [46].
- Automated Digestion: The robot adds 60 µL of 50 mM ammonium bicarbonate and the Trypsin/LysC mix. Digestion proceeds for 18 hours at 37°C [46].
- Reaction Termination: The robot adds trifluoroacetic acid to a final concentration of 1% to stop the digestion [46].
- Sample Cleanup: Manually load the acidified digests onto a 96-well SPE plate for desalting. After elution, evaporate solvents and reconstitute the residues in 100 µL of 0.1% formic acid containing the heavy isotope-labeled peptide standards (SISs) [46].
- Analysis: Proceed with LC-SRM-MS analysis using the optimized method.
The following workflow diagram visualizes this integrated process, highlighting the handoff between manual and automated tasks:
Performance Data and Validation Metrics
The implementation of the automated protocol yielded significant improvements in reproducibility. The data below compare the variability introduced by the automated sample preparation (Technical Component I) versus the LC-SRM-MS analysis itself (Technical Component II) [46].
Table 3: Quantitative Reproducibility of Automated Sample Processing for SRM-MS (n=15) [46]
| Peptide Analyte | Overall CV (%) | CV from Sample Prep (Component I) | CV from SRM Assay (Component II) |
|---|---|---|---|
| Peptide 1 | 5.1 | 0.8 | 4.3 |
| Peptide 2 | 17.5 | 2.6 | 14.9 |
| Peptide 3 | 4.2 | 0.6 | 3.6 |
| Peptide 4 | 5.9 | 0.9 | 5.0 |
| Peptide 5 | 2.7 | 0.4 | 2.3 |
| Median CV | 5.3 | 0.8 | 4.5 |
The data demonstrate that the automated sample preparation contributed only 15.1% of the overall analytical variation, confirming that robotics effectively minimizes variability introduced during the complex sample processing stages [46]. The use of heavy isotope-labeled internal standards was critical for correcting the remaining variability inherent to the mass spectrometric measurement.
Application in Drug Substance and Biomarker Assay Validation
The principles demonstrated in the SRM-MS protocol are directly applicable to the broader context of validating analytical methods for drug substance assays. Automated platforms ensure that methods for assessing identity, potency, purity, and impurity profiling are developed and executed with minimal human-induced variability [44]. This is crucial for methods included in Common Technical Document (CTD) submissions for regulatory approval [44].
Furthermore, the distinction between analytical method validation and clinical qualification is critical in biomarker development [47]. Method validation assesses the assay's performance characteristics, while qualification is the evidentiary process of linking a biomarker with clinical endpoints. The automated, reproducible methods described here form the foundation for developing "known valid" biomarkers—those with widespread acceptance in the scientific community for predicting clinical outcomes, such as HER2/neu overexpression for selecting breast cancer therapy [47].
The integration of automation and robotics into analytical method development is no longer a luxury but a necessity for modern, high-quality pharmaceutical research. By adopting the protocols and frameworks outlined in this document, research scientists can achieve a new standard of reproducibility and throughput in method development. This approach directly supports the rigorous demands of ICH Q2(R2) validation, accelerates the drug development timeline, and provides regulators with highly consistent and reliable data. As technology advances, the synergy between automated execution, artificial intelligence for experimental design, and robust data analysis will further solidify automation as the cornerstone of reproducible analytical science.
Application of AI and Machine Learning for Predictive Modeling and Parameter Optimization
The validation of analytical methods for drug substance assay is a critical pillar in pharmaceutical development, ensuring the identity, purity, potency, and stability of active pharmaceutical ingredients (APIs). Traditional method development is often a time-consuming and resource-intensive empirical process, reliant on extensive laboratory experimentation for parameter optimization [48]. The integration of Artificial Intelligence (AI) and Machine Learning (ML) represents a paradigm shift, introducing a predictive, data-driven approach that enhances efficiency, reduces costs, and improves the robustness of analytical methods [49] [50]. This document details specific applications and protocols for leveraging AI and ML to accelerate and refine predictive modeling and parameter optimization within the context of analytical method development and validation for drug substance assays.
Foundational AI and ML Concepts for the Analytical Scientist
Machine learning, a subset of AI, involves using algorithms to parse data, learn from it, and make determinations or predictions on new datasets [49] [50]. For analytical sciences, two primary learning techniques are most relevant:
- Supervised Learning: Used to develop training models to predict future values based on known input and output data. It is ideal for classification tasks (e.g., predicting whether a chromatographic method will meet specificity criteria) and regression tasks (e.g., predicting retention time or peak area based on mobile phase composition) [49] [51].
- Unsupervised Learning: Used to identify hidden patterns or intrinsic structures in input data without pre-defined labels. This is valuable for clustering similar chromatographic profiles or excipients, and for dimensionality reduction to simplify complex, multi-parameter optimization spaces [49] [51].
A key challenge in ML is model overfitting, where a model learns the noise and specific peculiarities of the training data instead of the underlying relationship, negatively impacting its performance on new data. Techniques to limit overfitting include resampling methods, using a validation dataset, and regularization [49].
Application Notes: AI/ML in Analytical Method Development
Predictive Modeling for Excipient Compatibility and Selection
The selection of compatible and stabilizing excipients is crucial for the development of robust biopharmaceutical formulations. ExPreSo (Excipient Prediction Software) is a supervised ML algorithm that demonstrates this application effectively.
- Objective: To pre-select optimal excipients for protein-based drug substances based on the properties of the protein and the target product profile, thereby reducing the need for extensive wet-lab screening [52].
- Model Training: The model was trained on a dataset of 335 regulatory-approved peptide and protein drug products. Input features included protein structural properties, embeddings from protein language models, and drug product characteristics [52].
- Outcome: The algorithm showed strong performance in predicting the nine most prevalent excipients in biopharmaceutical formulations with minimal overfitting. Notably, a variant using only sequence-based input features demonstrated similar predictive power, offering a faster alternative for early-stage development [52].
In-Silico Optimization of Chromatographic Parameters
Optimizing High-Performance Liquid Chromatography (HPLC) methods involves adjusting multiple interdependent parameters (e.g., mobile phase pH, gradient slope, column temperature) to achieve critical resolution and peak symmetry. ML transforms this from a one-variable-at-a-time approach to a multivariate predictive process.
- Workflow:
- Data Generation: A Design of Experiments (DoE) approach is used to systematically generate a dataset of chromatographic results from a limited set of laboratory experiments.
- Model Training: A supervised ML algorithm (e.g., Random Forest or Support Vector Regression) is trained on this dataset to learn the complex relationships between the input parameters and the chromatographic outcomes (e.g., resolution, run time).
- Virtual Screening: The trained model is used to simulate and predict the performance of thousands of parameter combinations in silico, identifying the optimal design space that meets all predefined analytical method objectives [49] [50].
Table 1: Key Parameters for ML-Driven Chromatographic Optimization
| Category | Parameter | ML Model Output |
|---|---|---|
| Mobile Phase | pH, Organic Solvent Ratio, Buffer Concentration | Prediction of retention behavior and peak shape |
| Column | Temperature, Chemistry (modeled as a feature) | Prediction of selectivity and efficiency |
| Gradient | Slope, Time, Initial/Final Conditions | Prediction of resolution and analysis time |
| Critical Quality Attributes | Resolution, Tailing Factor, Plate Count | Target values for optimization |
Enhancing Method Validation through Predictive ADMET and Toxicity Modeling
While method validation formally assesses characteristics like accuracy, precision, and specificity [7] [48], AI/ML can predict potential interference from drug metabolites or degradants early in the process. Federated Computing (FC) is an emerging approach that enables researchers to train toxicity and ADMET (Absorption, Distribution, Metabolism, Excretion, and Toxicity) models on distributed, proprietary datasets without the data leaving its secure environment [53]. This allows for the development of more robust and generalizable models that can predict drug-related impurities, thereby informing the specificity requirements of an analytical method during its development phase [53] [51].
Experimental Protocols
Protocol 1: ML-Guided Analytical Method Development with DoE
This protocol outlines a systematic procedure for developing a stability-indicating HPLC method for a new drug substance using ML.
I. Define Analytical Method Objectives
- Identify the Critical Quality Attributes (CQAs) of the method (e.g., resolution from known impurities, run time, tailing factor).
- Set the acceptance criteria for each CQA based on regulatory guidance (ICH Q2(R2)) [7] [48].
II. Literature Review and Initial Scouting
- Conduct a literature review to identify existing methods for structurally related compounds [48].
- Perform initial scouting runs with different column chemistries (C18, phenyl, HILIC) and mobile phases to bound the experimental space.
III. Experimental Design and Data Generation
- Employ a DoE (e.g., Central Composite Design) to define a set of experimental runs that efficiently varies multiple parameters (e.g., pH: 2.5-4.5; Gradient Slope: 1-5% B/min; Temperature: 25-45°C).
- Execute the defined experiments and record the resulting chromatographic data (retention times, peak areas, resolution, etc.) for each run.
IV. Model Building and Training
- Feature Engineering: Encode categorical variables (e.g., column type) and normalize continuous variables.
- Algorithm Selection: Choose a suitable ML algorithm. For this regression task, Random Forest or Gradient Boosting algorithms are often effective.
- Training: Split the data into training and validation sets (e.g., 80/20). Train the model on the training set to map input parameters to chromatographic outcomes.
V. Virtual Optimization and Prediction
- Use the trained model to predict the outcomes for a vast number of virtual parameter combinations within the defined space.
- Identify the parameter set that is predicted to yield the best performance against the predefined CQAs.
VI. Laboratory Confirmation and Validation
- Execute the top 1-3 predicted method conditions in the laboratory to confirm the model's accuracy.
- Once confirmed, proceed with a full method validation as per ICH Q2(R2) guidelines to establish accuracy, precision, specificity, linearity, range, and robustness [7] [48].
Diagram 1: ML-guided method development workflow.
Protocol 2: Developing a Predictive Excipient Compatibility Model
This protocol is adapted from the principles demonstrated by the ExPreSo software [52] and can be implemented for internal development.
I. Curate a Comprehensive Training Dataset
- Compile a list of approved drug products, including their protein sequences (or key molecular descriptors for small molecules) and the excipients used in their formulations. Public databases and internal data can be sources.
- Label each drug product with its formulation attributes.
II. Preprocess and Featurize the Data
- For Proteins: Calculate structural properties (molecular weight, isoelectric point) and use protein language models to generate numerical embeddings [52].
- For Small Molecules: Calculate molecular descriptors (logP, polar surface area, number of hydrogen bond donors/acceptors) or use molecular fingerprints.
- Encode excipients as categorical features.
III. Train a Classification Model
- Use a supervised learning algorithm, such as a Support Vector Machine (SVM) or Deep Neural Network (DNN), to train a model that predicts the likelihood of an excipient being compatible and functional for a new drug substance based on its features.
- Employ techniques like k-fold cross-validation to ensure model generalizability.
IV. Deploy Model for Pre-screening
- Integrate the trained model into an software tool.
- For a new drug substance, input its features to receive a ranked list of suggested excipients for subsequent experimental verification.
The Scientist's Toolkit: Essential Research Reagent Solutions
Table 2: Key Tools and Reagents for AI/ML-Enhanced Analytical Development
| Item / Solution | Function in AI/ML Workflow |
|---|---|
| High-Quality Historical Data | The foundational reagent for training accurate ML models. Requires structured data on compounds, methods, and outcomes. |
| Programmatic ML Frameworks (e.g., Scikit-learn, TensorFlow, PyTorch) | Open-source libraries that provide the algorithms and tools for building, training, and deploying custom ML models [49]. |
| Federated Computing Platforms | Enables training models on distributed, proprietary datasets (e.g., from partners or CROs) without moving or exposing the underlying data, addressing privacy and IP concerns [53]. |
| Commercial Excipient Prediction Software (e.g., ExPreSo) | Specialized supervised ML algorithms that suggest excipients based on drug substance properties, reducing experimental screening [52]. |
| Validated Cheminformatics Tools (e.g., RDKit) | Software for calculating molecular descriptors and generating fingerprints, which are essential for featurizing small molecule drug substances for ML models. |
The integration of AI and ML into the fabric of analytical method development marks a significant advancement for pharmaceutical sciences. By moving from a purely empirical paradigm to a predict-then-make approach [50], scientists can drastically reduce the time and material resources required for method development and parameter optimization. The protocols and applications detailed herein—from chromatographic optimization to predictive excipient selection—provide a roadmap for leveraging these powerful technologies. As the industry continues to grapple with the challenges of rising development costs and complex new modalities [49] [50], the adoption of AI and ML for tasks like analytical method validation is no longer a futuristic concept but a present-day imperative for building a more efficient, predictive, and robust drug development pipeline.
Analytical method development and validation are critical pillars in pharmaceutical research, ensuring the reliability, accuracy, and reproducibility of data used to assess drug substance quality. For complex small molecule drug substances, selecting an appropriate technique and optimizing it to separate the analyte from potentially interfering matrix components is paramount. This application note details the development and validation of a High-Performance Liquid Chromatography (HPLC) method coupled with solid-phase extraction (SPE) for the determination of pantoprazole in human plasma, framing the process within the rigorous context of ICH guidelines for bioanalytical method validation [2]. Pantoprazole, a proton pump inhibitor, serves as an exemplary model for a complex small molecule, and the methodology described herein enabled its precise quantification for a pharmacokinetic and bioequivalence study [54]. The protocol emphasizes a modern, robust sample preparation technique that overcomes the limitations of traditional methods, providing a template for researchers and scientists developing assays for similar drug substances.
Experimental Protocol
Materials and Reagents
- Drug Substance and Internal Standard (IS): Pantoprazole working standard and lansoprazole (IS) were supplied by Krka, d.d., Slovenia [54].
- Solvents: HPLC grade methanol and acetonitrile (Across Organics, Belgium) [54].
- Chemicals: Triethylamine, o-phosphoric acid, sodium hydroxide, potassium dihydrogen phosphate (Merck, Germany) [54].
- Solid-Phase Extraction: LiChrolut RP-18 cartridges (40-63 μm, 200 mg, 3 mL) from Merck, Germany [54].
- Instrumentation: HPLC system with autosampler (Perkin Elmer LC ISS Series 200) and ultraviolet diode array detector (Perkin Elmer LC 235 C) [54].
Chromatographic Conditions
- Column: LiChroCart LiChrospher 60 RP select B (4.0 mm x 250 mm, 5 µm) [54].
- Mobile Phase: 0.2 % (V/V) triethylamine in water (pH adjusted to 7.0 with o-phosphoric acid) and acetonitrile (58:42, V/V) [54].
- Flow Rate: 1.2 mL/min [54].
- Detection: UV at 280 nm [54].
- Injection Volume: 50 µL [54].
- Run Time: 7 minutes [54].
Sample Preparation via Solid-Phase Extraction
- Conditioning: Condition the LiChrolut RP-18 SPE cartridge sequentially with 2 mL of methanol and 2 mL of water [54].
- Loading: Mix 1 mL of spiked human plasma with 0.05 mL of internal standard working solution and 1 mL of 0.1 mol/L KH₂PO₄ buffer (pH 9). Load the buffered sample onto the conditioned cartridge under a gentle vacuum (5 psi) [54].
- Washing: Rinse the cartridge with 2 mL of water to remove endogenous plasma interferents [54].
- Elution: Elute the analyte and internal standard with 0.7 mL of acetonitrile into a clean tube [54].
- Reconstitution: Evaporate the eluate to dryness under a stream of nitrogen at 40°C for approximately 20 minutes. Reconstitute the residue with 200 µL of 0.001 mol/L NaOH [54].
- Analysis: Inject a 50 µL aliquot of the reconstituted sample into the HPLC system [54].
Method Validation Procedure
The method was validated according to international guidelines for bioanalytical method validation [54] [2]. Key validation experiments and their protocols are summarized below.
Selectivity
Protocol: Compare chromatograms of blank plasma from at least six different sources with those of plasma spiked with the analyte and IS. The method is selective if there is no significant interference at the retention times of the analyte and IS from endogenous plasma components [54].
Linearity and Calibration Curve
Protocol: Prepare a minimum of six non-zero calibration standards in plasma across the nominal concentration range (25.0 - 4000.0 ng/mL for pantoprazole). Process each standard according to the sample preparation protocol and analyze. Plot the peak height ratio (analyte/IS) against the nominal concentration. Use a weighted (e.g., 1/concentration) least-squares regression to determine the correlation coefficient, slope, and intercept [54].
Accuracy and Precision
Protocol: Assess accuracy and precision using quality control (QC) samples at a minimum of three concentration levels (low, medium, high) in replicates (n=5 or 6).
- Intra-day (Repeatability): Analyze all replicates of each QC level in a single analytical run.
- Inter-day (Intermediate Precision): Analyze replicates of each QC level over at least three different analytical runs on different days. Calculate accuracy as relative error (% RE) and precision as relative standard deviation (% RSD) [54].
Recovery
Protocol: Compare the analytical response (peak height or area) of the analyte from spiked plasma samples that have undergone the complete SPE and analysis procedure with the response of standard solutions at equivalent concentrations. This evaluates the efficiency of the extraction process [54].
Stability
Protocol: Evaluate analyte stability in plasma under various conditions, including:
- Short-term temperature stability: e.g., 2, 12, and 24 hours at room temperature.
- Freeze-thaw cycle stability: e.g., through three cycles.
- Long-term stability: e.g., stored at -20°C for 1 month. Analyze stability samples against freshly prepared calibration standards and calculate the percentage deviation [54].
Results and Validation Data
The developed HPLC-UV method for pantoprazole was successfully validated. The key quantitative results from the validation study are consolidated in the tables below for easy comparison and interpretation.
Table 1: Analytical Performance Characteristics of the HPLC Method for Pantoprazole
| Parameter | Result | Acceptance Criterion |
|---|---|---|
| Linear Range | 25.0 - 4000.0 ng/mL | - |
| Correlation Coefficient (r) | > 0.996 | Typically > 0.99 |
| Limit of Quantification (LOQ) | 25.0 ng/mL | Signal-to-noise ratio ≥ 10:1 |
| Retention Time (Pantoprazole) | 4.1 min | - |
| Retention Time (Internal Standard) | 6.0 min | - |
Table 2: Accuracy and Precision Data for Pantoprazole QC Samples
| QC Concentration Level | Intra-day Precision (RSD, %) | Inter-day Precision (RSD, %) | Accuracy (Relative Error, %) |
|---|---|---|---|
| Low | 9.3 | < 9.3 | -10.5 to 0.12 |
| Medium | 4.2 | < 9.3 | -10.5 to 0.12 |
| High | 5.1 | < 9.3 | -10.5 to 0.12 |
The method demonstrated excellent selectivity, with no interference from endogenous plasma components at the retention times of pantoprazole and the internal standard, lansoprazole [54]. The calibration curve showed good linearity over the specified range, and the LOQ of 25.0 ng/mL was sufficiently sensitive for pharmacokinetic studies. The accuracy and precision data, both within a single day and across different days, fell within acceptable limits for bioanalytical methods [2].
Application in a Pharmacokinetic Study
The validated method was applied to a pharmacokinetic and bioequivalence study of 40 mg pantoprazole in healthy volunteers [54]. The robust and precise nature of the assay allowed for reliable monitoring of plasma drug concentrations over time, generating critical data for calculating key pharmacokinetic parameters such as AUC (area under the curve), C~max~ (maximum concentration), and T~max~ (time to reach C~max~). This successful application underscores the method's fitness-for-purpose in a clinical research setting.
Workflow and Signaling Pathways
The following workflow diagram illustrates the complete analytical procedure, from sample collection to data analysis.
The Scientist's Toolkit: Research Reagent Solutions
Table 3: Essential Materials and Reagents for HPLC Method Development and SPE
| Item | Function / Role |
|---|---|
| LiChrolut RP-18 SPE Cartridge | Provides a reversed-phase sorbent for selective extraction and concentration of the analyte from the complex plasma matrix, removing interfering substances [54]. |
| HPLC-grade Acetonitrile | Serves as a key component of the mobile phase and as the elution solvent in SPE, affecting selectivity, efficiency, and the strength of elution [54]. |
| Triethylamine (TEA) | Used as a mobile phase modifier to act as a silanol blocker, improving peak shape and reducing tailing for basic analytes like pantoprazole [54]. |
| Potassium Dihydrogen Phosphate (KH₂PO₄) | Used to prepare buffering solutions for adjusting sample pH prior to SPE (to ensure analyte is in the correct form for retention) and for preparing the aqueous mobile phase component [54]. |
| Internal Standard (Lansoprazole) | A structurally similar compound used to correct for variability in sample preparation, injection volume, and instrument performance, thereby improving analytical accuracy and precision [54]. |
Troubleshooting and Optimizing Analytical Methods: Overcoming Data, Complexity, and Compliance Hurdles
Common Pitfalls in Method Validation and Strategies for Resolution
Analytical method validation is the documented process of proving that a laboratory procedure consistently produces reliable, accurate, and reproducible results for drug substance analysis. It serves as a critical gatekeeper of pharmaceutical quality, ensuring compliance with regulatory frameworks like FDA Analytical Procedures, ICH Q2(R2), and USP <1225> while safeguarding product integrity and patient safety [55]. For drug substance assays, validation provides assurance that methods accurately measure identity, potency, and purity throughout the drug lifecycle—from development through commercial manufacturing [44].
The validation landscape continues to evolve with emerging regulatory expectations. The recent ICH Q2(R2) guideline emphasizes a lifecycle approach to validation, integrating development with data-driven robustness while focusing on practical applicability within the method's intended use environment [7] [56]. This shift requires researchers to move beyond theoretical performance metrics toward context-driven validation strategies that ensure methods meet quality requirements not just in principle, but in practice [56].
Common Pitfalls and Resolution Strategies
Despite established guidelines, laboratories frequently encounter preventable challenges during method validation that can compromise data integrity, regulatory submissions, and ultimately patient safety. The following sections detail these pitfalls with evidence-based resolution strategies.
Inadequate Method Development and Planning
The Pitfall: Rushing to validation without robust feasibility studies represents a fundamental error. This often manifests as undefined objectives, insufficient parameter understanding, and inadequate risk assessment, leading to incomplete validation outcomes and regulatory rejection [55] [57]. For drug substance assays, this is particularly critical when methods lack stability-indicating properties or fail to account for complex sample matrices [55].
Resolution Strategies:
- Implement Quality by Design (QbD) principles during development to establish Method Operational Design Ranges (MODRs) that ensure robustness across anticipated operational conditions [17]
- Conduct comprehensive risk assessment early in development to prioritize variables affecting method performance, focusing on critical quality attributes (CQAs) of the drug substance [55]
- Perform rigorous feasibility studies that mirror actual sample analysis conditions, including forced degradation studies to verify stability-indicating capabilities [57]
- Establish a clear Analytical Target Profile (ATP) that defines method requirements based on product and process needs rather than abstract analytical performance [56]
Insufficient Validation Parameter Assessment
The Pitfall: Incomplete evaluation of validation parameters, particularly specificity, robustness, and detection limits, undermines method reliability. This includes inadequate sample sizes increasing statistical uncertainty, improper application of statistical methods, and failure to demonstrate specificity against closely related impurities [55] [11].
Resolution Strategies:
- Employ orthogonal detection methods such as photodiode-array (PDA) or mass spectrometry (MS) to demonstrate specificity and peak purity, especially for drug substances with complex impurity profiles [11]
- Utilize statistically sound experimental designs with sufficient sample sizes—minimum nine determinations across three concentration levels for accuracy assessment [11]
- Implement risk-based parameter evaluation focused on the method's intended purpose, with enhanced rigor for potency assays and critical quality attributes [17]
- Apply modern detection techniques for limit tests, using signal-to-noise ratios (3:1 for LOD, 10:1 for LOQ) or statistical approaches (LOD/LOQ = K(SD/S)) based on standard deviation of response and calibration curve slope [11]
Instrumentation and Technical Oversights
The Pitfall: Method validation failures often stem from technical issues including uncalibrated instruments, uncontrolled critical parameters, and inadequate system suitability tests [55]. Different instrumental techniques present unique validation risks that require specific control strategies.
Resolution Strategies:
- Establish instrument-specific control parameters based on technique: flow rate/solvent composition for HPLC, temperature stability for GC, baseline characteristics for UV-Vis, and matrix effect evaluation for LC-MS/MS [55]
- Implement regular calibration programs with preventive maintenance schedules to ensure instrument performance throughout validation and routine use [55]
- Develop robustness testing protocols that evaluate method resilience to small, deliberate variations in instrument parameters [11]
- Create comprehensive system suitability tests that mimic actual analysis conditions to monitor ongoing method performance [11]
Documentation and Knowledge Management Gaps
The Pitfall: Incomplete documentation creates audit risks and method transfer challenges. This includes missing protocol deviations, inadequate rationale for acceptance criteria, and poor change control documentation [55] [57]. Additionally, failing to build cross-functional alignment with QA and regulatory stakeholders early in validation leads to delays and rework [57].
Resolution Strategies:
- Implement digital validation systems with electronic batch records and automated audit trails to replace error-prone paper-based methods, ensuring ALCOA+ principles (Attributable, Legible, Contemporaneous, Original, Accurate, plus Complete, Consistent, Enduring, Available) [17] [58]
- Establish cross-functional review teams including Quality Assurance, Regulatory Affairs, and R&D from method development initiation to ensure alignment on validation strategies and acceptance criteria [57]
- Create standardized validation templates with predefined acceptance criteria linked to regulatory guidance, ensuring consistent documentation across different methods and analysts [55] [58]
- Maintain comprehensive knowledge management systems that capture method development history, including failed experiments and rationale for parameter selection, to support lifecycle management [17]
Table 1: Analytical Method Validation Parameters and Acceptance Criteria for Drug Substance Assay
| Validation Parameter | Experimental Requirements | Typical Acceptance Criteria | Regulatory Reference |
|---|---|---|---|
| Accuracy | Minimum 9 determinations across 3 concentration levels | Recovery 98-102% for drug substance | ICH Q2(R2) [7] |
| Precision (Repeatability) | Minimum 6 determinations at 100% test concentration | RSD ≤ 1% for drug substance assay | ICH Q2(R2) [7] |
| Specificity | Resolution of analyte from closest eluting impurity | Resolution ≥ 2.0 between critical pairs; Peak purity pass | USP <1225> [55] |
| Linearity | Minimum 5 concentration levels spanning specified range | Correlation coefficient (r²) ≥ 0.998 | ICH Q2(R2) [7] |
| Range | Established from linearity studies | Typically 80-120% of test concentration for assay | ICH Q2(R2) [7] |
| Robustness | Deliberate variation of method parameters | System suitability criteria met throughout variations | USP <1225> [55] |
| LOD/LOQ | Based on signal-to-noise or statistical calculation | S/N ≥ 3 for LOD; S/N ≥ 10 for LOQ | ICH Q2(R2) [7] |
Lifecycle Management Deficiencies
The Pitfall: Treating validation as a "one-and-done" activity rather than an ongoing process represents a critical vulnerability [59]. Methods degrade over time due to changes in raw materials, equipment drift, or personnel turnover, leading to out-of-specification results without proactive monitoring.
Resolution Strategies:
- Implement continuous process verification using statistical process control (SPC) to monitor method performance trends and initiate revalidation before failures occur [59] [58]
- Establish risk-based requalification schedules triggered by specific events: changes in reference standards, instrument replacement, or supplier changes rather than fixed time intervals [59]
- Develop method transfer protocols with predefined acceptance criteria for technology transfer between laboratories or sites [44]
- Create knowledge retention systems to preserve method history and rationale despite personnel changes, ensuring consistent execution over the method lifecycle [17]
Experimental Protocols for Robust Method Validation
Protocol for Specificity and Peak Purity Assessment
Purpose: To demonstrate the method's ability to measure the drug substance accurately in the presence of potential impurities, degradants, and matrix components.
Materials: Drug substance reference standard, known impurities, placebo/excipients, forced degradation samples (acid, base, oxidative, thermal, photolytic stress)
Procedure:
- Prepare individual solutions of drug substance and each known impurity at appropriate concentrations
- Prepare mixture of drug substance with all known impurities to demonstrate separation
- Perform forced degradation studies:
- Acid/Base Stress: Treat with 0.1N HCl/NaOH at room temperature for 1-8 hours
- Oxidative Stress: Treat with 0.1-3% H₂O₂ at room temperature for 1-24 hours
- Thermal Stress: Expose solid drug substance to 60°C for 1-14 days
- Photolytic Stress: Expose to 1.2 million lux hours of visible and UV light per ICH Q1B
- Inject all samples and evaluate using PDA or MS detection for peak purity
- Document resolution between closest eluting peaks and peak purity indices
Acceptance Criteria: Resolution ≥ 2.0 between drug substance and all impurities; Peak purity index ≥ 990 for drug substance peak in all stressed samples; No co-elution observed [11]
Protocol for Accuracy and Precision Evaluation
Purpose: To establish the method's correctness (accuracy) and measurement consistency (precision) across the specified range.
Materials: Drug substance reference standard, placebo (if applicable), appropriate solvents and reagents
Procedure:
- Prepare a minimum of nine samples across three concentration levels (typically 80%, 100%, 120% of target concentration) with three replicates at each level
- For drug products, prepare samples by spiking placebo with known amounts of drug substance
- Analyze all samples per the method procedure against qualified reference standards
- Calculate percent recovery for accuracy: (Measured Concentration/Theoretical Concentration) × 100
- For repeatability (intra-assay precision), calculate relative standard deviation (RSD) of the nine determinations
- For intermediate precision, have a second analyst repeat the study on a different day with different equipment and calculate overall RSD and difference between means
Acceptance Criteria: Mean recovery 98-102%; RSD ≤ 1.0% for repeatability; Difference between analysts ≤ 2.0% for intermediate precision [11]
Table 2: Experimental Design for Accuracy and Precision Assessment
| Concentration Level | Number of Preparations | Analysis Replicates | Total Determinations |
|---|---|---|---|
| 80% of target | 3 | 1 each | 3 |
| 100% of target | 3 | 1 each | 3 |
| 120% of target | 3 | 1 each | 3 |
| Total | 9 | - | 9 |
Visualization of Method Validation Workflow
Figure 1: Analytical Method Validation Lifecycle Workflow. This diagram illustrates the sequential stages of robust method validation, from initial planning through lifecycle management, emphasizing the continuous nature of modern validation approaches.
The Scientist's Toolkit: Essential Research Reagents and Materials
Table 3: Essential Research Reagents and Materials for Method Validation
| Reagent/Material | Function in Validation | Critical Quality Attributes | Application Examples |
|---|---|---|---|
| Drug Substance Reference Standard | Primary standard for accuracy, linearity, and specificity assessment | Certified purity, well-characterized structure, appropriate documentation | Quantification of drug substance; calibration curve establishment |
| Known Impurities | Specificity demonstration and impurity quantification | Certified identity and purity, stability data | Resolution testing; impurity recovery studies |
| Mass Spectrometry Grade Solvents | Mobile phase preparation for LC-MS methods | Low UV absorbance, minimal particulate matter, volatile impurities | LC-MS/MS method development and validation |
| Chromatography Columns | Separation performance evaluation | Column efficiency (plate count), retention reproducibility, lot consistency | Specificity, robustness, and system suitability testing |
| PDA or MS Detectors | Peak purity and specificity assessment | Spectral resolution, wavelength accuracy, mass accuracy | Forced degradation studies; impurity identification |
| Calibrated Micro-leaks | Limit of detection studies for CCIT methods | Traceable certification, appropriate size range | Container closure integrity testing validation [57] |
| System Suitability Standards | Daily method performance verification | Stability, appropriate retention characteristics | Ongoing method performance monitoring |
Successful method validation for drug substance assays requires moving beyond simple regulatory compliance to embrace a holistic, science-based approach. By recognizing common pitfalls in planning, parameter assessment, technical execution, documentation, and lifecycle management, researchers can implement proactive strategies that ensure method robustness throughout its operational lifetime. The experimental protocols and workflows presented provide actionable frameworks for developing validation strategies that not only meet current regulatory expectations but also withstand the evolving landscape of analytical science. As method validation continues to advance with emerging technologies like artificial intelligence, real-time release testing, and digital twins, the fundamental principle remains unchanged: validated methods must demonstrate fitness for purpose throughout their lifecycle, ensuring the quality, safety, and efficacy of pharmaceutical products for patients worldwide [17].
In the field of drug substance assay research, the validation of analytical methods is paramount for ensuring the quality, safety, and efficacy of pharmaceutical products. However, the modern laboratory is characterized by an explosion of data volume and complexity, leading to significant challenges in data management. High-throughput screening, complex assay workflows, and multi-parametric readouts generate massive datasets that can overwhelm traditional data management approaches, potentially compromising data integrity and delaying critical decision-making [60] [61]. This data overload necessitates robust informatics strategies to transform raw data into validated, actionable insights.
The transition to AI-driven drug discovery has further intensified the need for sophisticated data management tools. Companies leveraging AI-powered approaches are now identifying viable drug candidates in approximately 18 months, a significant reduction from the traditional 4-5 years [61]. This acceleration is only possible with platforms that can structure, integrate, and analyze data at unprecedented scales, transforming data from a passive record into a primary asset for discovery acceleration. This Application Note outlines practical tools and detailed protocols designed to help researchers manage data overload, with a specific focus on applications within analytical method validation for drug substance assays.
The Modern Data Challenge in Assay Validation
Validating an analytical method for a drug substance requires the generation and interpretation of vast amounts of data to prove the method is suitable for its intended purpose. Parameters such as accuracy, precision, specificity, linearity, and range must be rigorously established. A single validation study can encompass thousands of data points from multiple instruments, experimental runs, and analysts. Without a centralized system, this data resides in fragmented silos—instrument-specific software, electronic lab notebooks (ELNs), and spreadsheets—making it difficult to trace the complete data lineage, ensure version control, and maintain compliance with Good Laboratory Practice (GLP) and Good Manufacturing Practice (GMP) standards [60].
The industry is moving away from manual data handling, which is time-consuming and error-prone, towards integrated, intelligent software solutions [60]. These solutions are designed to acquire raw data directly from its source, organize multiparametric readouts, and present them meaningfully without extensive manual intervention [60]. Furthermore, the regulatory landscape is evolving, with agencies demanding full documentation and data integrity, often guided by standards like the FDA's 21 CFR Part 11 [60]. Effective data management tools are, therefore, not a luxury but a necessity for maintaining regulatory compliance and research efficiency.
Essential Tools for Data Integration and Analysis
Navigating data overload requires a toolkit that addresses data acquisition, integration, analysis, and management in a cohesive manner. The following table summarizes key categories of tools and their specific value in the context of drug substance assay research.
Table 1: Tools for Managing Data in Drug Substance Assay Research
| Tool Category | Key Functions | Application in Assay Validation & Research |
|---|---|---|
| Data Acquisition Software (e.g., SoftMax Pro) | Microplate reader control; raw data collection; initial curve-fitting and analysis [60]. | Acquires raw absorbance/fluorescence data from potency assays; performs initial regression analysis (e.g., 4PL, 5PL) to generate IC50/EC50 values [60]. |
| AI-Ready LIMS (e.g., Scispot) | Centralized data management; AI-ready data structuring; workflow automation; integration with computational tools [61]. | Provides a single source of truth for all validation data; standardizes data from HPLC, LC-MS, and plate readers for trend analysis; automates data pipelines to eliminate manual transfer [61]. |
| Data Analysis & Visualization Platforms (e.g., Ajelix BI, Powerdrill AI) | Statistical analysis; generation of interactive charts and graphs; creation of customizable dashboards [62] [63]. | Visualizes linearity data via scatter plots; displays precision (e.g., %RSD) across runs via bar charts; creates dashboards for real-time monitoring of validation milestones. |
| Clinical Trial Protocol Tools (SPIRIT 2025 Guidance) | Standardizes protocol content for clinical trials, ensuring completeness and transparency [64]. | Informs the planning of bioanalytical method validation studies that support clinical trials, ensuring all critical experimental and data handling elements are pre-defined. |
Spotlight on AI-Driven LIMS
Modern Laboratory Information Management Systems (LIMS) have evolved into intelligent platforms critical for handling data overload. Specifically, AI-driven LIMS like Scispot are engineered with a data lakehouse architecture that consolidates chemical synthesis records, high-throughput screening results, ADME-Tox data, and genomic information into unified, AI-ready repositories [61]. This is vital for assay validation, where data from multiple sources (e.g., stability samples, reference standards) must be correlated.
These platforms often feature proprietary data and automation layers (e.g., "GLUE" in Scispot) that standardize data models across the entire drug discovery pipeline. This layer automatically harmonizes data from disparate sources—such as LCMS instruments, qPCR machines, and automated liquid handlers—into unified, AI-ready formats, tracking complete data lineage from initial sample preparation through final analysis [61]. This creates a connected data model where every result is intrinsically linked to its parent compound, assay conditions, and quality control metrics, ensuring full traceability for regulatory audits.
Furthermore, AI agents within these systems can provide on-demand insights by analyzing experimental data in natural language. Researchers can query results conversationally to quickly assess validation parameters, such as requesting a summary of accuracy results across all tested concentrations, thereby accelerating the review process [61].
Experimental Protocols for Integrated Data Workflow
This protocol describes a standardized workflow for executing and analyzing a critical experiment in drug substance assay validation: the establishment of a linearity and range. The protocol is designed to be conducted using an integrated data management system, ensuring data integrity from acquisition to actionable insight.
Protocol: Determination of Linearity and Range for a Drug Substance Assay
1. Objective To validate the linearity of the analytical procedure and define its range by demonstrating that the analytical method provides test results that are directly proportional to the concentration of the drug substance within a specified range.
2. Research Reagent Solutions and Materials
Table 2: Essential Research Reagents and Materials
| Item | Function in the Experiment |
|---|---|
| Drug Substance Reference Standard | Provides the certified, high-purity material for preparing calibration solutions to establish the analytical curve. |
| Appropriate Solvent/Diluent | Used to dissolve and serially dilute the drug substance to create standard solutions across the intended concentration range. |
| Microplate Reader or HPLC/UPLC System | The core analytical instrument for measuring the analytical response (e.g., absorbance, fluorescence, peak area) of the prepared standards [60] [61]. |
| Data Acquisition Software (e.g., SoftMax Pro) | Controls the microplate reader, collects raw data, and performs initial curve-fitting and regression analysis [60]. |
| AI-Ready LIMS/Laboratory Platform (e.g., Scispot) | Manages sample metadata, tracks reagent lots, automates the calculation of statistical parameters (e.g., R², slope, y-intercept), and stores the complete data lineage for compliance [61]. |
3. Methodology
Solution Preparation:
- Prepare a stock solution of the drug substance reference standard at a concentration near the upper limit of the expected range.
- Using the appropriate diluent, perform a serial dilution to create a minimum of five concentration levels spanning the intended range (e.g., 50% to 150% of the target assay concentration).
- Each concentration level should be prepared in triplicate to assess precision alongside linearity.
- The LIMS should be used to generate the worklist and track the provenance of each prepared solution.
Instrumental Analysis:
- Following the established analytical procedure, analyze the prepared standard solutions in a randomized sequence to minimize the impact of instrumental drift.
- Utilize the data acquisition software (e.g., SoftMax Pro) to control the instrument, define the plate layout, and collect the raw response data for each well [60].
Data Acquisition and Integration:
- The raw data file is automatically ingested by the integrated data management platform (e.g., via a direct instrument connection to the LIMS) [61].
- The platform's data pipeline (e.g., GLUE) standardizes the raw output, links it to the sample metadata (concentration levels, replicate information), and triggers the pre-configured analysis workflow.
Data Analysis and Visualization:
- The platform automatically plots the mean analytical response against the known concentration of the standards.
- A linear regression model (y = mx + c) is applied to the data.
- The system calculates and reports the correlation coefficient (R²), y-intercept, slope, and residual sum of squares.
- A scatter plot with the regression line and equation is automatically generated for visual assessment.
Figure 1: Experimental workflow for determining assay linearity and range.
4. Data Interpretation and Actionable Insights The key to managing data overload is transforming processed data into a clear, actionable insight. The output of this protocol is a definitive linearity profile. The calculated R² value quantitatively confirms the strength of the linear relationship. The scatter plot provides an immediate visual confirmation. This integrated approach allows a scientist to quickly determine if the method's linearity is acceptable per pre-defined criteria (e.g., R² > 0.998), and if not, the data is readily available to diagnose issues (e.g., outliers, incorrect range). This entire package of raw data, analysis, and visualization is stored in a secure, audit-trailed environment, ready for regulatory assessment [60] [61].
Future Trends and Strategic Outlook
The tools and methods for managing scientific data are evolving rapidly. Several key trends identified for 2025 will further shape how labs handle data overload. There is a predicted strategic shift towards prioritizing high-quality, real-world patient data for AI model training over synthetic data in drug development, leading to more reliable and clinically validated processes [65]. Furthermore, AI-powered clinical trial design and patient recruitment are becoming mainstream, with predictive analytics optimizing protocols and identifying suitable patients with unprecedented efficiency [65]. Finally, the rise of hybrid trial models and the use of real-world data are setting new benchmarks for trial consistency and transparency, requiring even more flexible and powerful data integration tools [65].
For research teams focused on analytical method validation, the strategic imperative is clear: invest in a unified data infrastructure that is inherently AI-ready. Platforms that offer structured data architecture, seamless instrument integration, and embedded analytics will not only solve the immediate problem of data overload but also position laboratories to capitalize on these emerging trends, turning the challenge of big data into a sustainable competitive advantage.
The development of biologics, cell, and gene therapies (CGTs) represents a frontier in modern medicine, offering potential cures for previously untreatable conditions. However, the inherent complexity and novelty of these advanced modalities introduce significant analytical challenges. Unlike traditional small molecules, these products are often large, heterogeneous, and characterized by intricate structure-function relationships. Consequently, validating analytical methods for these therapies demands a specialized, science-driven approach to ensure their identity, purity, quality, safety, and efficacy. This document outlines application notes and detailed protocols for addressing these analytical challenges, framed within the critical context of validating methods for drug substance assays. A phase-appropriate strategy, which aligns the level of analytical validation with the stage of clinical development, is essential for successfully navigating the journey from preclinical research to commercial application [66] [67].
Application Note: A Phase-Appropriate Framework for Analytical Validation
Background and Principle
The phase-appropriate approach is a widely accepted strategy for the analytical validation of biologics and CGTs. It acknowledges that the level of method understanding and validation should evolve as a product progresses through clinical development and its commercial lifecycle. The core principle is that analytical methods should be "fit-for-purpose" at each stage, providing reliable data to support critical decisions without imposing unnecessary burdens during early development [66] [67]. This framework manages risk effectively, ensuring patient safety while enabling efficient acceleration of promising therapies for unmet medical needs.
Core Framework and Data Requirements
The following table summarizes the key stages of assay development and their alignment with clinical development phases, alongside the typical experimental scope required at each stage.
Table 1: Phase-Appropriate Assay Validation Framework
| Clinical Phase | Assay Stage | Purpose of Clinical Phase | Key Assay Focus & Documentation | Typical Number of Experiments |
|---|---|---|---|---|
| Preclinical / Phase 1 | Stage 1: Fit-for-Purpose | Early safety, dosing, and process development [66]. | Demonstrates accuracy, reproducibility, and biological relevance. Suitable for IND submissions [66]. | 2 - 6 [66] |
| Phase 2 | Stage 2: Qualified Assay | Dose optimization and process development [66]. | Evaluation of robustness, accuracy, precision, linearity, range, and specificity. Aligns with ICH Q2(R2) principles [66]. | 3 - 8 [66] |
| Phase 3 / Commercial | Stage 3: Validated Assay | Confirmatory efficacy and safety; lot release and stability [66]. | Full validation per ICH Q2(R2) and GMP standards. Supported by detailed SOPs and QC/QA oversight for BLA/NDA submission [66]. | 6 - 12 [66] |
Strategic Implementation
Implementing this framework requires proactive life cycle management. Early in development, defining an Analytical Target Profile (ATP) is critical. The ATP is a prospective summary of the required performance characteristics of an analytical procedure, guiding its development and qualification to ensure it is suitable for its intended use throughout the product lifecycle [68] [67]. Furthermore, as processes and methods evolve, analytical method bridging studies are necessary to demonstrate comparability between the old and new methods, ensuring continuity and reliability of data [67].
Diagram 1: Assay maturation pathway.
Application Note: Specific Analytical Challenges for Cell and Gene Therapies
Unique CGT Product Characteristics
CGTs, often classified as Advanced Therapy Medicinal Products (ATMPs), present a distinct set of analytical hurdles not typically encountered with conventional biologics. These challenges stem from several factors:
- Complexity and Heterogeneity: These products are highly complex and heterogeneous, with analytical techniques and manufacturing processes still under intense development and optimization [68].
- Variable Starting Materials: The use of patient- or donor-derived biological materials as starting points introduces inherent variability that can impact the consistency of the final product [69] [68].
- Limited Batch History and Sample Availability: Small batch sizes, particularly for autologous therapies, result in very limited product available for analytical testing, making traditional validation approaches difficult [68].
- Immature Assays: For critical quality attributes like potency, the methods themselves may be "immature." Techniques such as analytical ultracentrifugation (AUC) or cryogenic electron microscopy (cryoEM) are powerful but not yet routine in GMP environments, lacking compliant software and standardized protocols [68].
Categorization of Analytical Methods
Analytical methods for CGTs can be grouped by their maturity and technological establishment:
Table 2: Categorization of Analytical Methods for Advanced Therapies
| Maturity Level | Description | Common Examples |
|---|---|---|
| Fully Mature | Established methods adapted from mature biopharmaceuticals (e.g., monoclonal antibodies). Often use kit-based assays and GMP-compliant systems [68]. | Host-cell protein (HCP) and host-cell DNA impurity testing; excipient testing [68]. |
| Needs Development | Assays using established platforms but require significant development and optimization for CGT matrices [68]. | Post-translational modification (PTM) analysis by peptide mapping; protein aggregation analysis by SEC; capsid protein quantification [68]. |
| Immature | Methods that rely on uncommon techniques in pharmaceutical release settings, requiring extensive development and lacking GMP-ready platforms [68]. | Empty/full capsid ratio quantification (by AUC, cryoEM); infectivity assays; biologically relevant potency assays [68]. |
The Criticality of Potency Assays
For CGTs, demonstrating biological activity through a relevant potency assay is a major challenge and a regulatory focal point. These assays must be quantitative, reflect the product's complex mechanism of action (MoA), and be predictive of clinical efficacy. Given the difficulties in developing such methods, regulators suggest a phase-appropriate approach, with the aim of having a qualified assay before pivotal clinical trials [68]. The complexity of CGT MoAs makes developing a single, comprehensive potency assay difficult; often, a matrix of assays may be needed to fully characterize the product's biological activity [69].
Protocol: Phase-Appropriate Qualification of a Cell-Based Potency Assay
Scope and Application
This protocol describes a detailed methodology for qualifying a cell-based bioassay intended to measure the relative potency of a gene therapy product during Phase 2 clinical development. The assay is designed to measure a specific biological response (e.g., expression of a reporter gene or cytokine) following infection of a permissive cell line with the viral vector product.
Experimental Workflow
The following diagram outlines the key stages of the assay qualification process.
Diagram 2: Assay qualification workflow.
Materials and Reagents
Table 3: Research Reagent Solutions and Essential Materials
| Item | Function / Description | Key Considerations |
|---|---|---|
| Permanent Cell Line | Biologically responsive system to measure the product's mechanism of action. | Create a Master Cell Bank under GMP guidance for long-term, consistent supply [66]. Monitor passage number and viability. |
| Reference Standard (RS) | Well-characterized material used to calibrate the assay and calculate relative potency of test samples. | Use a single, well-characterized batch. Produce single-use aliquots to maintain consistency [66] [68]. |
| Test Samples | In-process or drug product samples from the manufacturing process. | Handle per stability protocol; evaluate freeze-thaw stability [66]. |
| Cell Culture Media & Reagents | Supports cell growth and maintenance. | Use consistent sources and formulations to minimize background variability. |
| Detection Reagents | Antibodies, substrates, or dyes used to quantify the biological response (e.g., ELISA, FACS). | Validate specificity and optimize concentration to ensure a robust signal-to-noise ratio. |
Step-by-Step Procedure
Cell Seeding:
- Harvest cells from culture flasks and determine viability and cell density.
- Seed cells into microtiter plates at a pre-defined, optimized density in growth medium.
- Incubate plates for a specified period (e.g., 24 hours) to allow cells to adhere and enter a logarithmic growth phase.
Sample Dilution and Addition:
- Thaw the Reference Standard (RS) and test samples on ice.
- Prepare a series of serial dilutions of both the RS and test samples in an appropriate assay diluent. A minimum of five concentration points is recommended to define the dose-response curve.
- Remove the cell plate from the incubator and carefully add the diluted samples to the wells. Include control wells (e.g., cells only, vehicle control).
Incubation and Response Development:
- Incubate the plates for the predetermined infection/response period.
- After incubation, lyse the cells or collect the supernatant, depending on the readout.
- Develop the assay signal according to the specific detection method (e.g., add luminescence substrate, perform ELISA development).
Signal Measurement and Data Analysis:
- Read the plate using the appropriate instrument (e.g., luminometer, plate spectrophotometer).
- Transfer raw data to a suitable analysis software.
- Fit the dose-response data for both the RS and test samples to a 4-parameter logistic (4-PL) model.
- Calculate the relative potency of the test sample by comparing its EC50 (or other fitted parameter) to that of the RS.
Acceptance Criteria and Data Interpretation
The assay qualification is considered successful if the following preliminary acceptance criteria, derived from industry practice, are met [66]:
Table 4: Example Preliminary Acceptance Criteria for a Qualified Potency Assay
| Performance Characteristic | Preliminary Acceptance Criteria |
|---|---|
| Specificity / Interference | Negative controls show no significant activity. |
| Accuracy | EC50 values for RS and Test Sample agree within 20%. |
| Precision (Replicates) | % Coefficient of Variation (%CV) for replicates (e.g., triplicates) is within 20%. |
| Precision (Curve Fit) | Goodness-of-fit (R² or fitness value) to the 4-parameter curve is >0.95. |
| Intermediate Precision | Relative Potency variation across experiments (different days, analysts) has a %CV <30%. |
| Parallelism | The dose-response curves of the RS and Test Sample are parallel, indicating similar biological activity. |
Navigating the regulatory landscape is paramount for the successful approval of CGTs. Developers should engage in early and frequent dialogue with regulatory agencies like the FDA and EMA to align on analytical strategies [68]. While a phase-appropriate approach is accepted, regulators expect increased rigor as development progresses. Key relevant guidance documents include:
- ICH Q2(R2): Validation of Analytical Procedures [7]
- FDA Guidance: Chemistry, Manufacturing, and Control (CMC) Information for Human Gene Therapy INDs [70] [67]
- FDA Guidance: Potency Tests for Cellular and Gene Therapy Products [70] [67]
In conclusion, addressing the analytical challenges of novel modalities requires a holistic, phase-appropriate, and science-driven strategy. By implementing robust, fit-for-purpose methods early, proactively managing the analytical lifecycle, and engaging with regulators, developers can build a compelling data package that demonstrates product quality and accelerates the delivery of these transformative therapies to patients.
The detection and control of Nitrosamine Drug Substance-Related Impurities (NDSRIs) represent one of the most significant regulatory and analytical challenges facing the pharmaceutical industry today. NDSRIs are a specific class of nitrosamine impurities that form when secondary or tertiary amine centers in drug substances react with nitrite sources present in excipients or during the drug manufacturing process [71]. These impurities have gained substantial regulatory attention following high-profile cases of nitrosamine contamination, most notably the Valsartan NDMA contamination in 2018 and subsequent concerns regarding nitrosamine formation in Zantac [71]. The carcinogenic and mutagenic potential of these compounds, even at trace concentrations, has prompted global regulatory bodies to establish stringent guidelines and deadlines for their control.
The regulatory landscape for NDSRIs is evolving rapidly, with the U.S. Food and Drug Administration (FDA) establishing a crucial deadline of August 1, 2025, by which all pharmaceutical manufacturers must ensure that NDSRIs in their products adhere to established Acceptable Intake (AI) limits [72] [73]. This deadline applies to both currently marketed and newly approved drug products, requiring comprehensive risk assessments, confirmatory testing, and implementation of control strategies [71]. The complexity of NDSRI analysis stems from several factors: the structural diversity of these impurities, their presence at extremely low concentrations (parts per billion or even trillion), and matrix interference effects from drug formulations that can complicate accurate detection and quantification [72].
Regulatory Framework and Acceptable Intake Limits
Evolution of NDSRI Regulations
The regulatory response to nitrosamine impurities has intensified since initial concerns emerged in 2018. In August 2023, the FDA issued final guidance establishing Acceptable Intake limits for NDSRIs, followed by an updated guidance in September 2024 titled "Control of Nitrosamine Impurities in Human Drugs" [74]. These documents categorize nitrosamines into two classes: small-molecule nitrosamines (which do not share structural similarity to the API and are found in many different drug products) and NDSRIs (which share structural similarity to the API and are generally unique to each API) [74]. The formation of NDSRIs can occur through multiple pathways, primarily through nitrosating reactions between amines (secondary, tertiary, or quaternary amines) in APIs and nitrous acid (formed from nitrite salts under acidic conditions) during drug product formulation and manufacturing [74].
A significant regulatory development occurred on June 23, 2025, when the FDA discreetly revised its guidance on NDSRIs, providing manufacturers with additional flexibility for compliance [72]. While confirmatory testing remains due by August 1, 2025, the agency will now accept detailed progress reports in lieu of full implementation for approved or marketed products. Sponsors must include these updates, covering testing data, mitigation steps, and estimated timelines, in their annual or amended annual reports under a newly established "NDSRI Update" section [72].
Establishing Acceptable Intake Limits
The FDA recommends a risk-based approach to establishing AI limits for NDSRIs, primarily utilizing the Carcinogenic Potency Categorization Approach (CPCA) [74]. This approach categorizes NDSRIs into different potency categories based on their predicted carcinogenic potential, with corresponding AI limits. The CPCA framework represents the current thinking of the FDA and is regularly updated as new information becomes available.
Table 1: FDA Recommended AI Limits for NDSRIs Based on Carcinogenic Potency Categorization
| Potency Category | Recommended AI Limit | Representative Examples |
|---|---|---|
| Category 1 | 26.5 ng/day | N-nitroso-benzathine (Penicillin G Benzathine) |
| Category 2 | 100 ng/day | N-nitroso-meglumine (multiple APIs) |
| Category 3 | 400 ng/day | N-nitroso-norquetiapine (quetiapine), N-nitroso-ribociclib-1 (Ribociclib) |
| Category 4 | 1500 ng/day | N-nitroso-dalbavancin series (Dalbavancin), N-nitroso-acebutolol (Acebutolol) |
| Category 5 | 1500 ng/day | N-nitroso-ribociclib-2 (Ribociclib), N-nitroso-abacavir (Abacavir), N-nitroso-acarbose (Acarbose) |
Source: Adapted from FDA CDER Nitrosamine Impurity Acceptable Intake Limits [74]
For APIs with multiple nitrosatable amine centers, the FDA provides differentiated potency categories for each unique nitrosamine formed by mono-nitrosation, designated with suffixes "-1," "-2," etc. [74]. This nuanced approach acknowledges that different structural formations of NDSRIs from the same API may exhibit varying carcinogenic potentials. When compound-specific data or read-across analysis from surrogates becomes available, the FDA may move nitrosamine impurities from the CPCA-based Table 1 to a separate listing (Table 2) with updated recommended AI limits [74].
Analytical Method Development for NDSRI Testing
Technical Challenges in NDSRI Analysis
The analysis of NDSRIs presents several significant technical challenges that must be addressed during method development. Matrix interference represents one of the most substantial obstacles, as different drug formulations create unique analytical backgrounds that can mask the presence of nitrosamines at low levels, create false positive results, or reduce method sensitivity [72]. Additionally, the detection of non-standard NDSRIs requires customized approaches, as these product-specific impurities may not have established testing protocols or commercially available reference standards [72]. The extremely low detection limits required—often at parts per billion (ppb) or parts per trillion (ppt) levels—demand highly sensitive instrumentation and optimized sample preparation techniques [71].
Advanced Instrumentation and Techniques
The analysis of NDSRIs requires sophisticated analytical technologies capable of detecting and quantifying these impurities at trace levels. Liquid Chromatography-Electrospray Ionization-High Resolution Mass Spectrometry (LC-ESI-HRMS) has emerged as a cornerstone technique for confirmatory testing of NDSRIs due to its high sensitivity and specificity [71]. This method allows for precise identification and quantification of impurities, even in complex matrices, and is particularly beneficial in distinguishing between closely related compounds, which is critical when analyzing nitrosamines with similar structures but different toxicological profiles [71].
Other instrumental techniques commonly employed in NDSRI testing include:
- LC-MS/MS (Liquid Chromatography-Tandem Mass Spectrometry): Provides excellent sensitivity and selectivity for targeted analysis of specific NDSRIs [73]
- GC-MS (Gas Chromatography-Mass Spectrometry): Suitable for volatile nitrosamine impurities [73]
- High-Resolution Mass Spectrometry (HR-MS): Essential for structural identification of unknown NDSRIs [72] [73]
Table 2: Analytical Techniques for NDSRI Testing and Their Applications
| Analytical Technique | Key Applications in NDSRI Testing | Detection Capabilities |
|---|---|---|
| LC-ESI-HRMS | Confirmatory testing, structural elucidation of unknown NDSRIs | Detection at 1 ppb or lower [71] [73] |
| LC-MS/MS (QTOF and QQQ) | Targeted quantification, high-throughput screening | Detection at 1 ppb or lower [73] |
| GC-MS | Analysis of volatile nitrosamine impurities | Varies by compound |
| ICP-MS | Detection of elemental impurities | High sensitivity for metallic elements |
The selection of appropriate analytical techniques must be guided by the specific NDSRI structures of concern, the drug product matrix, and the required detection limits based on established AI limits.
Method Validation Requirements
The FDA and other global regulators have clarified specific expectations for analytical method validation for NDSRI testing [72]. Key validation parameters include:
- Specificity: Methods must demonstrate specificity for the target nitrosamine compounds, free from interference from the drug substance, excipients, or other impurities [72]
- Sensitivity: Detection limits must be significantly below AI thresholds (typically 30% of AI or lower) to ensure accurate quantification at safety-based limits [72]
- Linearity, Precision, and Accuracy: Methods must demonstrate acceptable performance across the validated range, with robust recovery across various matrices and formulations [72]
The validation process should be documented comprehensively, providing confidence in the reliability and reproducibility of testing results. Regulatory authorities emphasize that analytical methods must be "sensitive and appropriately validated" to support compliance determinations [73].
Experimental Protocols for NDSRI Analysis
Comprehensive Risk Assessment Protocol
Objective: To systematically identify and evaluate potential risks of NDSRI formation throughout the drug product lifecycle, from raw materials to finished product storage.
Materials and Equipment:
- Drug substance and drug product specifications
- Complete list of excipients and their certificates of analysis
- Manufacturing process flow diagrams
- Packaging specifications
- Computational toxicology tools (e.g., Derek Nexus, Sarah Nexus) [75]
Procedure:
- API Assessment: Examine the chemical structure of the active pharmaceutical ingredient to identify secondary, tertiary, or quaternary amine centers susceptible to nitrosation [71] [75]
- Excipient Evaluation: Review all excipients for potential nitrite contamination or other nitrosating agents, utilizing vendor declarations and testing data [75]
- Process Analysis: Evaluate manufacturing processes for conditions that could promote nitrosation, including temperature, pH, and potential interactions between components [72]
- Packaging Assessment: Examine packaging materials for potential leachables that could introduce nitrosamines or nitrosating agents [74]
- Toxicological Prioritization: Use computational toxicology assessment to predict carcinogenic potency of potential NDSRIs and prioritize testing based on risk [75]
Documentation: The risk assessment should be thoroughly documented, including all data sources, assumptions, and conclusions, forming the foundation for the testing strategy.
Sample Preparation and Extraction Workflow
The following workflow diagram illustrates a comprehensive sample preparation and analysis protocol for NDSRI testing:
Diagram 1: Sample Preparation Workflow for NDSRI Analysis
Advanced Sample Preparation Techniques: To address matrix interference challenges, advanced sample preparation techniques are often required:
- Solid-Phase Extraction (SPE): Select appropriate sorbents based on the chemical properties of target NDSRIs to achieve effective clean-up and concentration [72]
- Liquid-Liquid Extraction (LLE): Optimize solvent systems to maximize recovery of target analytes while minimizing co-extraction of interfering compounds [72]
- Matrix-Matched Calibration: Prepare calibration standards in processed blank matrix to compensate for matrix effects [76]
LC-ESI-HRMS Analysis Protocol
Objective: To separate, identify, and quantify NDSRIs in drug products using liquid chromatography coupled with high-resolution mass spectrometry.
Materials and Equipment:
- UHPLC system with binary pump, autosampler, and column oven
- High-resolution mass spectrometer with electrospray ionization source
- Analytical column: C18 column (100 × 2.1 mm, 1.7-1.8 μm particle size)
- Reference standards for target NDSRIs (when available) [77]
- Mobile phase components: LC-MS grade water, methanol, acetonitrile, and ammonium formate buffer
Chromatographic Conditions:
- Mobile Phase A: 2 mM ammonium formate in water
- Mobile Phase B: 2 mM ammonium formate in methanol:acetonitrile (50:50, v/v)
- Gradient Program: 5% B to 95% B over 15 minutes, hold for 3 minutes
- Flow Rate: 0.3 mL/min
- Column Temperature: 40°C
- Injection Volume: 5-10 μL
Mass Spectrometric Conditions:
- Ionization Mode: Positive electrospray ionization (ESI+)
- Resolution: >50,000 full width at half maximum (FWHM)
- Mass Range: m/z 50-500
- Source Temperature: 300°C
- Sheath Gas Flow: 40 arbitrary units
- Auxiliary Gas Flow: 10 arbitrary units
Validation Parameters:
- Specificity: No interference at retention times of target NDSRIs
- Linearity: R² > 0.990 over concentration range from LOQ to 200% of target concentration
- Accuracy: 85-115% recovery for spiked samples
- Precision: RSD < 10% for repeatability and intermediate precision
- LOQ: ≤ 30% of the AI limit concentration [72]
The Scientist's Toolkit: Research Reagent Solutions
The successful development and validation of NDSRI testing methods requires access to specialized reagents and materials. The following table details essential research reagent solutions for NDSRI analysis:
Table 3: Essential Research Reagents and Materials for NDSRI Testing
| Reagent/Material | Function and Importance | Application Notes |
|---|---|---|
| NDSRI Reference Standards | Method development, calibration, and identification | Available from USP Pharmaceutical Analytical Impurities (PAI) program; critical for accurate quantification [77] |
| LC-MS Grade Solvents | Mobile phase preparation, sample extraction | Minimize background interference and ion suppression; essential for achieving low detection limits |
| SPE Cartridges | Sample clean-up and concentration | Select sorbent chemistry based on NDSRI polarity; reduces matrix effects [72] |
| Stable Isotope-Labeled Internal Standards | Quantification accuracy and precision correction | Compensate for matrix effects and recovery variations; improves data reliability |
| Ammonium Formate Buffer | Mobile phase additive for LC-MS | Enhances ionization efficiency; volatile for compatibility with MS detection |
| Nitrite Test Kits | Excipient screening and qualification | Identify potential nitrosating agents in raw materials; part of risk assessment [75] |
Strategic Implementation and Compliance Approach
Developing a Control Strategy
A comprehensive control strategy for NDSRIs should extend beyond routine testing to include preventive measures throughout the product lifecycle. Based on the case study of miglustat capsules described in the literature, an effective control strategy incorporates multiple elements [75]:
- Supplier Qualification: Enhanced supplier qualification should include nitrosamine risk assessments for all raw materials, verification of supplier controls to prevent nitrosamine formation, and regular audit and testing of high-risk materials [72]
- Process Parameter Optimization: Manufacturing conditions should be controlled to minimize nitrosamine formation, with attention to pH conditions, temperature profiles, presence of nitrite sources, and exposure to certain catalyst systems [72]
- Packaging Selection: Evaluation of packaging materials for potential to introduce nitrosamines or nitrosating agents, with selection of alternatives where risks are identified [74]
The following diagram illustrates a comprehensive NDSRI risk assessment and control strategy:
Diagram 2: NDSRI Risk Assessment and Control Strategy
Mutagenicity Testing for Uncertain Risks
For NDSRIs with uncertain mutagenic potential, the FDA recommends additional testing, such as an enhanced Ames assay [71]. This adapted version of the traditional Ames assay is specifically designed to better detect the mutagenic potential of NDSRIs, which often have more complex structures than other nitrosamines traditionally studied. A negative result in a validated enhanced Ames assay can support higher AI limits, which may be necessary in cases where reducing impurity levels is not feasible without compromising the drug's efficacy [71]. However, a positive result may necessitate further testing or changes to the drug's formulation or manufacturing process to reduce impurity levels to an acceptable level.
The evolving regulatory landscape for NDSRIs demands a proactive, systematic approach to analytical method development and validation. The August 1, 2025 deadline represents a critical milestone, but NDSRI control will remain an ongoing focus for the pharmaceutical industry [72]. Success requires the integration of comprehensive risk assessment, advanced analytical technologies, and robust control strategies throughout the product lifecycle.
The optimized methods for NDSRI testing described in this application note emphasize the importance of sensitive and specific analytical techniques, particularly LC-ESI-HRMS, for the detection and quantification of these challenging impurities at trace levels. Furthermore, the case study approach demonstrates how theoretical risk assessment, when combined with empirical confirmatory testing, can lead to regulatory-approved control strategies that ensure patient safety while maintaining practical manufacturability.
As research continues to advance our understanding of nitrosamines and their formation mechanisms, the pharmaceutical industry must remain vigilant in updating and refining testing methodologies. A science-based approach, leveraging the latest analytical technologies and toxicological assessment tools, will be essential for navigating the complex regulatory requirements and safeguarding public health.
Strategies for Outsourcing Analytical Testing and Ensuring Partner Alignment
Within the critical pathway of validating analytical methods for drug substance assay research, the strategic decision to outsource analytical testing has become a cornerstone of modern pharmaceutical development. This approach provides sponsors with access to sophisticated instrumentation and specialized expertise, potentially accelerating development timelines [78] [79]. However, the delegation of these GxP-regulated activities introduces significant risks, including miscommunication, data integrity issues, and project delays, which can directly compromise method validation and drug application integrity [78] [80]. This document outlines detailed application notes and protocols designed to ensure that outsourced analytical testing programs are executed with precision, maintaining rigorous quality standards and fostering robust, aligned partnerships between sponsors and Contract Testing Organizations (CTOs).
Application Notes: Strategic Framework for Outsourcing
Quantitative Landscape of Outsourcing
Recent data illuminates the trends and financial considerations underpinning the decision to outsource laboratory functions. Understanding this landscape is crucial for strategic planning and budget forecasting.
Table 1: Laboratory Budget and Outsourcing Trends for 2025
| Trend Category | Key Data Point | Significance for Analytical Testing |
|---|---|---|
| Overall Budget Forecast | 70% of labs project budgets for new technology will stay the same or increase in 2025 [81]. | Indicates cautious growth; justifies outsourcing to access new technology without capital expenditure. |
| Primary Outsourced Activity | Analytical testing is the top-reported outsourced activity (37% of labs) [81]. | Confirms analytical testing as the most common and accepted function to outsource. |
| Equipment Purchasing | 67-91% of labs have no plans to purchase new analytical/preparative equipment in the next 12 months [81]. | Reinforces the trend of leveraging partners' existing equipment and capabilities. |
| Partnership Success Rate | Companies using structured alliance management report an 80% partnership success rate, versus 20% for ad-hoc approaches [82]. | Highlights the critical importance of a formal, structured management strategy. |
Key Partner Selection Criteria
Selecting a CTO is a critical first step. The following compatibility dimensions, derived from partnership analytics, have a high correlation with successful alliances.
Table 2: Partner Compatibility Assessment Index
| Compatibility Dimension | Correlation with Success | Key Assessment Metrics for a CTO |
|---|---|---|
| Strategic Alignment | 0.73 [82] | Quality culture, regulatory inspection history, commitment to project timelines, data transparency. |
| Operational Complementarity | 0.68 [82] | Availability of specific instrumentation (e.g., ICP-MS), data systems (LIMS), and scientific expertise. |
| Cultural Fit | 0.65 [82] | Communication responsiveness, proactive issue escalation, and collaborative problem-solving attitude. |
| Financial Expectations | 0.59 [82] | Cost structure, pricing model transparency, and handling of out-of-specification (OOS) investigations. |
Experimental Protocols
Protocol 1: Strategic Partner Selection and Onboarding
Objective: To establish a rigorous, data-driven procedure for the evaluation, selection, and initial onboarding of a CTO for analytical method validation and testing.
Workflow Diagram 1: Partner Selection and Onboarding Process
Procedure:
- Define Project Scope: Draft a comprehensive project charter detailing the method validation parameters (e.g., specificity, accuracy, precision, linearity, range, robustness), drug substance specifics, regulatory requirements, and key milestones [78].
- Due Diligence & Selection:
- Technical Assessment: Audit the CTO's capabilities, including instrumentation (e.g., HPLC, UPLC, ICP-MS) and their operational status (calibration, maintenance) [83]. Review SOPs for method transfer, validation, and OOS investigation.
- Compliance Review: Verify regulatory standing (e.g., FDA, EMA GMP compliance) and review past audit reports and inspection histories [80].
- Cultural & Operational Compatibility: Use the Partnership Compatibility Index (Table 2) to guide discussions. Assess communication styles and project management structures [82].
- Formal Kickoff & Onboarding:
- Conduct a formal kickoff meeting with all stakeholders from both organizations [78].
- Jointly develop a detailed project plan with clear timelines, milestones, and communication protocols (e.g., response times, meeting frequency).
- Establish a joint checklist for critical materials, documentation, and personnel responsibilities [78].
- Finalize and sign a Quality Agreement that definitively outlines roles, responsibilities, and data integrity standards [80].
Protocol 2: Maintaining Alignment Through Active Partnership Management
Objective: To implement a proactive communication and monitoring framework that ensures continuous partner alignment throughout the project lifecycle.
Workflow Diagram 2: Ongoing Partner Alignment Cycle
Procedure:
- Structured Communication:
- Weekly Status Meetings: Hold focused 15-30 minute meetings to review completed work, preview upcoming tasks, and troubleshoot potential challenges. Maintain a rolling action item log [78].
- Quarterly Business Reviews (QBRs): Conduct formal reviews to assess performance against strategic goals, review key metrics from Table 3, and align on future directions [84].
- Performance and Health Monitoring:
- Quantitative Tracking: Monitor the KPIs and operational metrics outlined in Table 3.
- Qualitative Assessment: Regularly gauge partner satisfaction and collaboration effectiveness through informal feedback and structured surveys [84].
Table 3: Key Performance Indicators for Partner Alignment
| Metric Category | Specific Metric | Target / Healthy Range |
|---|---|---|
| Operational Performance | On-time delivery of results [78] | >95% |
| Data accuracy (right-first-time) [83] | >98% | |
| Project Management | Adherence to validation timeline [78] | >90% |
| Meeting attendance rate [82] | >90% | |
| Communication Health | Response time to critical inquiries [82] | <4 hours |
| Proactive issue notification (before escalation) [78] | 100% | |
| Relationship Quality | Partner satisfaction score (via survey) [84] | >4.0 / 5.0 |
Protocol 3: Structured Troubleshooting and Deviation Management
Objective: To define a clear, collaborative process for investigating and resolving unexpected results or deviations, such as OOS outcomes, during method validation or routine testing.
Procedure:
- Immediate Notification: The CTO must immediately notify the sponsor's designated contact upon identifying a potentially OOS or aberrant result [78].
- Structured Investigation:
- Phase I - Laboratory Investigation: The CTO initiates a structured investigation reviewing method execution, instrument calibration and performance, data analysis, and documentation to confirm technical correctness [78].
- Phase II - Full Collaborative Investigation: If no assignable laboratory cause is found, the investigation expands into a joint sponsor-CTO effort.
- The sponsor investigates formulation, processing, and sample storage factors [78].
- Both parties collaborate to assess the method's robustness and potential for transfer issues.
- Root Cause Analysis & CAPA: The joint team documents the root cause and agrees on a Corrective and Preventive Action (CAPA) plan. All investigations, findings, and CAPAs must be thoroughly documented for regulatory readiness [80].
- Transparent Communication: Findings and updated timelines are communicated transparently during scheduled update meetings or sooner for urgent issues [78].
The Scientist's Toolkit: Essential Research Reagent Solutions
This section details critical non-biological materials and solutions required for establishing and maintaining a successful outsourced analytical testing program.
Table 4: Essential Reagents for Outsourced Testing Management
| Item / Solution | Function & Purpose |
|---|---|
| Quality Agreement | A legally binding document that defines the quality responsibilities of the sponsor and the CTO, ensuring regulatory compliance and clarity [80]. |
| Partner Relationship Management (PRM) Tool | A dedicated software platform (e.g., Impartner, Kademi) for tracking partner interactions, performance metrics, deal registration, and training, moving beyond the limitations of standard CRM [85] [84]. |
| Collaboration Practices Inventory (CPI) | A validated psychometric instrument with Value Focus and Partner Responsiveness subscales to quantitatively measure and improve collaborative effectiveness [82]. |
| Project Charter & Joint Plan | The foundational document outlining project scope, objectives, milestones, and communication protocols, ensuring all stakeholders are aligned from the start [78]. |
| Key Performance Indicator (KPI) Dashboard | A centralized, real-time visual display of critical metrics (see Table 3) enabling data-driven decision-making and performance management [84]. |
| Structured Communication Protocol | A pre-agreed schedule and format for meetings (weekly, quarterly) and reports, ensuring consistent and proactive information flow [78]. |
Implementing Continuous Process Verification (CPV) for Ongoing Method Performance Monitoring
Within the framework of validating analytical methods for drug substance assay research, ensuring that methods remain in a state of control throughout their lifecycle is paramount. Continuous Process Verification (CPV) represents a science- and risk-based paradigm for ongoing monitoring, aligning with regulatory guidance from the FDA and EMA to provide continual assurance of method performance [86] [87]. Unlike traditional approaches that may focus only on initial validation, CPV establishes a dynamic system for collecting and analyzing data from routine operations, enabling the timely detection of undesired variability or trends indicative of method drift [88]. This application note details the implementation of a CPV program specifically for monitoring analytical method performance, providing structured protocols, data presentation templates, and visualization tools to help scientists maintain robust, reliable assays in pharmaceutical development and quality control environments.
Theoretical Foundation and Regulatory Context
The CPV Lifecycle in Analytical Method Monitoring
The FDA’s process validation guidance outlines a three-stage lifecycle approach, which directly translates to the management of analytical methods [86] [89].
- Stage 1: Process Design (Method Development): During this stage, critical method performance characteristics are defined. This involves identifying Critical Quality Attributes (CQAs) such as accuracy, precision, and specificity, and linking them to Critical Method Parameters (CMPs) like mobile phase composition, column temperature, or detection wavelength through risk assessment and experimental design (e.g., Design of Experiments, DOE) [86] [87]. This phase establishes the scientific understanding and foundational control strategy for the method.
- Stage 2: Process Qualification (Method Validation): This stage corresponds to the traditional method validation, where the developed method is challenged to demonstrate that it is capable of consistently meeting its predefined acceptance criteria [86]. Data generated here, such as intermediate precision or robustness metrics, provide baseline performance data and initial process capability indices (e.g., Ppk) for future CPV activities [88].
- Stage 3: Continued Process Verification (Ongoing Monitoring): This is the ongoing, operational stage of CPV. It involves the routine, structured monitoring of the method's CQAs and CMPs during its routine use in the quality control laboratory [87]. The objective is to verify that the method remains in a state of control and to detect any adverse trends or shifts in performance before they lead to out-of-specification (OOS) results [86] [88].
Regulatory Alignment and Data Integrity
Regulatory agencies require that manufacturers maintain a continued state of control over processes and methods throughout the product lifecycle [87]. A well-documented CPV program, with its foundation in statistical process control, provides the evidence for this state of control during inspections. The methodology must be "scientifically sound" and "statistically valid," requiring documented justification for monitoring strategies and tool selection [86]. Successfully executing CPV also necessitates robust data management; relying on manual tracking in spreadsheets can be time-consuming and error-prone, potentially leading to data integrity issues. Automated data analytics platforms are therefore highly recommended to aggregate data from disparate sources (e.g., LIMS, CDS) and perform consistent statistical calculations [88].
CPV Implementation Protocol for Analytical Methods
This section provides a detailed, step-by-step protocol for establishing a CPV program for an analytical method.
Stage 1: Foundational Activities and Parameter Classification
Objective: To define the scope and critical elements of the monitoring program based on prior knowledge and risk assessment.
- Form a Cross-Functional Team: Include members from Analytical Development, Quality Control, and Quality Assurance.
- Define Method CQAs: Identify the key performance outputs of the method. These are typically the validation parameters, such as:
- Assay Accuracy and Precision
- System Suitability Test (SST) Parameters (e.g., Resolution, Tailing Factor, %RSD of Replicate Injections)
- Specificity/Selectivity
- Identify Critical Method Parameters (CMPs): Using a risk assessment tool (e.g., FMEA), identify method parameters (e.g., flow rate, gradient profile, column oven temperature) that significantly impact the CQAs [86] [88].
- Classify Parameters for Monitoring: Categorize the parameters to be monitored to focus resources effectively [88].
- Establish Baseline Performance and Limits: Using data from Stage 2 (Method Validation), establish baseline performance and initial control limits for the selected CQAs and CMPs.
Table 1: Parameter Classification for CPV Monitoring
| Parameter Class | Definition | Example in Analytical Method | Monitoring Rigor |
|---|---|---|---|
| Critical Method Parameter (CMP) | A parameter whose variability has a direct, significant impact on a method CQA. | Column Temperature, Gradient Slope | High - Routine statistical monitoring. |
| Key Performance Parameter (KPP) | A parameter that influences a CMP or is used to measure the consistency of the method operation. | Pump Pressure, Detector Lamp Energy | Medium - Routine monitoring with alert limits. |
| Monitored Parameter (MP) | A parameter tracked for troubleshooting or general health monitoring of the system. | Ambient Laboratory Temperature | Low - Trended as needed for investigations. |
Stage 2: System Setup and Statistical Foundation
Objective: To establish the statistical tools and control limits for the monitoring program.
- Data Suitability Assessment: Before selecting statistical tools, analyze the historical data for each parameter to understand its distribution [86].
- Normality Testing: Use statistical tests (e.g., Shapiro-Wilk) or visual tools (Q-Q plots) to check if data is normally distributed.
- Handling Non-Normal Data: For data that is not normally distributed (e.g., %RSD values, which may be skewed), use non-parametric methods like tolerance intervals or percentile-based control limits [86] [88].
- Determine Control Limits: Control limits are statistically derived bounds that represent the expected, inherent variability of a stable process/method [88].
- For Normally Distributed Data: Calculate limits as the Average ± 3 Standard Deviations (SD).
- For Non-Normally Distributed Data: Calculate limits based on percentiles (e.g., 0.135th and 99.865th percentiles) [88].
- Define Trending Rules: Establish rules for identifying out-of-trend (OOT) events. Commonly used rules include Nelson or Western Electric rules, such as:
- A single point outside the 3σ control limits.
- Seven consecutive points on one side of the average.
- Six consecutive points steadily increasing or decreasing [88].
- Calculate Process Capability: Determine the process capability (Ppk/Cpk) to quantify how well the method performance fits within its specification limits [86] [88]. A high Ppk (>2) indicates a robust method with low inherent variability relative to its specification.
Table 2: Statistical Control Limit Methodologies
| Data Distribution Type | Control Limit Calculation Method | Centerline | Applicable Metrics |
|---|---|---|---|
| Normal/Gaussian | Average ± 3 Standard Deviations (SD) | Average | Cpk, Ppk (using SD) |
| Non-Normal (e.g., Skewed) | Percentile-based (e.g., 0.135th / 99.865th) | Median | Ppk (using percentiles) |
Stage 3: Routine Monitoring, Response, and Reporting
Objective: To execute the ongoing monitoring program and manage the response to signals.
- Data Collection and Aggregation: Automatically or manually collect data from each analytical run. An integrated software environment is ideal for aggregating data from instruments, LIMS, and electronic lab notebooks [88].
- Statistical Analysis and Visualization: Generate Statistical Process Control (SPC) charts for the defined parameters. These charts visually display the data points over time against the established control limits.
- Out-of-Trend (OOT) Investigation: When a trending rule is violated, initiate a documented investigation.
- Root Cause Analysis (RCA): Use tools like 5-Whys or Ishikawa diagrams to determine the source of the shift (e.g., column degradation, reagent lot change, instrument fault).
- Impact Assessment: Evaluate the impact of the OOT event on past and future analytical results.
- Corrective and Preventive Action (CAPA): Implement corrections and establish preventive actions to avoid recurrence [88].
- Periodic Reporting: Generate quarterly or semi-annual CPV reports summarizing the state of control of the method, all OOT events, CAPA status, and any recommendations for updating control limits or improving the method [88].
- Control Limit Updates: Periodically re-evaluate and update statistical control limits as more batch data is accumulated, ensuring they reflect the current state of the method [88].
Data Management and Advanced Statistical Tools
The Scientist's Toolkit: Essential Research Reagent and Software Solutions
Table 3: Key Tools and Software for CPV Implementation
| Tool Category | Specific Examples | Function in CPV |
|---|---|---|
| Data Analytics & Modeling | KNIME, Simca, Python/R with scikit-learn, Sartorius SIMCA | Facilitates multivariate data analysis (MVDA), model development, and automated statistical calculations [90]. |
| Process Monitoring & Statistical Software | JMP, Minitab, SAS | Performs univariate statistical analysis, generates SPC charts, and calculates process capability indices (Ppk/Cpk) [88]. |
| Data Management & Integration Platforms | BIOVIA Discoverant, OSIsoft PI System, Custom SQL Databases | Aggregates analytical data from disparate sources (LIMS, CDS, Excel) into a single, contextualized dataset for analysis [88] [90]. |
| Laboratory Information System (LIMS) | LabWare, STARLIMS | Serves as the primary repository for sample results and metadata, providing structured data for trend analysis. |
| Chromatography Data System (CDS) | Waters Empower, Thermo Scientific Chromeleon | Captures primary chromatographic data and system suitability parameters, which are critical inputs for CPV. |
Leveraging Multivariate Data Analysis (MVDA)
While univariate SPC is the cornerstone of many CPV programs, Multivariate Data Analysis (MVDA) offers a powerful advanced approach. MVDA techniques, such as Principal Component Analysis (PCA), can monitor multiple method parameters (CMPs and CQAs) simultaneously by leveraging the correlations between them [90]. This provides a more sensitive and holistic view of method performance.
- Advantages: Reduces the number of charts to review, increases sensitivity for detecting subtle process deviations that univariate charts might miss, and helps in root cause diagnosis via contribution plots [90] [89].
- Implementation: A PCA model is built from historical "in-control" data. New batches are projected onto this model, and multivariate statistics like Hotelling's T² and model residuals (DModX) are monitored for excursions [90].
Workflow and Signaling Visualization
The following diagrams, generated with Graphviz using the specified color palette, illustrate the core workflows and decision points in a CPV program.
CPV Program Lifecycle Workflow
Out-of-Trend Investigation and CAPA Process
Implementing a structured CPV program for analytical method monitoring is a critical component of a modern, lifecycle approach to quality assurance in pharmaceutical research and development. By moving beyond traditional, static validation, CPV provides a dynamic, data-driven framework for ensuring that analytical methods remain in a validated state throughout their commercial use. The protocols and tools outlined in this application note—from foundational risk assessment and univariate SPC to advanced MVDA—provide a clear roadmap for scientists to detect and address method variability proactively. This not only strengthens the overall control strategy for drug substance assays but also demonstrates a commitment to scientific excellence and regulatory compliance, ultimately supporting the consistent delivery of safe and effective medicines.
Comparative Validation Paradigms: Biosimilars, Real-Time Release, and Future Trends
The validation of analytical methods is a critical pillar in pharmaceutical development, ensuring that drug substance assays are reliable, accurate, and fit for their intended purpose. The landscape of this discipline is undergoing a profound transformation, moving from static, document-centric traditional methods to dynamic, science- and risk-based modern approaches [91]. This shift is largely driven by the adoption of the Product Lifecycle Management (PLM) concept, which views validation not as a one-time event but as a continuous process integrated from development through commercial manufacturing [17] [2]. Framed within the specific context of validating analytical methods for drug substance assay, this analysis compares these two paradigms, providing researchers with a clear understanding of their principles, applications, and implementation protocols.
International regulatory harmonization, championed by the International Council for Harmonisation (ICH), is a key catalyst for this evolution. The recent implementation of ICH Q2(R2) for the validation of analytical procedures and ICH Q14 for analytical procedure development provides a modernized, science- and risk-based framework [2]. These guidelines, alongside the U.S. Food and Drug Administration (FDA) which adopts them, encourage a more flexible and robust approach to validation, emphasizing a deep understanding of the method and its performance throughout its entire lifecycle [17] [2].
Conceptual Foundations
Traditional Validation Approach
The traditional validation approach is characterized by a fixed, sequential, and predominantly document-focused process. Its primary goal is to demonstrate, at a single point in time (typically prior to regulatory submission), that a method meets predefined acceptance criteria for a set of standard performance characteristics [91]. This approach is largely reactive, with compliance verified after the process is finalized. It often follows a linear path of process design, qualification, and verification [91]. The foundation for this approach was established in the original ICH Q2(R1) guideline, which defined the core validation parameters to be tested [2].
Modern Validation Approach
Modern validation, often termed Validation 4.0 within the context of Pharma 4.0, represents a strategic shift towards a dynamic, data-driven, and proactive framework [91]. It is embedded within the principles of Quality by Design (QbD), which seeks to build quality into the method from the outset, rather than merely testing for it at the end [17]. This approach is continuous and lifecycle-oriented, supported by real-time data analytics and enabled by advanced technologies such as Artificial Intelligence (AI), the Internet of Things (IoT), and cloud computing [91]. A cornerstone of the modern paradigm is the Analytical Target Profile (ATP), a prospective summary of the method's intended purpose and required performance characteristics, which guides all subsequent development and validation activities [2].
Comparative Analysis: Key Parameters and Data
The following tables provide a structured, quantitative comparison of the performance characteristics, operational metrics, and regulatory alignment of traditional versus modern validation approaches as applied to drug substance assay.
Table 1: Validation Parameter Assessment and Performance Comparison
| Validation Parameter | Traditional Approach (ICH Q2(R1) Focus) | Modern Approach (ICH Q2(R2) & Q14 Focus) | Impact on Drug Substance Assay |
|---|---|---|---|
| Accuracy & Precision | Established via one-off inter-day/inter-analyst tests; often viewed as static parameters [2]. | Continuously verified via Continuous Process Verification (CPV); monitored through statistical process control [92] [58]. | Modern approach enables real-time detection of assay drift, ensuring consistent potency results. |
| Specificity | Demonstrated by challenging the method with placebo/impurities in a fixed experimental design [2]. | Enhanced through Multi-Attribute Methods (MAM) and hyphenated techniques (e.g., LC-MS/MS) for higher resolution [17]. | Provides greater confidence in selectively quantifying the API in complex mixtures with multiple impurities. |
| Robustness | Often a final check, with limited exploration of parameter ranges [2]. | Formally assessed using Design of Experiments (DoE) to define a Method Operational Design Range (MODR) [17]. | Creates a resilient assay method that can accommodate minor, inevitable variations in laboratory conditions. |
| Lifecycle Management | Not formally defined; changes often require full re-validation [91]. | Integral to the process (ICH Q12); supports science-based, lean post-approval change management [17] [2]. | Dramatically reduces time and resources for method improvements and tech transfer. |
Table 2: Operational, Regulatory, and Business Metrics
| Metric Category | Traditional Approach | Modern Approach | Comparative Advantage |
|---|---|---|---|
| Time-to-Market | Slower due to linear process, potential for late-stage failures, and lengthy change protocols [91]. | >30% faster via agile workflows, parallel development, and modular testing [17]. | Accelerates drug development timelines. |
| Compliance Model | Reactive; compliance is verified post-process, leading to potential delays and rework [91]. | Proactive; continuous monitoring ensures an ongoing state of control and inspection readiness [17] [92]. | Reduces regulatory risk and audit findings. |
| Resource & Cost | High manual effort, document management costs, and potential for costly rework [91]. | Significant long-term cost reduction via automation and reduced deviations; higher initial tech investment [91]. | Improved operational efficiency and lower cost of quality. |
| Data Integrity | Paper-based or fragmented systems; higher risk of human error and data gaps [58]. | Embedded ALCOA+ principles via electronic systems with robust audit trails [17] [92]. | Creates a foundation of trust and reliability in assay data. |
Experimental Protocols for Modern Validation
Protocol 1: Developing an Assay Method Using an Analytical Target Profile (ATP)
This protocol outlines the foundational step in the modern validation lifecycle as per ICH Q14 [2].
- Define the ATP: Before any laboratory work, draft a concise ATP for the drug substance assay. The ATP must state:
- Analyte: e.g., Active Pharmaceutical Ingredient (API).
- Analytical Technique: e.g., High-Performance Liquid Chromatography (HPLC).
- Objective: To quantify the API in a drug substance for release and stability testing.
- Performance Requirements: Define the required Accuracy (e.g., 98.0-102.0%), Precision (e.g., RSD < 2.0%), Linearity (e.g., R² > 0.998 over a specified range), and Specificity (ability to separate from known impurities) [2].
- Risk Assessment: Conduct a risk assessment (e.g., using a Failure Mode and Effects Analysis matrix) to identify and rank method parameters (e.g., mobile phase pH, column temperature, flow rate) that could significantly impact the ATP attributes [58] [2].
- Method Design and Development: Using the ATP and risk assessment, design the method. Employ DoE to systematically optimize critical parameters and establish a MODR, ensuring the method is robust by design [17].
- Method Qualification and Validation: Perform validation studies as per ICH Q2(R2), targeting the performance criteria defined in the ATP. The experiments are now more focused and efficient due to the knowledge gained during development [2].
Protocol 2: Implementing Continuous Process Verification (CPV) for an Assay Method
This protocol ensures the method remains in a state of control during routine use [92].
- Establish a Control Strategy: Define the data collection plan, including the frequency of system suitability testing and the monitoring of control samples.
- Implement Real-Time Data Collection: Utilize Process Analytical Technology (PAT) tools or automated data capture from the Laboratory Information Management System (LIMS) to collect performance data (e.g., assay results for a control standard, retention times) [17] [58].
- Statistical Monitoring: Analyze the collected data in near real-time using statistical process control (SPC) charts. Set alert and action limits that are tighter than the formal validation limits.
- Triggered Actions: Implement a pre-defined plan for investigation and corrective action when data trends approach or exceed the action limits. This allows for proactive adjustments before a method fails or generates out-of-specification results [92].
Workflow Visualization
The following diagrams illustrate the fundamental logical and procedural differences between the traditional and modern validation lifecycles.
Diagram 1: Linear vs. Cyclical Validation Processes
Diagram 2: Data and Technology Flow in Modern Validation
The Scientist's Toolkit: Essential Research Reagent Solutions
The following table details key materials and technologies essential for implementing modern validation protocols in drug substance assay.
Table 3: Key Research Reagent Solutions for Modern Method Validation
| Tool / Technology | Function in Validation | Application Example |
|---|---|---|
| UHPLC Systems | Provides high-resolution, high-speed separation, improving specificity and throughput for assay and impurity profiling [17]. | Quantifying the main API and resolving closely eluting degradation products in a single run. |
| HRMS Detectors | Enables precise identification and characterization of unknown impurities, providing high-specificity data for method specificity claims [17]. | Confirming the structure of a forced degradation product to validate assay stability-indicating properties. |
| Certified Reference Standards | Serves as the primary standard for establishing method accuracy, linearity, and precision. Critical for reliable quantification [93]. | Used to prepare calibration standards for the API to construct a linearity plot and determine assay accuracy. |
| Process Analytical Technology (PAT) | Enables real-time in-process monitoring of Critical Quality Attributes (CQAs), facilitating Continuous Process Verification (CPV) [17] [58]. | In-line monitoring of API concentration during a continuous manufacturing process to ensure consistent quality. |
| Electronic Lab Notebook (ELN) & LIMS | Ensures data integrity and compliance with ALCOA+ principles by providing a secure, attributable, and traceable environment for data management [17] [92]. | Automatically capturing and storing all raw chromatographic data and results from assay validation experiments. |
| AI-Powered Data Analytics Platforms | Uses machine learning to optimize method parameters (e.g., DoE analysis) and predict method performance or maintenance needs [17] [91]. | Analyzing a multi-factorial DoE to define the robust MODR for the HPLC assay method. |
The transition from traditional to modern validation is a strategic imperative for drug development professionals. While traditional methods provide a familiar framework, the modern, lifecycle-oriented approach—anchored in QbD, enabled by digital technologies, and guided by the ATP—delivers superior agility, robustness, and efficiency [17] [91] [2]. For the validation of drug substance assays, this shift directly enhances data reliability and product quality while accelerating time-to-market. Successful implementation requires investment in new technologies and expertise, but the long-term benefits of a proactive, scientifically rigorous validation strategy are clear: it ensures sustained compliance and competitive advantage in the evolving pharmaceutical landscape.
In the context of validating analytical methods for drug substance assay research, a risk-based validation strategy is a systematic framework for prioritizing validation activities toward areas with the greatest potential impact on product quality and patient safety. This approach aligns resources with the criticality of each analytical procedure, ensuring regulatory compliance while optimizing efficiency. For researchers and drug development professionals, adopting this mindset is no longer optional; it is a fundamental requirement driven by global regulatory agencies and the increasing complexity of pharmaceutical products. The core principle is that not all tests, methods, or quality attributes carry equal importance. A risk-based strategy intentionally shifts focus from a one-size-fits-all, document-heavy approach to a targeted, scientifically sound, and efficient process that is commensurate with the identified risk [94] [95].
The business and regulatory drivers for this shift are powerful. Regulatory bodies like the FDA and EMA now explicitly promote risk-based approaches, as seen in modern guidance such as the FDA's Computer Software Assurance (CSA) and the principles outlined in ICH Q9 [94] [95]. From a business perspective, this strategy directly addresses the intense pressure to accelerate time-to-market. It reduces unnecessary validation burden, minimizes costly rework, and fosters a culture of scientific excellence and critical thinking within the organization. By focusing extensive validation efforts on high-risk methods—such as the assay for a drug substance itself—and applying leaner approaches to lower-risk tests, organizations can achieve significant resource savings without compromising quality or compliance [17].
Core Principles and Regulatory Framework
Foundational Concepts of Risk-Based Validation
A successful risk-based validation strategy is built upon several key concepts. First is the principle of proportionality, where the rigor and extent of validation activities are scaled to the risk posed by the analytical procedure. Second is the concept of fitness for intended use, meaning the validated method must be scientifically sound and reliable for its specific purpose in assuring the quality of the drug substance. Finally, the process must be dynamic and iterative, with risks being re-evaluated throughout the method's lifecycle as new data emerges [94] [17].
The strategy is fundamentally guided by two critical questions for every analytical method: First, what is the potential impact of method failure on the assessment of Critical Quality Attributes (CQAs)? Second, how much validation evidence is sufficient to control that risk and provide confidence in the method's results? Answering these questions requires a deep understanding of the product and process, which enables teams to make scientifically justified decisions about where to focus their validation resources [95].
Relevant Regulatory Guidelines and Standards
The following table summarizes the key regulatory documents and standards that form the foundation for risk-based validation.
Table 1: Key Regulatory Guidelines for Risk-Based Validation
| Guideline/Standard | Focus Area | Relevance to Risk-Based Validation |
|---|---|---|
| ICH Q9 (Quality Risk Management) | Provides overarching principles and tools for quality risk management. | The foundational document for all risk-based activities in pharmaceutical development and quality assurance [95]. |
| ICH Q2(R2) / Q14 | Covers analytical procedure development and validation. | Emphasizes a lifecycle approach and data-driven robustness, integrating development and validation [17]. |
| FDA Guidance on Computer Software Assurance (CSA) | Focuses on risk-based assurance for production and quality system software. | A practical model for applying risk-based principles to computerized systems, which are integral to modern analytical methods [94]. |
| GAMP 5 Framework | Provides a risk-based approach for validating computerized systems. | Offers a categorized framework (e.g., Software Categories 1-5) to scale validation efforts for software and IT infrastructure based on risk and complexity [95]. |
Implementing a Risk-Based Validation Strategy
The Risk Assessment Process
The initial and most critical phase is a systematic risk assessment. This structured process identifies and evaluates potential risks to ensure the analytical method is suitable for its intended purpose.
Table 2: Key Steps in the Risk Assessment Process for Analytical Methods
| Process Step | Key Activities | Output/Deliverable |
|---|---|---|
| 1. Risk Identification | - Define the method's intended use and performance parameters.- Identify potential failure modes (e.g., specificity interference, precision issues).- Use tools like Failure Mode and Effects Analysis (FMEA). | A comprehensive list of potential failure modes and their possible causes. |
| 2. Risk Analysis | - Evaluate the severity of each failure's impact on patient safety or product quality.- Assess the probability (likelihood) of occurrence for each failure.- Determine the detectability of the failure. | A risk ranking for each failure mode (e.g., High, Medium, Low). |
| 3. Risk Evaluation | - Compare the estimated risk levels against pre-defined risk acceptance criteria.- Prioritize risks that require control measures. | A prioritized list of risks that must be mitigated through targeted validation studies. |
Risk-Based Method Categorization and Scaling
Following the risk assessment, analytical methods should be categorized to determine the appropriate level of validation rigor. The following diagram illustrates the logical workflow for this categorization and the subsequent scaling of validation activities.
Diagram 1: Method Categorization and Validation Scaling Workflow
This risk-based categorization ensures that a method for a primary drug substance assay, which is typically high-risk, undergoes full validation, while a method for a residual solvent test might be medium-risk, requiring only partial validation or verification.
Experimental Protocols for Risk-Based Validation
Protocol 1: Targeted Method Validation Based on Risk Priority
This protocol outlines a streamlined approach for validating a high-priority analytical method, such as a drug substance assay.
1.0 Objective: To establish, through targeted experimentation, that the analytical procedure for the drug substance assay is fit for its intended use by validating parameters identified as high-risk.
2.0 Scope: Applicable to the stability-indicating HPLC assay for [Drug Substance Name].
3.0 Methodology:
- 3.1 Risk-Informed Parameter Selection: Based on prior risk assessment, the following parameters are deemed critical and must be validated: Specificity, Accuracy, Precision (Repeatability), and Linearity.
- 3.2 Specificity Procedure:
- 3.2.1 Inject blank (matrix without analyte), standard, and samples spiked with potential impurities/degradants.
- 3.2.2 Subject the drug substance to stress conditions (acid, base, oxidation, heat, light) to generate degradants.
- 3.2.3 Analyze stressed samples to demonstrate that the assay is unaffected and that the analyte peak is pure (e.g., using diode array detector or mass spectrometry). The method must adequately resolve the analyte from all known impurities and degradants [55].
- 3.3 Accuracy Procedure (Standard Addition):
- 3.3.1 Prepare a placebo matrix (if applicable) or a drug substance sample at a known concentration.
- 3.3.2 Spike the sample with the analyte at three concentration levels (e.g., 80%, 100%, 120% of target) across the range, in triplicate.
- 3.3.3 Calculate the recovery (%) for each spike level. The mean recovery should be within 98.0–102.0%.
- 3.4 Precision (Repeatability) Procedure:
- 3.4.1 Prepare six independent sample preparations from a homogeneous lot of the drug substance at 100% of the test concentration.
- 3.4.2 Analyze all six preparations and calculate the %RSD of the assay results. The %RSD should be ≤ 2.0%.
- 3.5 Linearity Procedure:
- 3.5.1 Prepare a series of standard solutions at a minimum of five concentration levels (e.g., 50%, 75%, 100%, 125%, 150% of target).
- 3.5.2 Inject each level in duplicate. Plot the peak response versus concentration.
- 3.5.3 Perform linear regression analysis. The correlation coefficient (r) should be ≥ 0.999.
4.0 Acceptance Criteria: All results must meet the pre-defined criteria outlined in sections 3.2–3.5. Any deviation must be investigated and justified.
Protocol 2: Risk-Based Software Validation (GAMP 5 Category 4/5)
This protocol provides a methodology for validating customized or custom-built software applications used in the analytical lab, following a risk-based approach.
1.0 Objective: To provide assurance that the [e.g., Customized LIMS or Chromatography Data System] is fit for its intended use in acquiring, processing, and reporting analytical data for drug substance assays.
2.0 Scope: Applies to the specified system, classified as GAMP 5 Category 4 (Configured Product) or 5 (Custom Application) [95].
3.0 Methodology:
- 3.1 System Definition and Risk Assessment:
- 3.1.1 Document the system's intended use and list all functions (e.g., data acquisition, integration, calculation, user access control, audit trail).
- 3.1.2 Perform a functional risk assessment. Identify high-risk functions where a failure could impact data integrity or result accuracy (e.g., calculation algorithms, data storage).
- 3.2 Assurance Activities (Scaled to Risk):
- 3.2.1 High-Risk Functions (e.g., Calculation Engine):
- Use scripted testing with predefined test cases.
- Verify calculations with known input and output data.
- Test boundary values and invalid inputs for robustness.
- 3.2.2 Medium/Low-Risk Functions (e.g., User Interface Navigation):
- Use unscripted testing methods like exploratory testing or error guessing.
- Focus on usability and ensuring the interface functions as expected without formal scripts [94].
- 3.2.1 High-Risk Functions (e.g., Calculation Engine):
- 3.3 Data Integrity Verification:
- 3.3.1 Verify that the system's electronic records and signatures comply with 21 CFR Part 11 requirements, if applicable.
- 3.3.2 Confirm that the audit trail is enabled, secure, and accurately records all critical data changes.
- 3.4 Vendor Assessment (for Category 4):
4.0 Acceptance Criteria: All high-risk functions perform accurately and reliably. The system generates and maintains complete, consistent, and accurate records. All test results and deviations are documented.
The Scientist's Toolkit: Essential Research Reagent Solutions
The following table details key reagents and materials critical for executing the validation protocols for a drug substance assay, along with their function.
Table 3: Essential Research Reagents and Materials for Assay Validation
| Item | Function / Rationale for Use |
|---|---|
| Certified Reference Standard | The highest purity material with a fully characterized identity and purity. Serves as the benchmark for all quantitative measurements (Accuracy, Linearity) [96]. |
| Forced Degradation Reagents | Acids (e.g., HCl), bases (e.g., NaOH), oxidants (e.g., H₂O₂), and a photolysis chamber. Used in specificity studies to intentionally degrade the drug substance and demonstrate the stability-indicating property of the method. |
| HPLC-Grade Solvents & Buffers | High-purity mobile phase components are critical for achieving baseline stability, reproducible retention times, and avoiding ghost peaks or system noise that can interfere with specificity and precision. |
| Characterized Impurities | Isolated and qualified impurity standards. Essential for demonstrating specificity by proving the method can resolve the main analyte from its potential impurities. |
Adopting risk-based validation strategies is a strategic imperative for modern drug development. By moving away from blanket validation approaches and instead focusing resources on critical areas, organizations can achieve greater operational efficiency, enhance regulatory compliance, and foster a stronger quality culture. The implementation of these strategies, guided by frameworks like ICH Q9 and GAMP 5, ensures that analytical methods for drug substance assays are scientifically sound and robust, directly supporting the primary goal of ensuring patient safety and product efficacy. As the industry evolves with trends like AI-driven analytics and real-time release testing, the principles of risk-based validation will remain the cornerstone of efficient and effective pharmaceutical analysis [17].
The U.S. Food and Drug Administration (FDA) has announced a significant policy shift that fundamentally alters the biosimilar development landscape. On October 29, 2025, the agency issued a new draft guidance titled "Scientific Considerations in Demonstrating Biosimilarity to a Reference Product: Updated Recommendations for Assessing the Need for Comparative Efficacy Studies." This guidance represents a major update to the biosimilar approval pathway, proposing that for many therapeutic protein products, comparative clinical efficacy studies (CES) may no longer be routinely required [97] [98].
This updated framework is based on the FDA's accrued experience and advances in analytical technology. The agency now recognizes that comparative analytical assessment (CAA) is generally more sensitive than clinical studies in detecting product differences [99]. This evolution in regulatory thinking prioritizes robust analytical characterization as the foundation for demonstrating biosimilarity, potentially reducing development timelines by 1-3 years and cutting an average of $24 million in development costs [97]. For researchers and drug development professionals, this shift emphasizes the critical importance of rigorous analytical method development and validation as the cornerstone of biosimilar development programs.
The Scientific and Regulatory Basis for the Change
Historical Context and Regulatory Evolution
The biosimilar approval pathway was established by Congress in 2010 through the Biologics Price Competition and Innovation Act (BPCIA) to promote competition for high-cost biologics [97]. Since the first biosimilar approval in 2015, the FDA has approved 76 biosimilars, representing only a small fraction of approved biologics, unlike the generic drug market where approved generics exceed brand drugs [97].
Traditional biosimilar development followed a stepwise approach, beginning with extensive analytical characterization, followed by nonclinical assessments (if needed), comparative pharmacokinetic/pharmacodynamic studies, and typically culminating in a comparative clinical efficacy study [100]. The 2015 FDA guidance described CES as necessary to resolve "residual uncertainty" about biosimilarity after analytical and PK/PD assessments [101].
Scientific Rationale for Emphasizing Analytical Data
The FDA's updated approach reflects the recognition that state-of-the-art analytical technologies can now characterize and model the in vivo functional effects of therapeutic proteins with high specificity and sensitivity [101]. Regulatory analyses of approved biosimilars have demonstrated that CES rarely provide crucial additional information for establishing biosimilarity. One review of 20 complex biosimilars assessed in Europe "did not identify any instance where efficacy trials added crucial information to establish biosimilarity" [102].
Furthermore, scientific limitations of CES have become apparent. For monoclonal antibodies, which often lack dose-limiting toxicity and are administered on the flat part of the dose-response curve, CES may lack sensitivity to detect potency differences that can be readily identified through in vitro assays [102]. This analytical superiority, combined with the resource-intensive nature of CES, underpins the FDA's updated position.
Table: Comparison of Traditional vs. Updated FDA Approach to Biosimilar Development
| Development Component | Traditional Approach | Updated FDA Approach |
|---|---|---|
| Comparative Analytical Assessment | Foundation of development program | Remains the critical foundation |
| Pharmacokinetic Study | Generally required | Generally required when feasible and clinically relevant |
| Immunogenicity Assessment | Generally required | Generally required |
| Comparative Clinical Efficacy Study | Routinely expected | Not routinely required when analytical data supports biosimilarity |
| Switching Studies | Required for interchangeability | Not generally recommended; FDA moving to designate all biosimilars as interchangeable |
Analytical Method Validation: Principles and Procedures
Key Definitions in Analytical Methodology
With the increased emphasis on analytical data in the updated biosimilar framework, understanding method validation principles becomes paramount. Three distinct but related concepts are essential:
- Validation: A formal process that demonstrates an analytical method's suitability for its intended use, confirming it produces reliable, accurate, and reproducible results across a defined range. It is required for methods used in routine quality control testing of drug substances, raw materials, or finished products [103].
- Verification: Confirms that a previously validated method works as expected when transferred to a new laboratory or used under modified conditions. It is not a re-validation but demonstrates the method's performance in the new setting [103].
- Qualification: An early-stage evaluation of an analytical method's performance during development phases to show it is likely reliable before full validation. It helps guide optimization and informs future validation protocols [103].
Analytical Method Validation Parameters
For biosimilar development, analytical method validation must comprehensively address parameters defined in regulatory guidelines such as ICH Q2(R1) to ensure methods are suitable for comparative assessments [103] [48]. The validation process establishes documented evidence that provides a high degree of assurance that the method will consistently produce results meeting predetermined specifications and quality attributes.
Table: Essential Validation Parameters for Analytical Methods
| Parameter | Definition | Importance in Biosimilar Development |
|---|---|---|
| Accuracy | The closeness of agreement between measured and accepted reference values | Ensures analytical results truly represent the quality attributes being compared |
| Precision | The closeness of agreement between a series of measurements (repeatability, intermediate precision) | Confirms consistency in measuring critical quality attributes across multiple analyses |
| Specificity | The ability to assess the analyte unequivocally in the presence of components | Demonstrates the method can distinguish the target attribute from closely related variants |
| Linearity | The ability to obtain test results proportional to analyte concentration | Establishes the method's quantitative capability across expected concentration ranges |
| Range | The interval between upper and lower analyte concentrations with suitable precision, accuracy, and linearity | Defines the operating limits for method applicability |
| Limit of Detection (LOD) | The lowest amount of analyte that can be detected | Important for impurity methods and forced degradation studies |
| Limit of Quantification (LOQ) | The lowest amount of analyte that can be quantified | Critical for establishing specification limits for product-related impurities |
| Robustness | The capacity to remain unaffected by small, deliberate variations in method parameters | Ensures method reliability during transfer between laboratories and over time |
Application Notes: Implementing the Streamlined Approach
Criteria for Applying the Streamlined Development Approach
The FDA's draft guidance specifies conditions where sponsors should consider the streamlined approach without CES. These criteria provide a framework for strategic development planning [98] [101]:
- Manufacturing Characteristics: The reference product and proposed biosimilar are manufactured from clonal cell lines, are highly purified, and can be well-characterized analytically.
- Understood Quality Attributes: The relationship between quality attributes and clinical efficacy is generally understood for the reference product, and these attributes can be evaluated by assays included in the CAA.
- Feasible PK Studies: A human pharmacokinetic similarity study is feasible and clinically relevant.
When these criteria are met, the FDA indicates that "an appropriately designed human pharmacokinetic similarity study and an assessment of immunogenicity may be sufficient to evaluate whether there are clinically meaningful differences between the proposed biosimilar and the reference product" [99].
Experimental Design for Comparative Analytical Assessment
A robust CAA should comprehensively evaluate critical quality attributes (CQAs) that may impact safety, purity, and potency. The assessment should implement a tiered approach based on the potential for each attribute to impact biological activity and clinical performance [100].
Primary CQAs (high risk to activity) require extensive side-by-side comparison with tight similarity margins and may include:
- Primary and higher-order structure (amino acid sequence, post-translational modifications, secondary/tertiary structure)
- Biological activities (binding assays, cell-based potency assays, Fc-mediated effector functions)
- Purity and impurity profiles (product-related variants, process-related impurities)
Secondary CQAs (lower risk) require comparative testing but with wider acceptance criteria and may include:
- Physicochemical properties (appearance, content, subvisible particles)
- General properties (identity, excipients)
Statistical Approaches for Analytical Similarity
The FDA recommends a statistical similarity assessment with predefined margins for quality attributes. Three tiers of statistical approaches are commonly employed:
- Tier 1: Equivalence Testing - Used for the most critical quality attributes with known clinical impact. Implements equivalence tests (e.g., two one-sided t-tests) with margins justified by analytical variability and potential clinical impact.
- Tier 2: Quality Range Approach - For attributes with moderate criticality. Compares the distribution of biosimilar test results to a quality range defined by reference product data (typically mean ± 3 SD or another justified margin).
- Tier 3: Raw Data/Graphical Comparison - For lower-risk attributes. Uses descriptive comparisons and graphical representations to demonstrate similarity.
The statistical analysis should account for variability in both the reference product and biosimilar, using an adequate number of lots (typically 10-30 reference product lots from multiple batches) to establish appropriate similarity margins [100].
Detailed Experimental Protocols
Protocol 1: Primary Structure Analysis by LC-MS/MS
Objective: To confirm amino acid sequence identity and characterize post-translational modifications.
Materials and Reagents:
- Samples: Proposed biosimilar and reference product (multiple lots)
- Digestion Enzymes: Trypsin (sequencing grade), Lys-C
- Reduction/Alkylation: Dithiothreitol (DTT), iodoacetamide
- Chromatography: LC-MS grade water, acetonitrile, formic acid
- System Suitability Standards: Appropriate peptide and protein standards
Procedure:
- Sample Preparation: Denature and reduce proteins using 6M guanidine HCl and 10mM DTT at 56°C for 30 minutes. Alkylate with 25mM iodoacetamide in the dark for 30 minutes.
- Enzymatic Digestion: Desalt proteins and digest with trypsin (1:20 enzyme:protein ratio) at 37°C for 16 hours. Quench with 1% formic acid.
- LC-MS/MS Analysis:
- Column: C18 reversed-phase (1.7μm, 2.1 × 150mm)
- Mobile Phase: A: 0.1% formic acid in water; B: 0.1% formic acid in acetonitrile
- Gradient: 2-40% B over 90 minutes, flow rate 0.2 mL/min
- Mass Spectrometer: High-resolution tandem mass spectrometer (Q-TOF or Orbitrap)
- Data Acquisition: Data-dependent acquisition (DDA) mode
- Data Analysis:
- Process raw data using appropriate software (e.g., BiopharmaFinder, MaxQuant)
- Identify peptides using database search algorithms
- Confirm 100% sequence coverage for both biosimilar and reference product
- Quantify post-translational modifications (deamidation, oxidation, glycosylation)
Acceptance Criteria:
- Complete sequence identity between biosimilar and reference product
- Similar profiles and levels of post-translational modifications
- Comparable peptide map with equivalent chromatographic profiles
Protocol 2: Biological Activity by Cell-Based Potency Assay
Objective: To demonstrate similar functional activity between biosimilar and reference product.
Materials and Reagents:
- Cell Line: Appropriate responsive cell line (e.g., SK-BR-3 for trastuzumab biosimilar)
- Culture Media: RPMI-1640 with 10% FBS, penicillin-streptomycin
- Detection Reagents: CellTiter-Glo or similar viability assay reagents
- Reference Standard: Qualified in-house reference standard
- Assay Plates: 96-well white-walled tissue culture plates
Procedure:
- Cell Culture: Maintain cells in appropriate culture conditions. Harvest during logarithmic growth phase.
- Cell Plating: Seed cells in 96-well plates at optimized density (e.g., 5,000 cells/well in 90μL media). Pre-incubate for 24 hours at 37°C, 5% CO₂.
- Sample Preparation: Prepare serial dilutions of biosimilar and reference product in assay media. Include reference standard for normalization.
- Treatment: Add 10μL of each dilution to designated wells (minimum n=3 per concentration). Include media-only (background) and untreated (maximum response) controls.
- Incubation: Incubate plates for 72-120 hours (duration determined during assay development).
- Viability Measurement: Equilibrate plates to room temperature. Add CellTiter-Glo reagent following manufacturer's instructions. Measure luminescence using plate reader.
- Data Analysis:
- Subtract background luminescence from all readings
- Calculate percent inhibition relative to untreated controls
- Generate dose-response curves using four-parameter logistic (4PL) model
- Calculate relative potency (EC₅₀ ratio) of biosimilar to reference
Acceptance Criteria:
- Parallel dose-response curves with similar upper and lower asymptotes
- Relative potency of 80-125% for qualified assay
- 95% confidence intervals within 80-125%
Table: Essential Research Reagent Solutions for Biosimilar Characterization
| Reagent Category | Specific Examples | Function in Biosimilar Development |
|---|---|---|
| Reference Standards | USP Reference Standards, WHO International Standards | Provide benchmarks for analytical comparison and assay calibration |
| Chromatography Columns | C18, C8, C4; HIC; SEC; IEX columns | Separate and characterize product variants and impurities |
| Mass Spectrometry Reagents | Trypsin/Lys-C, iodoacetamide, stable isotope labels | Enable primary structure characterization and quantification |
| Cell-Based Assay Components | Responsive cell lines, viability assay reagents, growth factors | Measure biological activity and potency |
| Binding Assay Reagents | Recombinant antigens, SPR chips, ELISA detection antibodies | Quantify target binding affinity and kinetics |
| Glycan Analysis Reagents | PNGase F, Sialidase, 2-AB labeling reagents | Characterize glycosylation patterns |
Navigating the Updated Regulatory Pathway
Strategic Considerations for Development Programs
With the elimination of mandatory CES in many cases, sponsors should adopt new strategic approaches to biosimilar development:
- Early Engagement with FDA: The draft guidance encourages sponsors to "discuss their proposed approach with FDA early in product development and prior to initiating clinical studies" [101]. Early communication is crucial for aligning development plans with FDA expectations.
- Investment in State-of-the-Art Analytics: The increased reliance on analytical data necessitates robust analytical development with orthogonal methods for characterizing CQAs. Investment in advanced technologies (HRMS, HDX-MS, NMR, SPR) provides comprehensive characterization.
- Comprehensive Understanding of Reference Product: Sponsors should develop deep understanding of reference product characteristics, including manufacturing process understanding, known quality attributes, and structure-function relationships.
- Risk-Based Approach: Focus resources on attributes with highest potential clinical impact. Implement rigorous change control and comparability protocols for manufacturing process changes.
Documentation and Regulatory Submissions
The Comparative Analytical Assessment (CAA) report becomes the cornerstone of the biosimilar application. This comprehensive document should include:
- Side-by-side comparison of all relevant quality attributes
- Statistical analysis demonstrating similarity with predefined margins
- Justification for any differences observed and assessment of clinical relevance
- Data demonstrating analytical method validity
- Lot selection rationale and description of reference product characterization
Additionally, the application should include complete protocols and results from the pharmacokinetic similarity study and immunogenicity assessment, demonstrating these studies were sufficiently sensitive to detect differences if they existed [98] [101].
The FDA's updated draft guidance on biosimilar development represents a paradigm shift that recognizes analytical methodologies as the most sensitive tool for demonstrating biosimilarity. This streamlined approach has the potential to significantly reduce development costs and timelines, thereby increasing patient access to affordable biologics. For researchers and drug development professionals, success in this new framework requires enhanced focus on robust analytical development, comprehensive characterization using state-of-the-art technologies, and strategic regulatory planning. By leveraging these updated guidelines, the biopharmaceutical industry can accelerate the development of high-quality biosimilars while maintaining the rigorous standards for safety and efficacy that patients and healthcare providers expect.
Implementing Real-Time Release Testing (RTRT) and Process Analytical Technology (PAT)
Real-Time Release Testing (RTRT) represents a fundamental shift in pharmaceutical quality control, moving away from traditional end-product testing toward a system where product quality is evaluated and ensured through real-time monitoring during the manufacturing process [104]. This approach relies on Process Analytical Technology (PAT), defined as a system for designing, analyzing, and controlling manufacturing through timely measurements of critical quality and performance attributes of raw and in-process materials [105]. When implemented within a Quality by Design (QbD) framework, RTRT and PAT enable a scientifically-based, risk-managed approach to quality assurance that provides higher statistical confidence in product quality while reducing production cycles and laboratory costs [106] [105].
For researchers validating analytical methods for drug substance assays, implementing RTRT requires a comprehensive understanding of the regulatory framework, technical components, and lifecycle management strategies that ensure these systems remain valid throughout their operational use. This document provides detailed application notes and experimental protocols to guide this implementation, with specific focus on integration within analytical method validation paradigms.
Regulatory Framework and Guidelines
The regulatory foundation for RTRT and PAT is well-established across major international jurisdictions. The European Medicines Agency (EMA) outlines requirements for applications proposing RTRT for active substances, intermediates, and finished products, emphasizing the interaction between quality assessors and GMP inspectors during the approval process [107] [108]. This guideline revises earlier parametric release documents without introducing new requirements, instead providing a consolidated framework for implementation [107] [108].
The U.S. Food and Drug Administration (FDA) has championed PAT implementation since its 2004 guidance, recognizing it as an important paradigm shift for continuous process verification [106]. Regulatory agencies generally operate on a "do and then tell" model for PAT implementations rather than requiring prior approval for every change, thus avoiding processing stoppages [104]. The FDA's Emerging Technology Program with its Emerging Technology Team (ETT) provides pre-submission guidance for companies implementing advanced approaches like RTRT [104].
For analytical method validation, the ICH Q2(R2) guideline provides the foundational requirements for validating analytical procedures used in release and stability testing [7]. This guideline addresses validation tests for procedures measuring assay/potency, purity, impurities, identity, and other quantitative or qualitative measurements [7]. When PAT tools are employed as part of RTRT, they must adhere to these validation principles while accounting for their unique operational characteristics.
Table 1: Regulatory Guidelines Relevant to RTRT/PAT Implementation
| Agency/Organization | Guideline | Scope and Relevance |
|---|---|---|
| EMA | Guideline on Real Time Release Testing | Requirements for RTRT applications for chemical and biological products [107] |
| ICH | Q2(R2) Validation of Analytical Procedures | Guidance for validating analytical procedures used in release and stability testing [7] |
| FDA | PAT Guidance (2004) | Framework for innovative pharmaceutical development, manufacturing, and quality assurance [106] |
| ICH | Q8(R2) Pharmaceutical Development | Defines Quality by Design (QbD) principles that form the foundation for PAT [106] |
| ICH | Q9 Quality Risk Management | Risk management principles essential for PAT implementation [109] |
PAT Tools and Technical Implementation
PAT encompasses a range of analytical tools and technologies that facilitate real-time monitoring of critical quality attributes (CQAs). These tools are typically classified as in-line, on-line, at-line, or off-line based on their integration with the manufacturing process, with in-line approaches providing the most immediate feedback for process control [110].
Spectroscopic PAT Tools
Spectroscopic methods form the backbone of many PAT implementations due to their non-destructive nature and rapid analysis capabilities. Near-infrared (NIR) spectroscopy is particularly prevalent for applications such as final blend potency analysis [105]. Raman spectroscopy serves as a multi-attribute method for monitoring multiple quality parameters simultaneously, especially in biotech applications [111]. Other spectroscopic tools include Fourier transform infrared (FTIR) spectroscopy and Nuclear Magnetic Resonance (NMR), with the latter being crucial for determining molecular structures and identifying drug metabolites [110].
The selection of appropriate PAT tools depends on the specific unit operation and the critical quality attributes being monitored. Different manufacturing stages require different monitoring approaches, each with specialized technical implementations.
Table 2: PAT Tools and Applications by Unit Operation
| Unit Operation | Critical Parameters/IQAs | PAT Tools | Application Examples |
|---|---|---|---|
| Blending | Drug content, blending uniformity [106] | NIR Spectroscopy [105] | Monitoring blend homogeneity and potency in real-time [105] |
| Granulation | Granule-size distribution, moisture content [106] | Laser Diffraction, NIR [105] | Particle size monitoring and endpoint detection [106] |
| Tableting | Weight, thickness, hardness, potency [105] | Laser-based sensors, NIR [105] | Real-time monitoring of tablet CQAs [104] |
| Coating | Coating thickness, uniformity | Raman Spectroscopy, NIR | Endpoint detection for coating processes |
| Biologics Manufacturing | Multiple quality attributes | Raman Spectroscopy [111] | Multi-attribute monitoring of sterile biotech products [111] |
Implementation Strategy
Successful PAT implementation requires a systematic approach that begins with comprehensive process understanding. This is typically achieved through Quality by Design (QbD) principles, where critical process parameters (CPPs) and their relationship to critical quality attributes (CQAs) are established through risk assessment and design of experiments (DoE) [106]. The control strategy for PAT application may include in-process testing, RTRT, and finished product testing, with the emphasis shifting to in-process controls as process understanding increases [106].
For drug substance assay research, PAT implementation follows a defined workflow that integrates analytical development with process understanding. The diagram below illustrates this implementation workflow:
Method Validation for PAT and RTRT
Validation Principles
Validation of PAT methods for RTRT must adhere to ICH Q2(R2) requirements while addressing the unique characteristics of real-time monitoring systems [7] [109]. The validation approach should demonstrate that the method is fit for its intended purpose in a continuous manufacturing environment. Traditional validation parameters including accuracy, precision, specificity, detection limit, quantitation limit, linearity, and range must be established using a science- and risk-based approach [7] [109].
For PAT methods, additional considerations include model robustness and the ability to handle expected process variability. As stated in the regulatory guidelines, "The guideline applies to new or revised analytical procedures used for release and stability testing of commercial drug substances and products (chemical and biological/biotechnological)" [7]. This encompasses PAT methods used for RTRT.
Analytical Method Development Protocol
A systematic approach to method development ensures that PAT methods will meet validation requirements. The following 10-step protocol adapts traditional analytical method development to the specific needs of PAT and RTRT:
Identify the Purpose: Clearly define whether the method will be used for release testing, process characterization, or both. Identify the specific CQAs that the method will monitor and their relationship to product quality [109].
Method Selection: Choose analytical techniques with appropriate selectivity and validity for the intended application. Consider whether the method measures quantity, activity, or both, and ensure it provides orthogonal confirmation to other methods when used in a control strategy [109].
Define Method Steps: Document all steps in the analytical procedure using process mapping software. Identify steps that may influence bias or precision for further characterization [109].
Establish Specification Limits: Set scientifically justified limits based on patient risk, CQA assurance, and manufacturing capability. Limits may be established using historical data, statistical tolerance limits, or transfer functions [109].
Risk Assessment: Perform risk assessment (e.g., FMEA) to identify factors that may influence precision, accuracy, linearity, selectivity, and signal-to-noise. Focus development efforts on high-risk areas [109].
Method Characterization: Characterize the method through system design (selecting appropriate technology), parameter design (optimizing through DoE), and tolerance design (defining allowable variation). Conduct Partition of Variation (POV) analysis to identify sources of assay error [109].
Method Validation and Transfer: Conduct comprehensive validation according to ICH Q2(R2) requirements. Use representative drug substance and drug product materials during validation. Establish equivalence for method transfer between sites or organizations [7] [109].
Control Strategy Definition: Establish controls for reference materials, system suitability, and ongoing monitoring. Define procedures for tracking and trending assay performance over time [109].
Analyst Training: Train all analysts using the validated method. Qualify analysts through testing with known reference standards to minimize analyst-induced variation [109].
Impact Assessment: Evaluate the method's impact on overall quality by calculating the percentage of tolerance consumed by measurement error. Aim for less than 20% to minimize out-of-specification rates [109].
Protocol for PAT Model Validation
For PAT methods utilizing predictive models (e.g., chemometric models), additional validation is required to ensure model robustness throughout its lifecycle. The following protocol outlines the key experiments for PAT model validation:
Objective: To establish and document that a PAT predictive model consistently provides accurate and reliable results when deployed in the manufacturing environment.
Scope: Applicable to all quantitative and qualitative models used in PAT applications for RTRT, including NIR, Raman, and other spectroscopic methods.
Materials and Equipment:
- PAT instrument (e.g., NIR spectrometer, Raman spectrometer)
- Reference analytical method (e.g., HPLC with validated method)
- Representative samples spanning expected manufacturing variability
- Software for multivariate data analysis and model development
Procedure:
Data Collection for Modeling:
- Collect spectra from samples representing expected variability in APIs, excipients, multiple lots, and process variations [105].
- Include both inline and offline sampling where applicable to capture different measurement scenarios.
- Document all experimental conditions and sample information in an electronic laboratory notebook (ELN) for traceability.
Model Calibration:
- Apply appropriate spectral preprocessing techniques (e.g., smoothing, standard normal variate, mean centering) to enhance signal quality [105].
- Select multivariate algorithm (e.g., PLS for quantitative models, LDA for classification) based on the analytical task.
- Optimize spectral ranges for prediction through iterative testing.
- For qualitative models, establish classification categories (e.g., typical, exceeding low, exceeding high) with defined thresholds [105].
Model Validation:
- Challenge the model with an independent set of official samples not used in model development, with known reference values [105].
- Validate classification models with samples representing all categories (typical, low, high) to ensure no false negatives and minimal false positives [105].
- Conduct secondary validation using historical production data (when available) encompassing lot and batch variability.
- Document model performance metrics including accuracy, precision, and robustness.
Ongoing Model Monitoring:
- Implement continuous monitoring of model diagnostics during routine use, including lack of fit and variation from center score metrics [105].
- Conduct annual parallel testing with reference methods to verify ongoing model performance.
- Perform annual product reviews to assess model health and identify potential needs for updating.
Acceptance Criteria:
- Quantitative models: Accuracy and precision meeting ICH Q2(R2) requirements for the intended use [7].
- Qualitative models: Correct categorization of validation samples with no false negatives and minimal false positives [105].
- Model diagnostics within established thresholds during routine operation.
PAT Model Lifecycle Management
PAT models are living entities that require ongoing management throughout their operational life. Model performance can be affected by various factors including aging equipment, changes in API or excipients, and previously unidentified process variations [105]. Effective lifecycle management ensures models remain accurate and predictive despite these changes.
The lifecycle of a PAT model consists of five interrelated components: data collection, calibration, validation, maintenance, and redevelopment [105]. Each component requires specific activities and documentation to maintain regulatory compliance.
Maintenance and Redevelopment Protocol
Objective: To monitor, maintain, and when necessary, update PAT models to ensure continued performance throughout their operational lifecycle.
Procedure:
Continuous Monitoring:
- During each PAT run, monitor model diagnostics in real-time, including lack of fit and variation from center score statistics [105].
- Generate trending reports for each batch to identify gradual changes in model performance.
- Set threshold alarms to notify operators when diagnostics exceed predefined limits.
Annual Review:
- Conduct annual parallel testing comparing PAT results with reference method results.
- Perform comprehensive product review including all PAT data and model performance metrics.
- Assess whether model updates are needed based on performance trends.
Model Redevelopment:
- When model performance degrades or process changes occur, initiate model redevelopment.
- Collect new data representing the changed conditions or newly identified variability.
- Update the model by adding new samples, adjusting spectral ranges, or modifying preprocessing techniques [105].
- For significant changes to algorithm or technology, submit appropriate regulatory notifications [105].
- Validate the updated model following the same protocol as initial validation.
- Document all changes and validation results in the electronic laboratory notebook.
Timeline and Resources: A typical model update may require up to two months from initiation to implementation. Stakeholders should plan for this downtime in production scheduling [105].
Essential Research Reagent Solutions
Implementing PAT and RTRT requires specific materials and technologies that form the "toolkit" for researchers. The following table details essential solutions and their functions in PAT method development and validation.
Table 3: Essential Research Reagent Solutions for PAT/RTRT Implementation
| Category | Item | Function and Application |
|---|---|---|
| Spectroscopic Systems | NIR Spectrometer with fiber optic probes | Non-destructive analysis of powder blends and final products for potency and content uniformity [110] [105] |
| Raman Spectrometer | Multi-attribute monitoring of complex molecules, particularly in biotech applications [111] | |
| FTIR Spectrometer | Molecular fingerprinting and functional group analysis in process streams [110] | |
| Reference Standards | Certified Reference Materials (APIs) | Method validation and system suitability testing for quantitative models [109] |
| Placebo and Excipient Blends | Matrix matching for model development to account for background effects [105] | |
| Software Solutions | Multivariate Analysis Software | Development and validation of chemometric models (PLS, LDA, etc.) [105] |
| Process Monitoring Software | Real-time data collection, visualization, and statistical process control [105] | |
| Electronic Laboratory Notebook (ELN) | Documentation of model development, maintenance activities, and change history [105] | |
| Calibration Tools | System Suitability Standards | Verification of instrument performance before and during PAT operation [109] |
| Validation Challenge Sets | Independent samples with known reference values for model validation [105] |
Case Studies and Practical Applications
Vertex Pharmaceuticals: PAT in Continuous Manufacturing
Vertex has successfully implemented PAT in a continuous manufacturing environment for their drug Trikafta, marketed in a triple-active oral solid dosage form [105]. Their approach utilizes NIR spectroscopy for final blend potency analysis of all three APIs, with nine chemometric models in the implementation [105]. For each API, there is a partial least squares (PLS) model, along with linear discriminant analysis models to classify each API as typical, exceeding low typical, or exceeding high typical [105].
The control strategy integrates NIR within in-process controls for final blend potency, with the NIR models defining typical potency limits (95-105%) while loss-in-weight feeders provide a wider specification range (90-110%) [105]. This dual approach allows for immediate segregation of non-conforming material while maintaining process efficiency. Vertex's implementation demonstrates the comprehensive lifecycle management required for sustainable PAT, including scheduled updates when introducing new suppliers or manufacturing sites [105].
Roche: RTRT for Biotech Drug Products
Roche pioneered the implementation of RTRT for a sterile biotech drug product, representing a significant advancement as such applications remain rare in aseptic manufacturing [111]. Key components of their RTRT strategy included:
- Implementation of a dedicated RTRT sampling point
- Utilization of Raman spectroscopy as a multi-attribute method
- Leveraging the existing rapid microbiology toolbox [111]
This implementation demonstrates that RTRT principles can be successfully applied to complex biological products, expanding beyond the more common applications in oral solid dosage forms. The case study provides valuable insights into regulatory feedback and implementation challenges for similar biological products [111].
Implementing Real-Time Release Testing and Process Analytical Technology represents a significant advancement in pharmaceutical quality assurance, moving from traditional end-product testing to quality assurance built directly into the manufacturing process. Successful implementation requires a comprehensive approach encompassing regulatory understanding, appropriate technology selection, robust method validation, and diligent lifecycle management.
For researchers validating analytical methods for drug substance assays, the protocols and application notes provided herein offer a framework for developing PAT methods that meet regulatory requirements while providing the real-time data necessary for RTRT. By adopting these approaches, pharmaceutical manufacturers can achieve greater process efficiency, reduced waste, and higher assurance of product quality – ultimately benefiting both manufacturers and patients through more reliable and accessible medications.
The future of RTRT and PAT will likely see expanded applications in biologics and advanced therapies, increased use of digital twins, and more sophisticated data analysis approaches including artificial intelligence and machine learning. Organizations that master these technologies today will be well-positioned to lead the pharmaceutical manufacturing industry of tomorrow.
The Role of Multi-Attribute Methods (MAM) for Streamlined Biologics Analysis
The complexity of biopharmaceuticals, such as monoclonal antibodies (mAbs) and fusion proteins, presents significant analytical challenges for ensuring their safety, efficacy, and quality. Traditional quality control (QC) approaches rely on multiple, often labor-intensive, techniques like ion-exchange chromatography (IEC) for charge variants, hydrophilic interaction liquid chromatography (HILIC) for glycan analysis, and capillary electrophoresis (CE-SDS) for size variants, with each method typically providing information on only one or a handful of critical quality attributes (CQAs) [112] [113]. This paradigm is increasingly inadequate for the efficient development and control of modern biologics.
The Multi-Attribute Method (MAM) is a liquid chromatography-mass spectrometry (LC-MS)-based peptide mapping method that has gained substantial interest as a transformative solution [113]. By leveraging high-resolution accurate mass (HRAM) MS, MAM enables the simultaneous identification, monitoring, and quantification of multiple CQAs—such as post-translational modifications (PTMs) and glycoprotein structures—site-specifically and in a single assay [112] [114]. Furthermore, its powerful new peak detection (NPD) capability provides a sensitive means to detect unexpected impurities or degradants that might be missed by conventional methods [113]. This application note details the implementation of MAM within the context of validating robust analytical methods for drug substance testing, providing structured protocols, data presentation, and visualization to guide its adoption.
What is the Multi-Attribute Method?
MAM is a peptide mapping-based method that utilizes high-resolution mass spectrometric data for the comprehensive characterization of biologics [112]. The core workflow involves enzymatically digesting the therapeutic protein into peptides, separating them via liquid chromatography, and then detecting them with an HRAM mass spectrometer [112]. Sophisticated software is subsequently used for two primary functions:
- Targeted Attribute Quantitation (TAQ): The site-specific identification and quantification of a pre-defined panel of product quality attributes (PQAs) that are deemed critical [113].
- New Peak Detection (NPD): A differential analysis that compares the LC-MS chromatograms of a test sample against a reference standard to detect the presence of any new peaks, which may indicate impurities or product variants [112] [113].
This dual functionality allows MAM to serve as a unified control system for product quality.
Benefits of Adopting MAM
The transition from a bundle of conventional methods to a single MAM workflow offers significant strategic advantages for drug development and QC, aligning closely with regulatory initiatives like Quality by Design (QbD) [112].
Table 1: Key Benefits of Implementing MAM
| Benefit Category | Specific Advantage | Impact on Development and QC |
|---|---|---|
| Analytical Efficiency | Consolidates multiple assays (e.g., IEC, CE-SDS, HILIC) into one [112] [113]. | Reduces assay time, cost, and operational complexity; fewer SOPs and instruments to maintain [112]. |
| Data Quality & Depth | Provides site-specific identification and quantitation of CQAs with high resolution and sensitivity [112] [113]. | Enables deeper product understanding and more informed decision-making; confident analytical control [112]. |
| Product Purity Assurance | Detects unexpected impurities and degradants via New Peak Detection (NPD) [113]. | Offers superior purity testing compared to UV-based methods; early detection of process or stability changes [113]. |
| Regulatory Alignment | Supports QbD principles by enabling thorough product characterization and process understanding [112]. | Facilitates smoother regulatory filings; listed under FDA's Emerging Technology Program [113]. |
| Lifecycle Management | Ideal for stability testing and comparability studies post-manufacturing changes [113]. | Efficiently monitors covalent modifications (e.g., deamidation, oxidation) over the product's shelf-life [113]. |
MAM Workflow and Signaling Pathway
A generic, yet robust, MAM workflow consists of several critical, interconnected steps that transform a protein sample into actionable quality data. The following diagram visualizes this process and the logical relationships between each stage.
Detailed Experimental Protocol for MAM
This section provides a detailed, step-by-step protocol for implementing a MAM workflow, from sample preparation to data analysis. The protocol can be adapted for automated liquid handling systems to enhance throughput and reproducibility [115].
Sample Preparation and Digestion
Objective: To reproducibly digest the protein biotherapeutic into peptides with 100% sequence coverage and minimal process-induced artifacts [112].
Key Reagents:
- SMART Digest Kit (or equivalent with immobilized trypsin): Used for fast, simple, and reproducible protein digestion with high sensitivity [112].
- Digestion Buffer: Typically a volatile buffer like ammonium bicarbonate.
- Reducing and Alkylating Agents: e.g., Dithiothreitol (DTT) and Iodoacetamide.
Procedure:
- Desalting/Buffer Exchange: Transfer the protein sample into a digestion-compatible buffer using spin filters or automated pipette-tip size-exclusion columns (< 15 minutes) [115].
- Reduction: Add DTT to a final concentration of 5-10 mM and incubate at 55°C for 30-45 minutes.
- Alkylation: Add iodoacetamide to a final concentration of 10-20 mM and incubate in the dark at room temperature for 30 minutes.
- Enzymatic Digestion: Add immobilized trypsin (from the SMART Digest Kit) at an enzyme-to-substrate ratio of ~1:10 to 1:50. Incubate at 37°C for approximately 3 hours with agitation. The use of immobilized enzyme allows for its simple removal post-digestion, preventing over-digestion and simplifying the sample [112] [115].
- Reaction Quenching & Peptide Recovery: Acidify the digest with formic or trifluoroacetic acid to stop the reaction. Centrifuge to separate the peptides (supernatant) from the immobilized enzyme.
Peptide Separation by UHPLC
Objective: To achieve high-resolution separation of the complex peptide mixture prior to mass spectrometry analysis.
Key Materials:
- UHPLC System: A system capable of ultra-high-pressure performance, such as the Vanquish UHPLC, for exceptional robustness, gradient precision, and reproducibility [112].
- UHPLC Column: A reversed-phase C18 column, e.g., Accucore or Hypersil GOLD, with sub-2 µm particles for sharp peaks and maximal peak capacity [112].
Chromatographic Conditions:
- Mobile Phase A: 0.1% Formic Acid in Water.
- Mobile Phase B: 0.1% Formic Acid in Acetonitrile.
- Column Temperature: 45-55°C.
- Flow Rate: 0.2 - 0.4 mL/min.
- Gradient: A shallow linear gradient (e.g., 2-40% B over 60-120 minutes) optimized for the specific peptide mixture to ensure optimal separation and ionization.
HRAM Mass Spectrometric Detection and Data Analysis
Objective: To accurately identify and quantify peptides and their modified forms.
Instrumentation:
- A High-Resolution Accurate Mass (HRAM) mass spectrometer (e.g., Orbitrap-based instrument) is used for its high resolution, mass accuracy, and sensitivity [112].
Data Acquisition:
- Acquire data in data-dependent acquisition (DDA) mode for library building, or data-independent acquisition (DIA) mode for routine quantification.
- Full MS resolution should be set to at least 60,000 for confident peptide identification.
Data Processing:
- Library Creation (for TAQ): Process LC-MS/MS data from characterized samples using specialized software to create a comprehensive peptide library containing the attributes of interest (e.g., deamidation, oxidation, glycans) [113].
- Targeted Attribute Quantitation (TAQ): For routine analysis, process the HRAM MS data against the established library to extract the relative or absolute abundance of each pre-defined attribute [113].
- New Peak Detection (NPD): Use software algorithms to compare the full LC-MS chromatogram of the test sample to a reference standard. Peaks that pass a set threshold and fall within defined m/z and retention time tolerances are flagged as "new" for further investigation [113].
Essential Research Reagent Solutions
The successful implementation of MAM is dependent on specific, high-quality reagents and instruments. The following table details key materials required for the core workflow.
Table 2: Key Research Reagent Solutions for MAM Workflow
| Component | Function in MAM Workflow | Example Product/Specification |
|---|---|---|
| Immobilized Protease | Enzymatically cleaves the protein into peptides for analysis; immobilized format ensures reproducibility and minimizes autolysis. | SMART Digest Kits (immobilized trypsin) [112] |
| UHPLC System | Provides high-resolution separation of peptides; critical for accurate identification and quantitation. | Vanquish UHPLC Systems [112] |
| UHPLC Column | The stationary phase for peptide separation; requires high peak efficiency and retention time stability. | Accucore or Hypersil GOLD C18 columns, 1.5-2 µm particles [112] |
| HRAM Mass Spectrometer | The detection system that provides accurate mass data for confident peptide identification and quantification. | Orbitrap-based Mass Spectrometers [112] |
| Reference Standard | A well-characterized lot of the biotherapeutic used as a benchmark for NPD and quantitative comparisons. | In-house developed and qualified standard [113] |
MAM Versus Conventional Methods
A primary driver for MAM adoption is its potential to replace several conventional, product-related impurity methods used in QC, thereby consolidating testing into a single, more informative assay.
Table 3: Capability of Standard Peptide-Based MAM to Monitor Product Variants Typically Analyzed by Conventional Methods
| Intact-Level Conventional Method | Attributes Monitored | Can Standard MAM (Trypsin) Monitor This? |
|---|---|---|
| Ion-Exchange Chromatography (IEC) or icIEF | Charge variants (e.g., Deamidation, C-terminal Lysine, Succinimide) | Yes [113] |
| HILIC Glycan Analysis | Glycosylation profile (e.g., Fab glycan, O-glycan) | Yes [113] |
| Reduced CE-SDS (R-CE-SDS) | Low Molecular Weight Fragments (e.g., Non-Glycosylated Heavy Chain) | Yes (depending on fragment sequence) [113] |
| Reversed-Phase HPLC | Oxidation (e.g., Methionine oxidation) | Yes [113] |
| Peptide Mapping by UV | Identity and sequence variant | Yes [113] |
| Size-Exclusion Chromatography (SEC) | High Molecular Weight Fragments (Aggregates) | No [113] |
| Non-Reduced CE-SDS (NR-CE-SDS) | Low Molecular Weight Fragments | Potential, but may require a non-reduced peptide map [113] |
The Multi-Attribute Method represents a significant leap forward in the analytical toolbox for biologics development. By integrating multiple quality assessments into a single, mass spectrometry-based workflow that provides both targeted quantitation and untargeted impurity detection, MAM delivers unparalleled depth of product understanding and operational efficiency. Its alignment with QbD principles and regulatory encouragement for novel technologies positions MAM as a cornerstone for future-proofing quality control strategies. As the industry continues to advance, the adoption of MAM from early development through to commercial quality control will be key to streamlining the path of complex biologics to patients.
Within the stringent framework of pharmaceutical development, the validation of analytical methods is a critical gatekeeper for ensuring the identity, strength, quality, purity, and potency of drug substances. Virtual method validation, powered by digital twin technology, represents a paradigm shift from traditional, purely empirical laboratory approaches. A digital twin is a virtual representation of a physical system that is continuously updated via bidirectional data flow, enabling real-time analysis, forecasting, and optimization of its real-world counterpart [116] [117]. In the context of analytical method lifecycle management, this means creating a high-fidelity computational model of the entire method—including instrumentation, chemical entities, and operational parameters.
Framed within a broader thesis on validating analytical methods for drug substance assays, this application note explores how digital twins leverage artificial intelligence (AI), mechanistic modeling, and real-time data to transform validation from a static, post-development checklist into a dynamic, science-based, and predictive process. This aligns with evolving regulatory paradigms, such as the enhanced ICH Q2(R2) and ICH Q14 guidelines, which encourage a more integrated and knowledge-rich approach to analytical procedure development and validation [17].
Applications in Analytical Method Validation
Digital twins are moving from a conceptual framework to a practical tool with tangible applications across the analytical method lifecycle. Their implementation enables a more profound understanding of method robustness and operational limits, fundamentally changing how scientists approach validation.
Table 1: Key Applications of Digital Twins in Analytical Method Validation
| Application Area | Description | Impact on Validation |
|---|---|---|
| In Silico Parameter Optimization | Using a digital twin to simulate the impact of chromatographic parameters (e.g., mobile phase pH, column temperature, gradient profile) on method performance [17] [118]. | Reduces extensive laboratory experimentation; identifies the optimal Method Operational Design Range (MODR) with greater speed and scientific rationale. |
| Robustness & Risk Prediction | The twin models the effects of deliberate, small variations in method parameters on critical quality attributes (CQAs) of the assay, such as resolution, peak asymmetry, and retention time [17]. | Provides a data-rich, predictive assessment of method robustness, strengthening the control strategy and mitigating the risk of method failure during routine use. |
| Virtual System Suitability | The digital twin, fed with real-time data from the physical instrument, can predict system suitability test outcomes under varying conditions and potential instrument drift [92]. | Ensures continuous method readiness and can forecast the need for preventive maintenance, reducing downtime and ensuring data integrity. |
| Method Transfer & Training | A validated digital twin serves as a virtual sandbox for simulating the method on different instrument models or at different laboratory sites, including the impact of operator-to-operator variability [119]. | De-risks and accelerates the method transfer process by identifying potential failure points virtually before physical transfer occurs. |
The core strength of a digital twin in these applications is its ability to function as a virtual testing ground. For instance, within a Quality-by-Design (QbD) framework, a digital twin can execute thousands of Design of Experiments (DoE) simulations in silico to map the method's design space with a level of granularity impractical to achieve through laboratory work alone [17]. This moves validation from merely verifying a set of predefined conditions to comprehensively understanding the method's behavior across a wide range of potential states.
Experimental Protocols for Virtual Validation
To translate the potential of digital twins into actionable science, researchers require structured experimental protocols. The following provides a detailed methodology for establishing and leveraging a digital twin for the virtual validation of a High-Performance Liquid Chromatography (HPLC) assay method for a drug substance.
Protocol 1: Development and Calibration of the HPLC Digital Twin
Aim: To create and calibrate a physics-based digital twin of an HPLC system and method that accurately mirrors the performance of its physical counterpart.
Materials:
- Physical HPLC system with UHPLC capability and data acquisition interface.
- Reference standard of the drug substance and known related compounds (impurities).
- Computational workstation with modeling software (e.g., MATLAB, Python with SciPy/Pandas, or specialized chromatographic modeling tools).
- Scientist's Toolkit: See Table 3 for key research reagent solutions and materials.
Table 2: Key Research Reagent Solutions and Materials
| Item | Function in the Protocol |
|---|---|
| Drug Substance Reference Standard | Serves as the primary entity for model calibration; used to determine accuracy, linearity, and precision of the digital twin. |
| Known Specified Impurities | Critical for validating the digital twin's ability to simulate specificity and resolution under stressed conditions. |
| Buffer Components & HPLC-Grade Solvents | Used to create the mobile phase; the digital twin must accurately model the impact of their properties (e.g., pH, ionic strength) on separation. |
| Chromatographic Data System (CDS) | The source of empirical data used to train, calibrate, and validate the digital twin model. |
Methodology:
- Data Acquisition for Model Training: Perform a structured DoE on the physical HPLC system. Systematically vary critical method parameters (CMPs) such as:
- Mobile phase pH (± 0.2 units)
- Column temperature (± 5°C)
- Gradient slope (± 5%)
- Flow rate (± 0.1 mL/min) For each experimental run, record the resulting chromatographic outcomes (Critical Method Attributes - CMAs), including retention times, peak area, peak width, and resolution between critical pairs.
Model Construction: Develop a mechanistic model of the HPLC process. This model should integrate fundamental equations of chromatography, such as the Van Deemter equation for plate height, and thermodynamic relationships for retention (e.g., linear solvent strength model for gradients).
Model Calibration & Validation: Use machine learning algorithms to calibrate the mechanistic model by fitting it to the empirical data collected in Step 1. A portion of the data (e.g., 80%) is used for training, while the remaining hold-out data (20%) is used to validate the predictive accuracy of the digital twin. The model is considered calibrated when predicted CMAs (e.g., retention time) fall within a pre-defined acceptance criterion (e.g., ±2%) of the observed values from the physical system.
The workflow below illustrates the continuous calibration process of the digital twin.
Protocol 2: Virtual Robustness Testing Using the Calibrated Digital Twin
Aim: To utilize the calibrated digital twin to perform a comprehensive, in-silico robustness study, predicting method performance over a wide range of operational conditions.
Methodology:
- Define Input Ranges: Establish the extreme ends of the operating ranges for each CMP to be tested, going beyond the expected normal operating ranges.
Execute Monte Carlo Simulations: Use the digital twin to run thousands of stochastic simulations. In each run, the twin will randomly select a value for each CMP within the defined extreme ranges and calculate the resulting CMAs.
Analyze Output and Map Design Space: Statistically analyze the simulation outputs to create a predictive model of method behavior. The results can be visualized as a multivariate design space, clearly delineating the region where the method meets all acceptance criteria (the MODR) from the regions where it fails.
Verify Critical Predictions: Select a limited set of the most critical or "edge-of-failure" conditions predicted by the digital twin and perform physical laboratory experiments to confirm the accuracy of the virtual predictions. This step is crucial for establishing regulatory confidence in the model.
The following diagram maps the logical relationship between the virtual and physical activities in a robustness study.
Technological and Regulatory Considerations
The successful implementation of digital twins for virtual validation hinges on addressing key technological and regulatory requirements. From a technological standpoint, the foundation is a multi-scale mechanistic model that is both sufficiently accurate for its intended use and fast enough to provide actionable insights [120]. These models must be integrated with the physical world through a digital thread—a secure, bidirectional data pipeline that feeds real-time and historical data from the analytical instrument (the physical twin) to the computational model (the digital twin) [117]. Furthermore, managing and processing the large volumes of data generated requires robust data governance frameworks adhering to ALCOA+ principles to ensure data integrity [17] [92].
Regulatorily, while guidelines like ICH Q2(R2) and Q14 provide a pathway for more flexible, model-based approaches, gaining regulatory acceptance requires demonstrating a digital twin's fitness-for-purpose [120]. This entails rigorous documentation of the model's development, a clear description of its boundaries and limitations, and extensive validation to show its predictive accuracy is comparable to traditional physical testing. The model's transparency and interpretability are also critical, potentially requiring techniques like SHapley Additive exPlanations (SHAP) to make the AI's decisions understandable to scientists and regulators alike [119].
Digital twin technology is poised to redefine the landscape of analytical method validation for drug substance assays. By creating a dynamic, virtual replica of the analytical method, it enables a more profound, predictive, and science-driven understanding of method performance throughout its entire lifecycle. The protocols outlined demonstrate a practical path toward virtual robustness testing and parameter optimization, offering significant gains in efficiency, cost reduction, and method robustness. For researchers and drug development professionals, embracing this technology requires building competencies in computational modeling, data science, and the evolving regulatory science that supports it. The future of analytical validation is virtual, and the journey begins with the strategic development and implementation of the digital twin.
Conclusion
The validation of analytical methods for drug substance assay is undergoing a profound transformation, driven by regulatory evolution like ICH Q2(R2)/Q14, technological advancements in AI and automation, and the growing complexity of therapeutic modalities. A successful strategy now hinges on integrating foundational principles with modern QbD and lifecycle approaches, proactively troubleshooting with robust data governance, and adopting comparative, risk-based paradigms for efficiency. Looking ahead, the industry's move towards real-time release testing, increased reliance on advanced analytics for biosimilar approval, and the embrace of digital tools will further cement analytical validation not just as a compliance necessity, but as a critical enabler for faster development of safer, more effective medicines. Embracing these trends will be imperative for biomedical research to meet the demands of personalized medicine and complex biologics.
References
- 1. The Critical Role of Validation in Pharmaceutical ... [https://www.gillsprocess.com/blog-1/2025/3/4/the-critical-role-of-validation-in-pharmaceutical-manufacturing]
- 2. ICH and FDA Guidelines for Analytical Method Validation [https://www.labmanager.com/ich-and-fda-guidelines-for-analytical-method-validation-34252]
- 3. The Critical Role of Analytical Services in Biopharma ... [https://www.skpharmteco.com/news-insights/blog/the-critical-role-of-analytical-services-in-biopharma-development/]
- 4. SOP - Method Validation Example-SAMPLE | PDF | Barcode [https://www.scribd.com/document/101603373/SOP-Method-Validation-Example-SAMPLE]
- 5. What You Need to Know About ICH Q14 and ICH Q2(R2), ... [https://premier-research.com/perspectives/what-you-need-to-know-about-ich-q14-and-ich-q2r2-part-1/]
- 6. Q2(R2) Validation of Analytical Procedures March 2024 [https://www.fda.gov/regulatory-information/search-fda-guidance-documents/q2r2-validation-analytical-procedures]
- 7. ICH Q2(R2) Validation of analytical procedures [https://www.ema.europa.eu/en/ich-q2r2-validation-analytical-procedures-scientific-guideline]
- 8. ICH Q14 Analytical procedure development - Scientific guideline [https://www.ema.europa.eu/en/ich-q14-analytical-procedure-development-scientific-guideline]
- 9. ICH Q2 and ICH Q14 revisions clarify analytical methods ... [https://www.pharmalex.com/thought-leadership/blogs/ich-q2-and-ich-q14-revisions-clarify-analytical-methods-for-biologics/]
- 10. ICH publishes Training Materials on Q2(R2) and Q14 [https://www.gmp-compliance.org/gmp-news/ich-publishes-training-materials-on-q2r2-and-q14]
- 11. Analytical Method Validation: Back to Basics, Part II [https://www.chromatographyonline.com/view/analytical-method-validation-back-basics-part-ii]
- 12. Analytical Method Validation: Key Parameters for ... [https://www.linkedin.com/posts/tonmoy-sarker-tomal_analytical-method-validation-updates-2025-activity-7375894681567760384-8JR5]
- 13. Understanding the Four Types of Analytical Method ... [https://www.oxford-analytical.co.uk/understanding-the-four-types-of-analytical-method-validation/]
- 14. The 6 Key Aspects of Analytical Method Validation [https://www.elementlabsolutions.com/uk/chromatography-blog/post/6-key-aspects-of-analytical-method-validation]
- 15. ALCOA+ Principles: A Guide to GxP Data Integrity [https://intuitionlabs.ai/articles/alcoa-plus-gxp-data-integrity]
- 16. The ALCOA++ Principles for Data Integrity in Clinical Trials [https://www.quanticate.com/blog/alcoa-principles]
- 17. 2025 Trends In Pharmaceutical Analytical Methods ... [https://agnopharma.com/blog/trends-in-pharmaceutical-analytical-methods-development-validation/]
- 18. ALCOA+ Principles & Data Integrity In Pharma [https://apotechconsulting.com/alcoa-principles-data-integrity/]
- 19. GMP ALCOA: The Complete 2025 Guide to Audit-Ready ... [https://www.linkedin.com/pulse/gmp-alcoa-complete-2025-guide-audit-ready-data-integrity-pharmuni-sevnf]
- 20. ALCOA, ALCOA+ and ALCOA++ Principles | Ensuring Data ... [https://www.pharmaguideline.com/2018/12/alcoa-to-alcoa-plus-for-data-integrity.html]
- 21. Data Integrity in Pharmaceutical Compliance: A 2025 Guide [https://www.laboratoriosrubio.com/en/data-integrity-pharmaceutical-compliance/]
- 22. ALCOA Data-Integrity Principles: A Complete 2025 Guide [https://redica.com/data-integrity-and-alcoa/]
- 23. Data Integrity Guidelines: What You Must Do Now - [https://pharmuni.com/2025/10/17/data-integrity-guidelines-what-you-must-do-now/]
- 24. Data Integrity in Regulatory Submissions: Best Practices for ... [https://aayutechnologies.com/blog/data-integrity-in-regulatory-submissions/]
- 25. FDA Releases Guidance on Analytical Procedures [https://www.biopharminternational.com/view/fda-releases-guidance-on-analytical-procedures]
- 26. USP <1225> Revised: Aligning Compendial Validation with ... [https://investigationsquality.com/2025/11/13/usp-1225-revised-aligning-compendial-validation-with-ich-q2r2-and-q14s-lifecycle-vision/]
- 27. Streamlining Post-Approval Changes Industry Insights on ... [https://ispe.org/pharmaceutical-engineering/september-october-2025/streamlining-post-approval-changes-industry]
- 28. Aspects and Implementation of Pharmaceutical Quality by ... [https://pmc.ncbi.nlm.nih.gov/articles/PMC12114689/]
- 29. Rethinking Pharmaceutical Industry with Quality by Design [https://www.pharmaexcipients.com/news/rethinking-pharmaceutical-industry-qbd/]
- 30. Quality by Design for Analytical Methods: Implications ... [https://www.pharmtech.com/view/quality-design-analytical-methods-implications-method-validation-and-transfer]
- 31. AQbD-novel strategy for analytical methods [https://fjps.springeropen.com/articles/10.1186/s43094-024-00706-1]
- 32. QbD for biopharmaceutical product lifecycle management [https://www.europeanpharmaceuticalreview.com/article/252712/qbd-for-biopharmaceutical-product-lifecycle-management/]
- 33. Quality by design | European Medicines Agency (EMA) [https://www.ema.europa.eu/en/human-regulatory-overview/research-development/quality-design]
- 34. Analytical Method Development Based on Design of ... [https://www.americanpharmaceuticalreview.com/Featured-Articles/590816-Analytical-Method-Development-Based-on-Design-of-Experiments/]
- 35. Design of Experiments for Analytical Method Development ... [https://www.biopharminternational.com/view/design-experiments-analytical-method-development-and-validation]
- 36. Introduction to hyphenated techniques and their ... [https://pmc.ncbi.nlm.nih.gov/articles/PMC3658024/]
- 37. Hyphenated Techniques: LC-MS, GC-MS, and ICP-MS [https://www.labmanager.com/hyphenated-techniques-lc-ms-gc-ms-and-icp-ms-34245]
- 38. Ultrahigh-Pressure LC in Pharmaceutical Analysis: Performance and... [https://www.chromatographyonline.com/view/ultrahigh-pressure-lc-pharmaceutical-analysis-performance-and-practical-issues]
- 39. Development and validation of a LC-HRMS method for the ... [https://pubmed.ncbi.nlm.nih.gov/33434601/]
- 40. Development and Validation of a UHPLC-MS/MS Method for ... [https://pmc.ncbi.nlm.nih.gov/articles/PMC12255265/]
- 41. Method Validation Guidelines [https://www.biopharminternational.com/view/method-validation-guidelines]
- 42. Method Validation Essentials, Limit of Blank ... [https://www.biopharminternational.com/view/method-validation-essentials-limit-blank-limit-detection-and-limit-quantitation]
- 43. Development and validation of a green/blue UHPLC-MS ... [https://www.nature.com/articles/s41598-025-15614-4]
- 44. How Analytical Method Validation Ensures Product Quality [https://www.pharmsky.com.au/how-analytical-method-validation-ensures-product-quality/]
- 45. The Benefits of Automation in High Throughput Screening [https://dispendix.com/blog/benefits-of-automation-in-high-throughput-screening]
- 46. A robotic protocol for high-throughput processing of ... [https://pmc.ncbi.nlm.nih.gov/articles/PMC5534325/]
- 47. Validation of Analytical Methods for Biomarkers Employed ... [https://pmc.ncbi.nlm.nih.gov/articles/PMC2744124/]
- 48. A Step-by-Step Guide to Analytical Method Development ... [https://emerypharma.com/blog/a-step-by-step-guide-to-analytical-method-development-and-validation/]
- 49. Applications of machine learning in drug discovery and ... [https://pmc.ncbi.nlm.nih.gov/articles/PMC6552674/]
- 50. How Machine Learning is Recoding the Future of Drug ... [https://www.drugpatentwatch.com/blog/the-application-of-machine-learning-in-drug-discovery-revolutionizing-pharmaceutical-research/?srsltid=AfmBOop9pAX8jFD1t1kt8jDyI11wi03BT8fuAf84HXaPDMazK-YgG4Av]
- 51. Progress of AI-Driven Drug–Target Interaction Prediction and ... [https://pmc.ncbi.nlm.nih.gov/articles/PMC12563295/]
- 52. Machine learning driven acceleration of biopharmaceutical ... [https://www.sciencedirect.com/science/article/pii/S2001037025004283]
- 53. Unlocking the Next Frontier in AI-Driven Drug Discovery [https://www.pharmexec.com/view/unlocking-the-next-frontier-in-ai-driven-drug-discovery]
- 54. A New Solid-Phase Extraction Method for Determination of ... [https://pmc.ncbi.nlm.nih.gov/articles/PMC6614261/]
- 55. The Hidden Risks in Analytical Method Validation - [https://pharmuni.com/2025/05/16/the-hidden-risks-in-analytical-method-validation/]
- 56. Beyond Accuracy, Precision and TAE [https://pubmed.ncbi.nlm.nih.gov/40830303/]
- 57. Common Pitfalls in CCIT Method Validation [https://www.pti-ccit.com/about-pti/blogs/Common-Pitfalls-in-CCIT-Method-Validation-And-How-to-Avoid-Them]
- 58. How to be prepared for Pharmaceutical Validation in 2025 [https://www.gillsprocess.com/blog-1/2024/12/11/how-to-be-prepared-for-pharmaceutical-validation-in-2025]
- 59. 4 Common Validation Pitfalls You Can't Afford to Ignore [https://www.linkedin.com/pulse/avoid-4-pitfalls-when-you-know-your-validation-lacking-roman--wfzbe]
- 60. SoftMax Pro Software: User-Friendly Software in Microplate Data Analysis [https://www.moleculardevices.com/lab-notes/microplate-readers/importance-of-softmax-pro-software-in-microplate-data-analysis]
- 61. Best AI-driven Drug Discovery LIMS Software in 2025: Complete Buyer’s Guide | Trends [https://www.scispot.com/blog/best-ai-driven-drug-discovery-lims-software]
- 62. Visualizing Quantitative Data: Best Practices [https://ajelix.com/data/visualizing-quantitative-data-best-practices/]
- 63. Visualizing Quantitative Data: Best Experience [https://powerdrill.ai/blog/visualizing-quantitative-data-best-experience]
- 64. SPIRIT 2025 statement: Updated guideline for protocols of ... [https://pmc.ncbi.nlm.nih.gov/articles/PMC12037212/]
- 65. 5 expert predictions cover synthetic data, hybrid trials and more [https://www.drugdiscoverytrends.com/drug-development-in-2025-5-expert-predictions-cover-synthetic-data-hybrid-trials-and-more/]
- 66. Selecting Bioanalytical Assays for FDA Approved Clinical ... [https://www.marinbio.com/company/selecting-bioanalytical-assays-fda-clinical-trials-commercialization/]
- 67. A Phase-Appropriate Approach For Assay Validation In ... [https://www.cellandgene.com/doc/a-phase-appropriate-approach-for-assay-validation-in-cell-gene-therapies-0001]
- 68. Validation Challenges for Advanced Therapies [https://www.bioprocessintl.com/cell-therapies/analytical-method-validation-challenges-for-advanced-therapies-using-gene-therapies-as-an-example]
- 69. The Pitfalls and Promise of Cell and Gene Therapy ... [https://globalforum.diaglobal.org/issue/november-2025/the-pitfalls-and-promise-of-cell-and-gene-therapy-development-a-time-for-concerted-action/]
- 70. Cellular & Gene Therapy Guidances [https://www.fda.gov/vaccines-blood-biologics/biologics-guidances/cellular-gene-therapy-guidances]
- 71. Countdown to Compliance: The August 2025 Deadline for NDSRI Testing Looms Over Pharmaceutical Industry - Emery Pharma [https://emerypharma.com/blog/countdown-to-compliance-the-august-2025-deadline-for-ndsri-testing-looms-over-pharmaceutical-industry/]
- 72. 2025 and Beyond: Another Look at Upcoming NDSRI Regulations | SK pharmteco [https://www.skpharmteco.com/news-insights/blog/2025-and-beyond-another-look-at-upcoming-ndsri-regulations/]
- 73. 2025 and Beyond: A Look at Upcoming NDSRI Regulations | SK pharmteco [https://www.skpharmteco.com/news-insights/blog/2025-and-beyond-a-look-at-upcoming-ndsri-regulations/]
- 74. CDER Nitrosamine Impurity Acceptable Intake Limits [https://www.fda.gov/regulatory-information/search-fda-guidance-documents/cder-nitrosamine-impurity-acceptable-intake-limits]
- 75. Risk assessment and management strategy of two new ... [https://www.sciencedirect.com/science/article/abs/pii/S0022354925000346]
- 76. Impurity profiling and HPLC methods for drug quality ... [https://amsbiopharma.com/drug-impurity-profiling-analysis-methods/]
- 77. Pharmaceutical Analytical Impurities [https://www.usp.org/impurities/pharmaceutical-analytical-impurities]
- 78. Proactive Success: Outsourcing Analytical Testing Services [https://lgmpharma.com/blog/4-tips-for-outsourcing-your-analytical-testing/]
- 79. Pharmaceutical Outsourcing Analytical Testing in the Real ... [https://www.linkedin.com/pulse/pharmaceutical-outsourcing-analytical-testing-wr3ie]
- 80. Outsourcing in Pharma: A Comprehensive Guide to ... [https://www.nsf.org/knowledge-library/outsourcing-pharma-comprehensive-guide-strategic-advantages-considerations]
- 81. Forecasting Lab Budgets for 2025: Spending Shifts and ... [https://www.labmanager.com/forecasting-lab-budgets-for-2025-spending-shifts-and-outsourcing-trends-33215]
- 82. 2025 Top Consulting Partnership Compatibility Metrics Data [https://softwareoasis.com/partnership-compatibility-metrics-data/]
- 83. Outsourcing Analytical Laboratory Services [https://lgmpharma.com/blog/outsourcing-analytical-laboratory-services/]
- 84. What is a Partnership Tracker: A Comprehensive Guide ... [https://journeybee.io/resources/what-is-a-partnership-tracker-a-comprehensive-guide-2025]
- 85. Top 10 Partner Relationship Management Tools 2025 [https://www.agilegrowthlabs.com/blog/top-10-partner-relationship-management-tools-2025/]
- 86. Continuous Process Verification (CPV) Methodology and Tool ... [https://investigationsquality.com/2025/03/30/continuous-process-verification-cpv-methodology-and-tool-selection-a-framework-guided-by-fda-process-validation/]
- 87. Continued Process Verification Is Critical in ... [https://www.pharmtech.com/view/continued-process-verification-is-critical-in-pharmaceutical-manufacturing]
- 88. Continued Process Verification to Improve Product Quality, ... [https://www.sigmaaldrich.com/US/en/technical-documents/technical-article/pharmaceutical-and-biopharmaceutical-manufacturing/monoclonal-antibody-manufacturing/continued-process-verification?srsltid=AfmBOopE_occbQbOrxiHOhcqfmfPi8LRWjZGx-AwVoP2fHiicBjzi8km]
- 89. Continued Process Verification in Stages 1–3 [https://ispe.org/pharmaceutical-engineering/july-august-2020/continued-process-verification-stages-1-3]
- 90. MVDA Models: Continued Process Verification [https://www.bioprocessintl.com/process-monitoring-and-controls/multivariate-data-driven-modeling-for-continued-process-verification]
- 91. Validation Strategy in Pharma 4.0: Comparing Modern and ... [https://www.avslifesciences.com/blog-post/validation-strategy-in-pharma-4-0-comparing-modern-and-traditional-methods]
- 92. Leading Pharmaceutical Validation Trends for 2025 [https://www.ellab.com/blog/transforming-the-industry-landscape-leading-pharmaceutical-validation-trends-for-2025/]
- 93. Analytical Method Development for Sterile Products [https://pci.com/drug-development-manufacturing-services/analytical-services/sterile-analytical-method-development/]
- 94. FDA's 2025 Guidance On CSA: What Manufacturers Need ... [https://gmpinsiders.com/fda-2025-guidance-csa/]
- 95. GAMP 5 Categories Explained: Software, Risk & Examples [https://intuitionlabs.ai/articles/gamp-5-categories-explained]
- 96. Risk-Based QC Plans: Clinical Chemistry Journal Club ... [https://www.westgard.com/essays/risk-management/risk-plans-hba1c.html]
- 97. FDA Moves to Accelerate Biosimilar Development and ... [https://www.fda.gov/news-events/press-announcements/fda-moves-accelerate-biosimilar-development-and-lower-drug-costs]
- 98. FDA Proposes To Eliminate Comparative Clinical ... [https://www.arnoldporter.com/en/perspectives/advisories/2025/11/fda-proposes-to-eliminate-biosimilar-comparative-studies]
- 99. New FDA Guidance Aims to Simplify the Biosimilar ... [https://www.bigmoleculewatch.com/2025/11/14/new-fda-guidance-aims-to-simplify-the-biosimilar-approval-process/]
- 100. Understanding the Role of Comparative Clinical Studies in the ... [https://pmc.ncbi.nlm.nih.gov/articles/PMC7106981/]
- 101. FDA Moves to Streamline Approach to Biosimilars [https://www.lw.com/en/insights/fda-moves-to-streamline-approach-to-biosimilars]
- 102. Assessing the need for comparative clinical trials in ... [https://www.parexel.com/insights/blog/assessing-the-need-for-comparative-clinical-trials-in-biosimilar-development-programs]
- 103. Analytical Methodology: Validation, Verification, or ... [https://vicihealthsciences.com/analytical-methodology-validation-verification-qualification/]
- 104. Real-Time Release Testing in Pharmaceutical Manufacturing [https://www.news-medical.net/life-sciences/Real-Time-Release-Testing-in-Pharmaceutical-Manufacturing.aspx]
- 105. Process Analytical Technology (PAT) Model Lifecycle ... [https://www.spectroscopyonline.com/view/process-analytical-technology-pat-model-lifecycle-management]
- 106. Process Analytical Technology Tools for Monitoring ... [https://pmc.ncbi.nlm.nih.gov/articles/PMC8234957/]
- 107. Real time release testing - Scientific guideline [https://www.ema.europa.eu/en/real-time-release-testing-scientific-guideline]
- 108. Eudralex Volume 3 Guideline on Real Time Release ... [https://www.gmp-compliance.org/guidelines/gmp-guideline/eudralex-volume-3-guideline-on-real-time-release-testing-formerly-guideline-on-parametric-release]
- 109. Assay Development and Method Validation Essentials [https://www.biopharminternational.com/view/assay-development-and-method-validation-essentials]
- 110. Enhancing manufacturing with process analytical ... [https://www.bruker.com/it/news-and-events/webinars/2025/enhancing-manufacturing-with-process-analytical-technology-pat-in-2025.html]
- 111. The first Implementation of RTRT/PAT for a BioTech Drug ... [https://biopharmawebinars.com/webinars/crossing-the-finishing-line-the-first-implementation-of-rtrt-pat-for-a-biotech-drug-product-at-roche/]
- 112. Biopharmaceutical Multi-Attribute Method [https://www.thermofisher.com/us/en/home/industrial/pharma-biopharma/pharma-biopharma-learning-center/biopharmaceutical-characterization-information/multi-attribute-method.html]
- 113. Mass spectrometry-based multi-attribute method in protein ... [https://pmc.ncbi.nlm.nih.gov/articles/PMC10114992/]
- 114. Multi-attribute monitoring applications in biopharmaceutical ... [https://www.sciencedirect.com/science/article/pii/S2772391724000537]
- 115. An Improved Protocol for Automated Multi-Attribute Method ... [https://www.evotec.com/sciencepool/an-improved-protocol-for-automated-multi-attribute-method-sample-preparation]
- 116. A Technological Review of Digital Twins and Artificial ... [https://pmc.ncbi.nlm.nih.gov/articles/PMC12294331/]
- 117. Digital Twins, Virtual Devices, and Augmentations for Self- ... [https://www.mdpi.com/2076-3417/12/1/349]
- 118. Digital Twins for Drug Design: Importance, Applications ... [http://www.orientjchem.org/vol41no6/digital-twins-for-drug-design-importance-applications-and-future-perspectives/]
- 119. Enhancing randomized clinical trials with digital twins [https://www.nature.com/articles/s41540-025-00592-0]
- 120. Drug Development Digital Twins for Drug Discovery ... [https://pmc.ncbi.nlm.nih.gov/articles/PMC9351294/]